Weak Lensing Measurement of Filamentary Structure with the SDSS BOSS and Subaru Hyper Suprime-Cam Data
Hiroto Kondo, Hironao Miyatake, Masato Shirasaki, Naoshi Sugiyama,, Atsushi J. Nishizawa

TL;DR
This study detects weak gravitational lensing signals from cosmic filaments between galaxy pairs at redshift 0.55 using Subaru HSC data, confirming theoretical models and demonstrating the survey's high statistical power.
Contribution
First detection of filament lensing at this redshift with high significance, using deep HSC data and mock simulations to validate results.
Findings
Detected filament lensing signal at 3.9σ significance
Intrinsic shape noise no longer limits measurement accuracy
Results consistent with the 'thick' filament model
Abstract
We report the weak lensing measurement of filaments between Sloan Digital Sky Survey (SDSS) III/Baryon Oscillation Spectroscopic Survey (BOSS) CMASS galaxy pairs at , using the Subaru Hyper Suprime-Cam (HSC) first-year galaxy shape catalogue. Despite of the small overlap of deg between these surveys we detect the filament lensing signal at 3.9 significance, which is the highest signal-to-noise lensing measurement of filaments between galaxy-scale halos at this redshift range. We derive a theoretical prediction and covariance using mock catalogues based on full-sky ray-tracing simulations. We find that the intrinsic scatter of filament properties and the fluctuations in large scale structure along the line-of-sight are the primary component of the covariance and the intrinsic shape noise from source galaxies no longer limits our lensing measurement. This fact…
Click any figure to enlarge with its caption.
 Figure 1
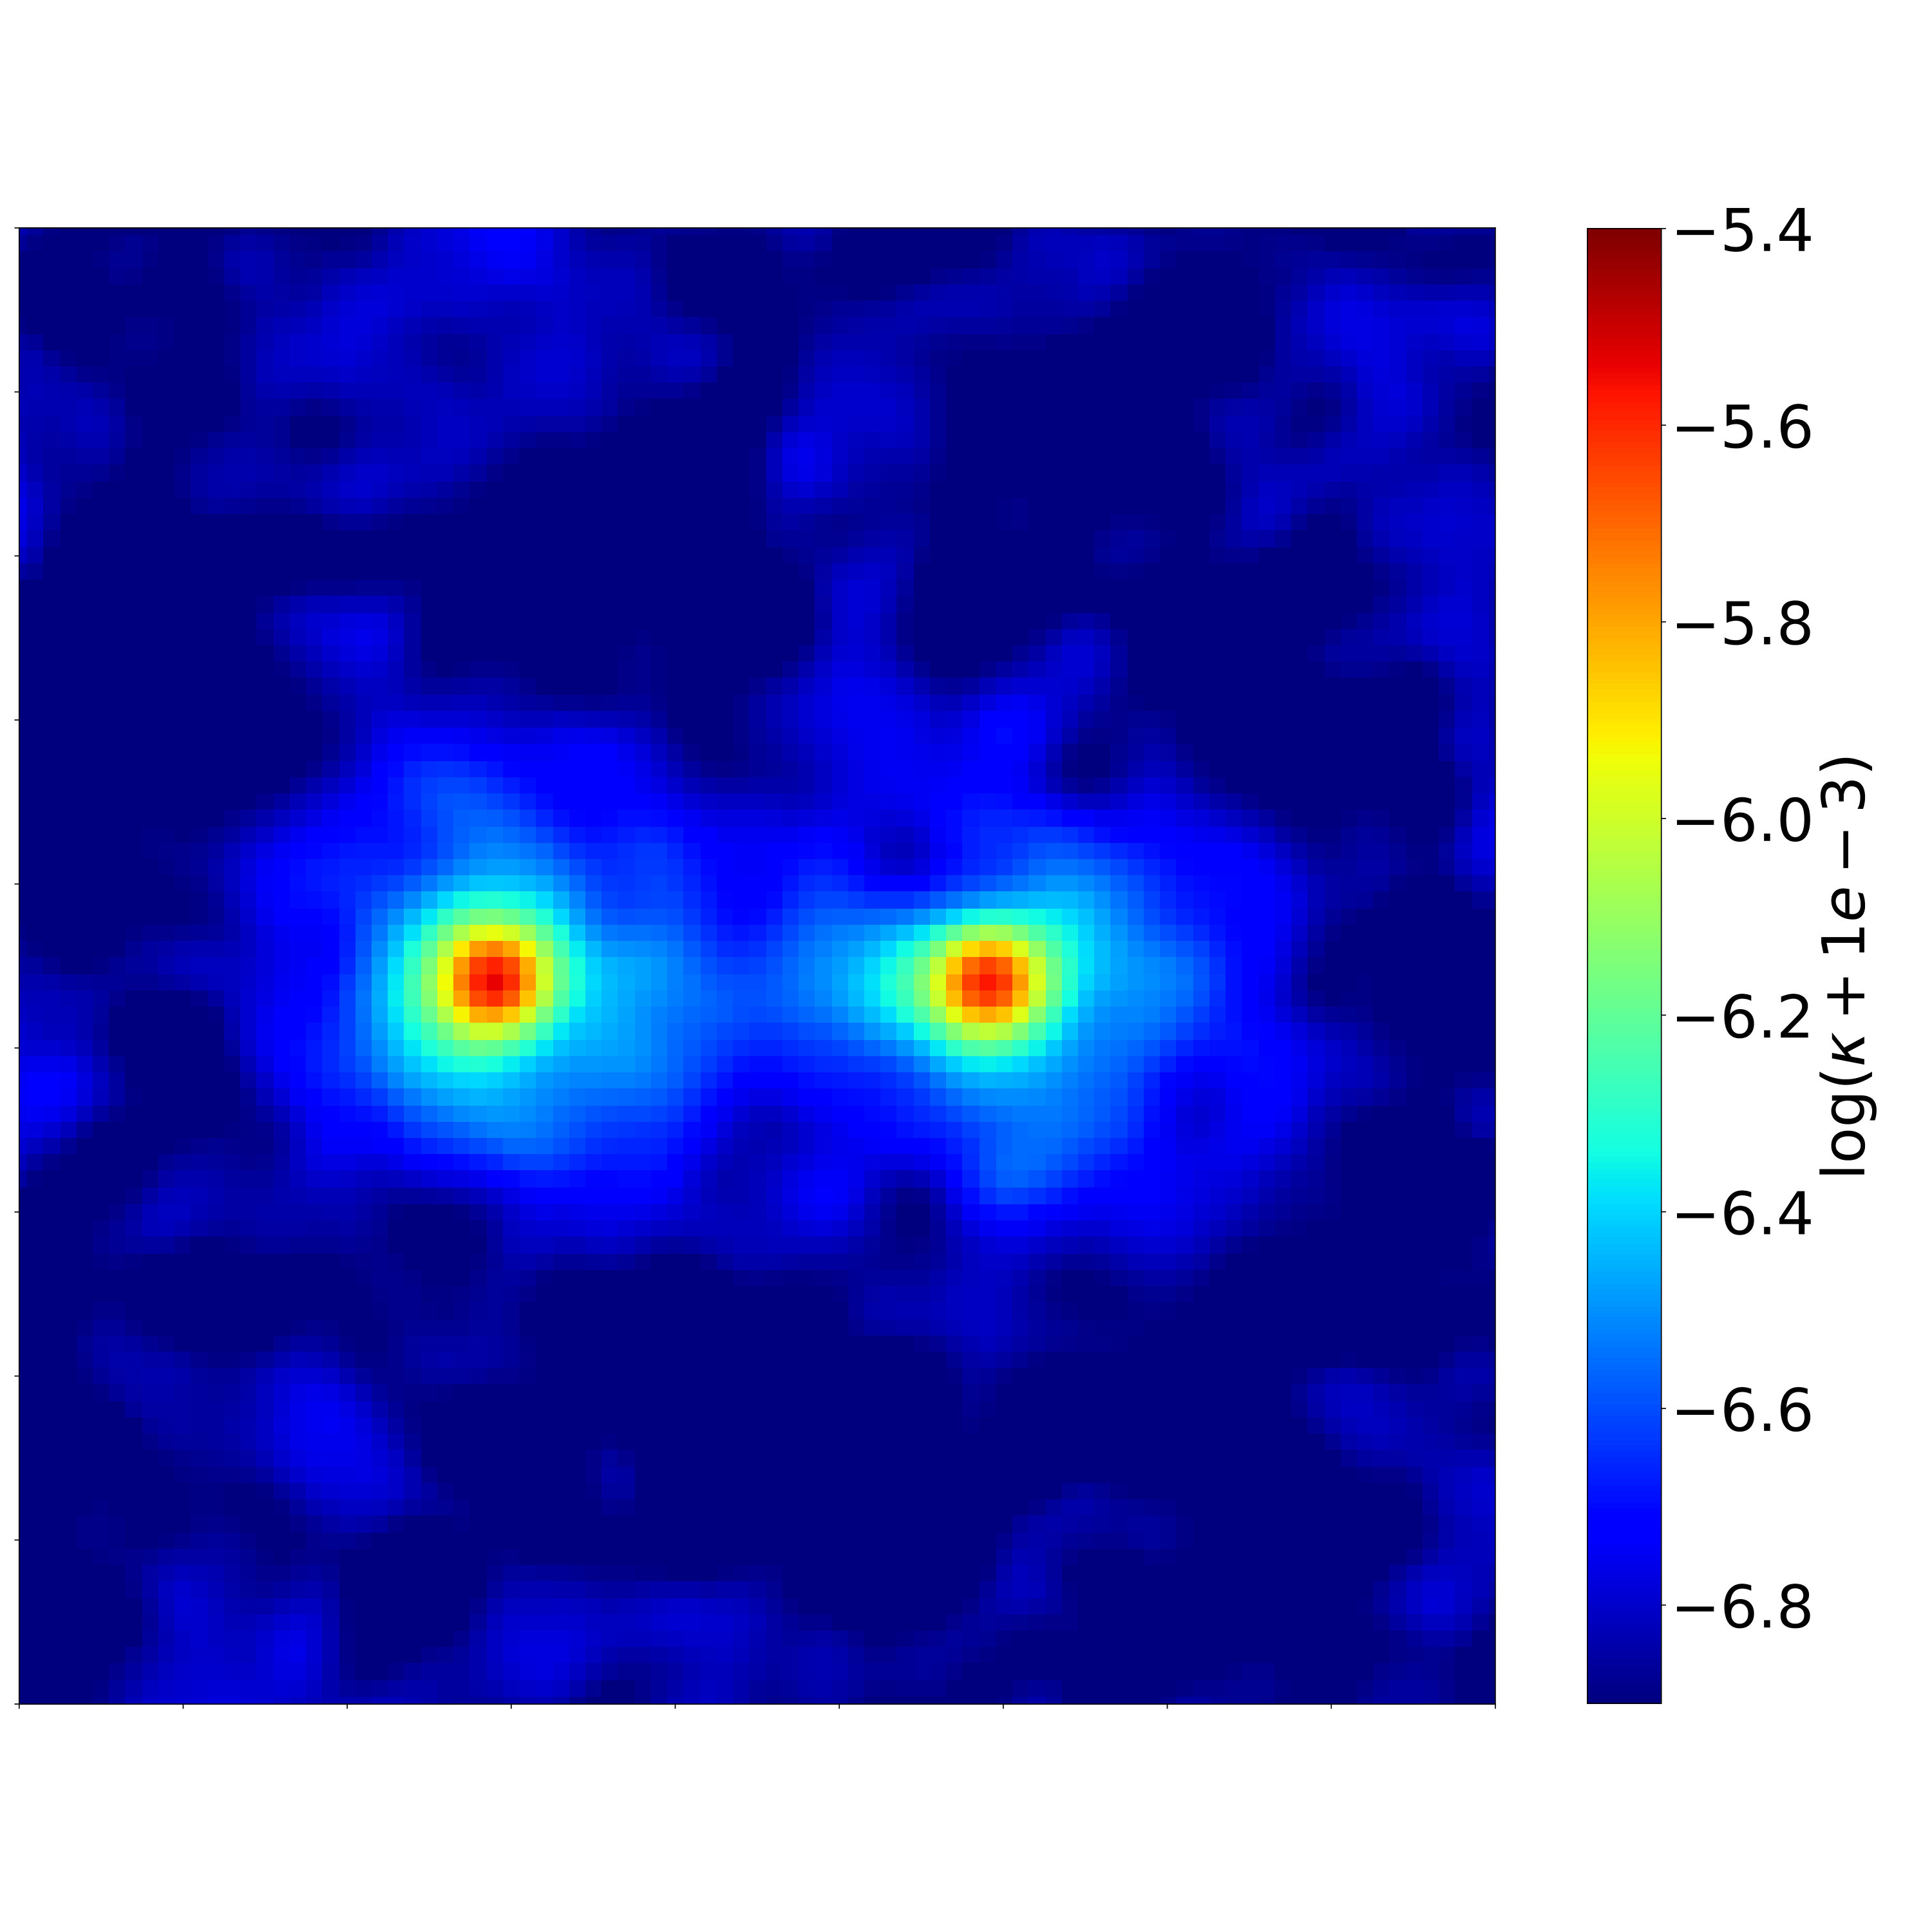 Figure 2
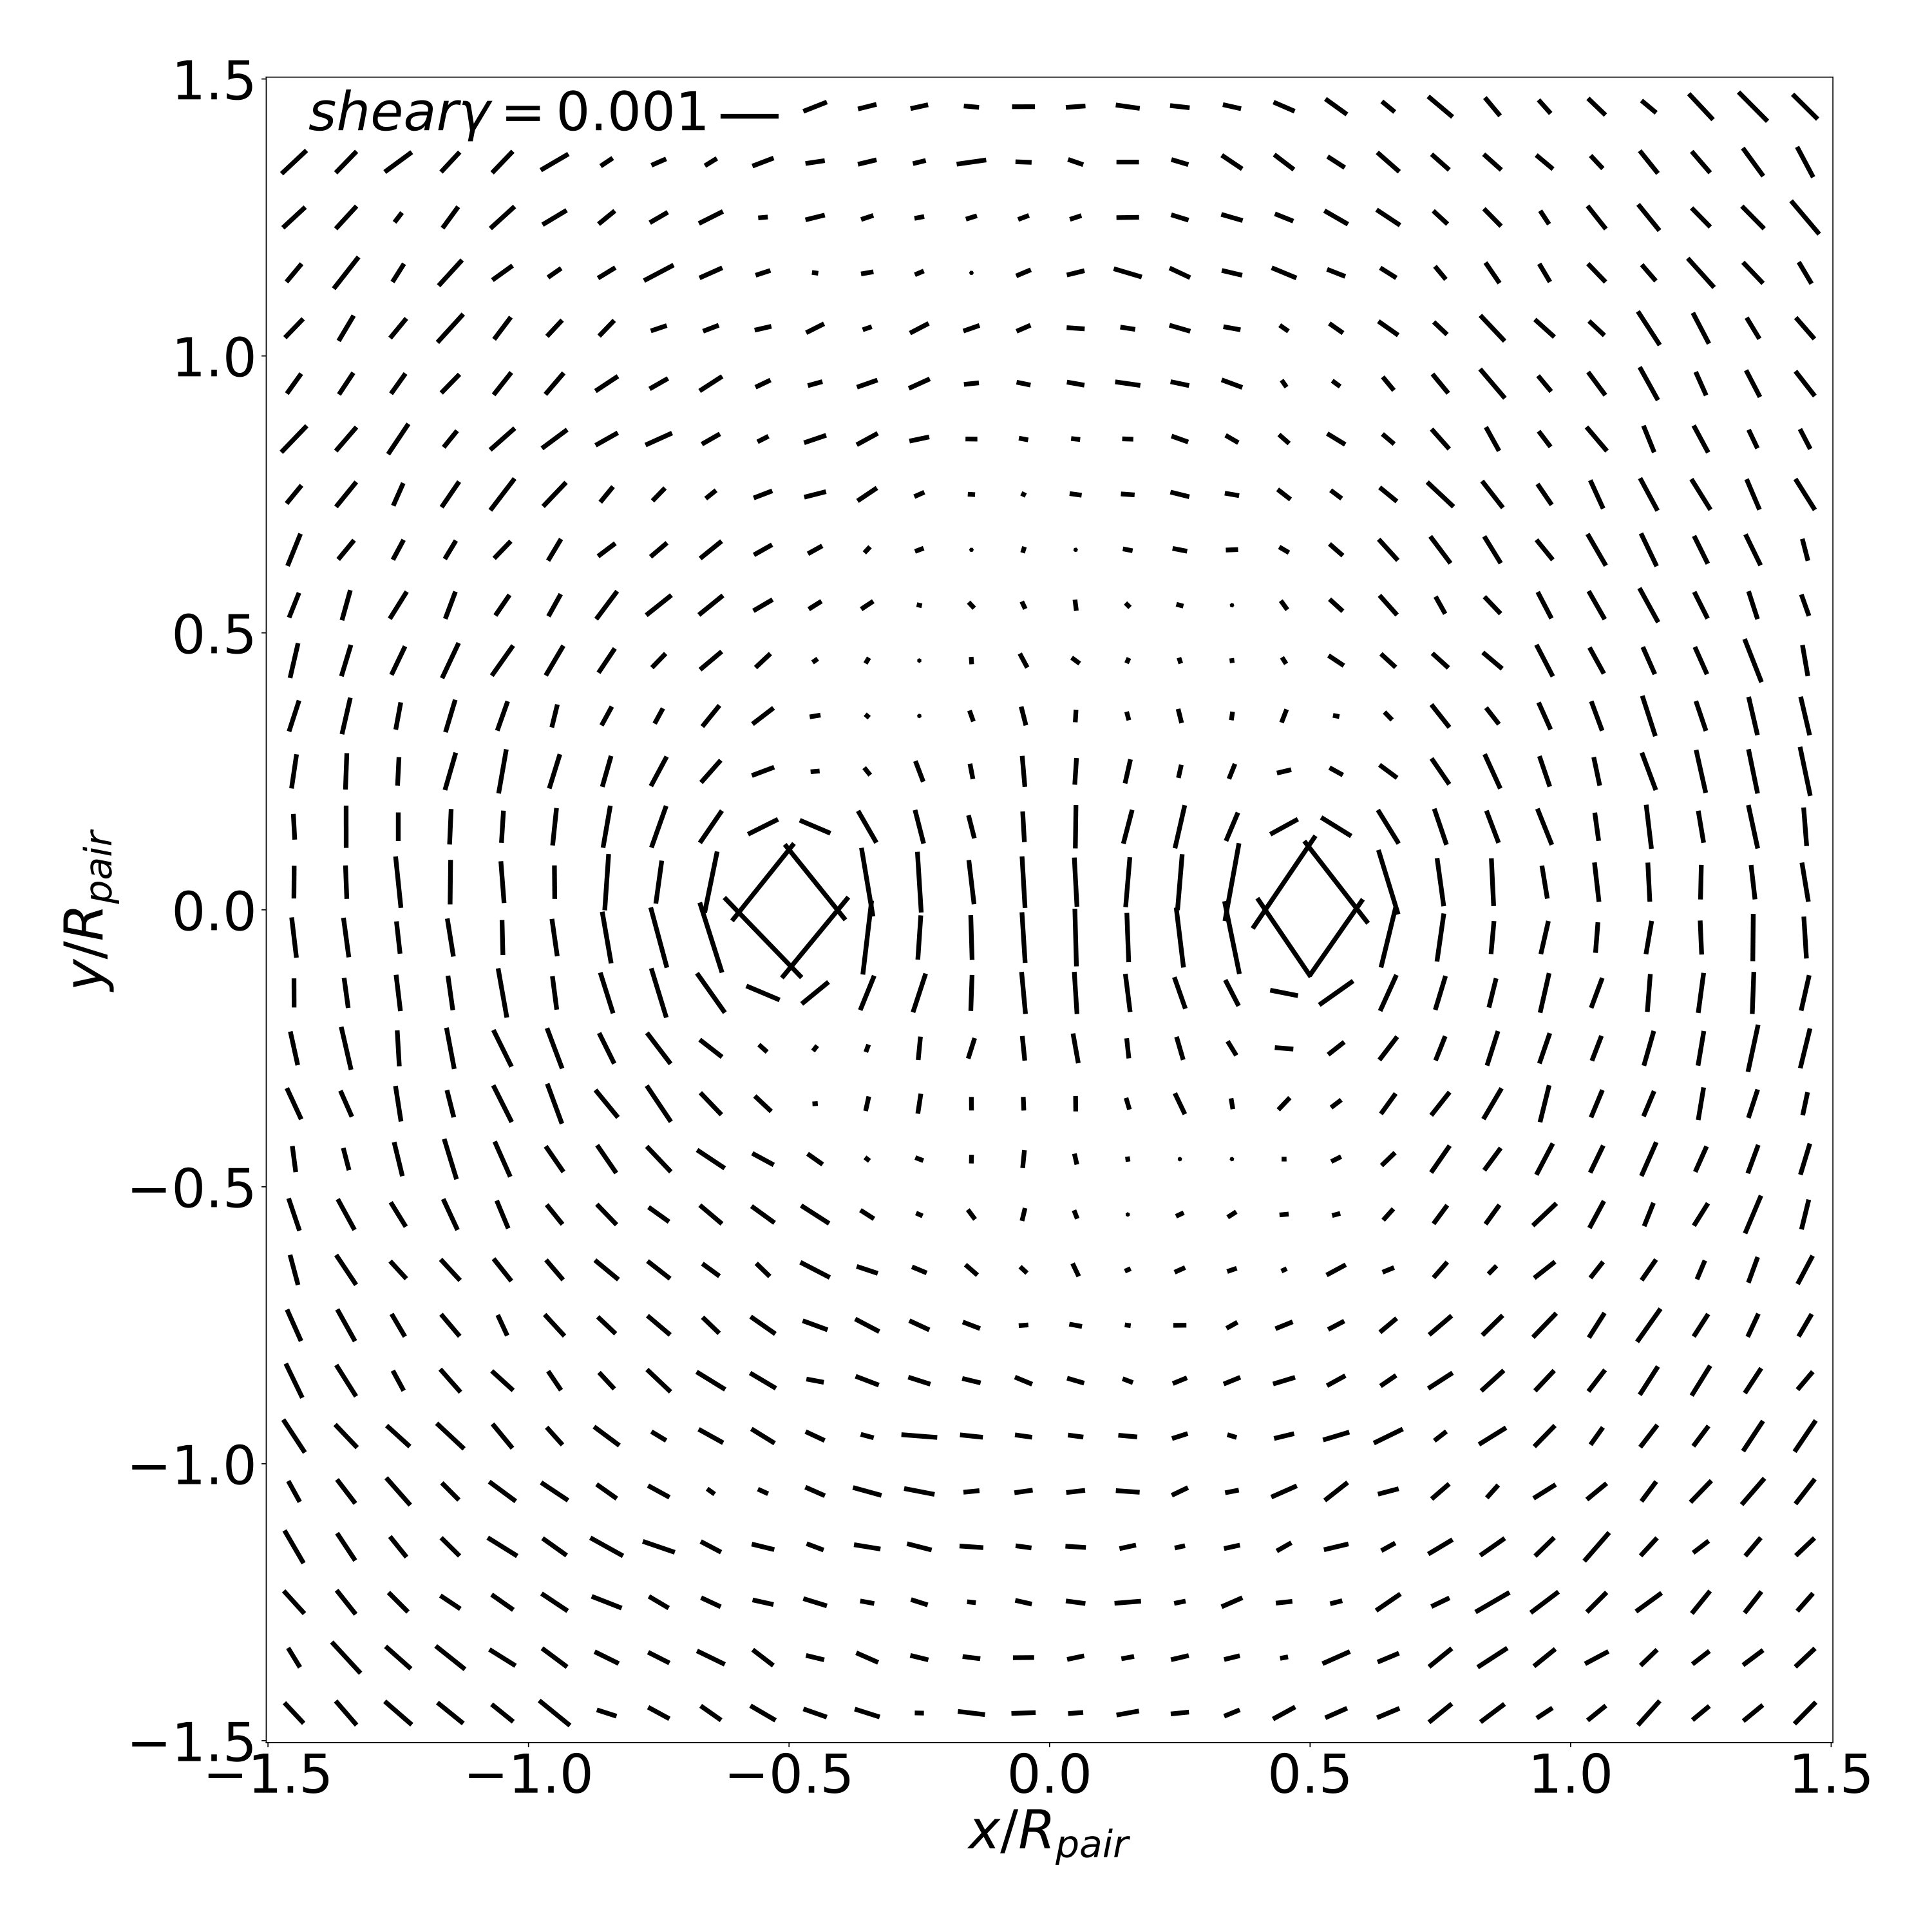 Figure 3
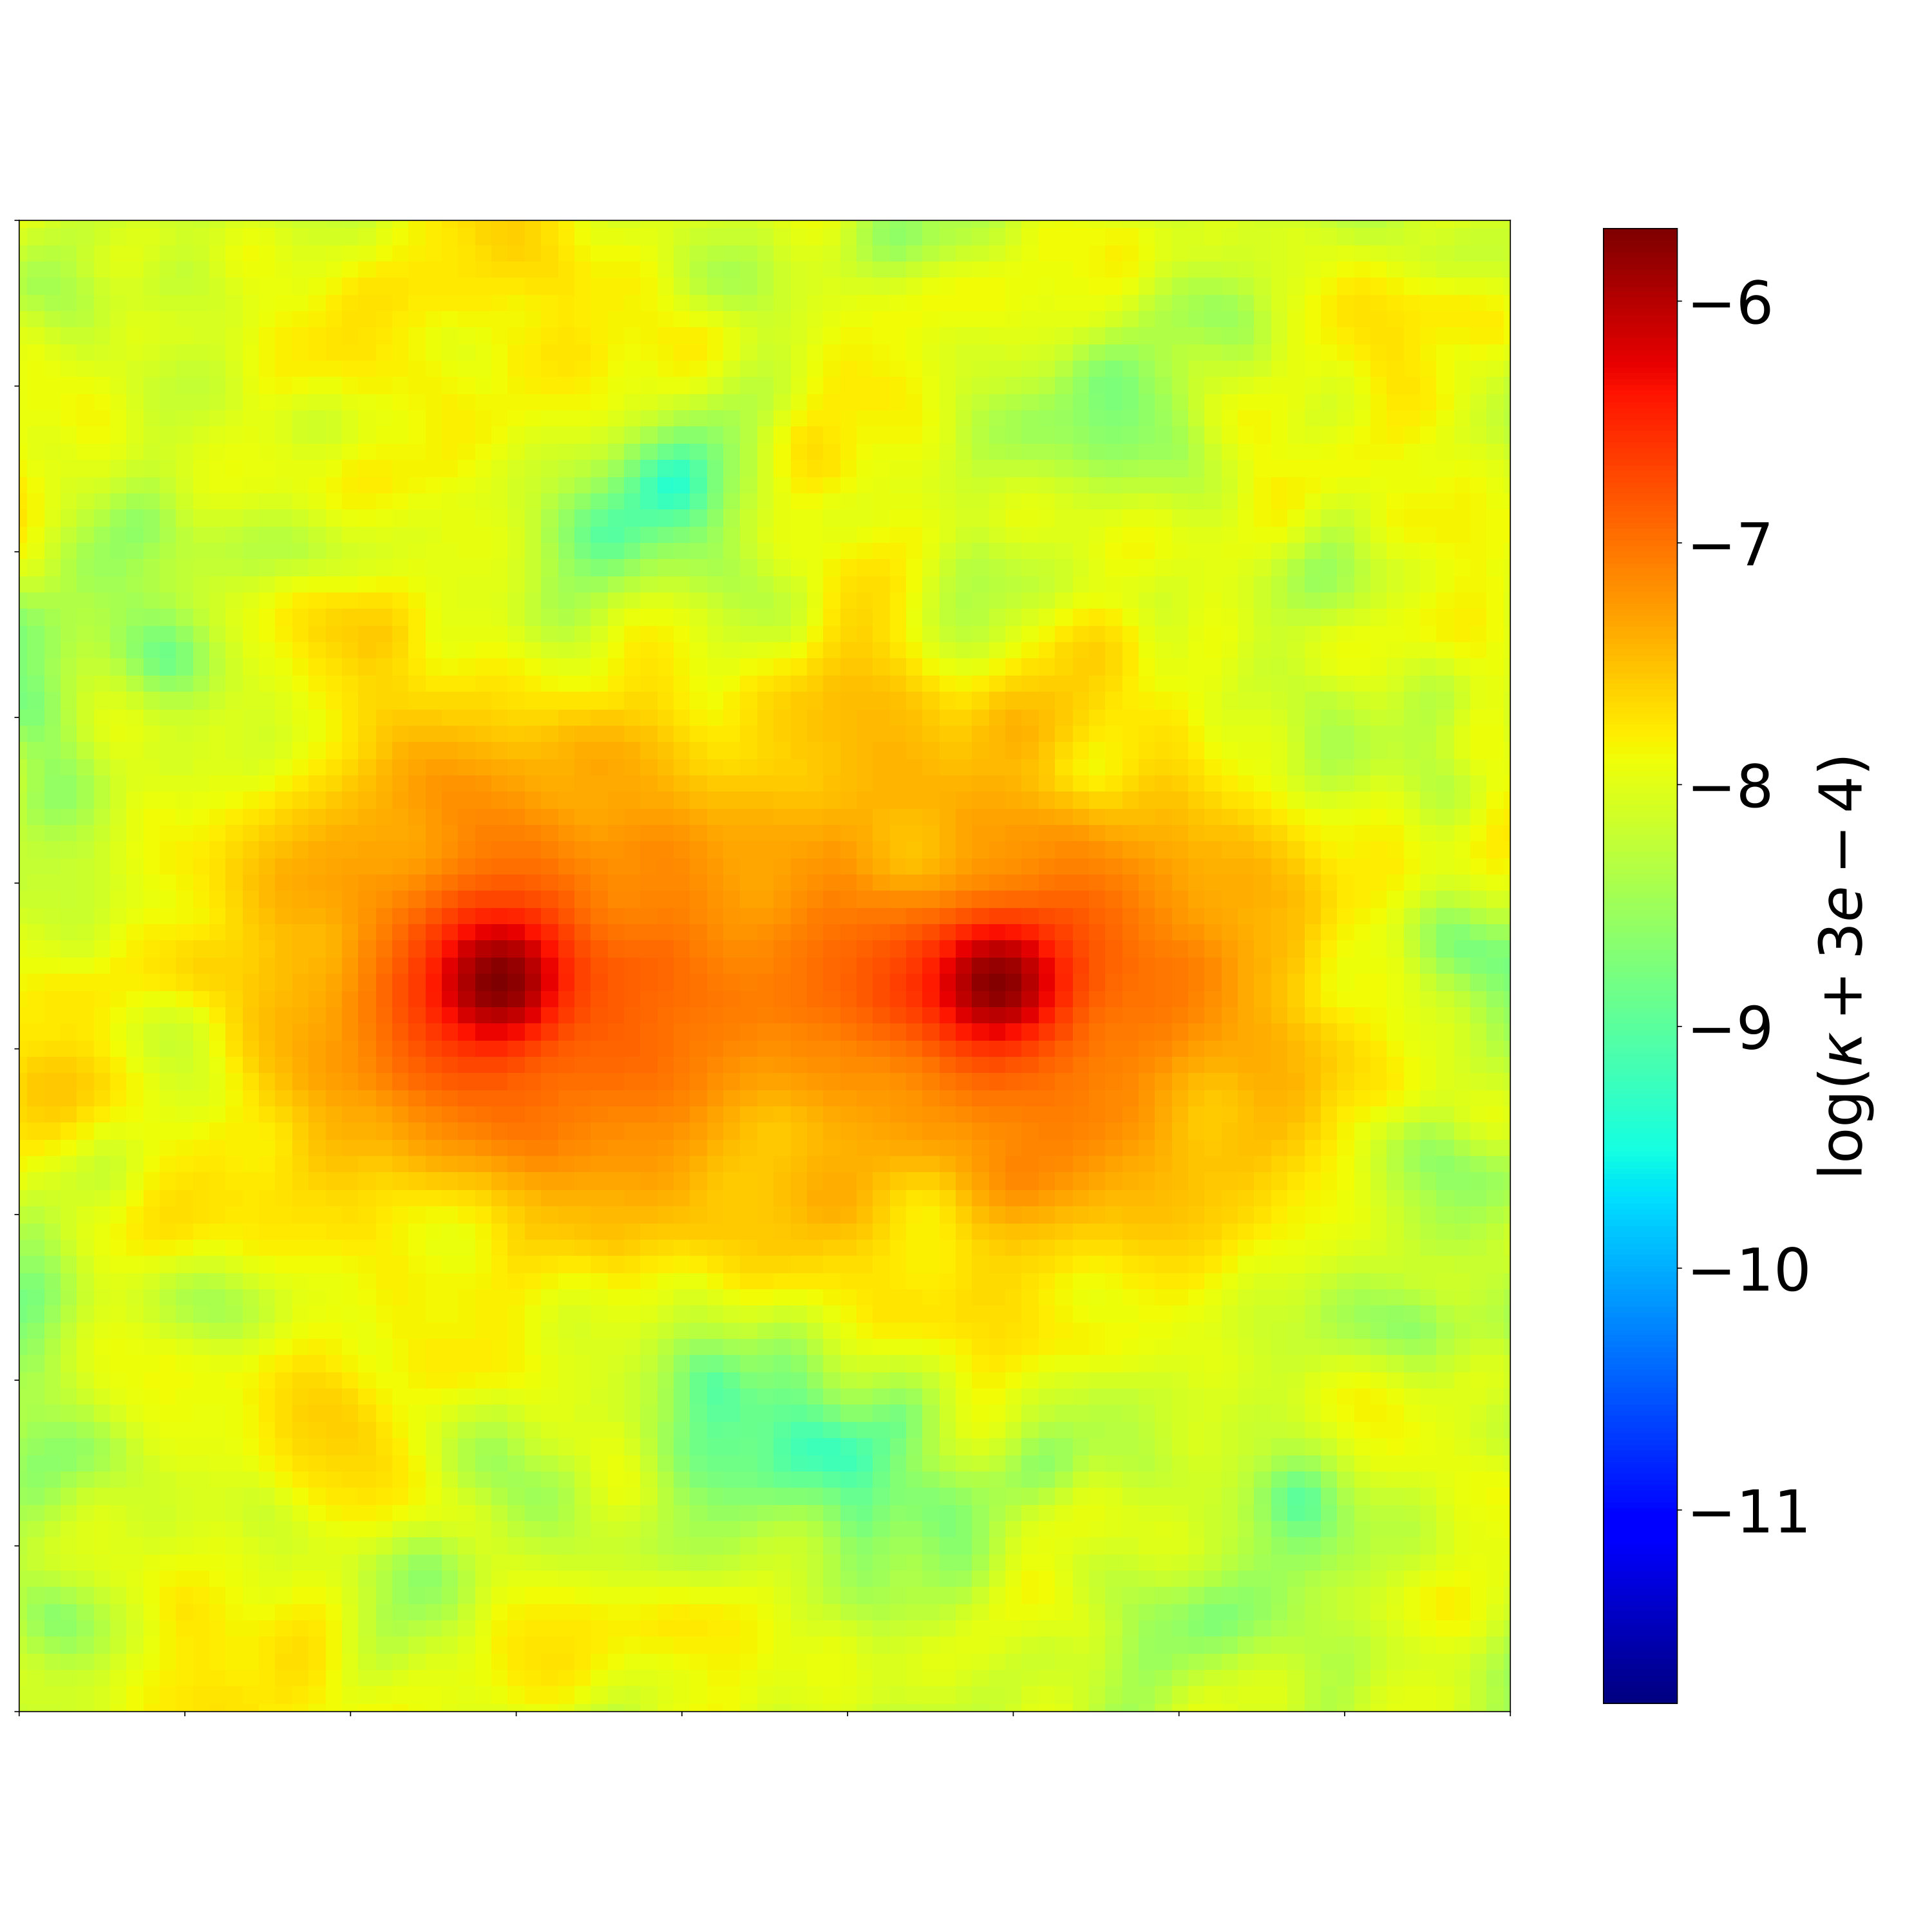 Figure 4
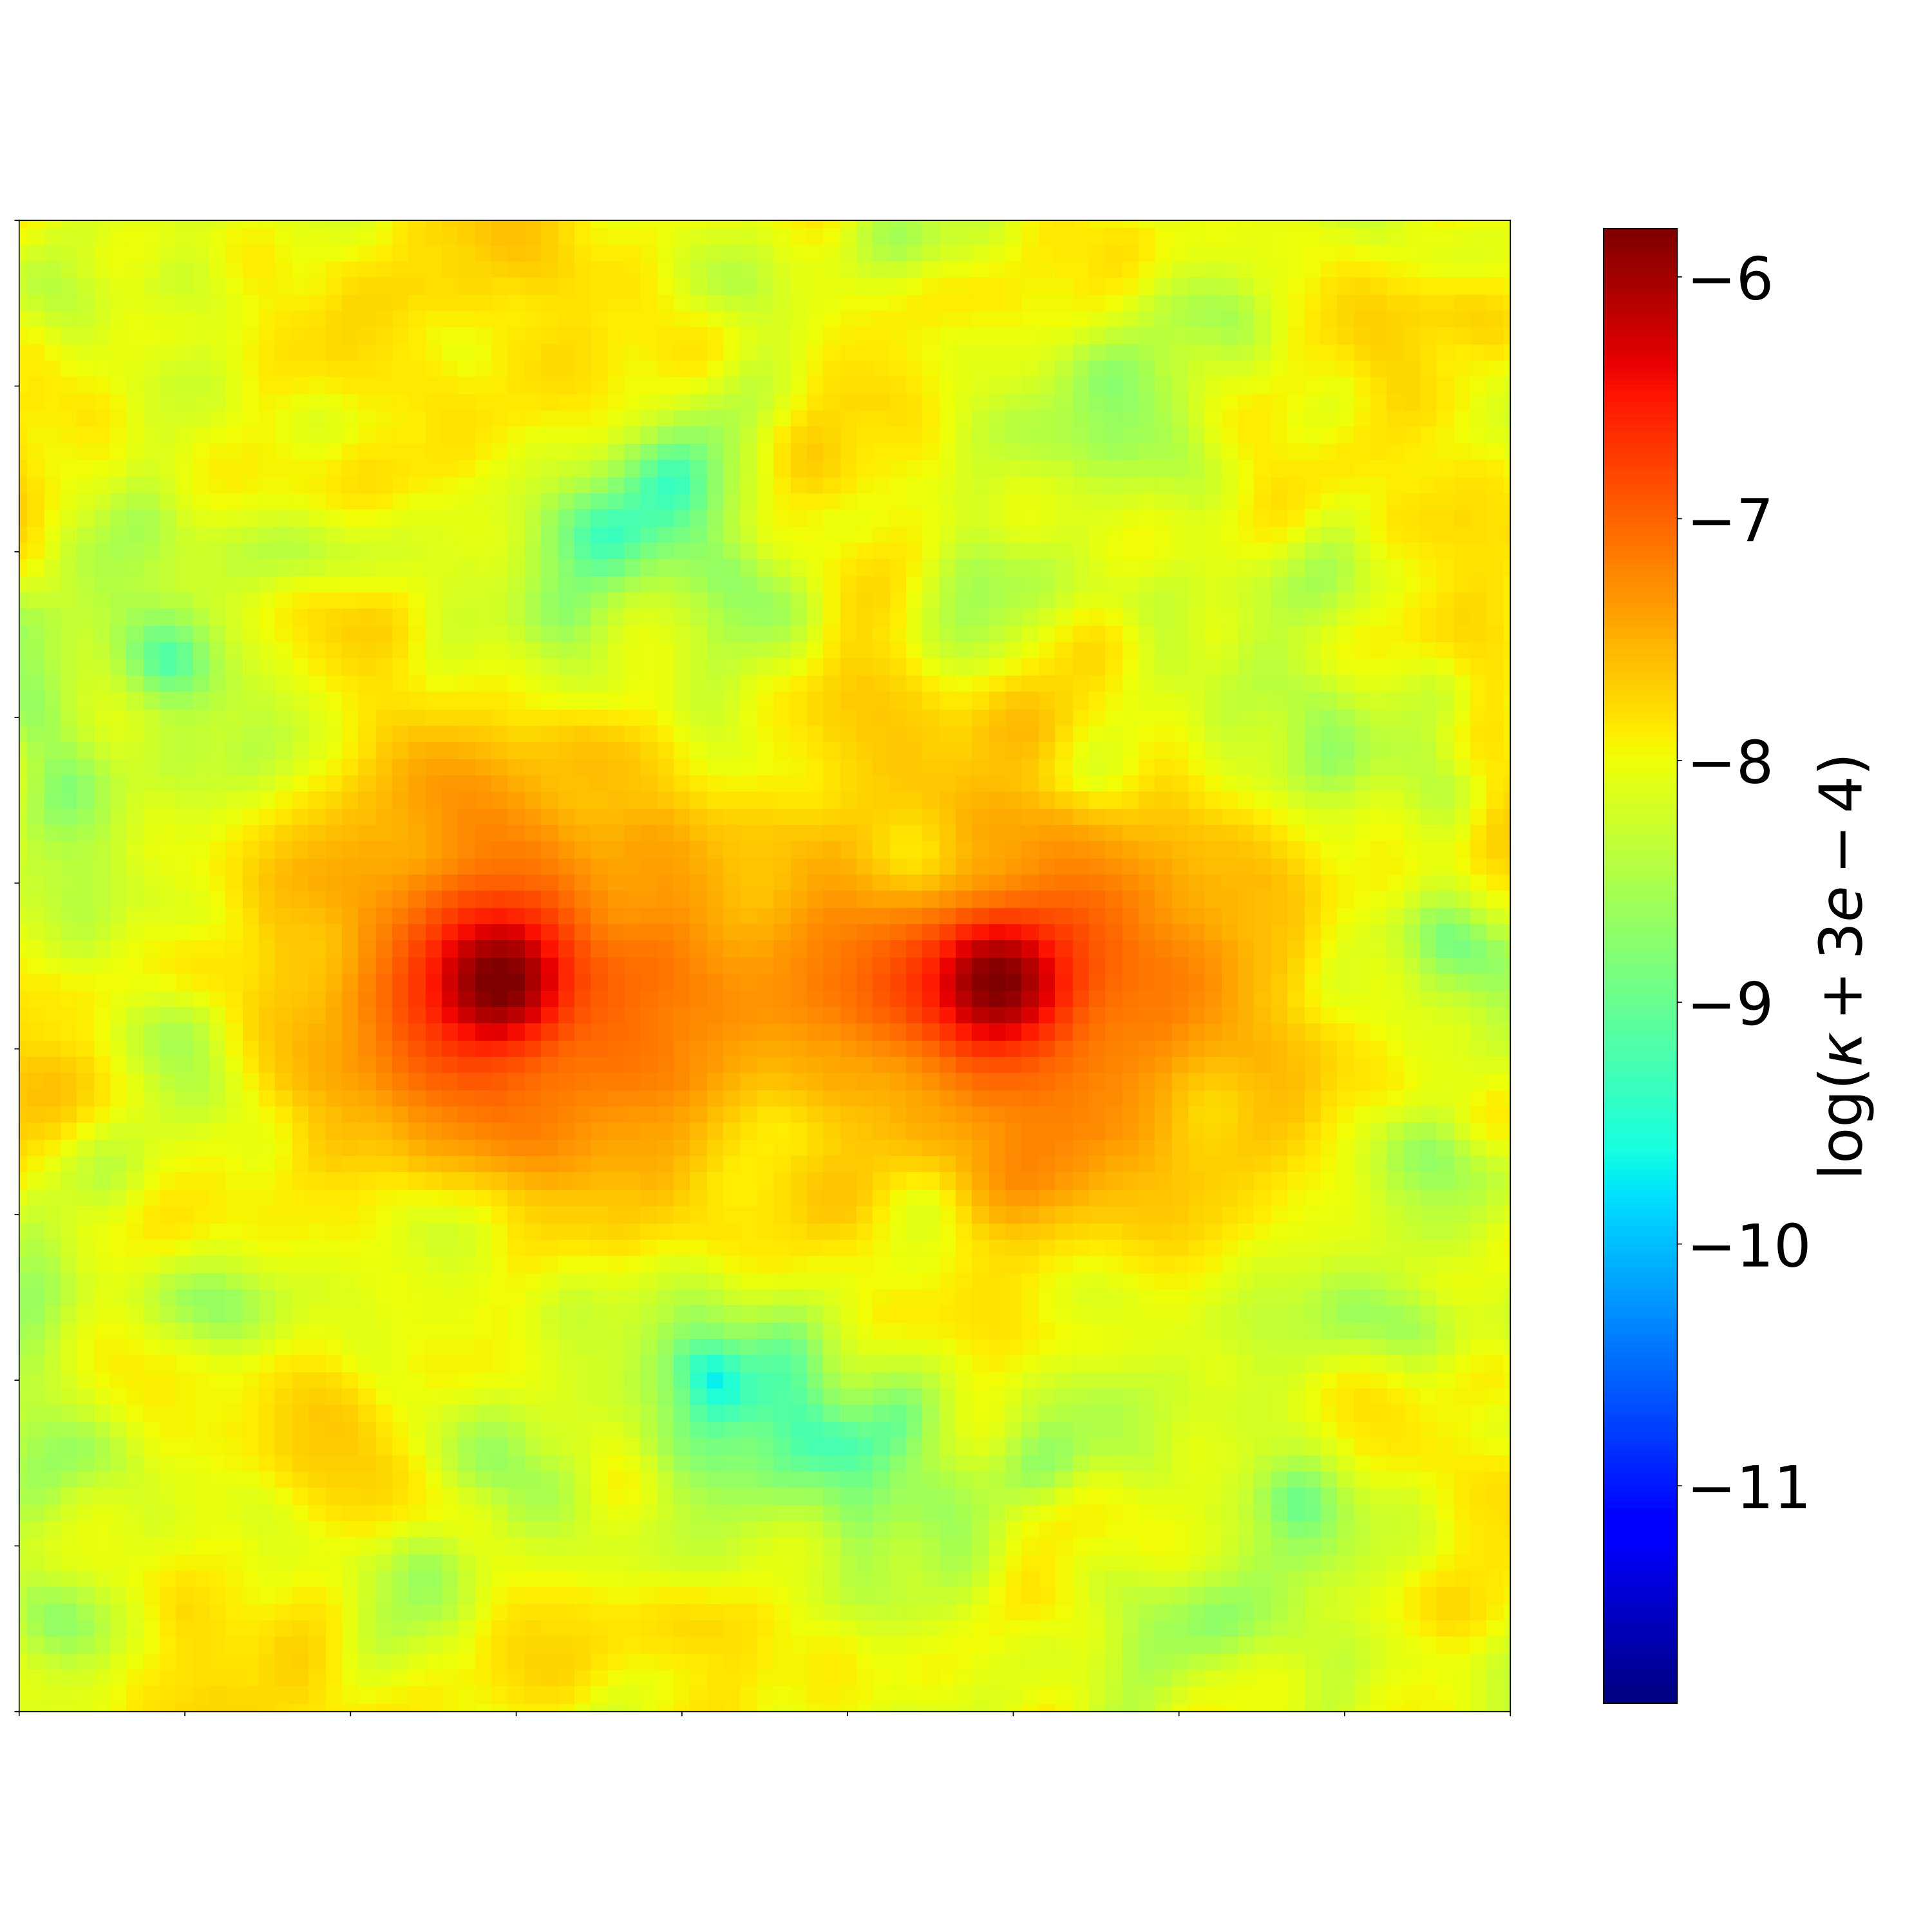 Figure 5
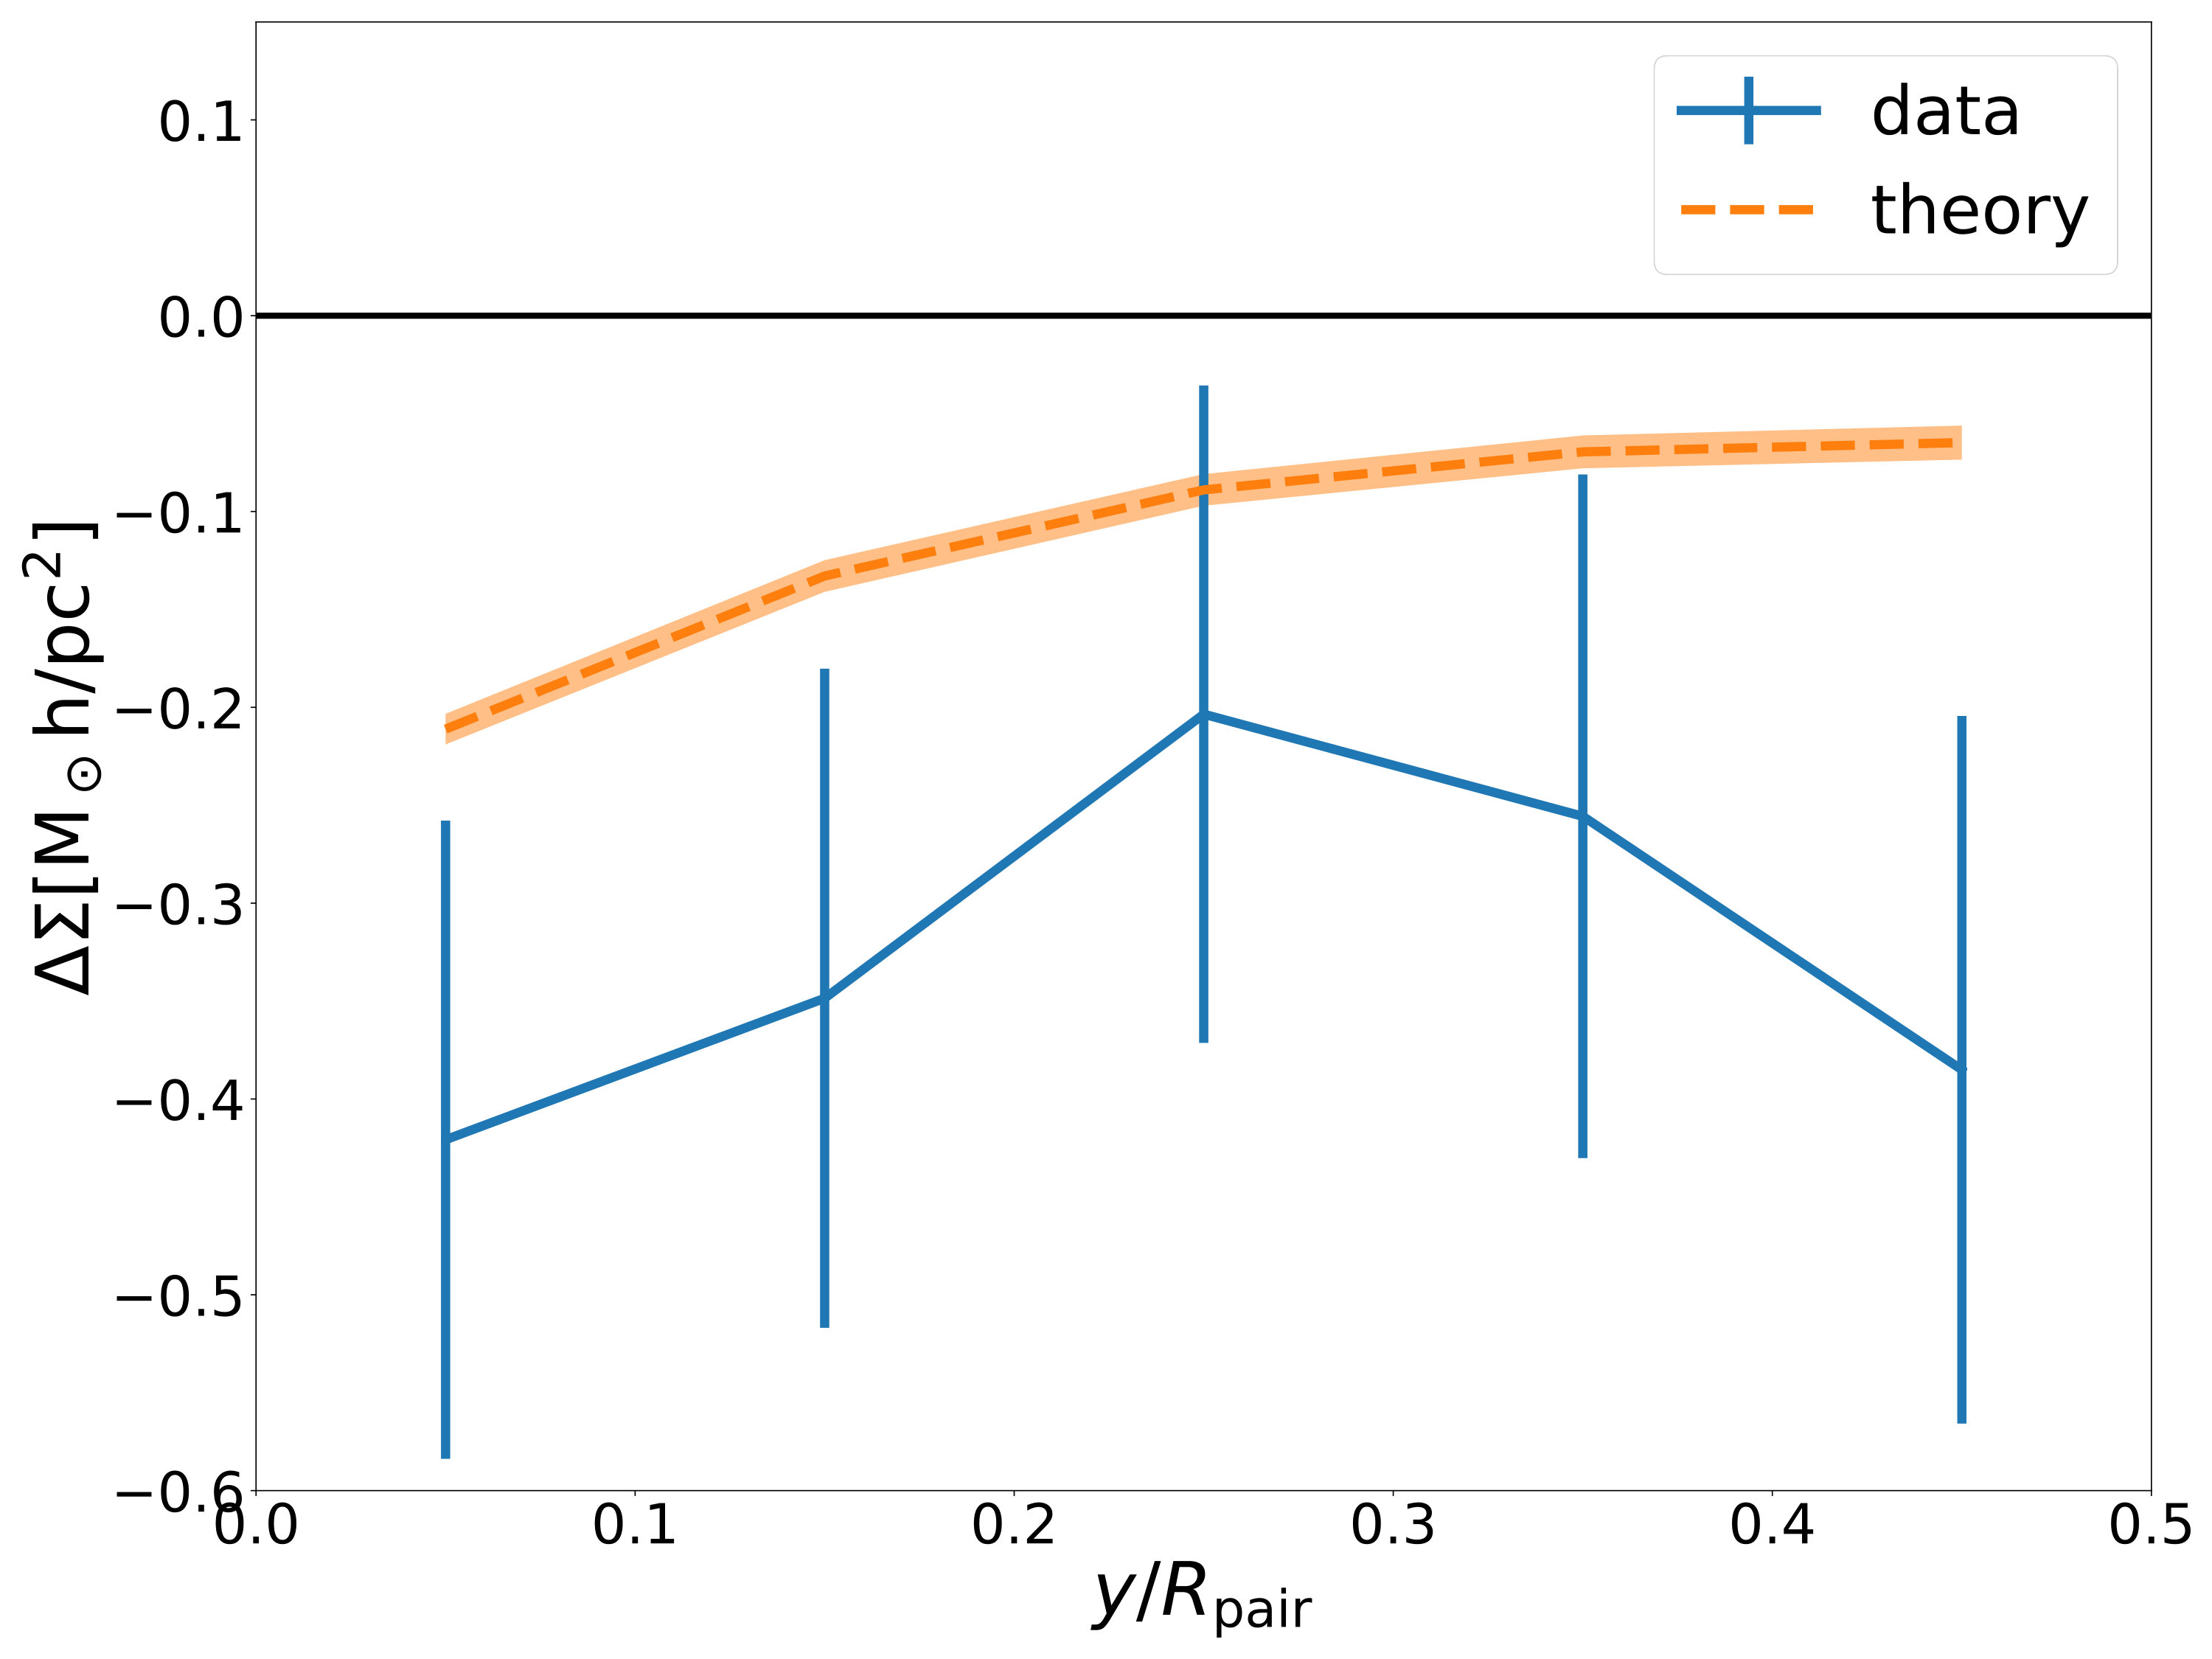 Figure 6
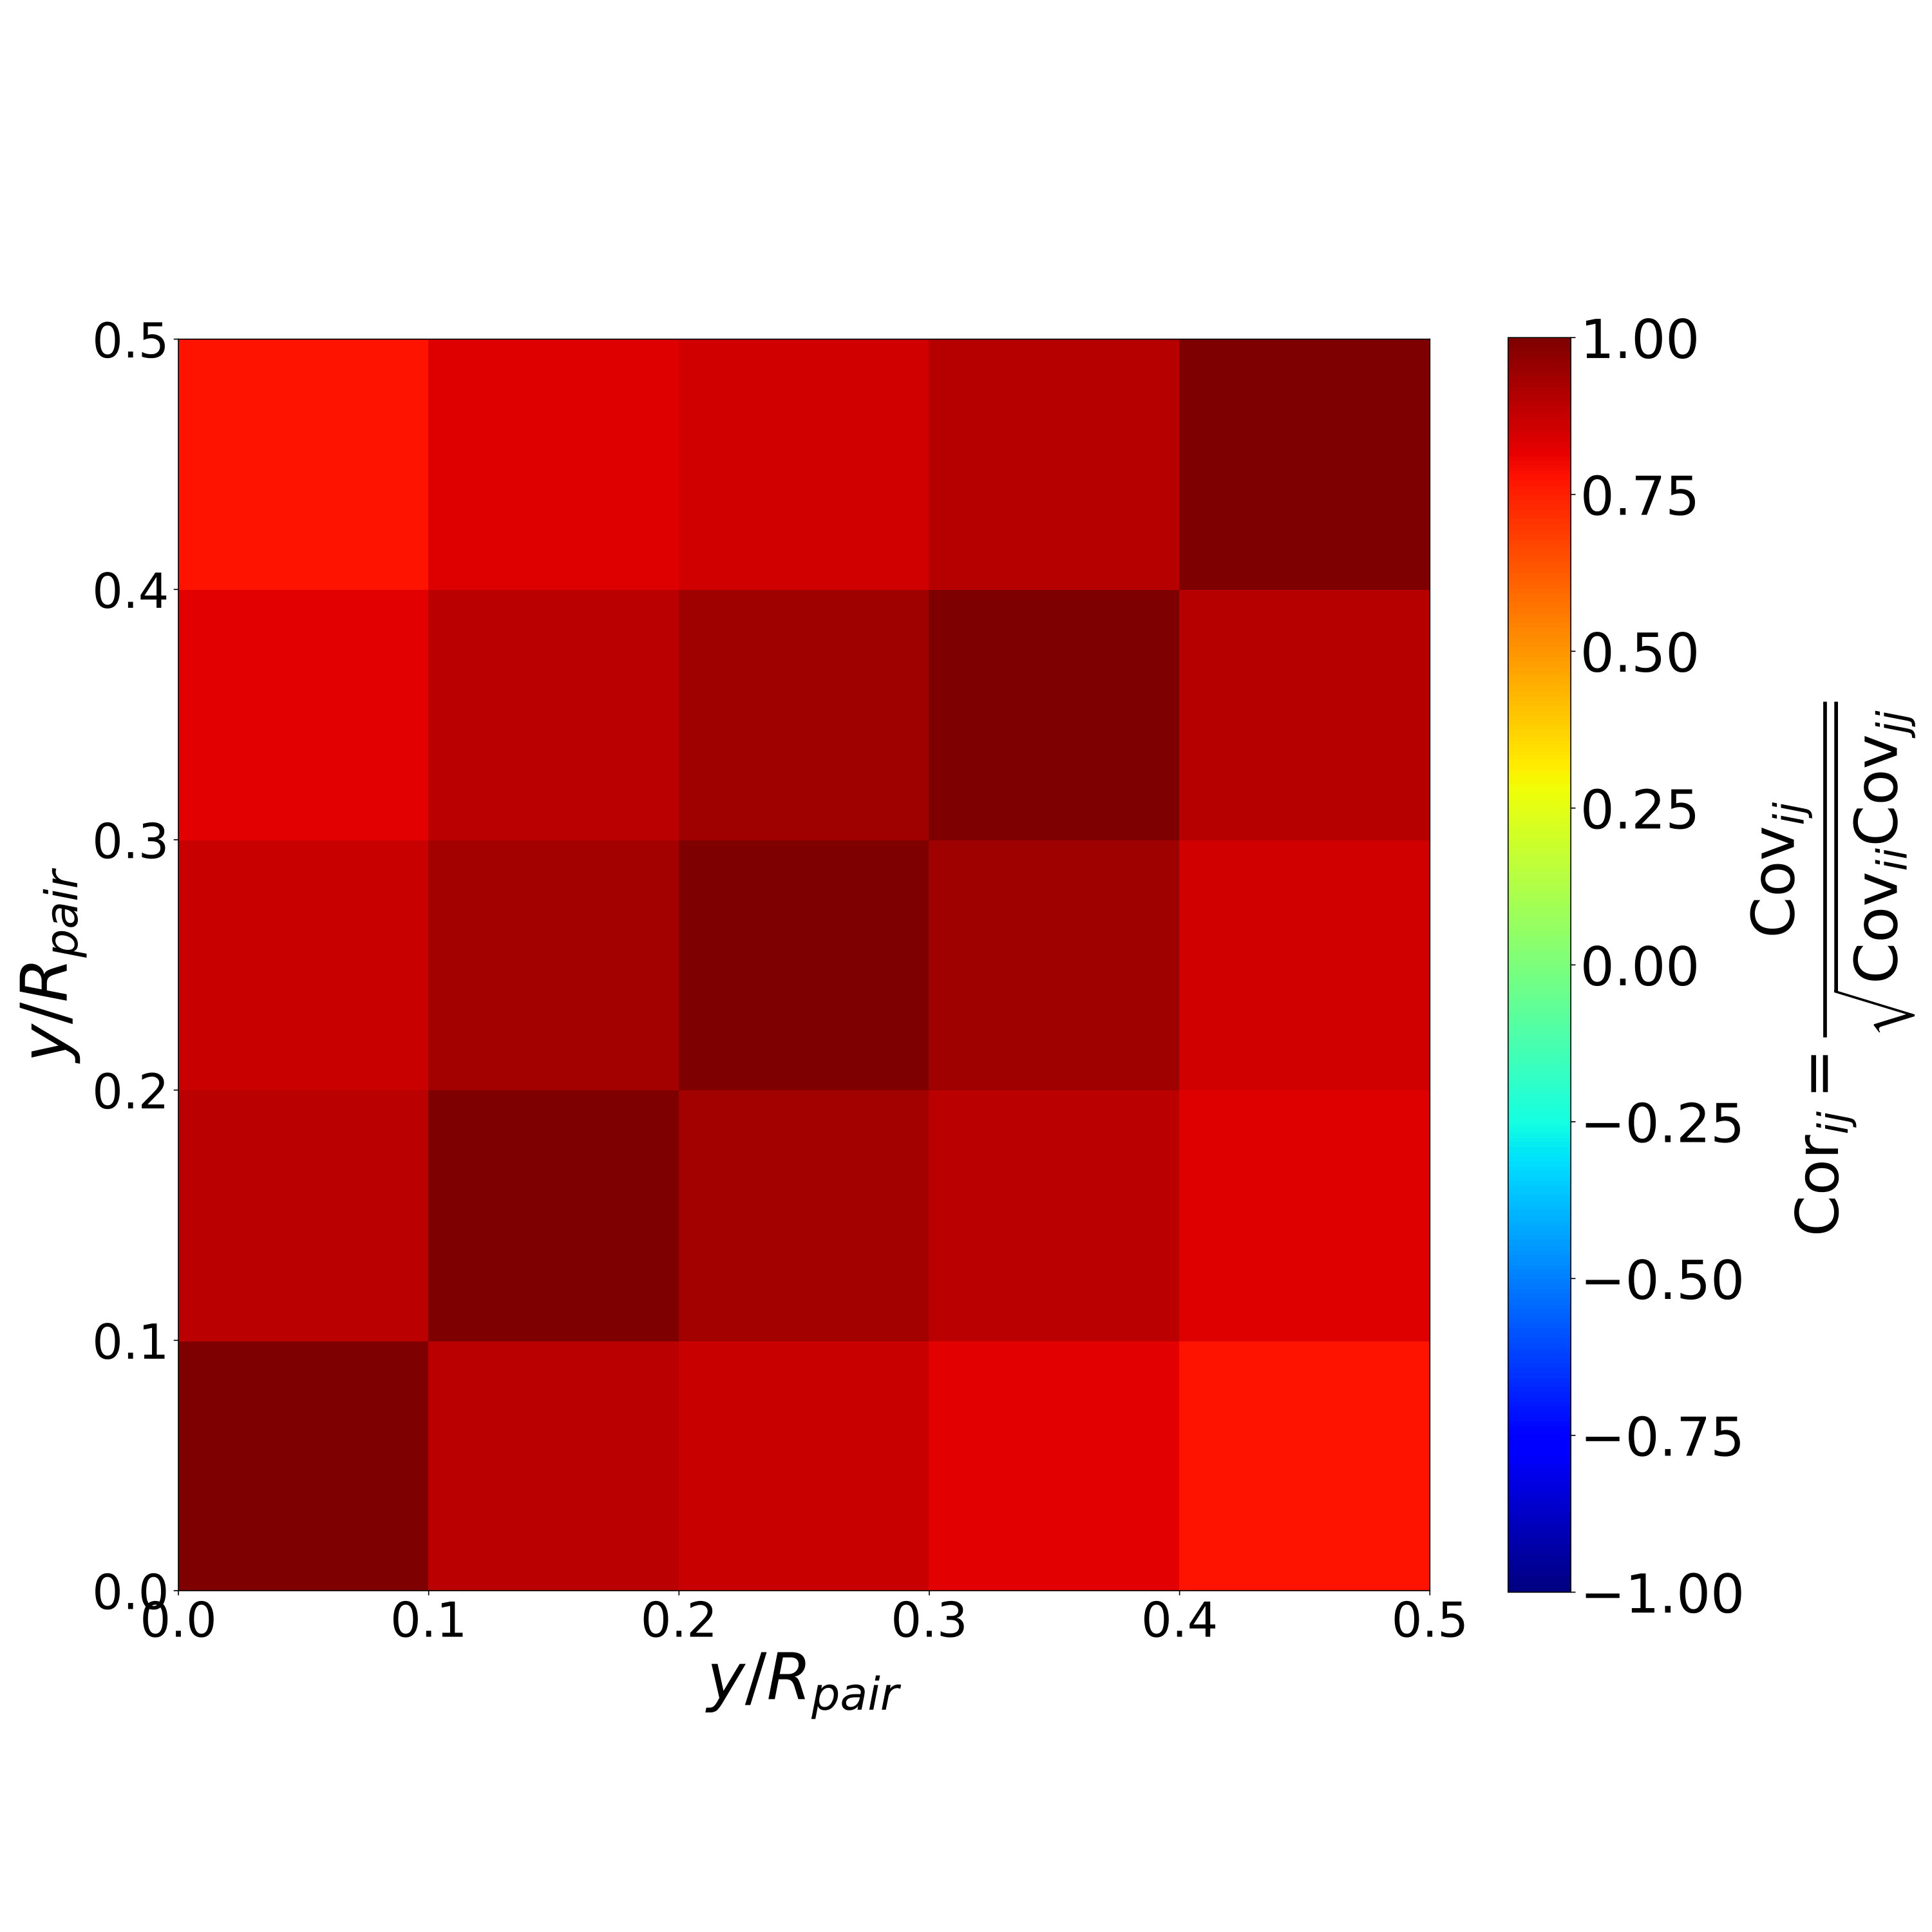 Figure 7
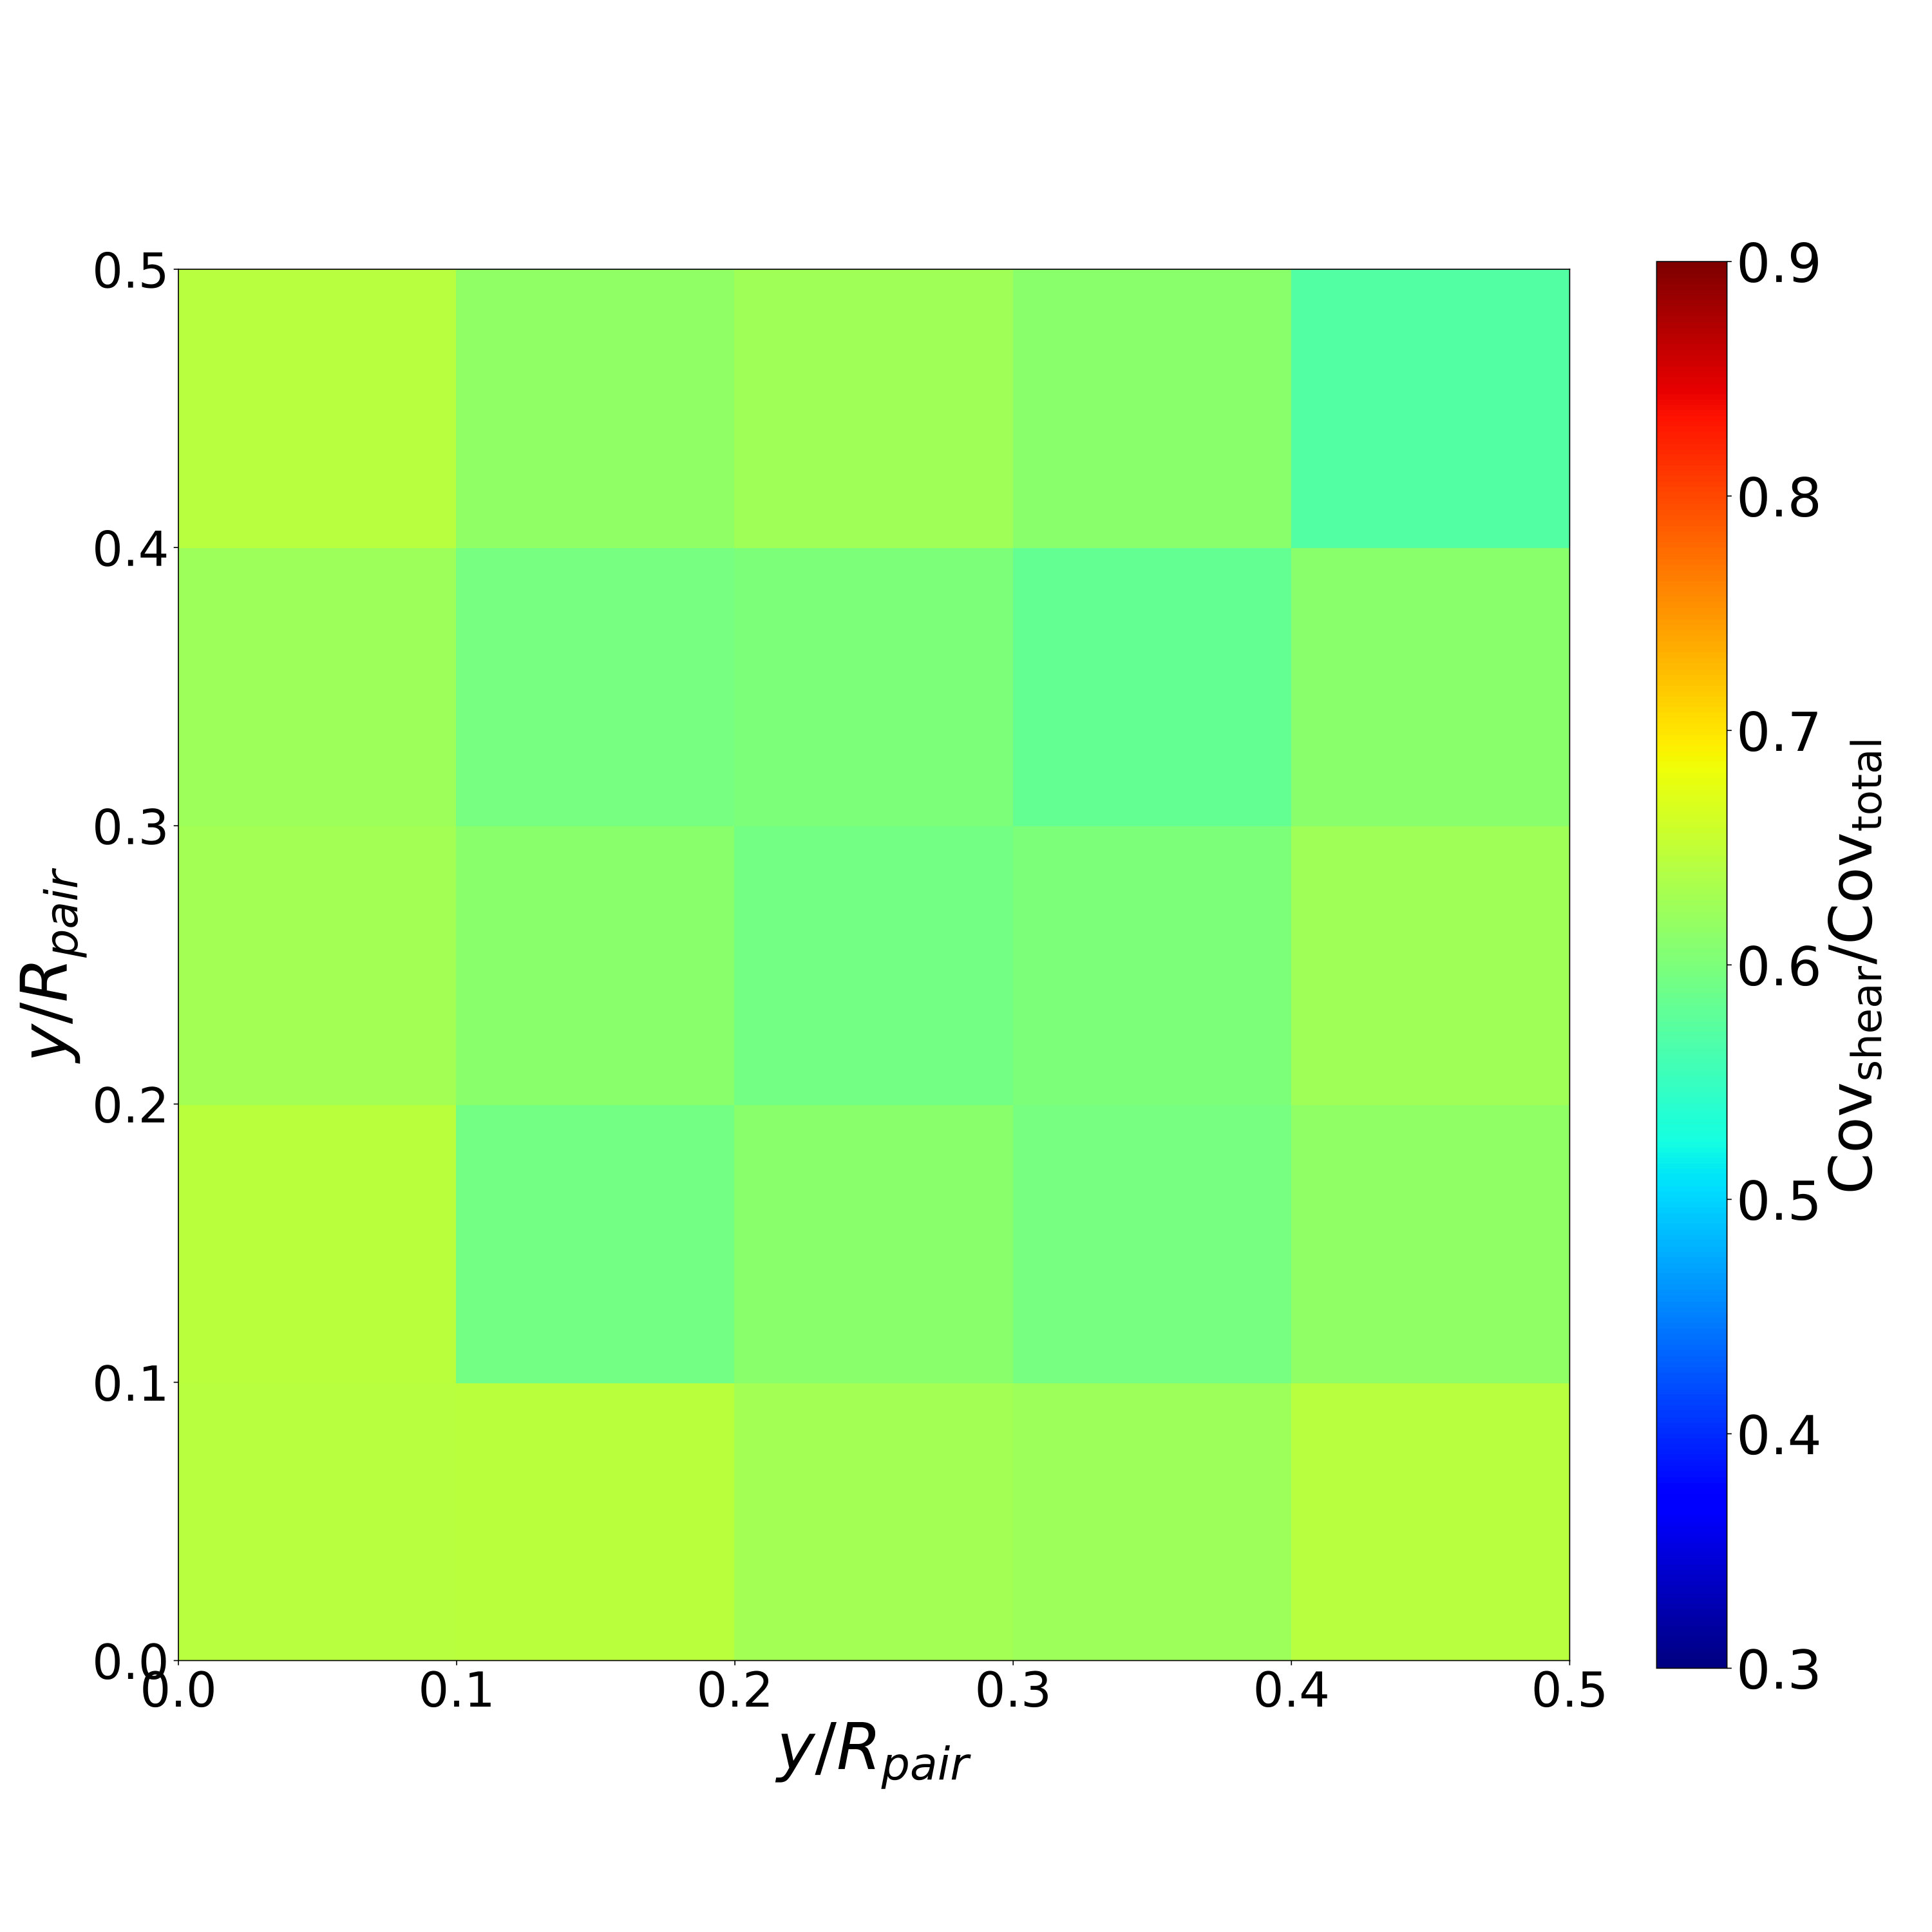 Figure 8
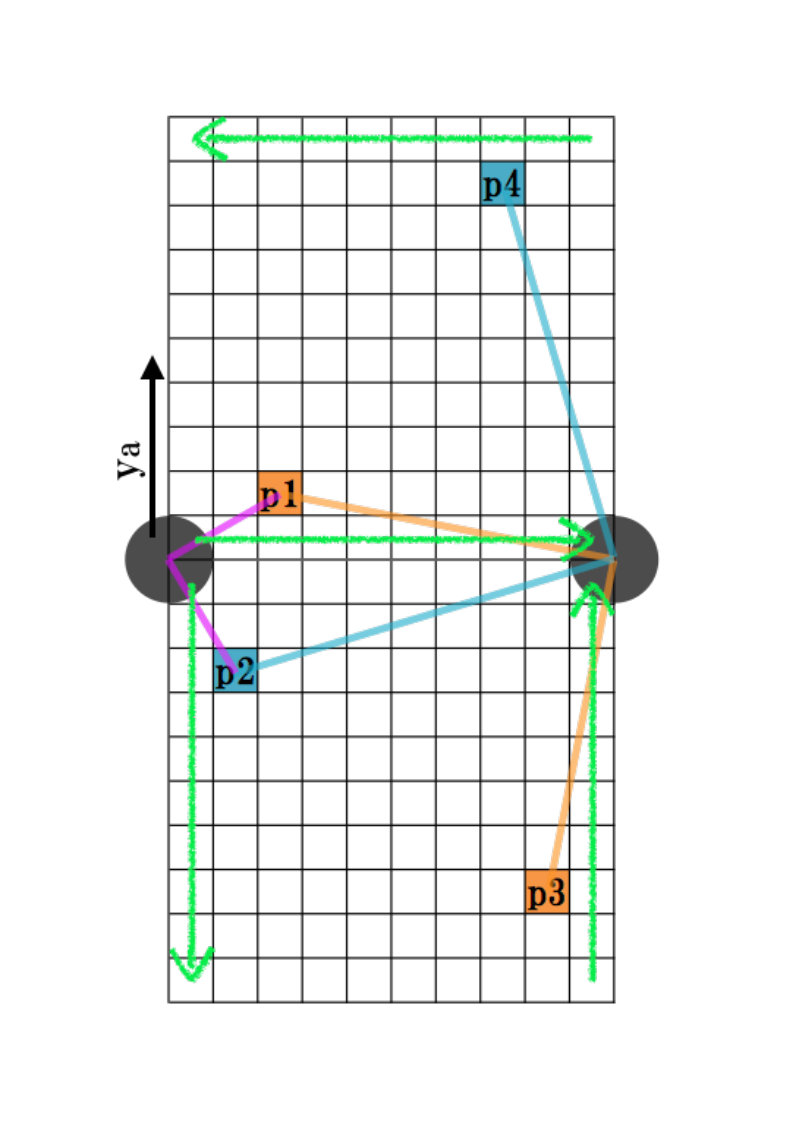 Figure 9
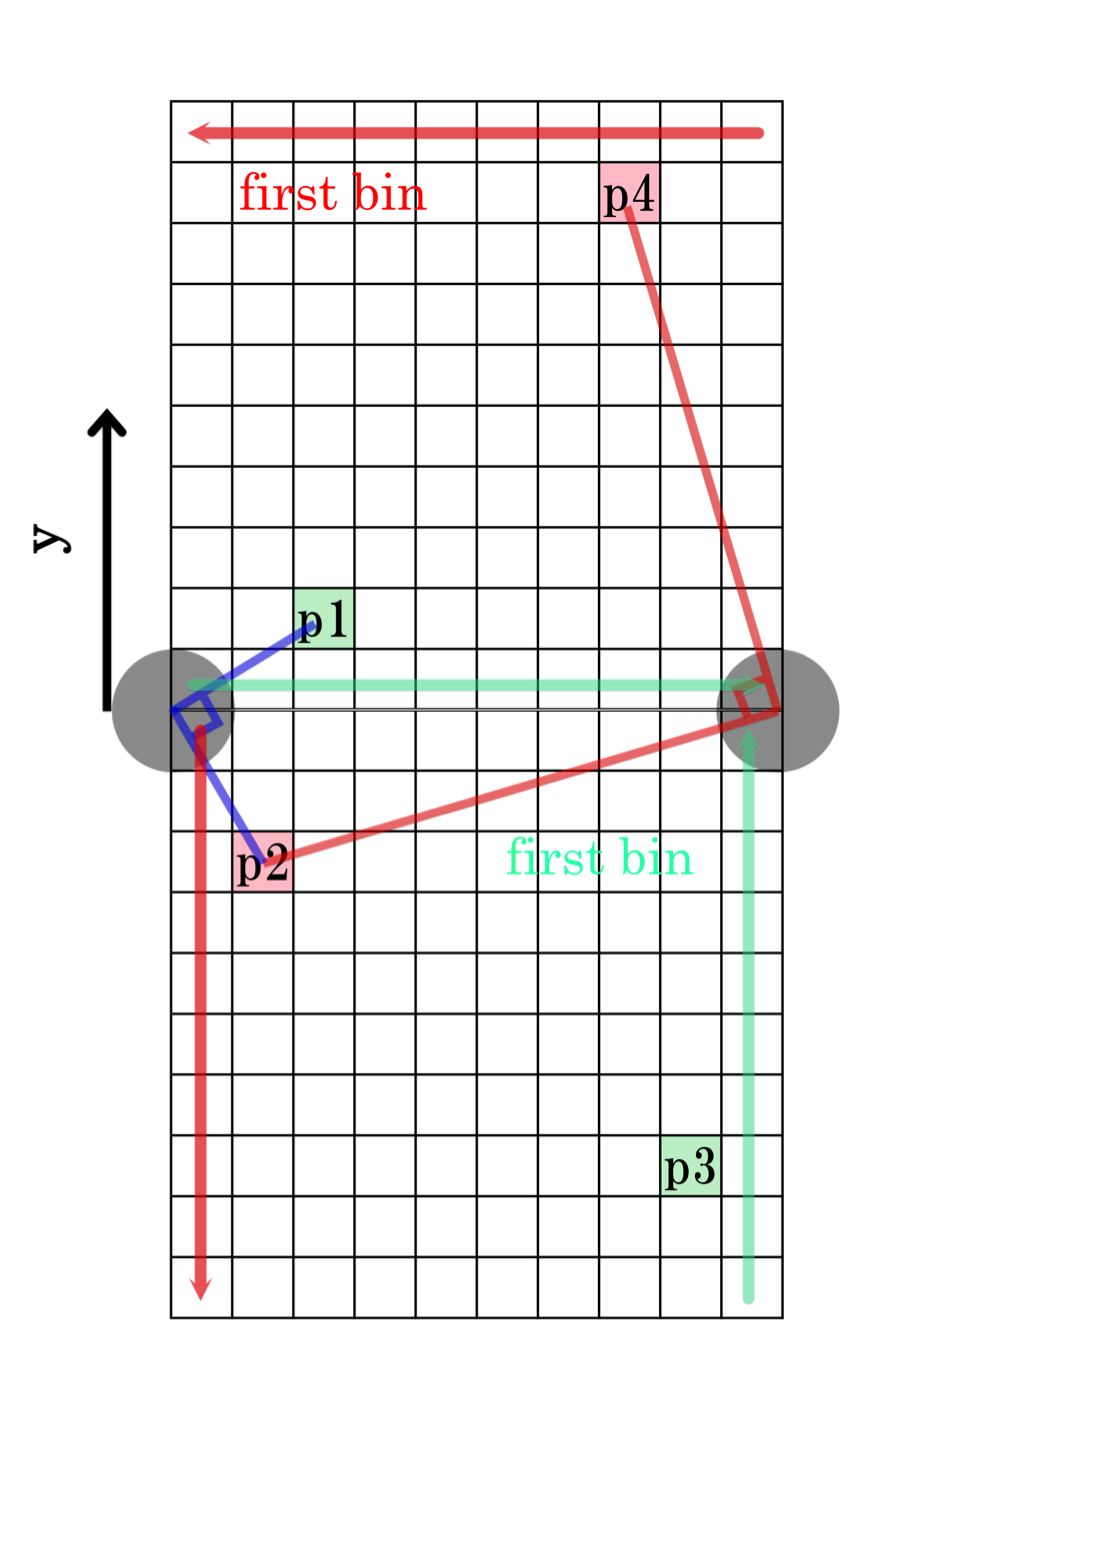 Figure 10
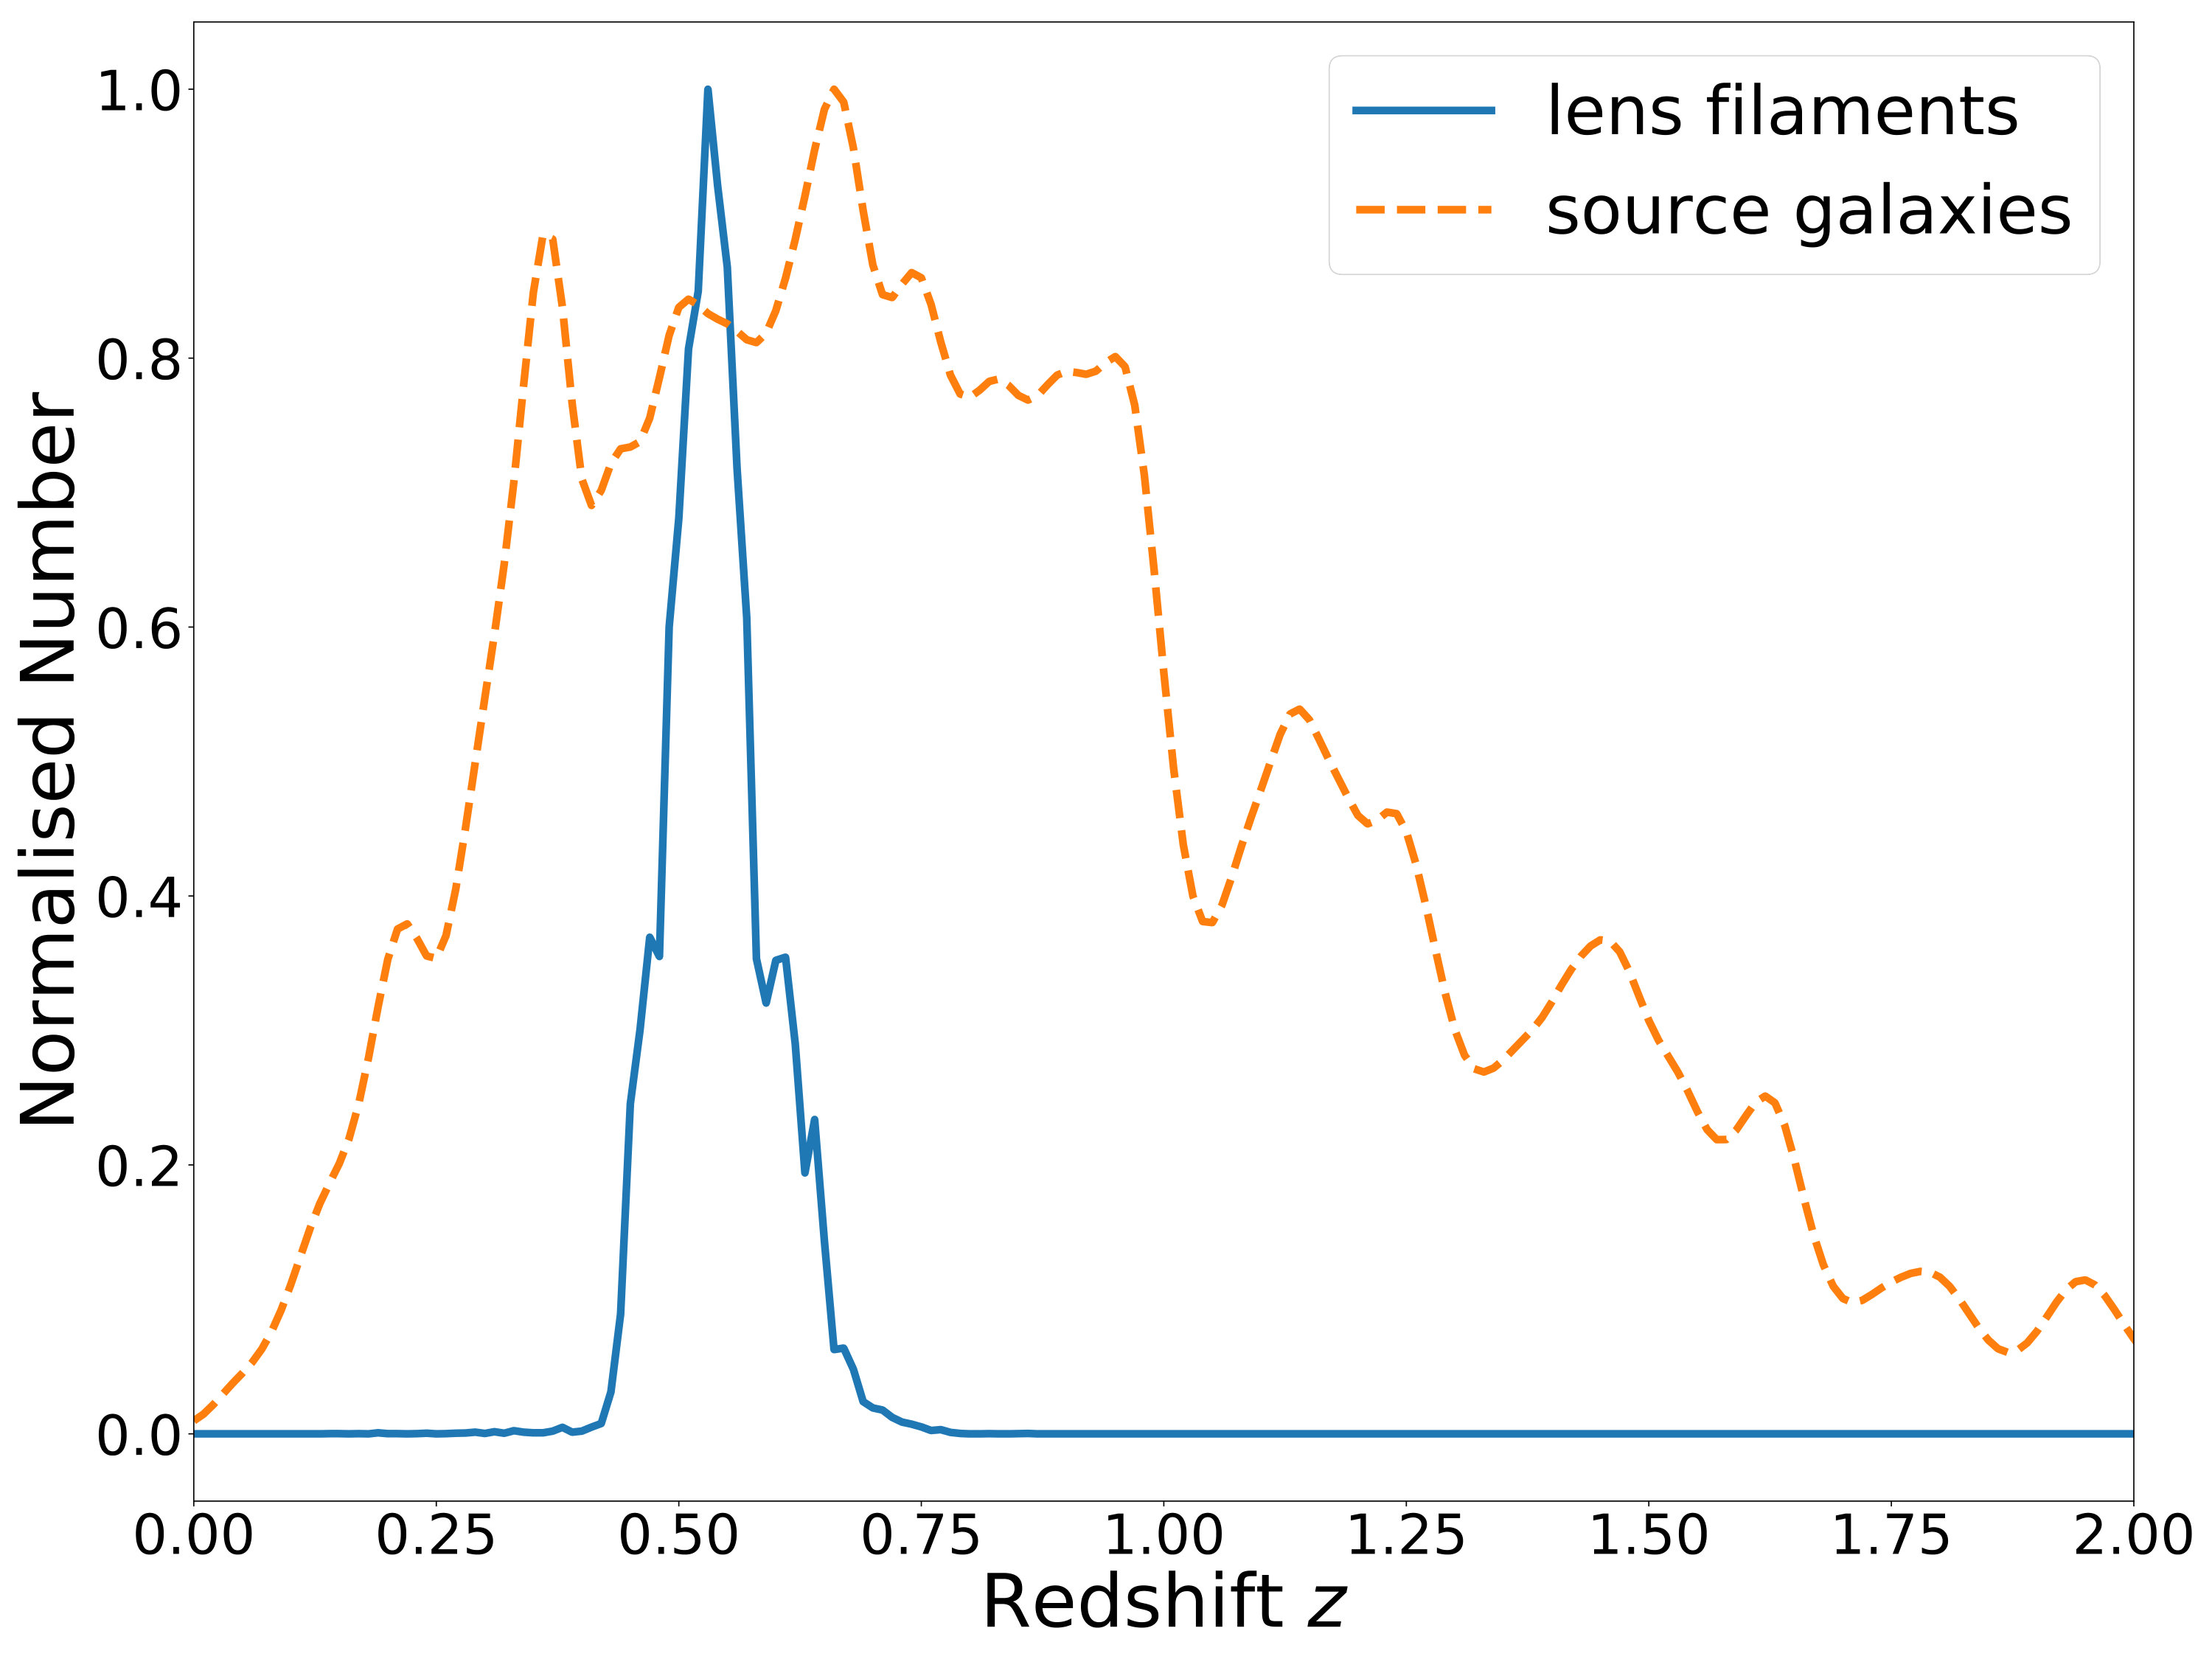 Figure 11
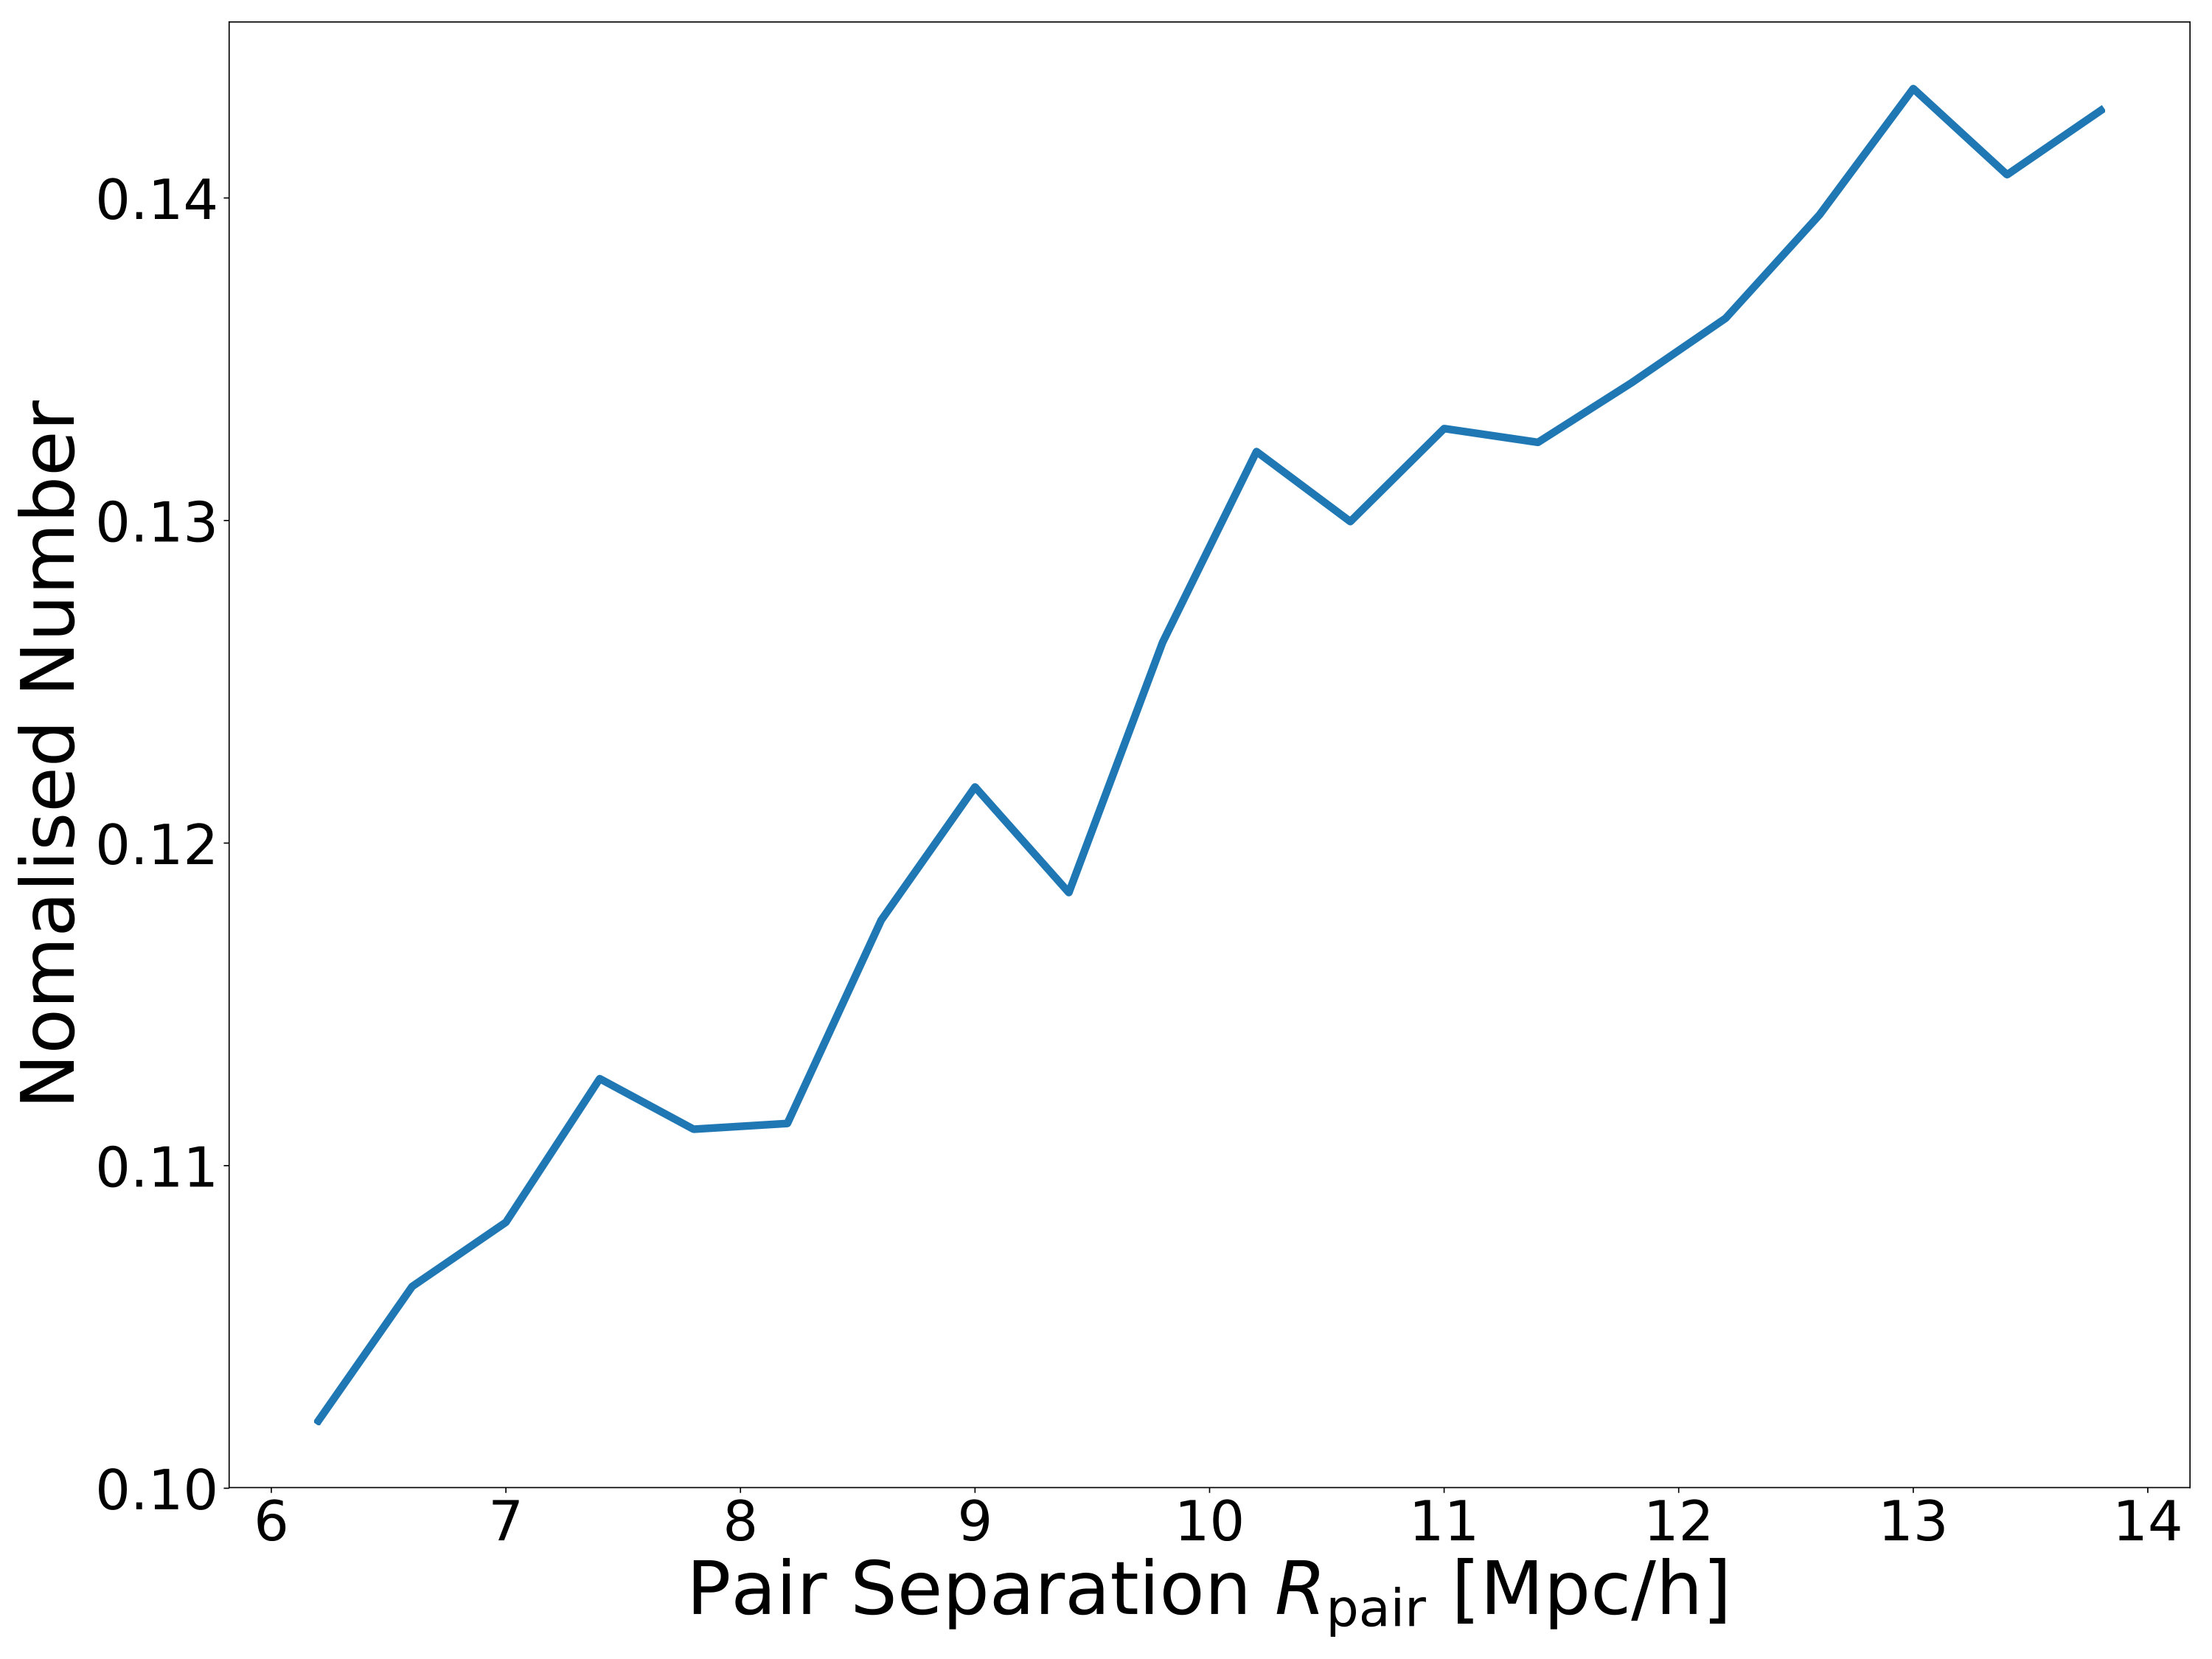 Figure 12
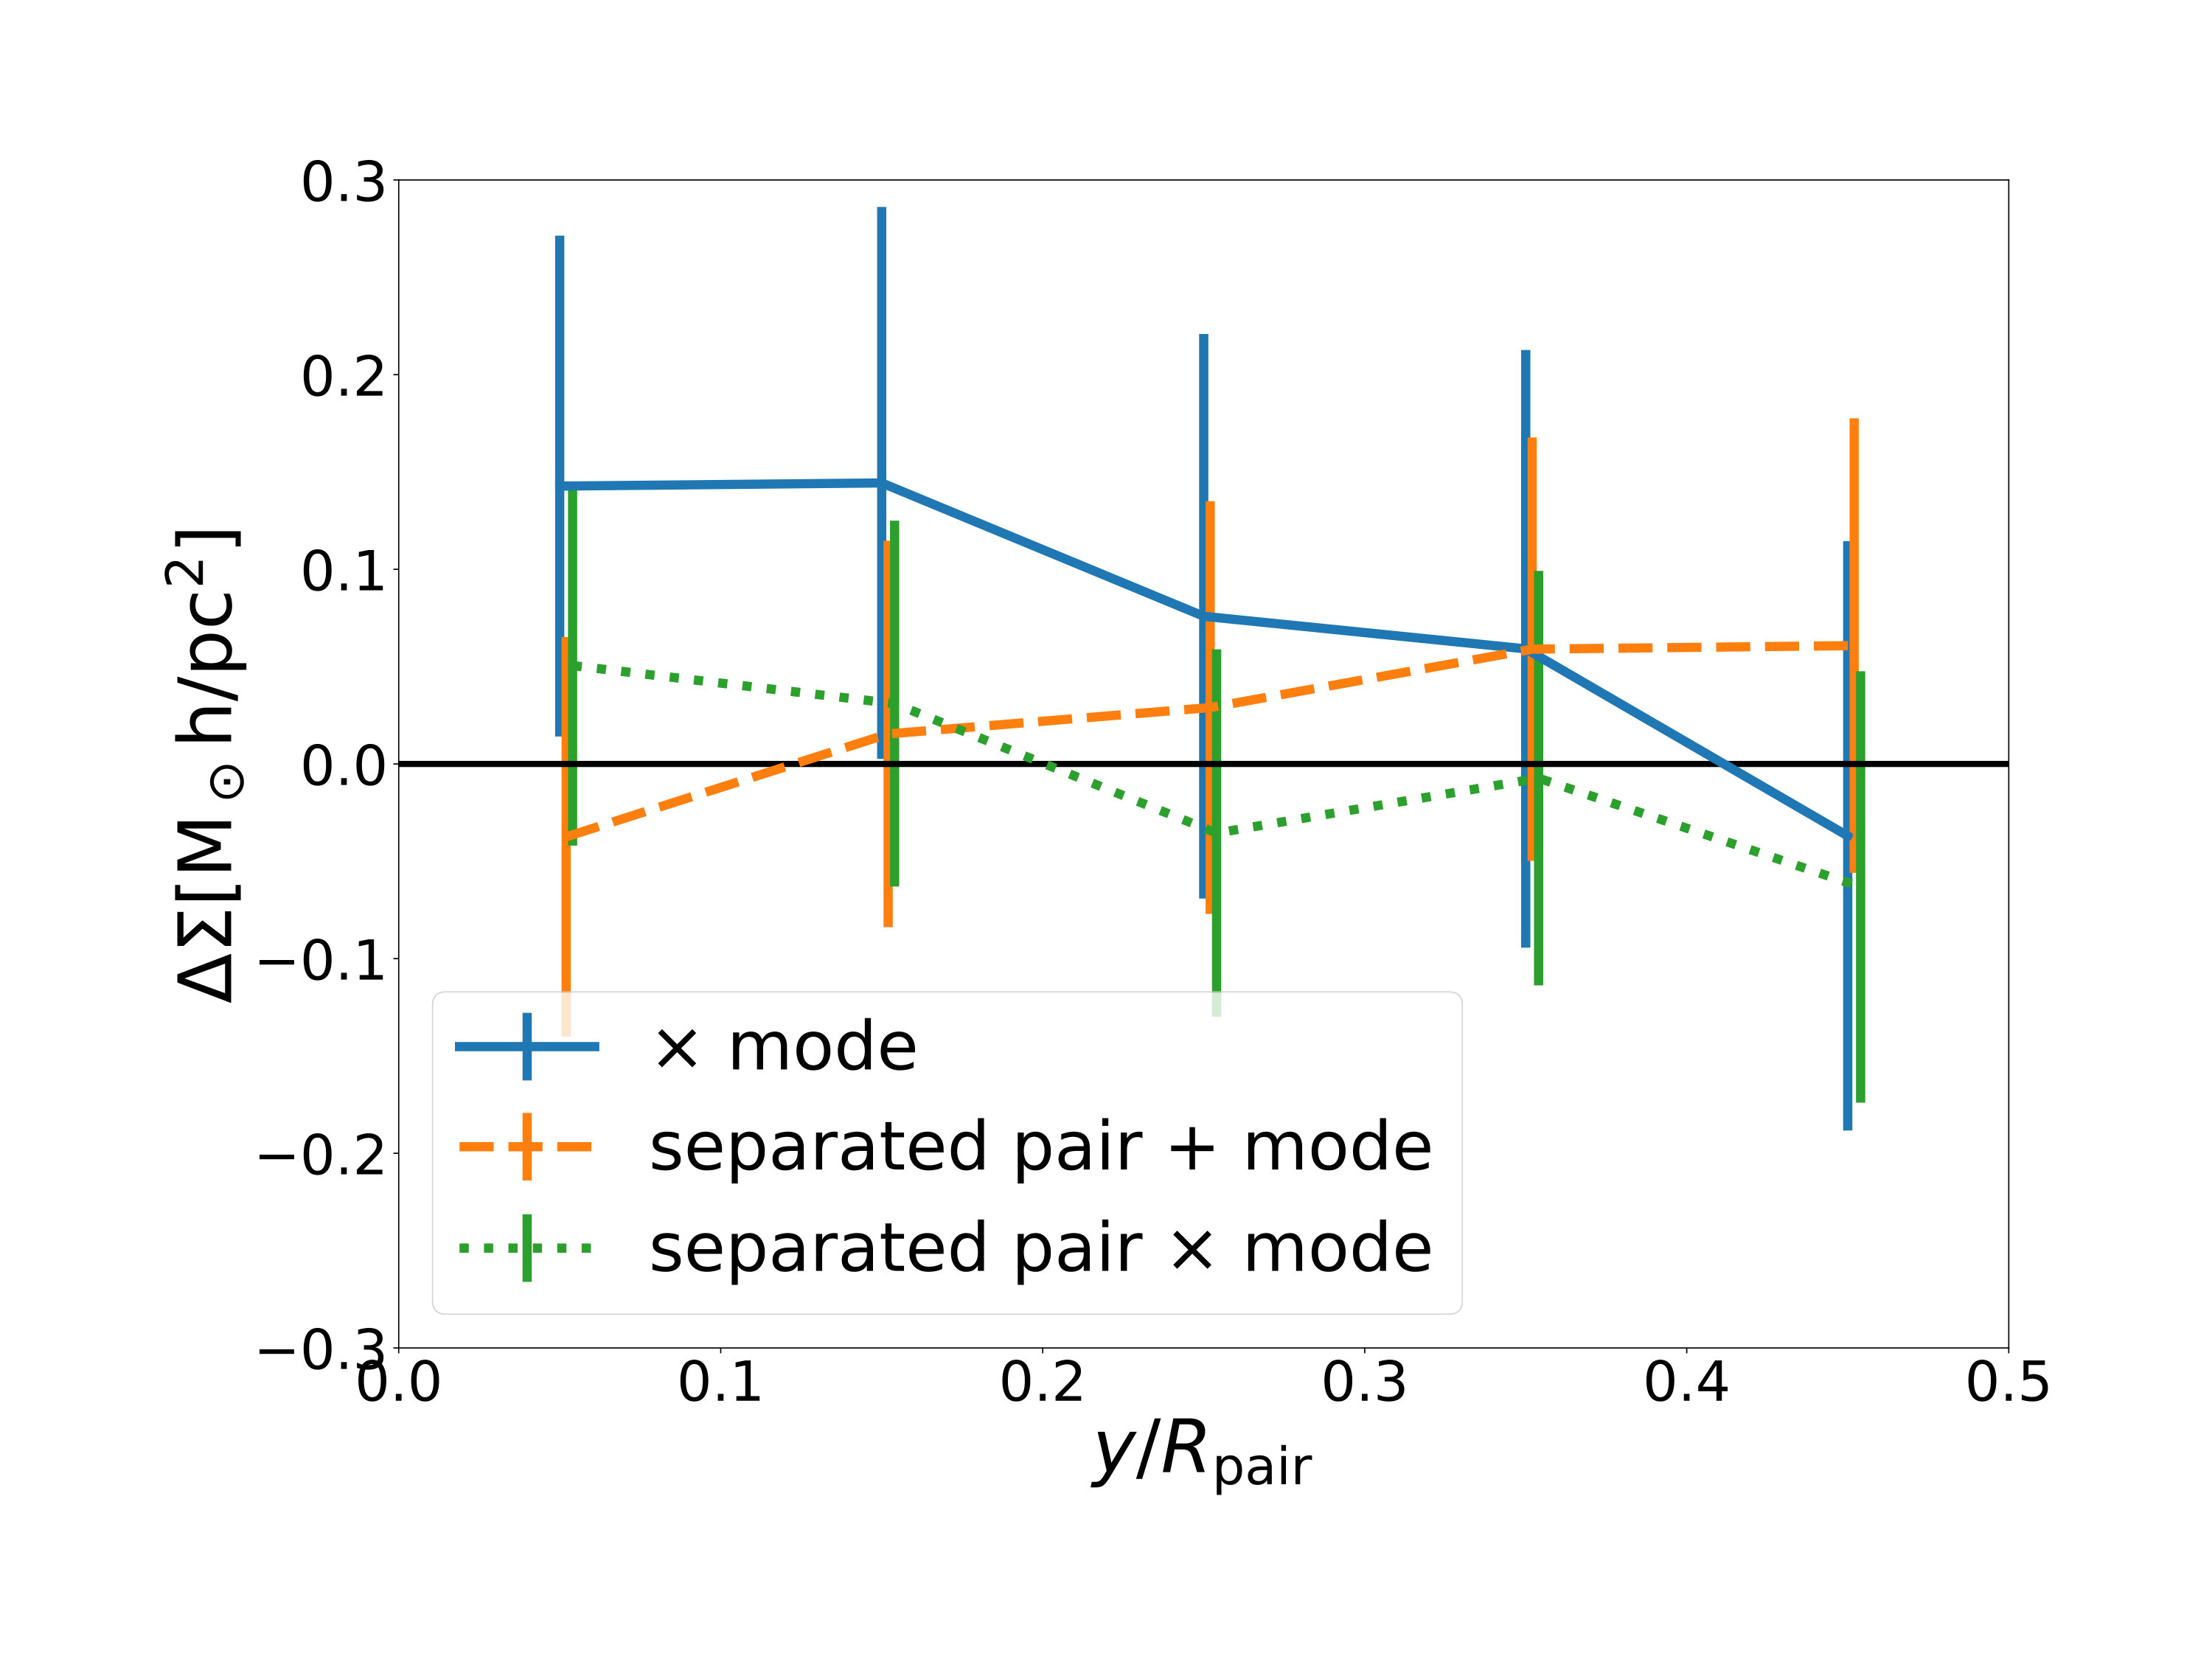 Figure 13
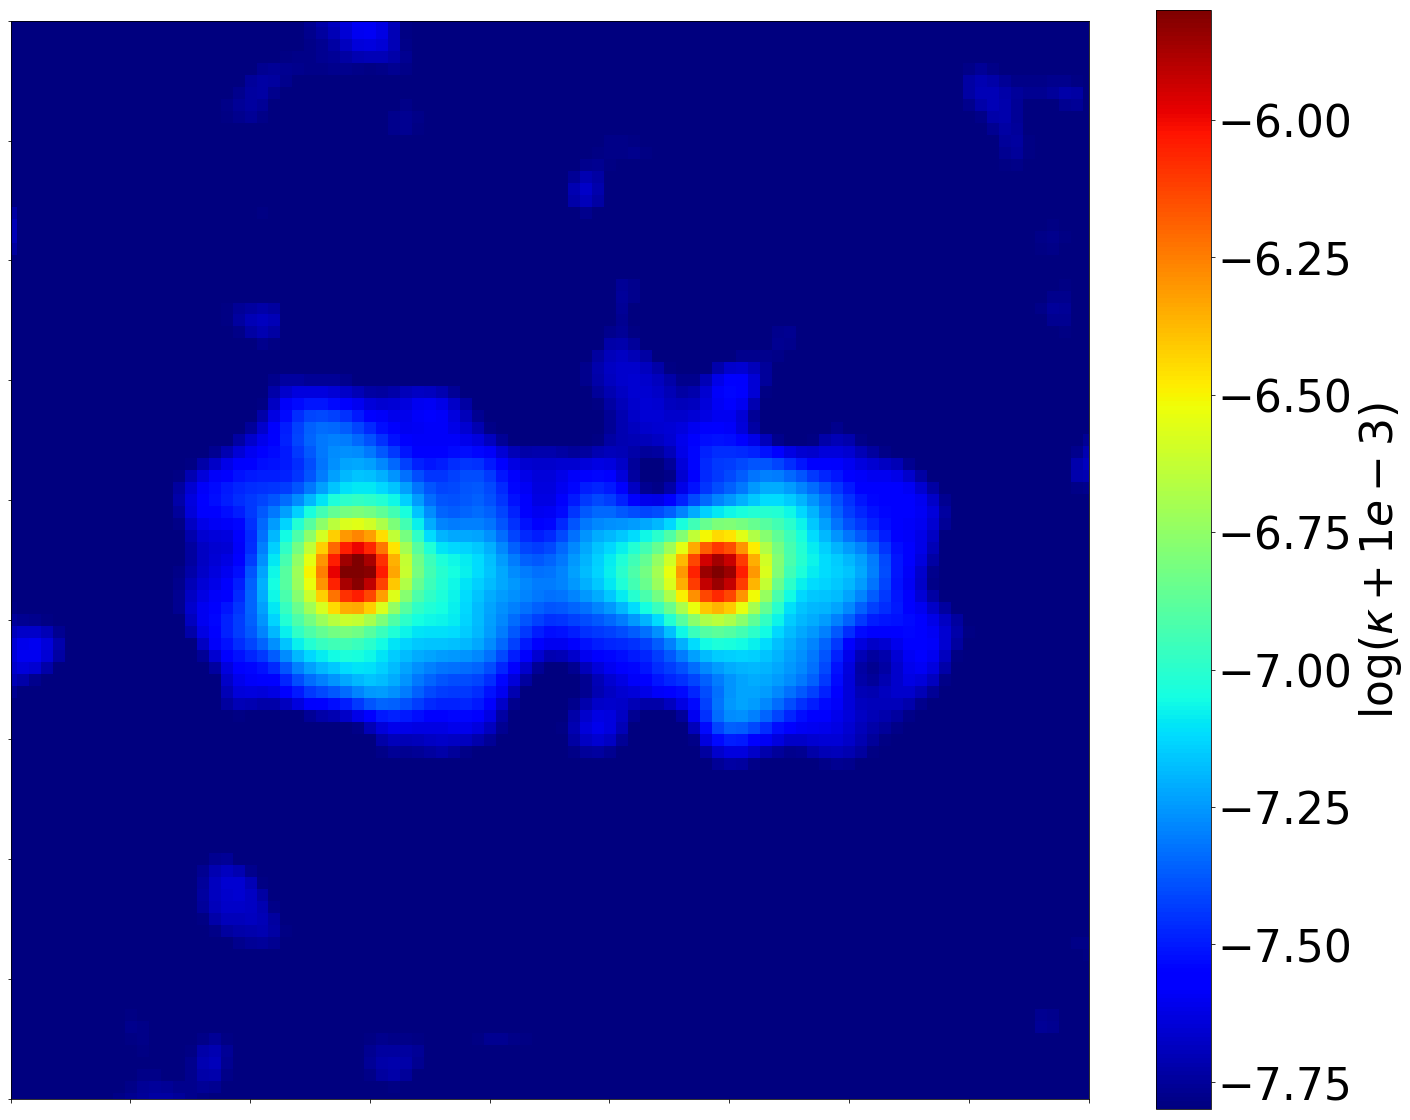 Figure 14
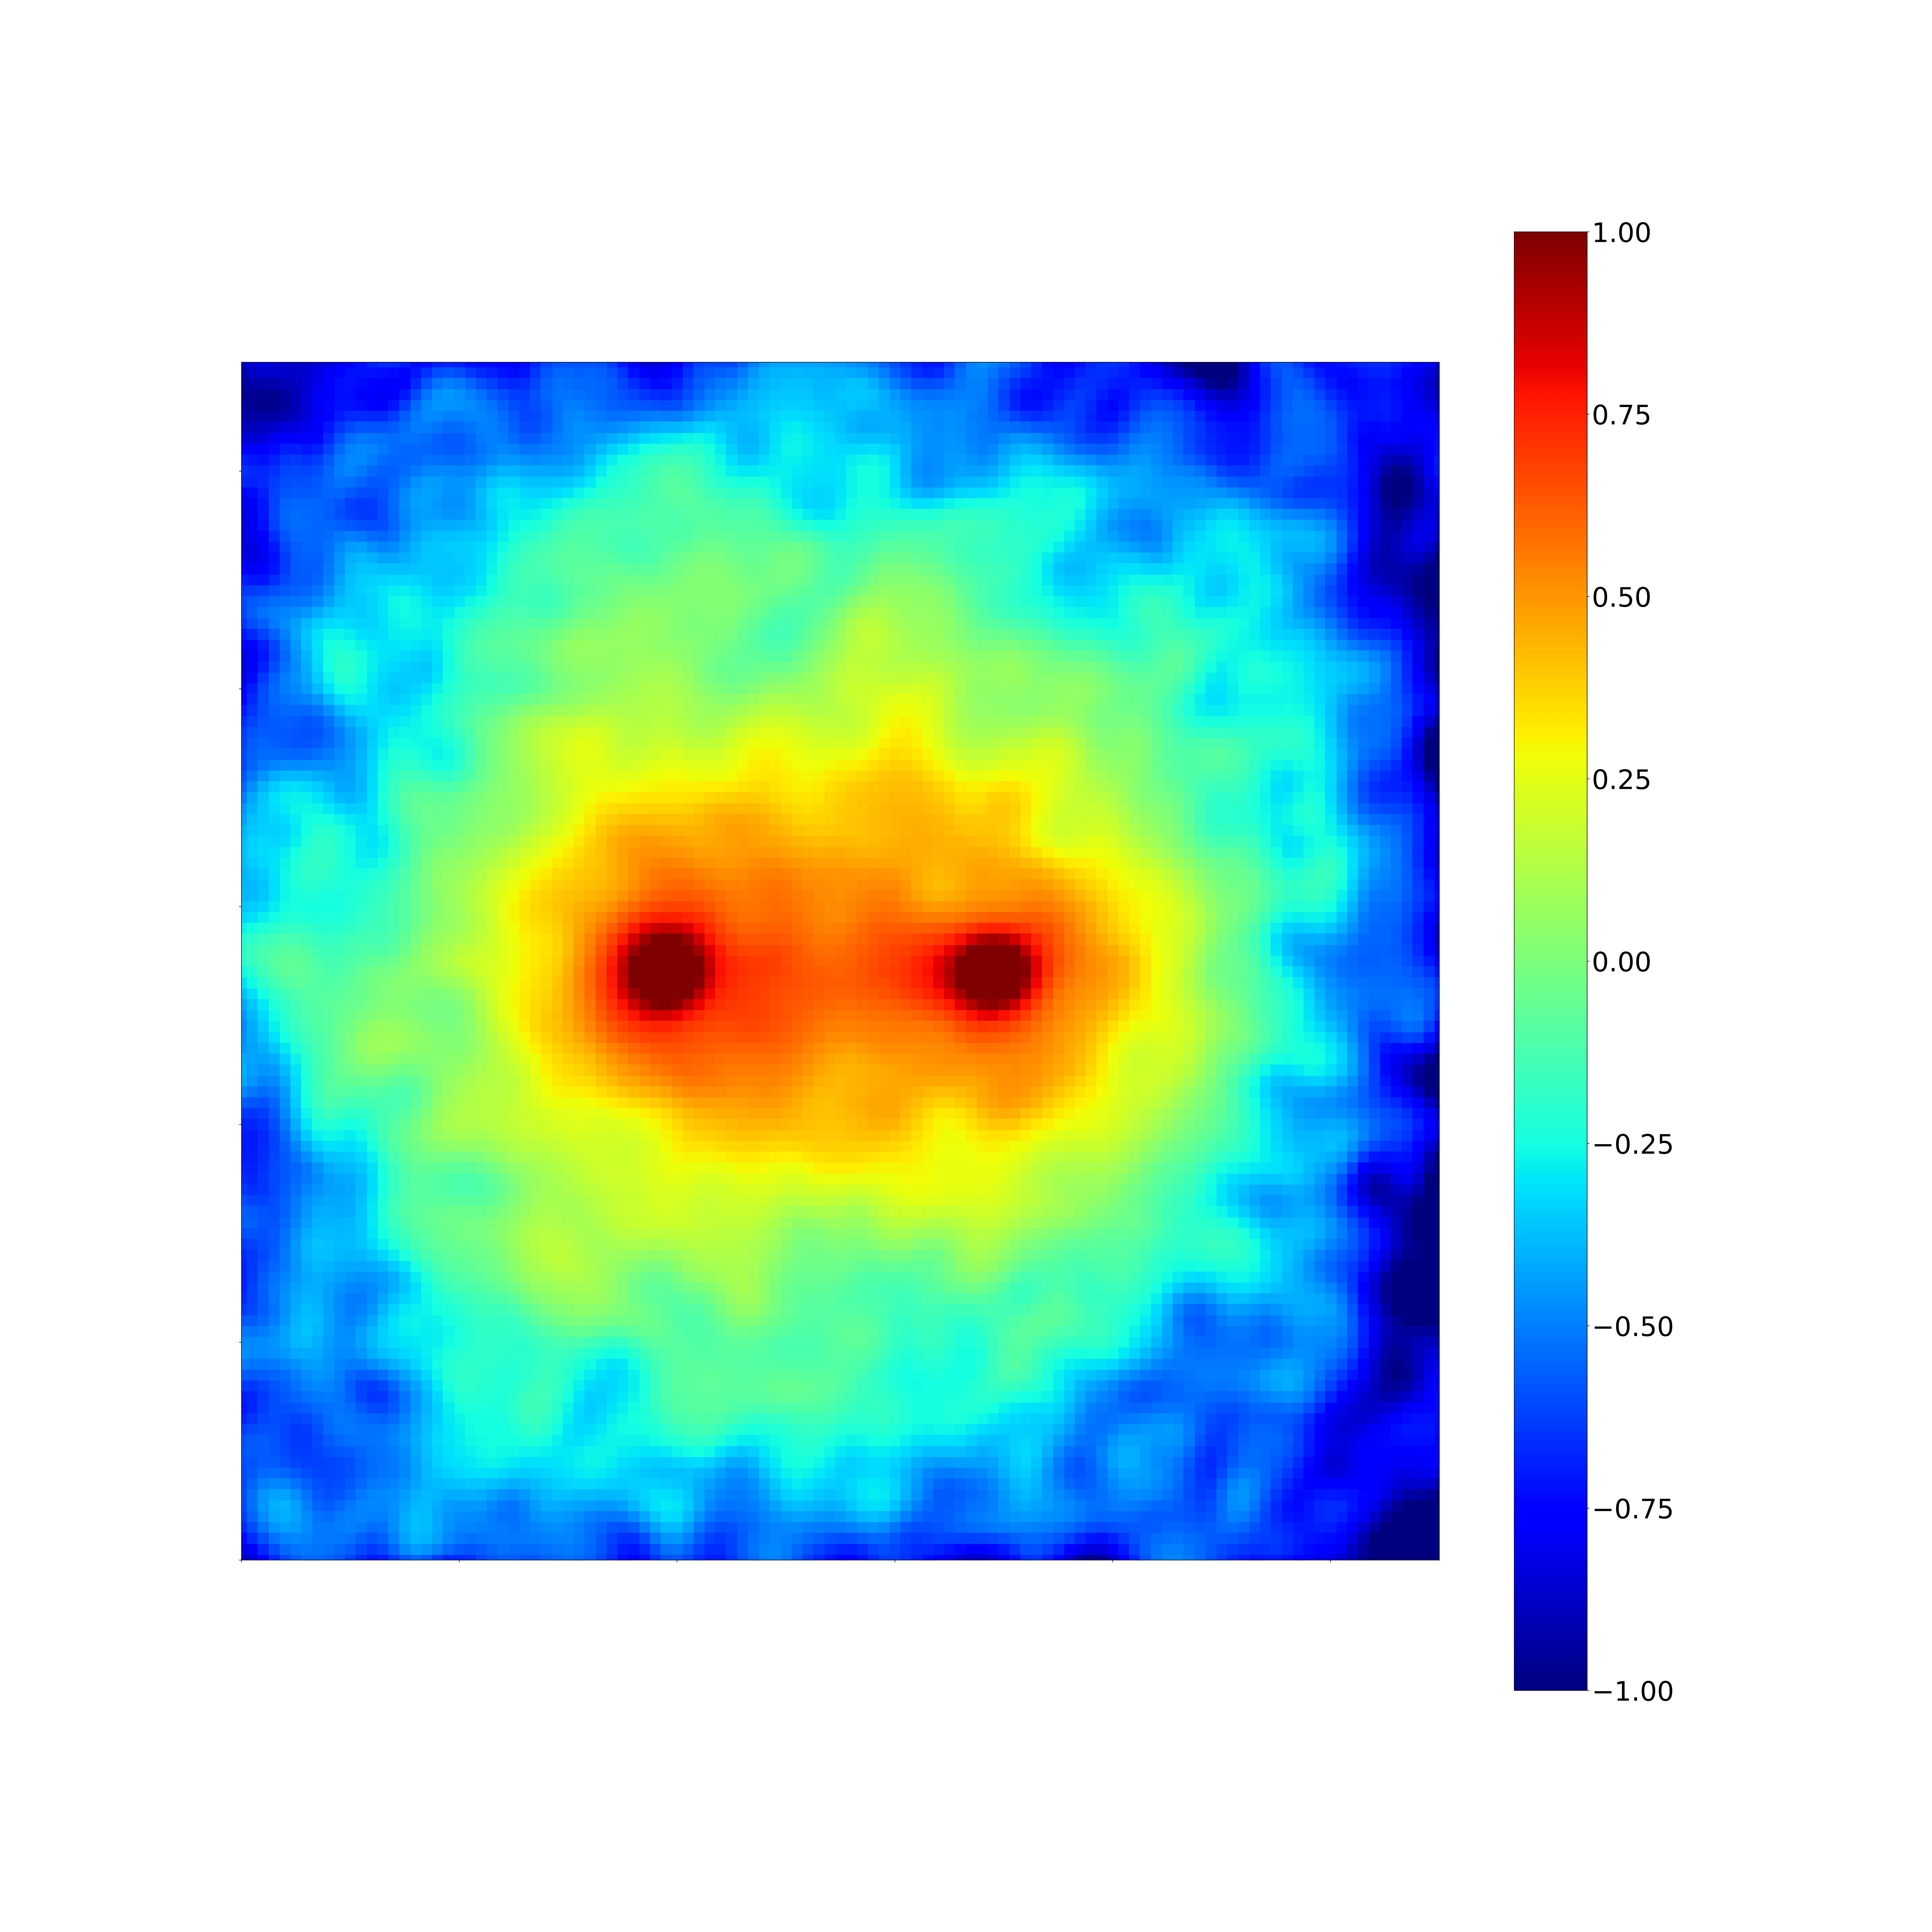 Figure 15
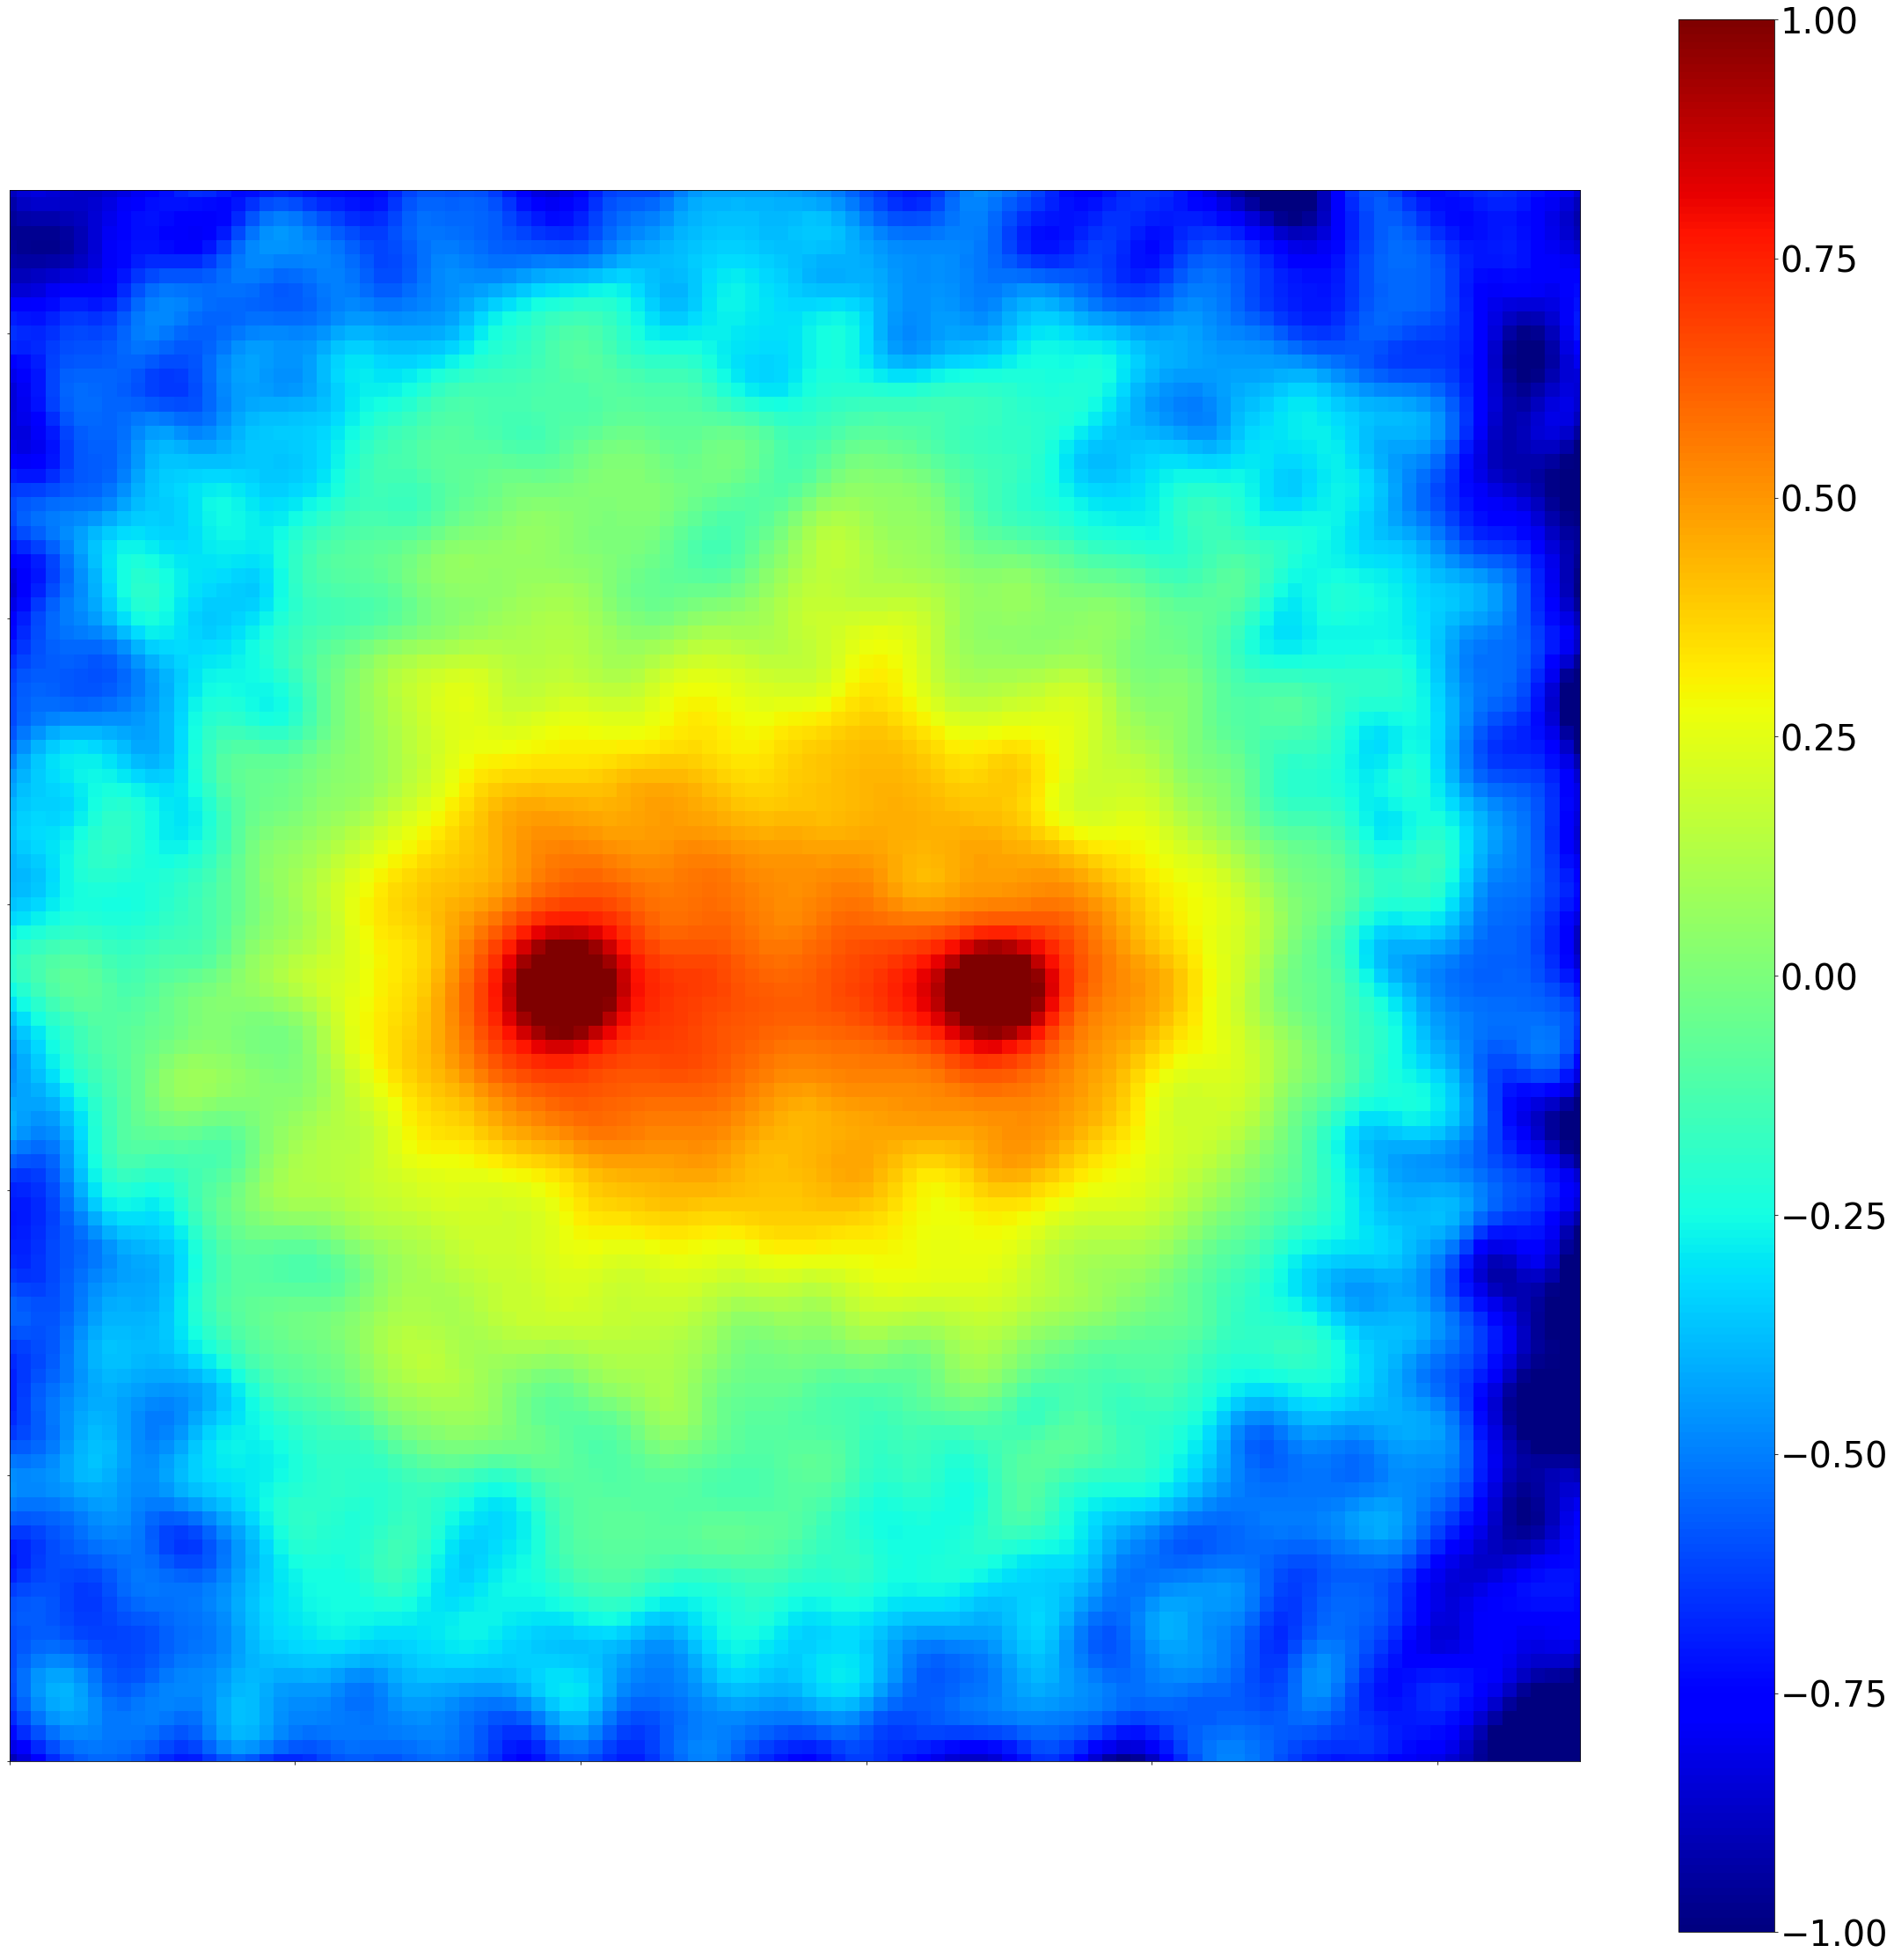 Figure 16
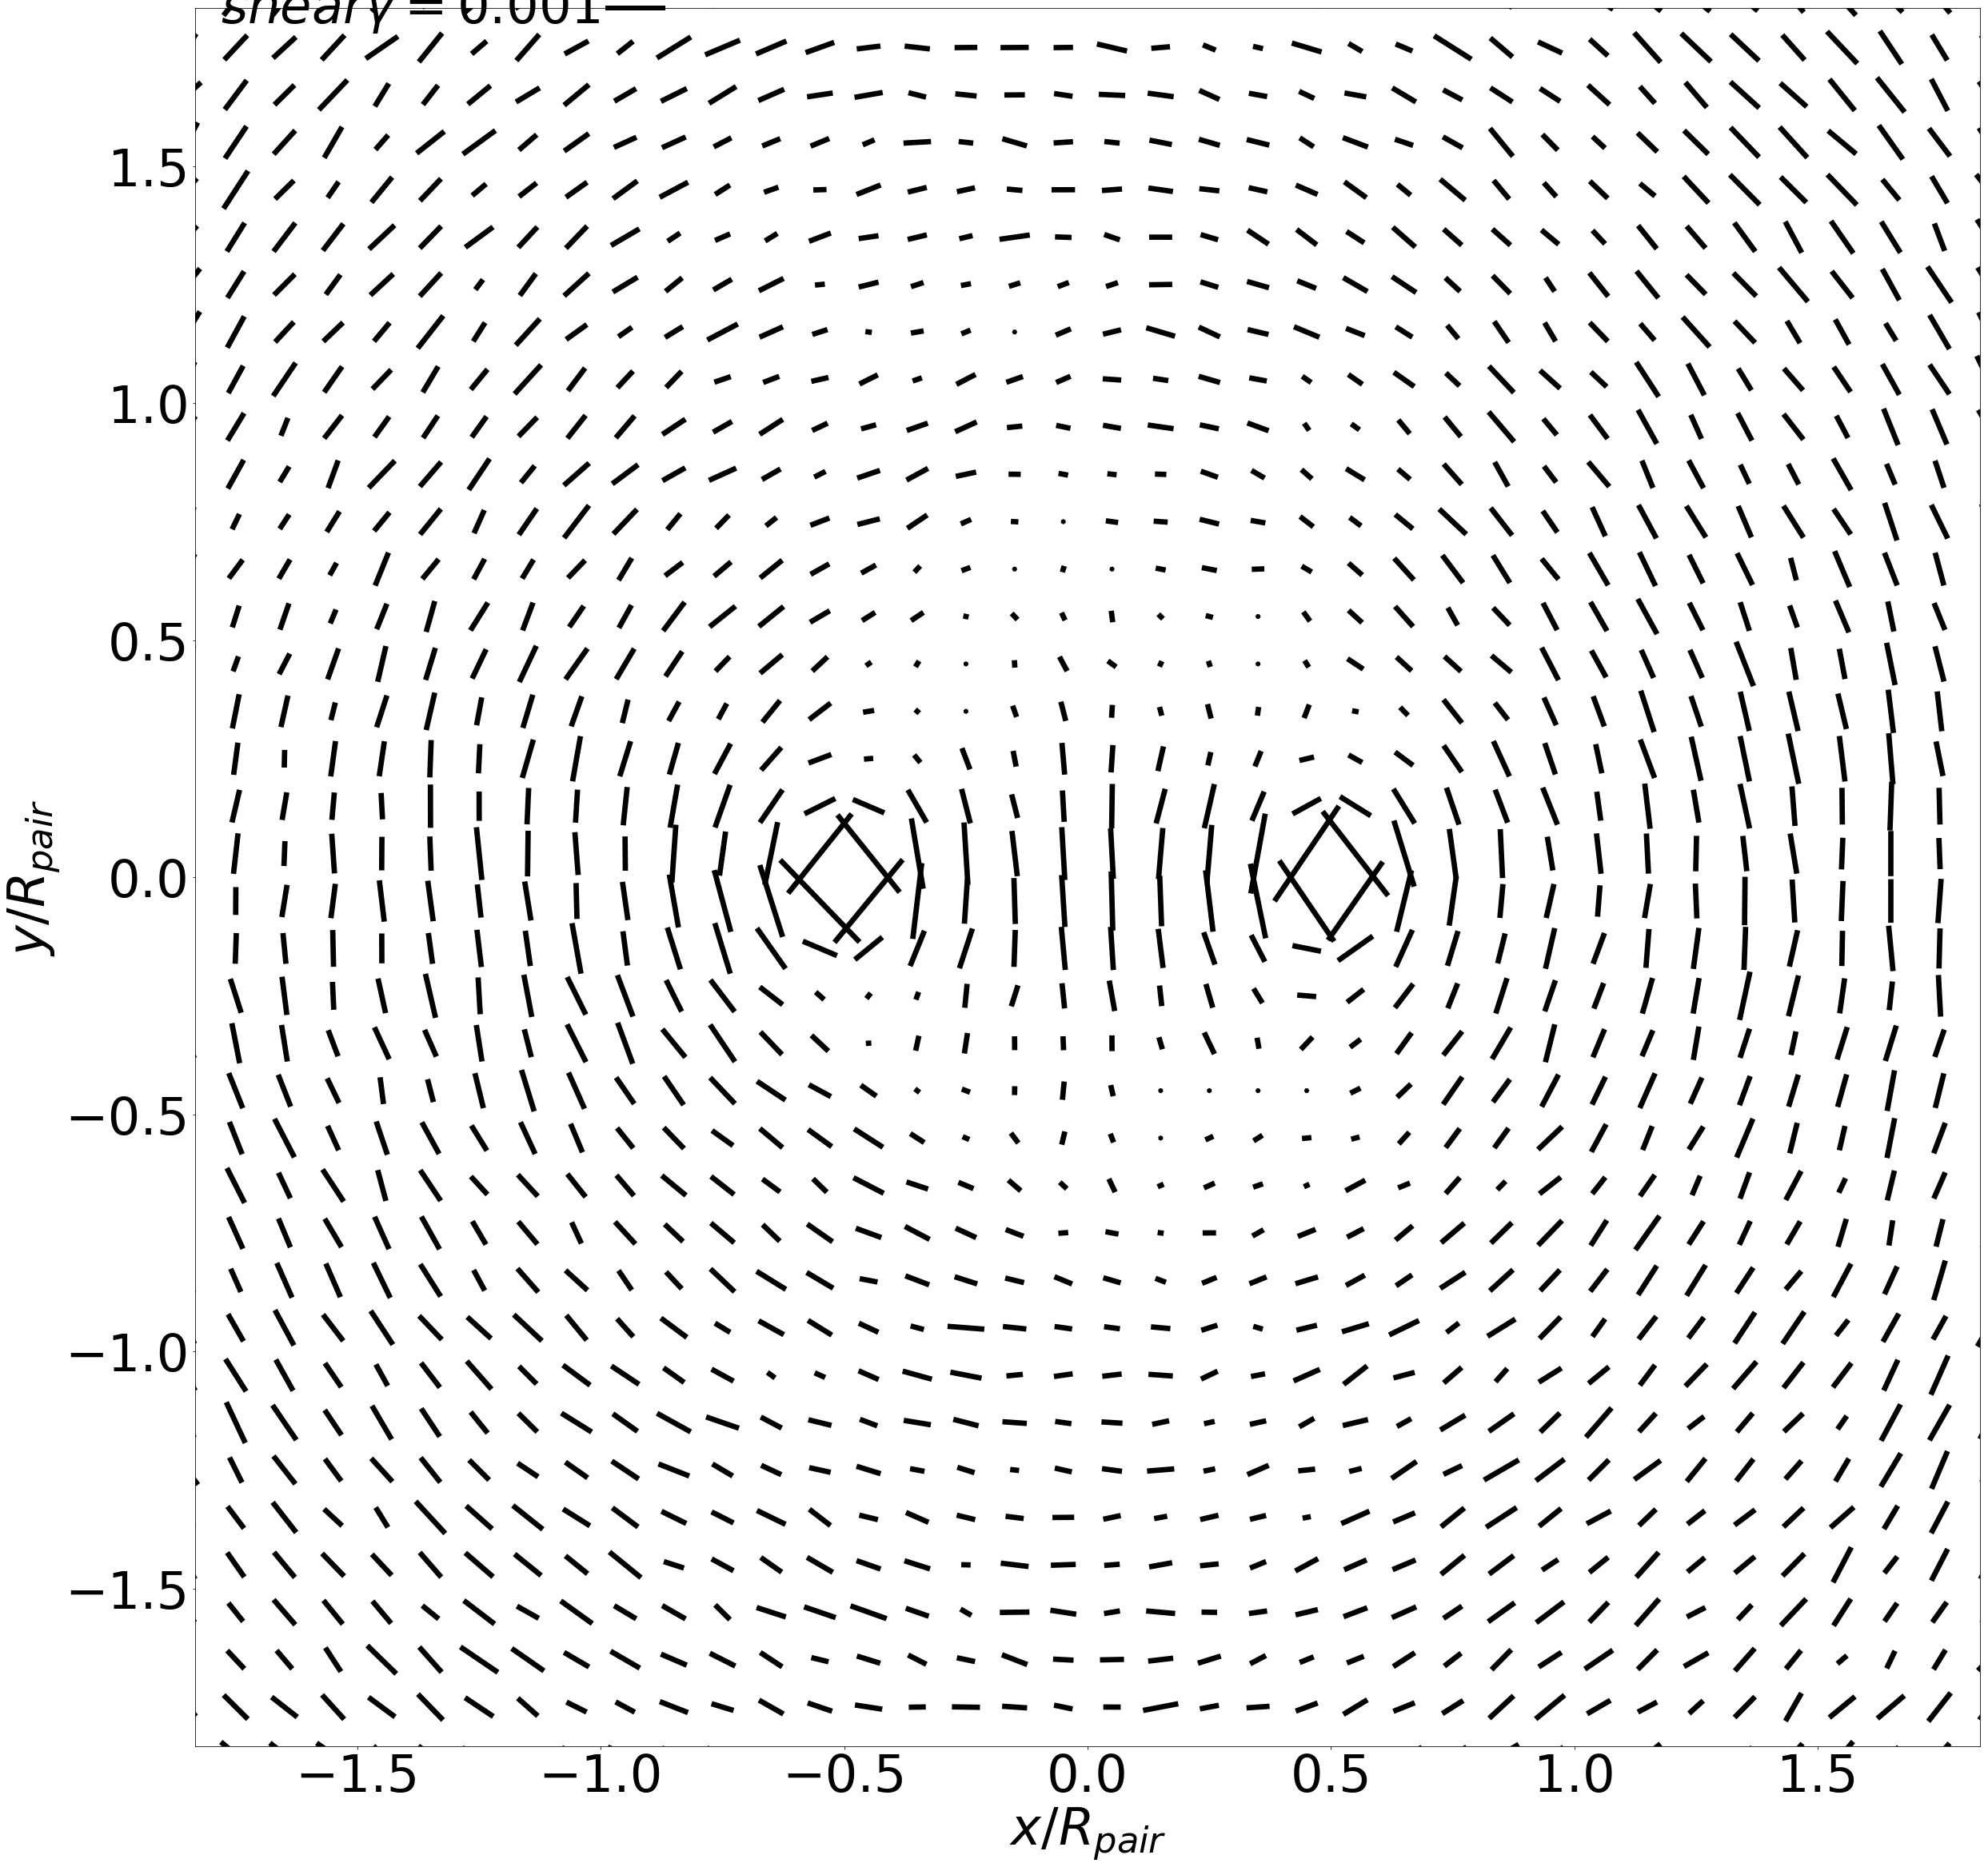 Figure 17
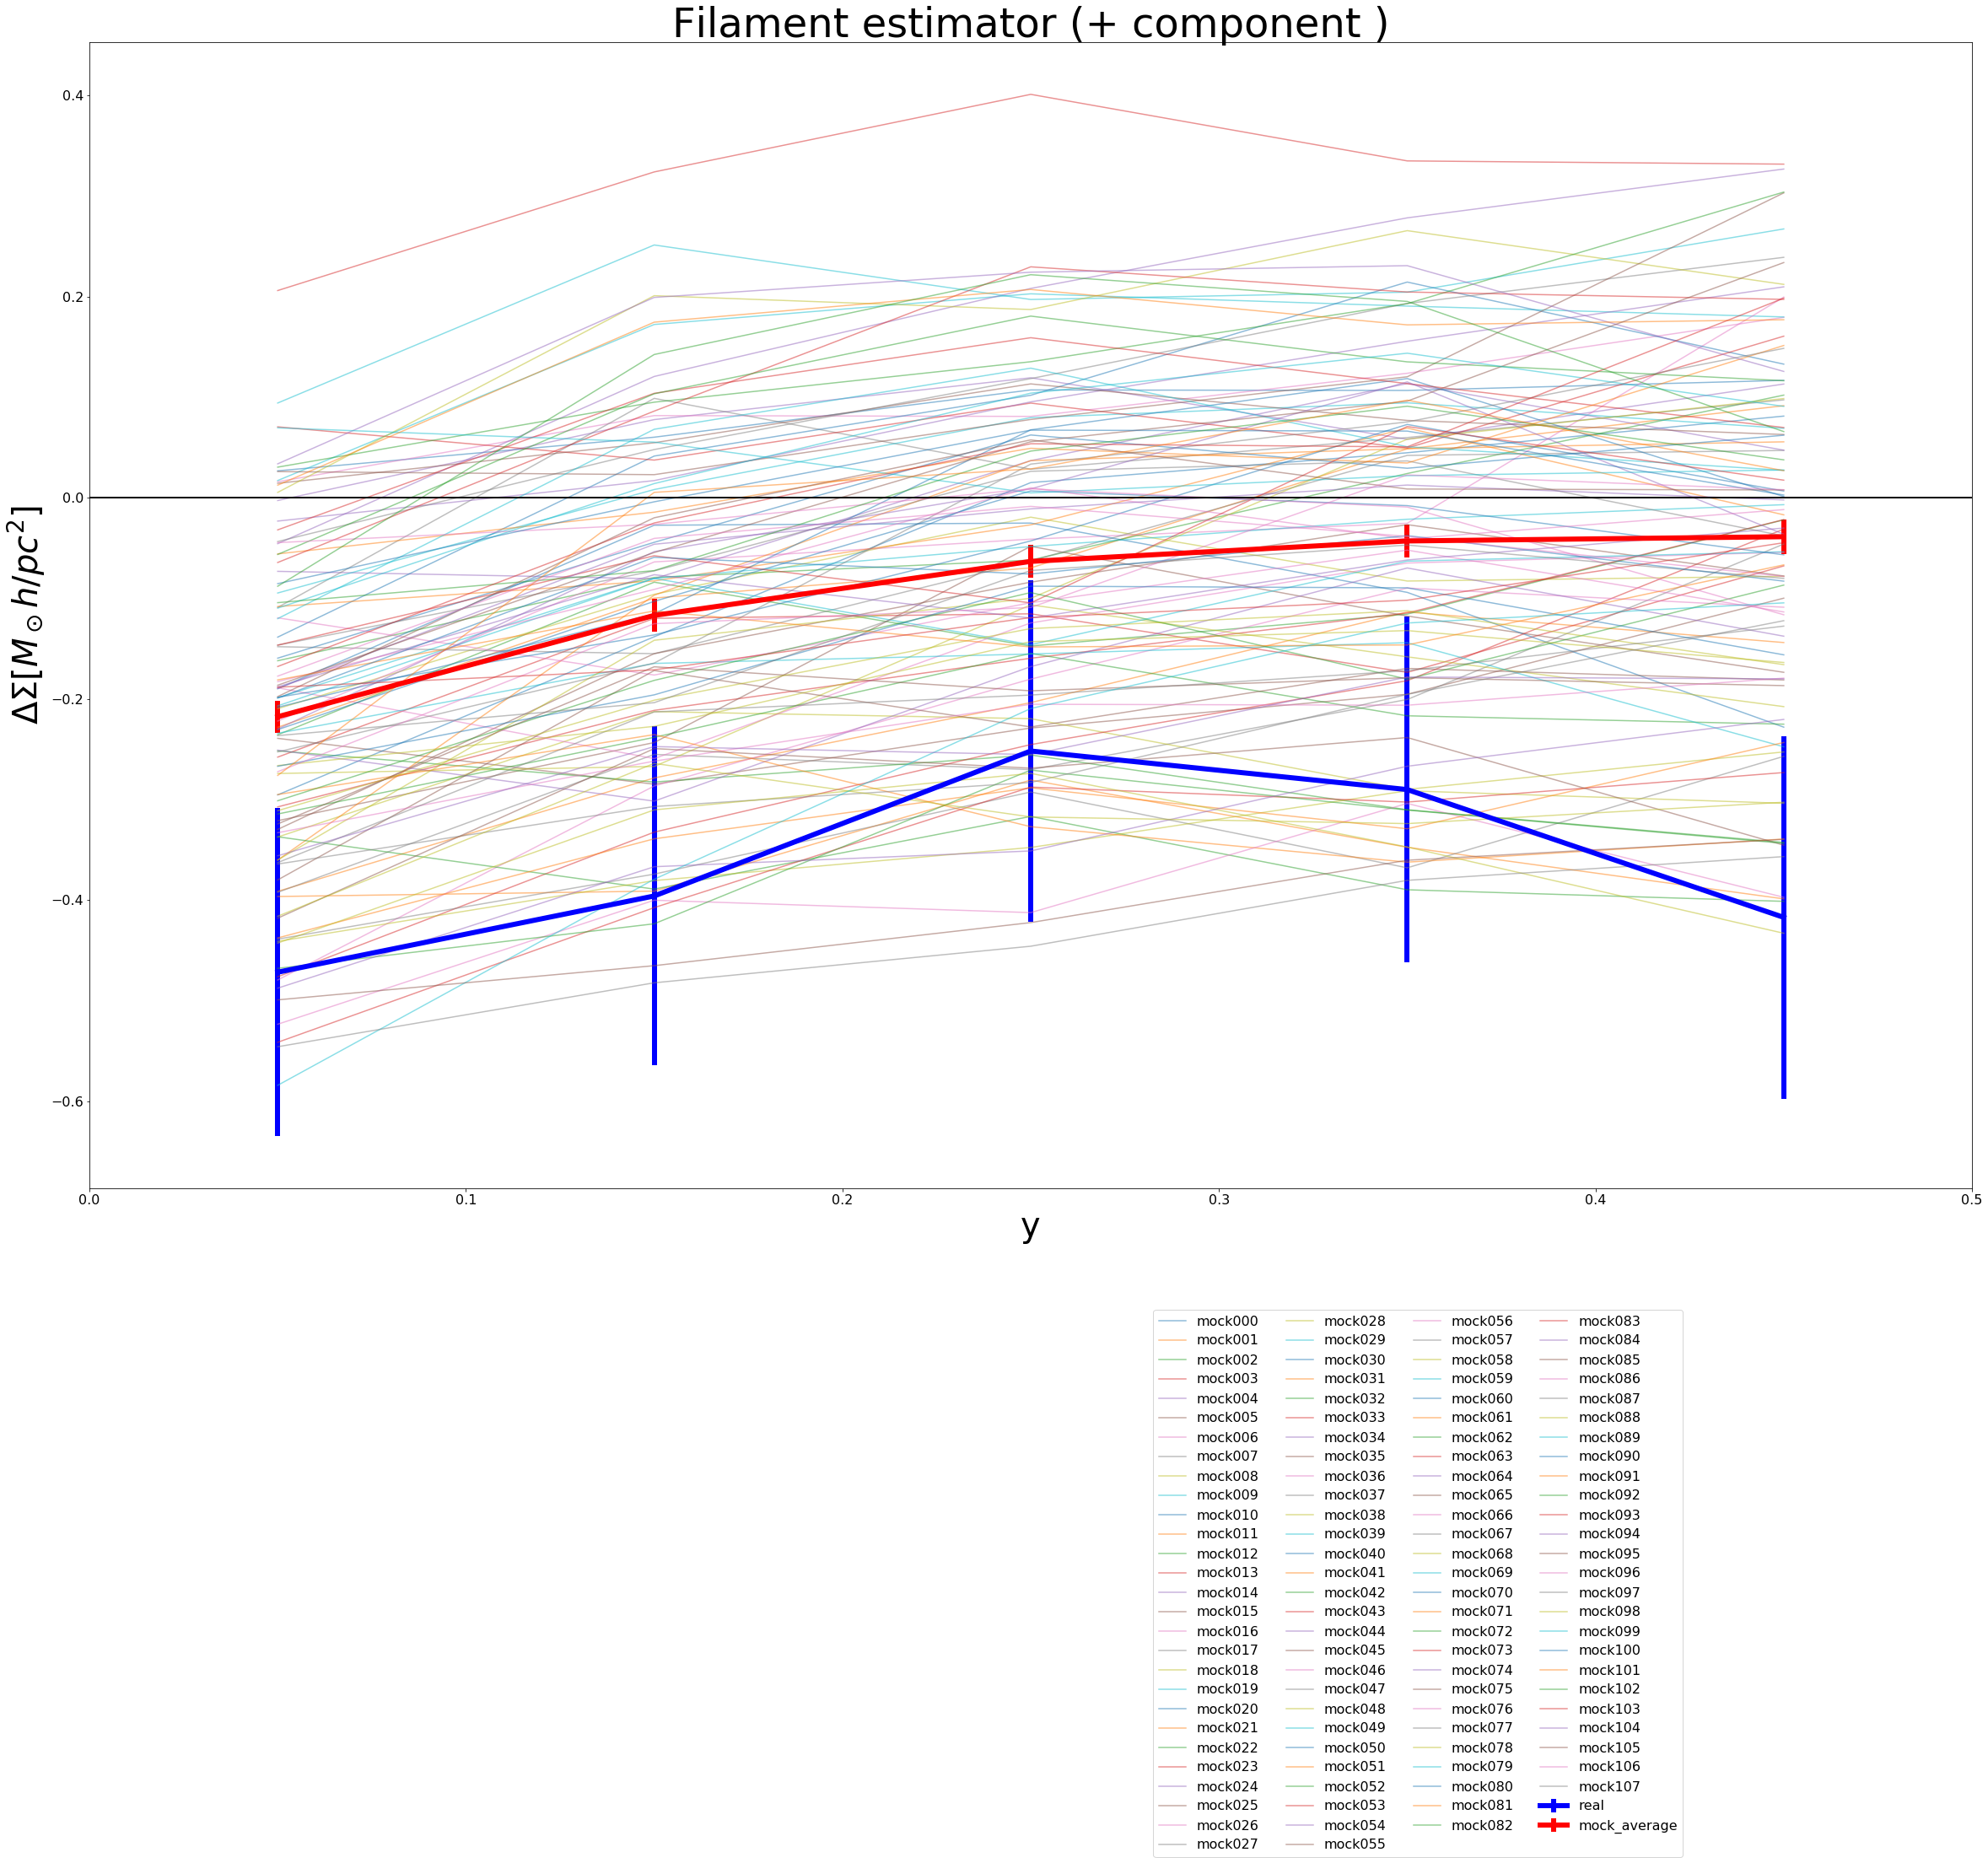 Figure 18
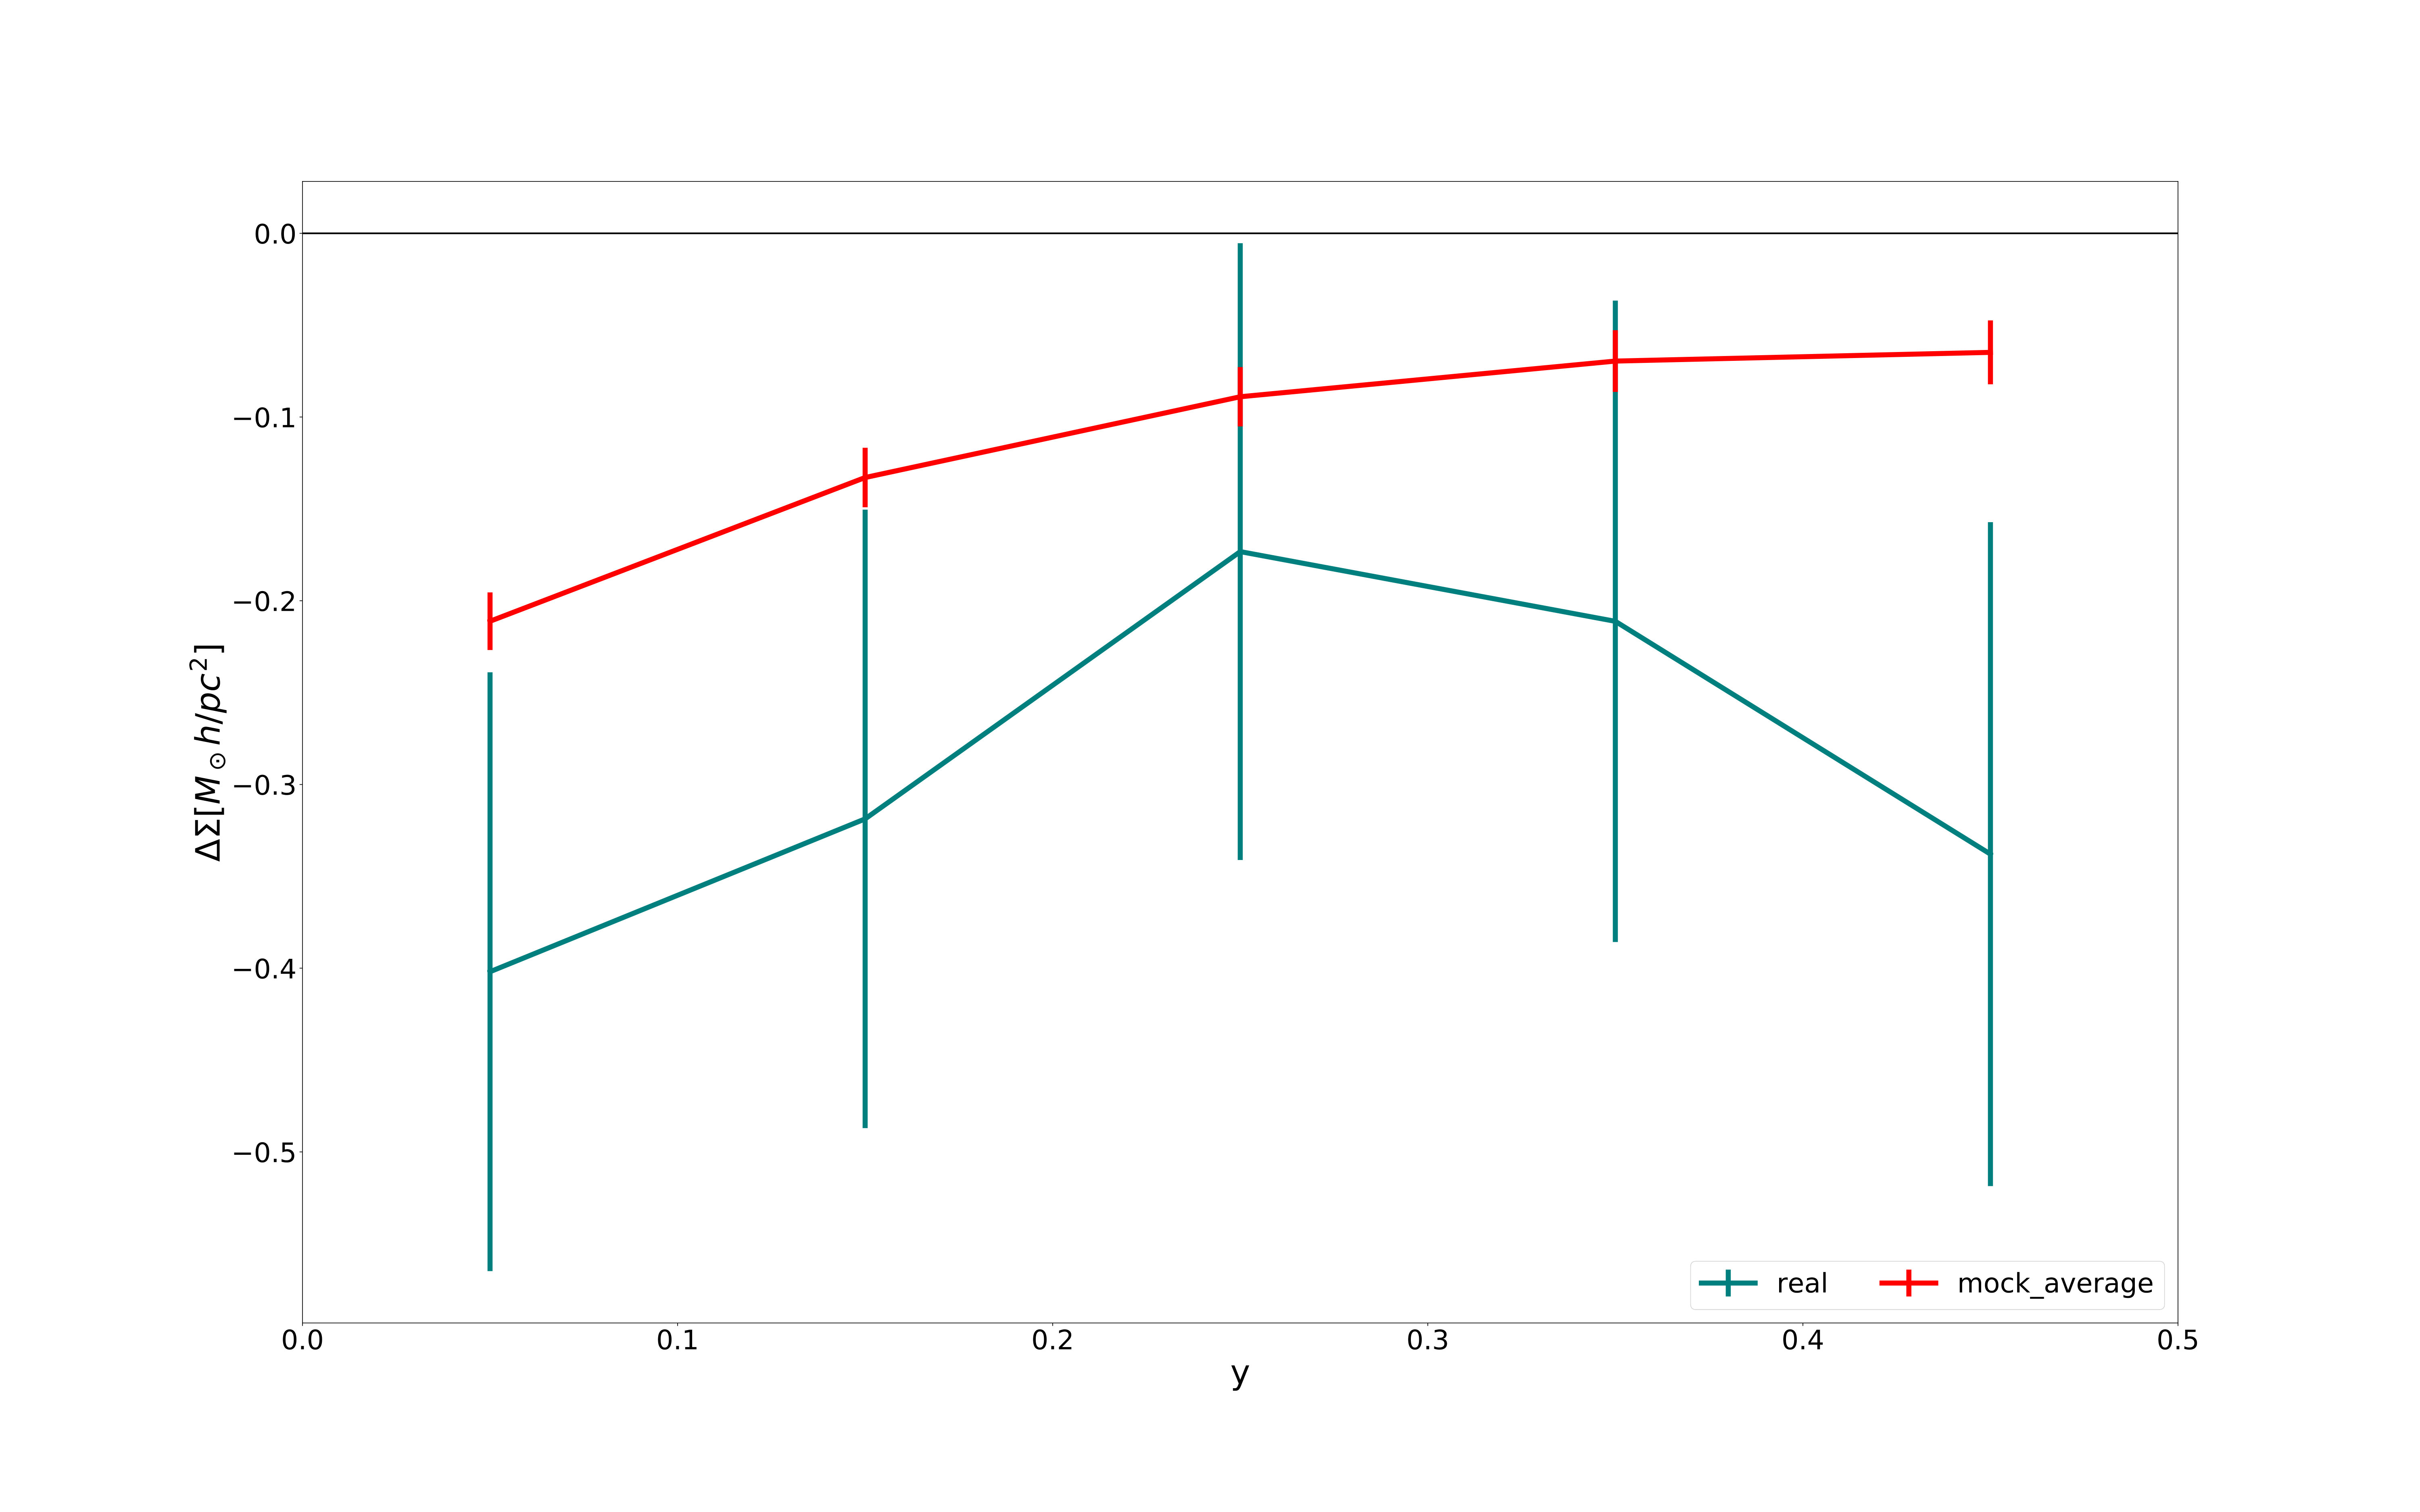 Figure 19
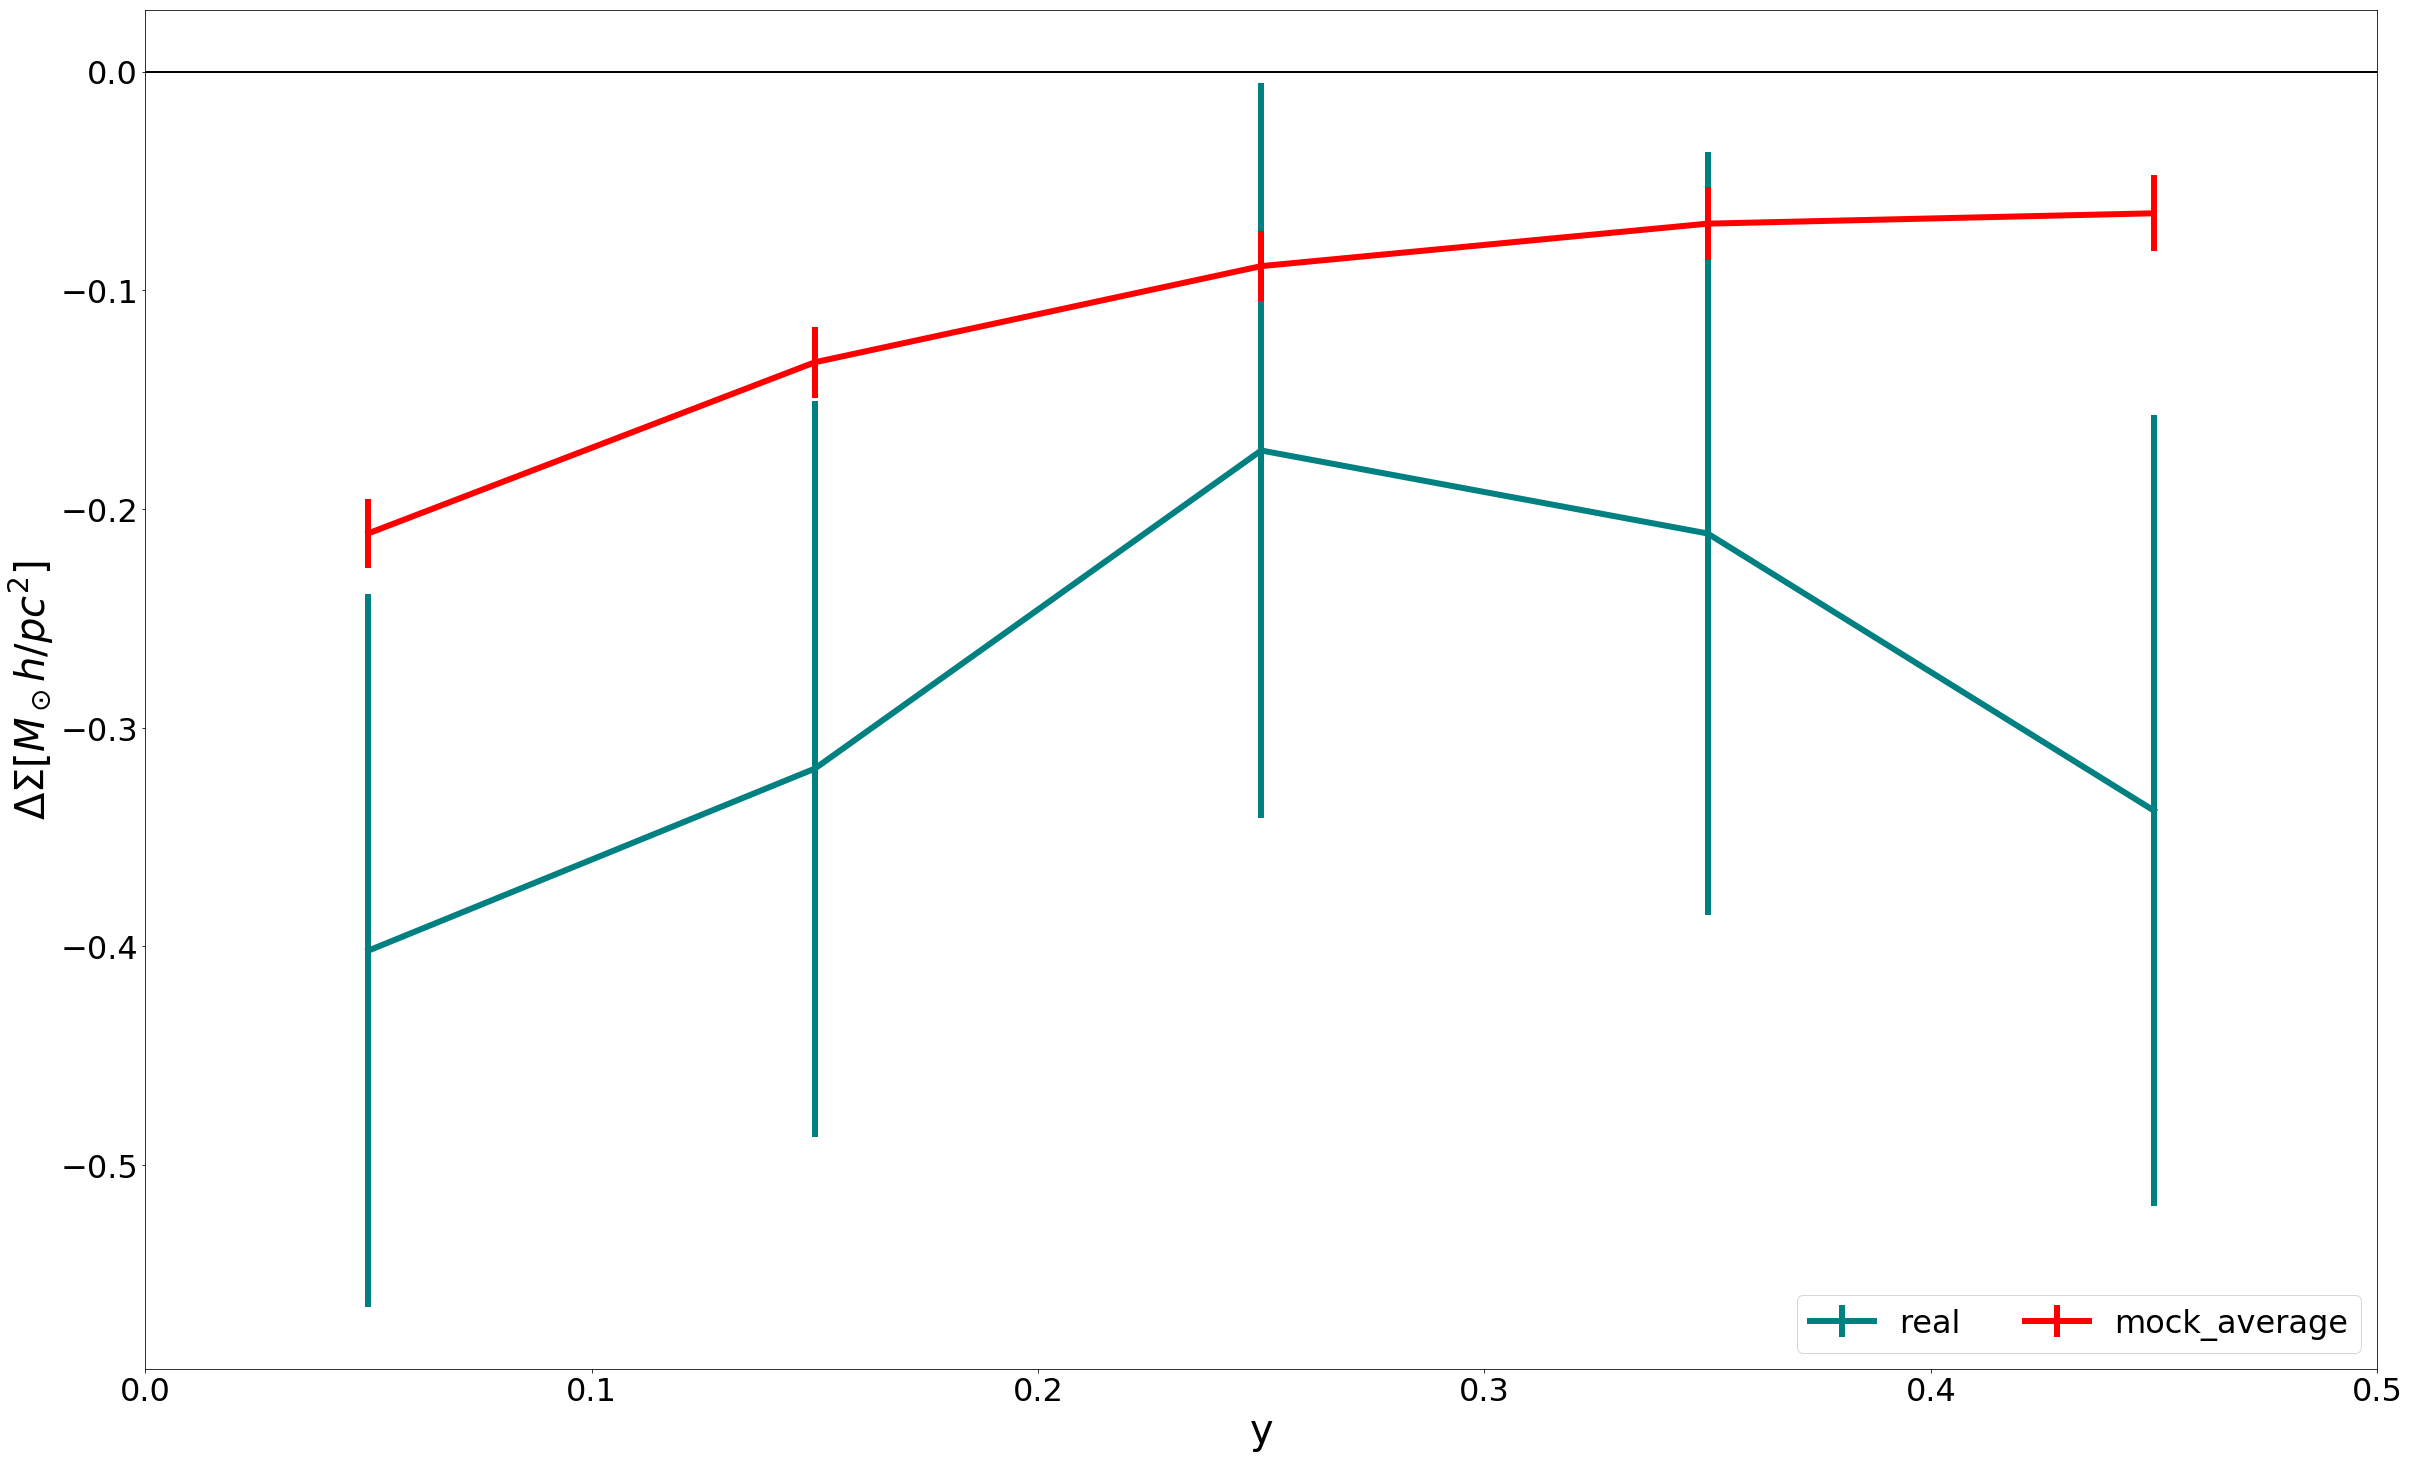 Figure 20
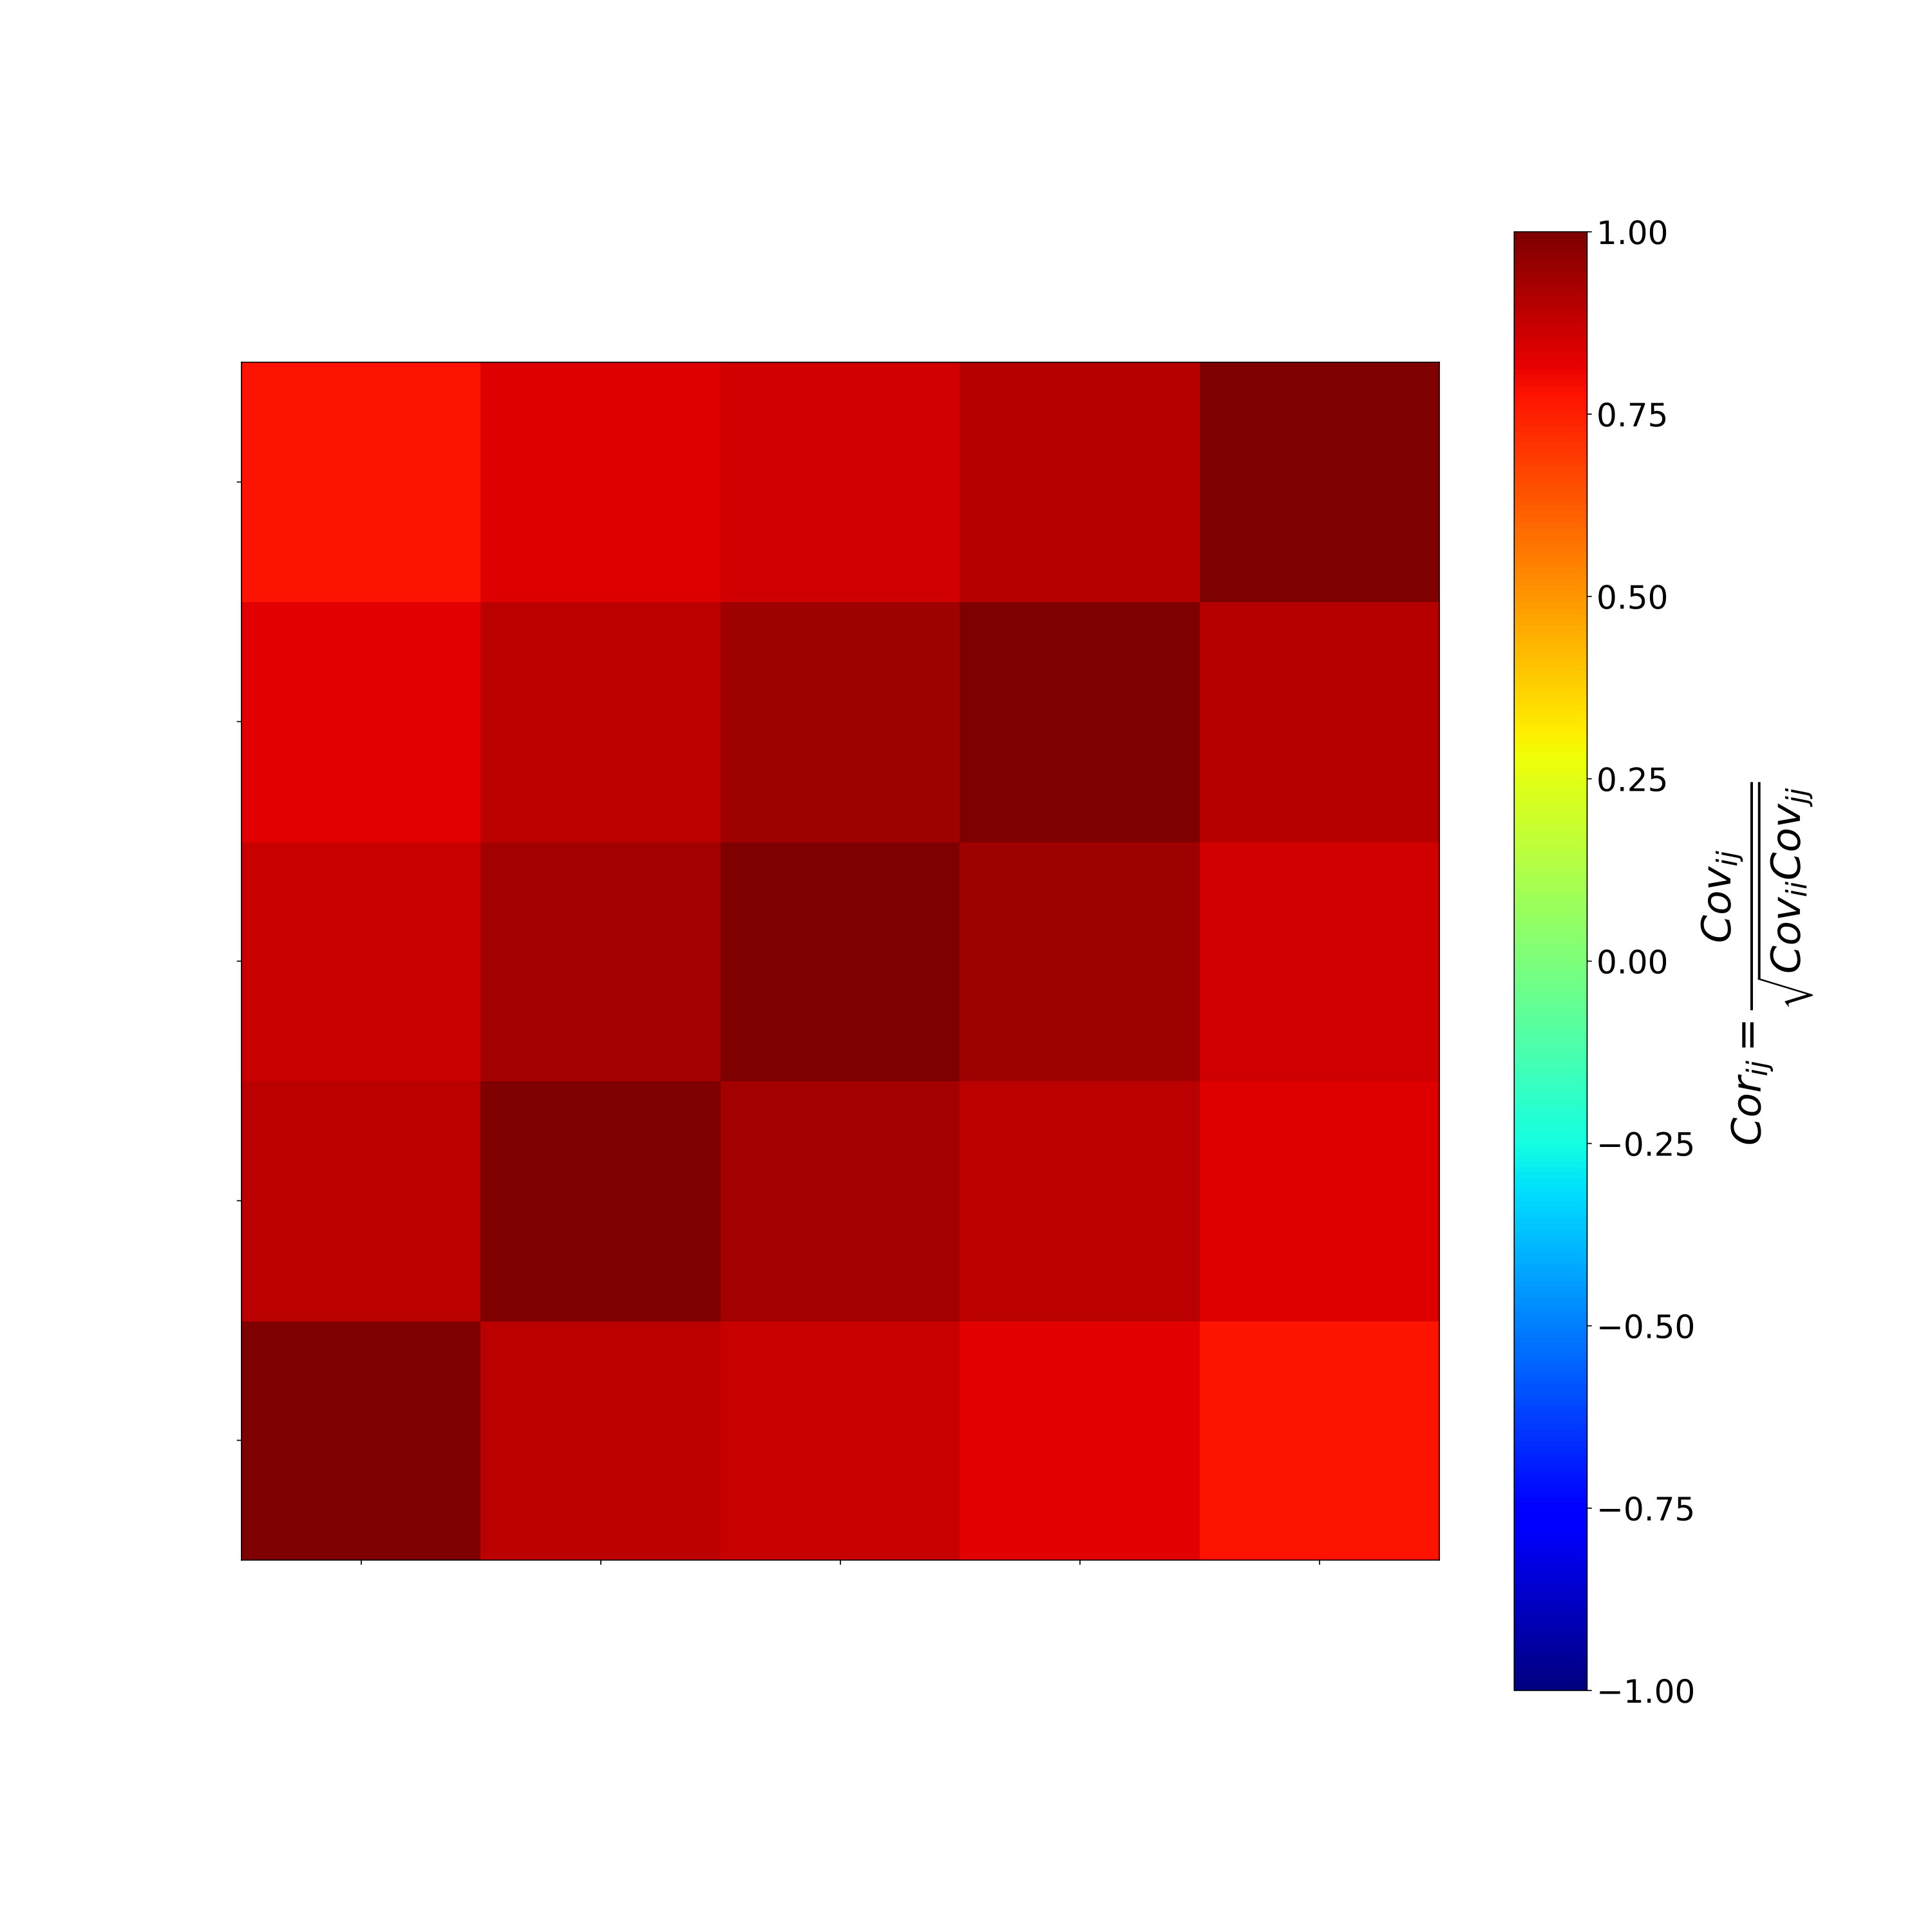 Figure 21
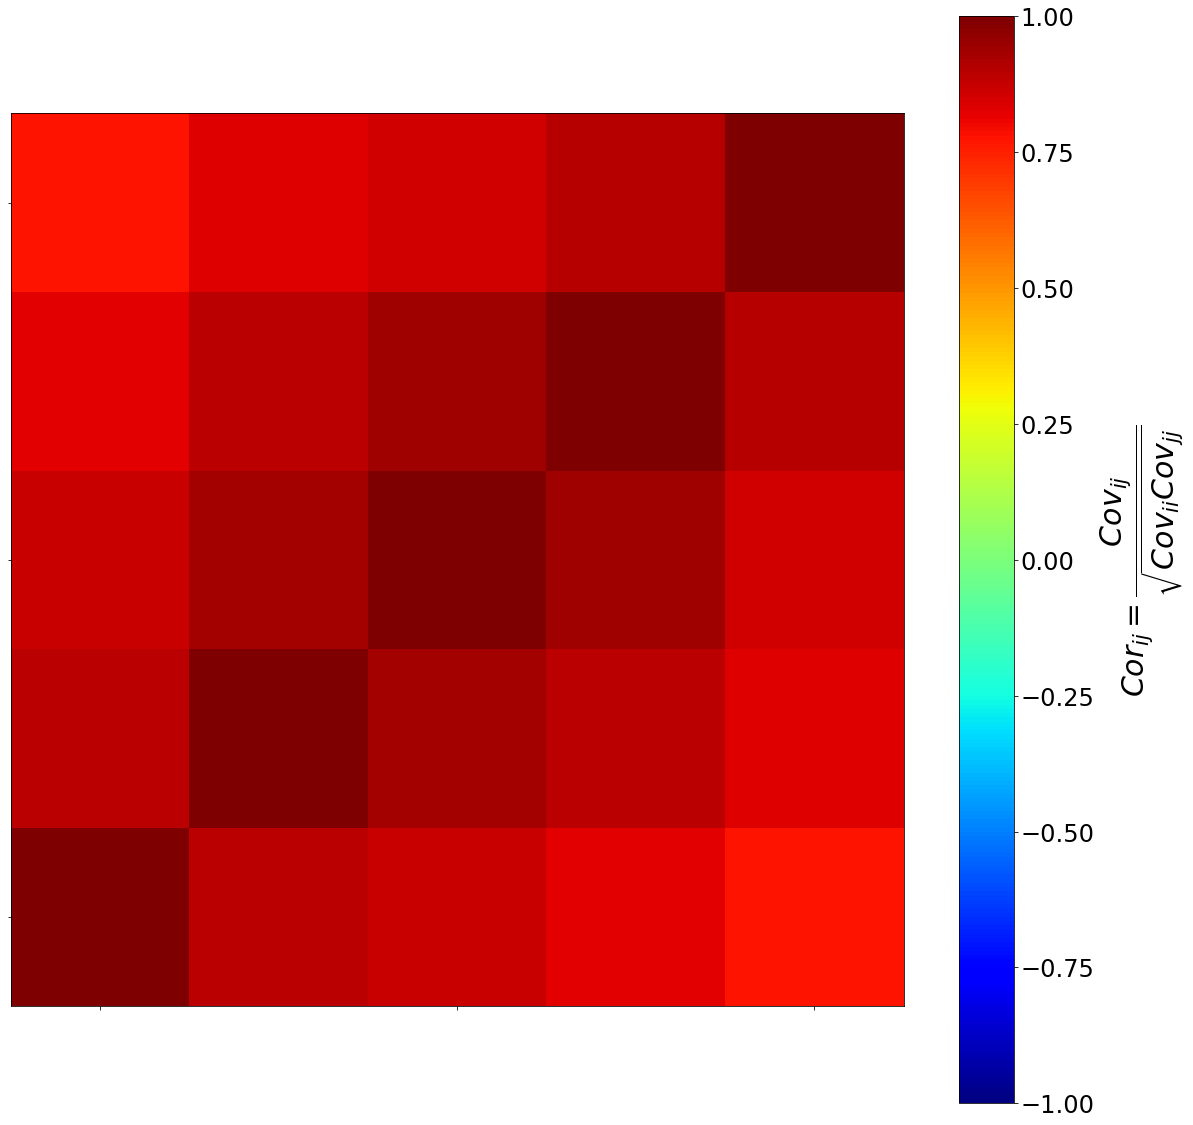 Figure 22
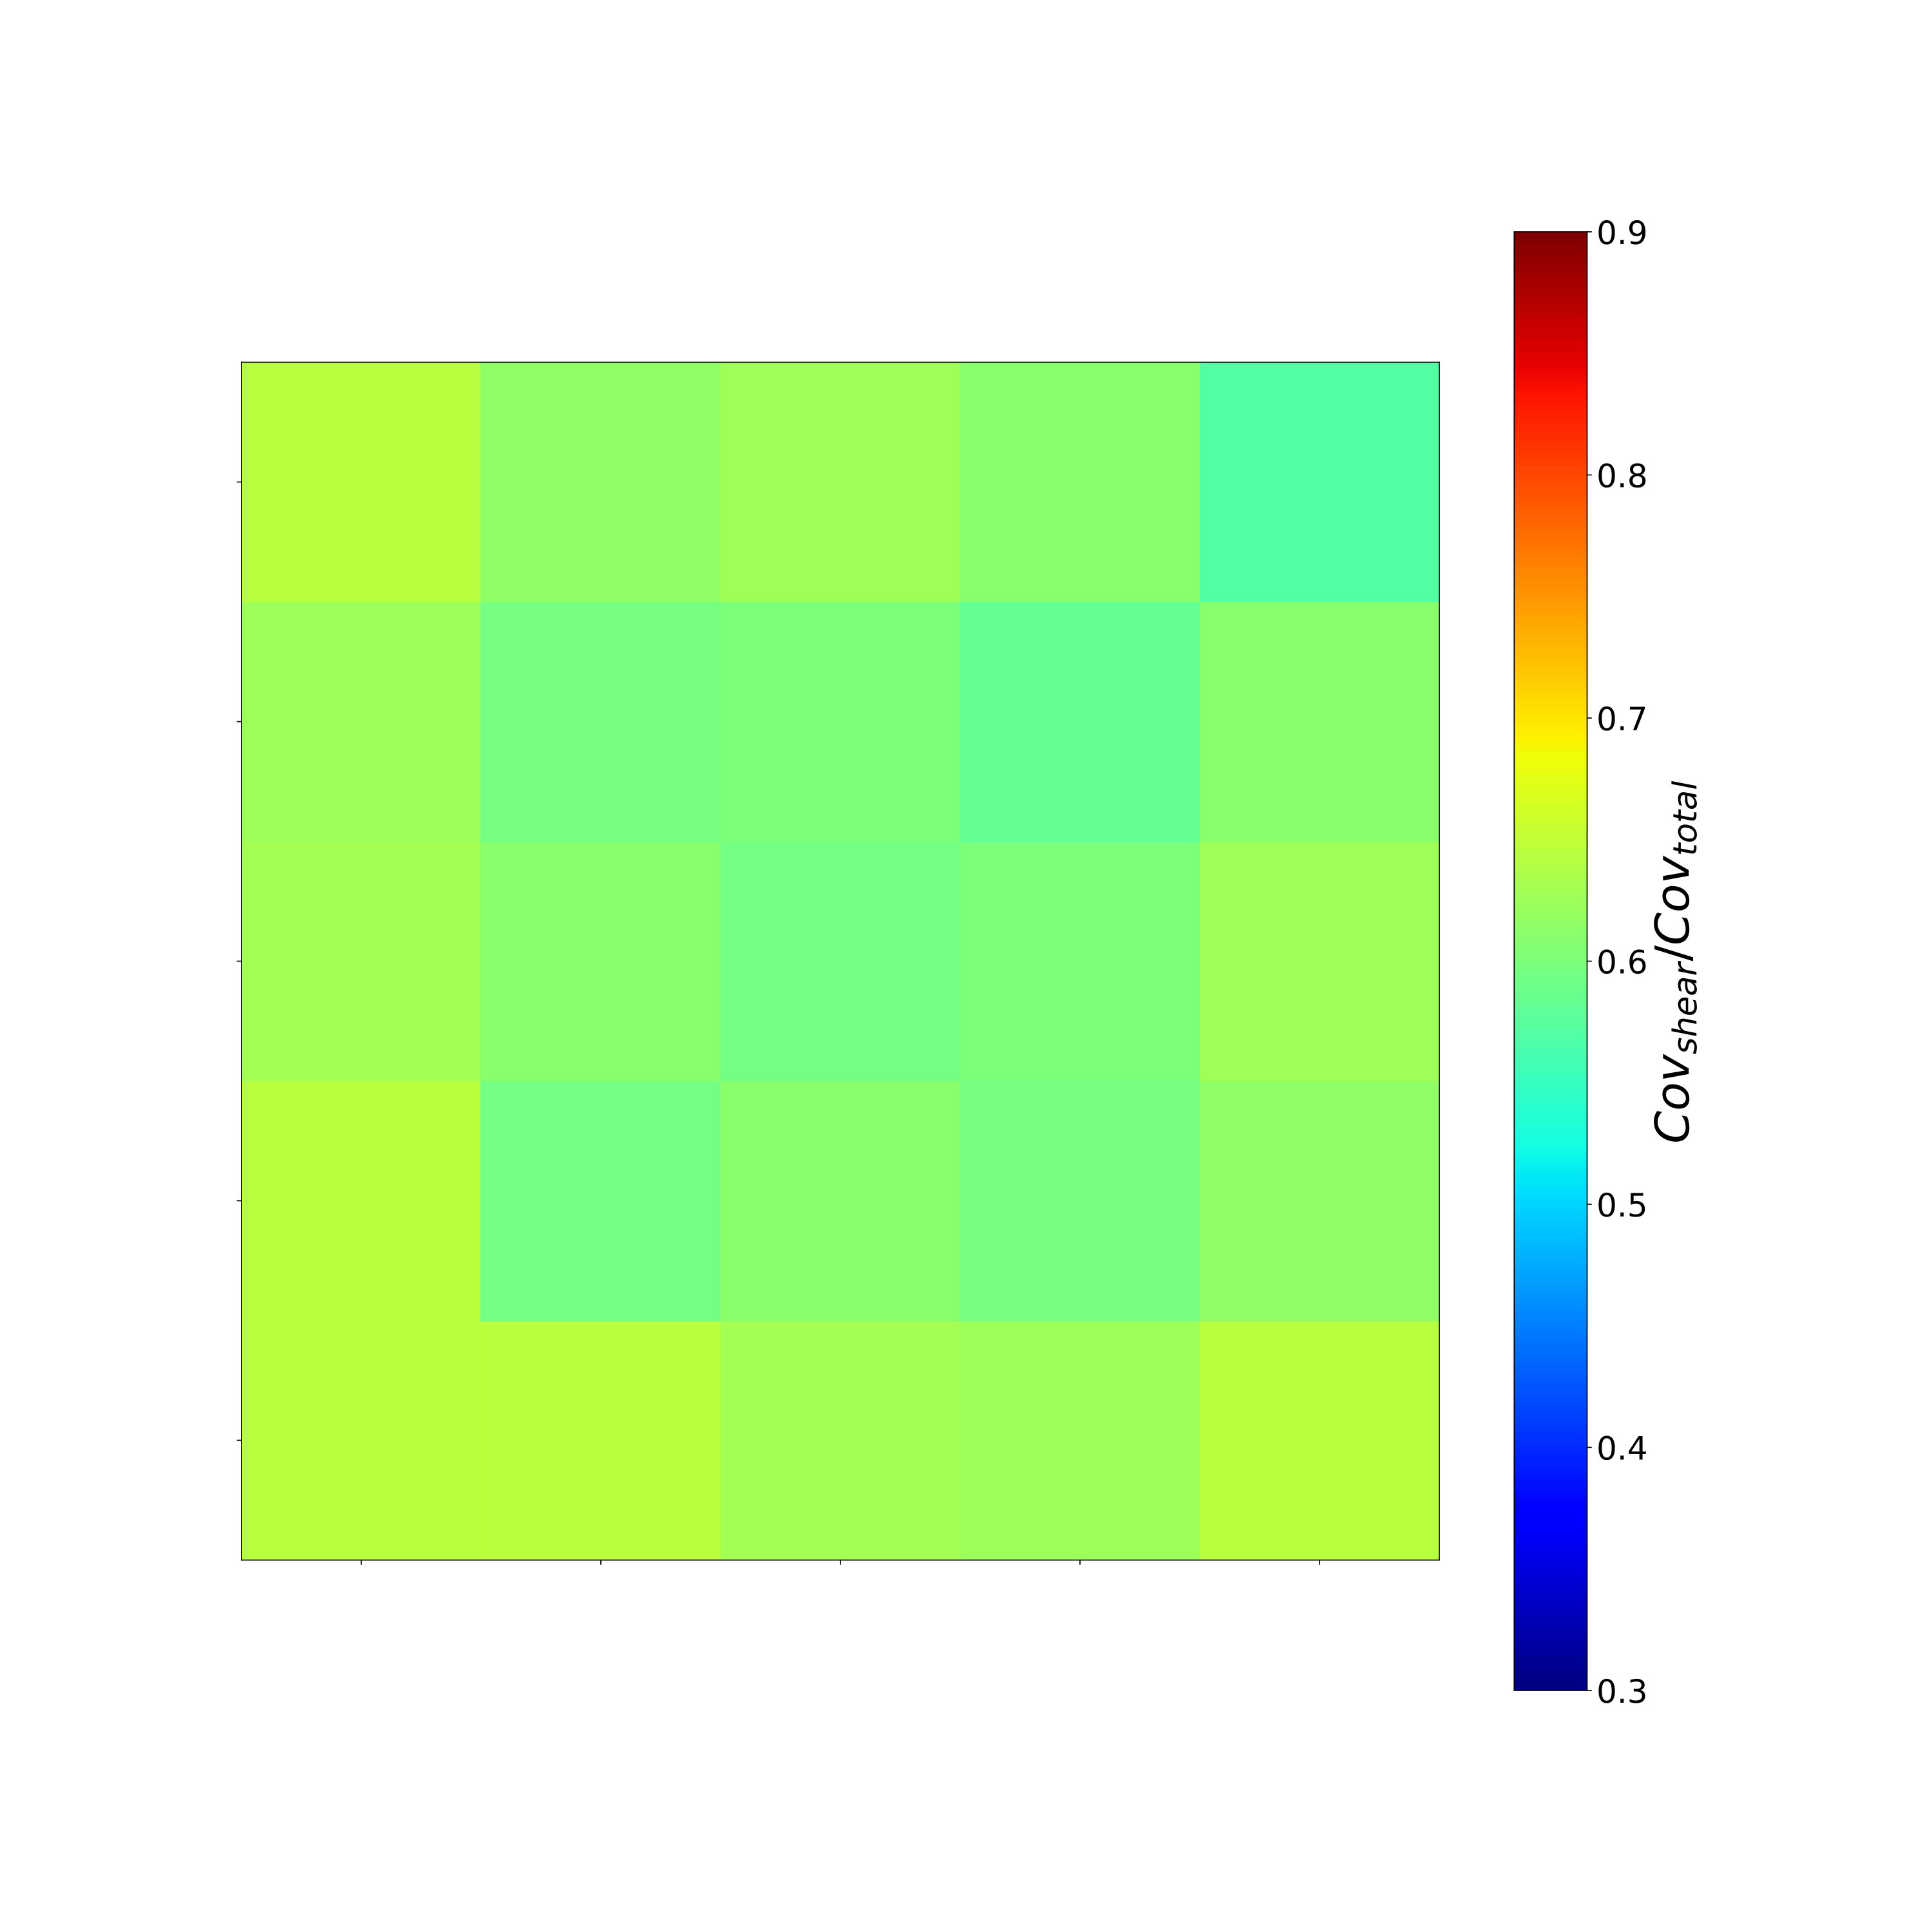 Figure 23
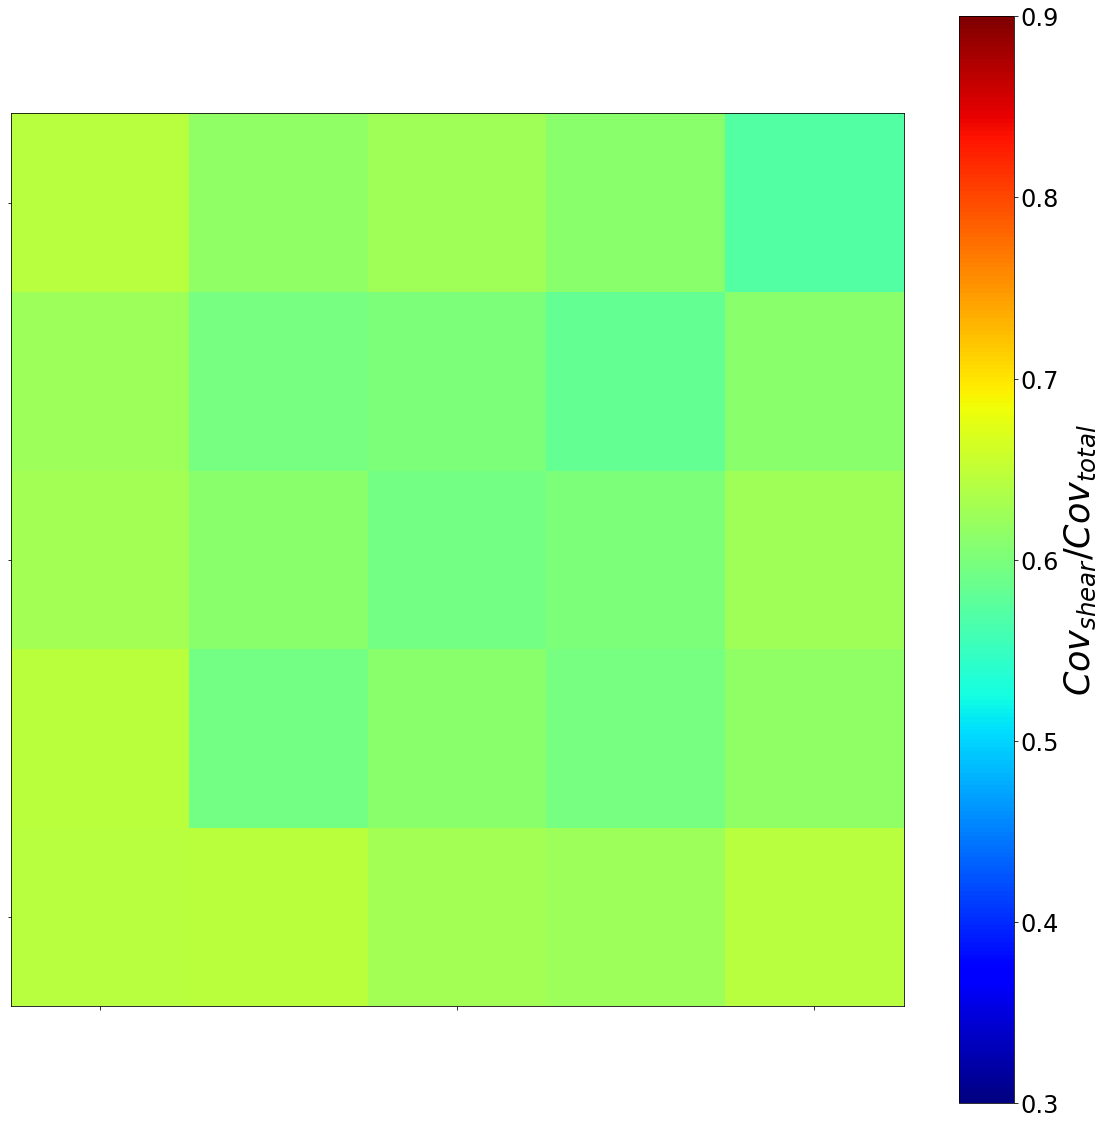 Figure 24
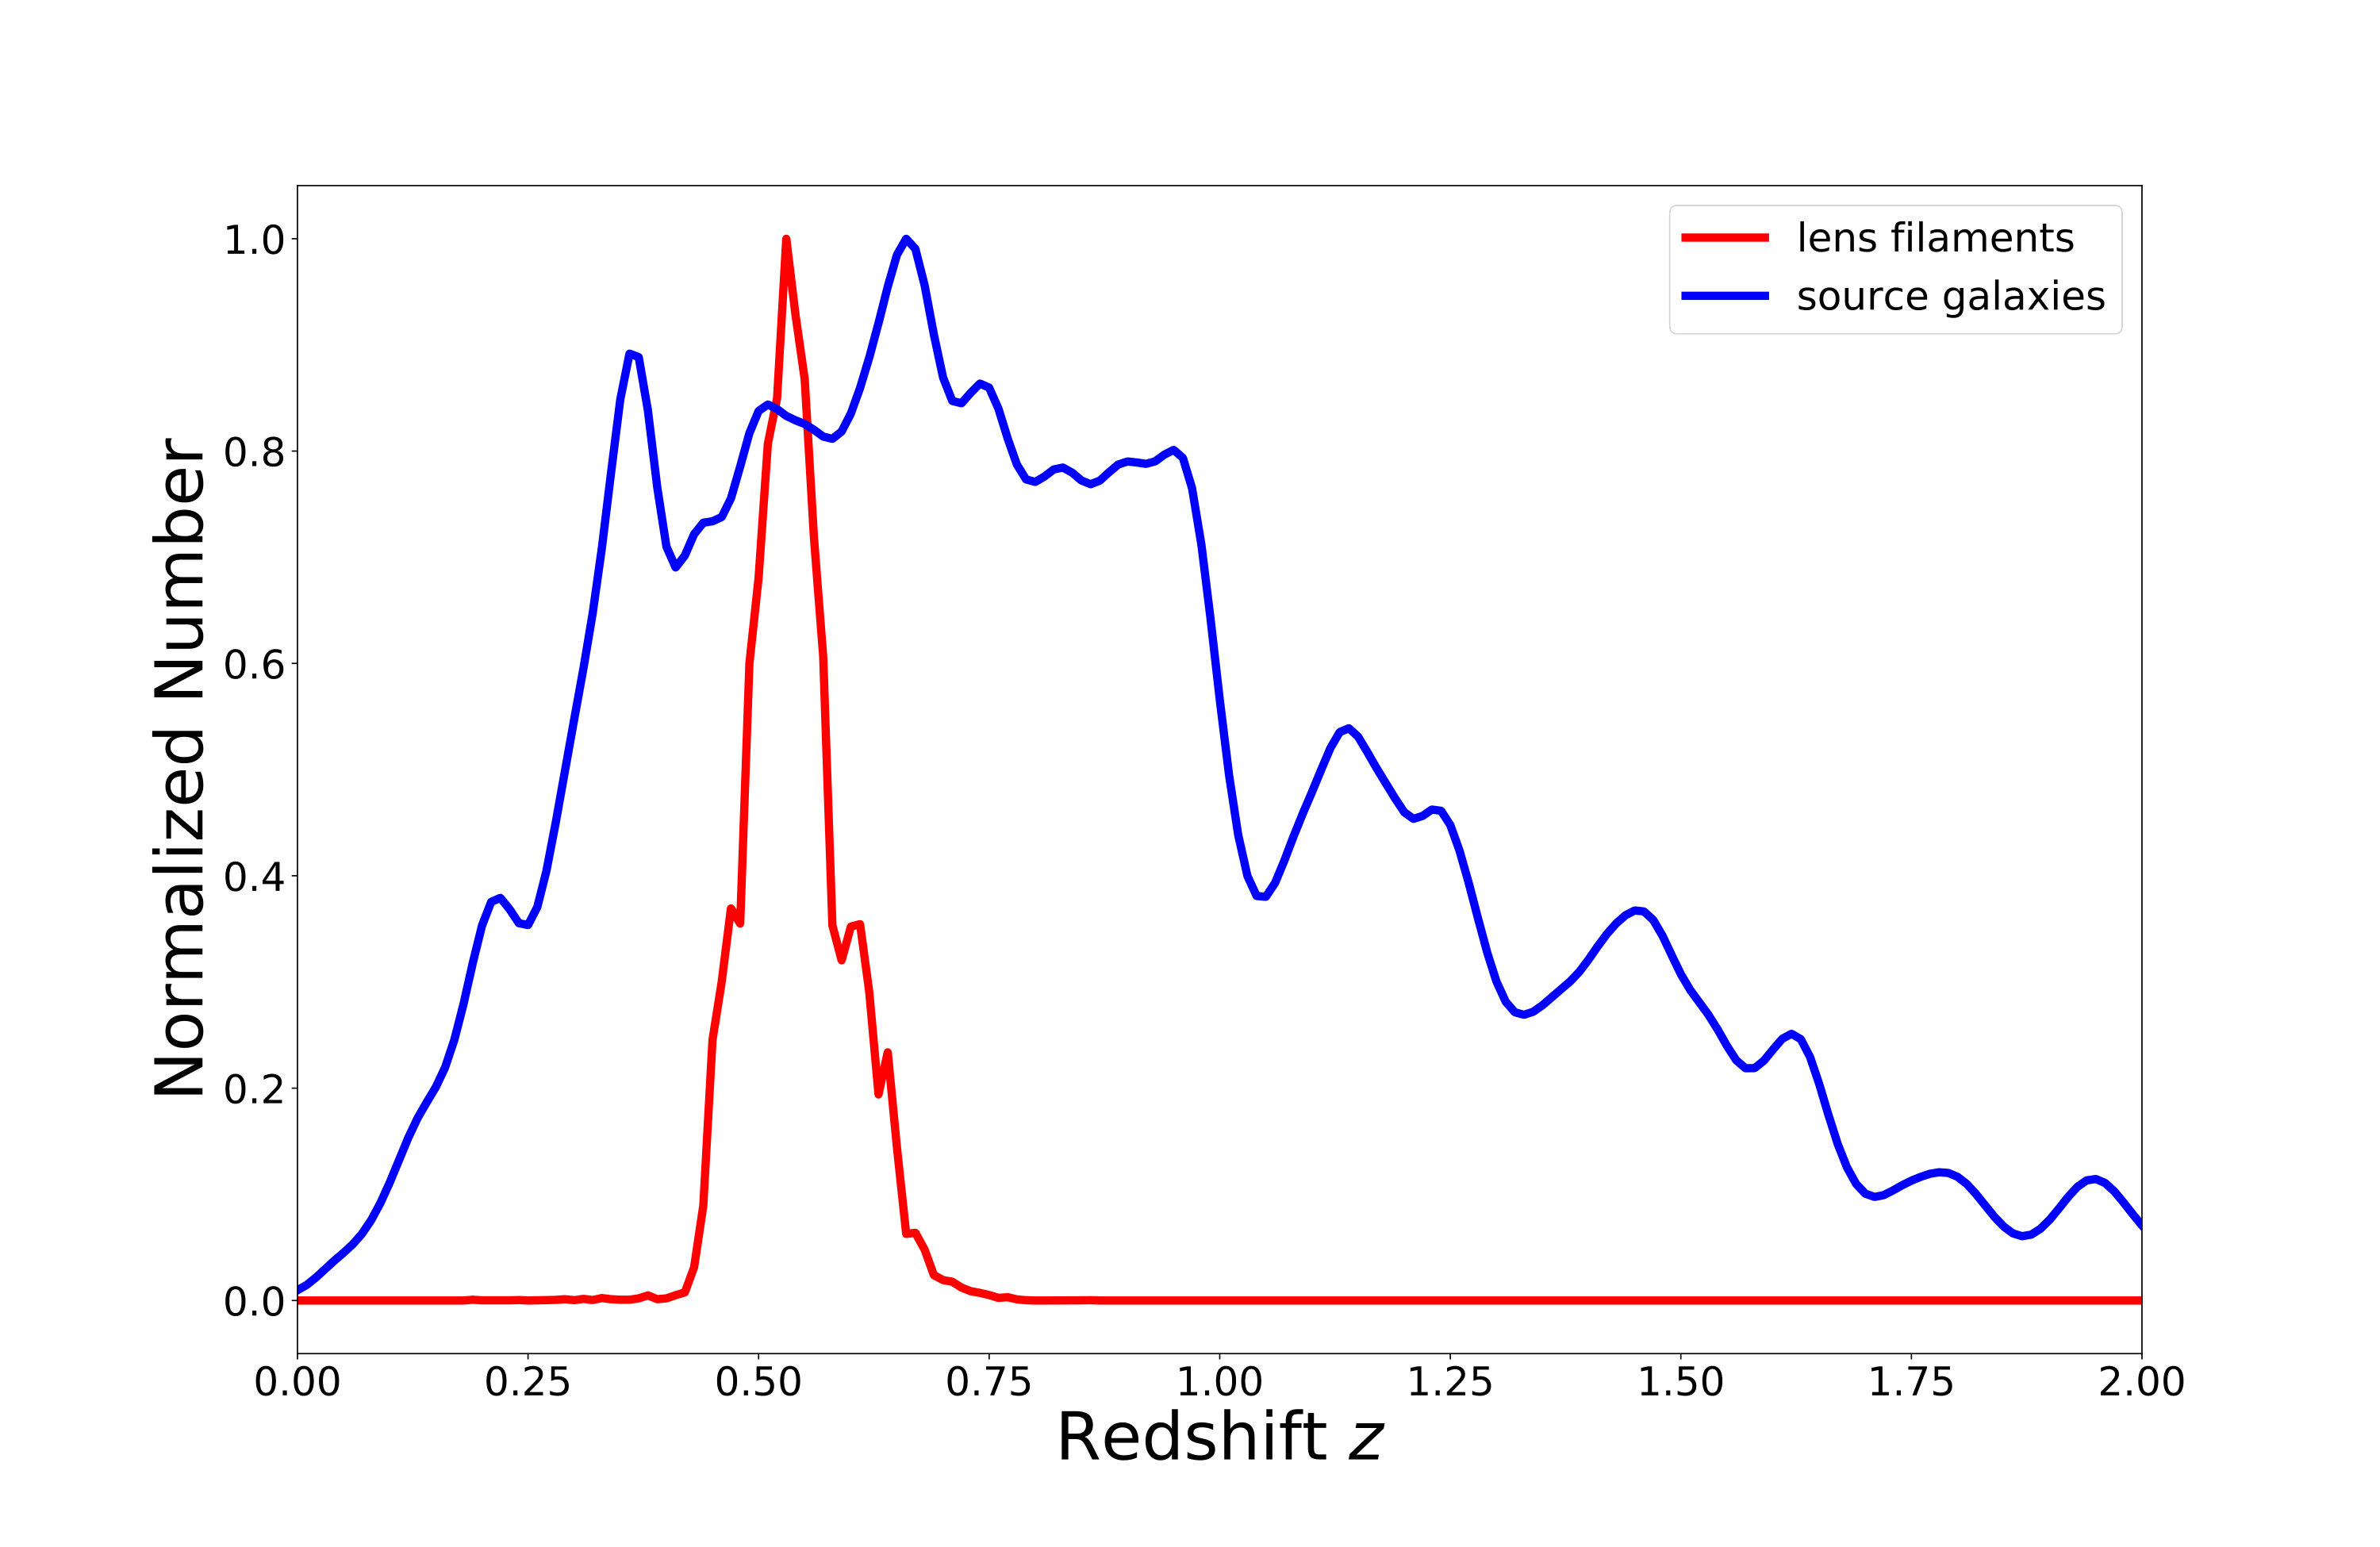 Figure 25
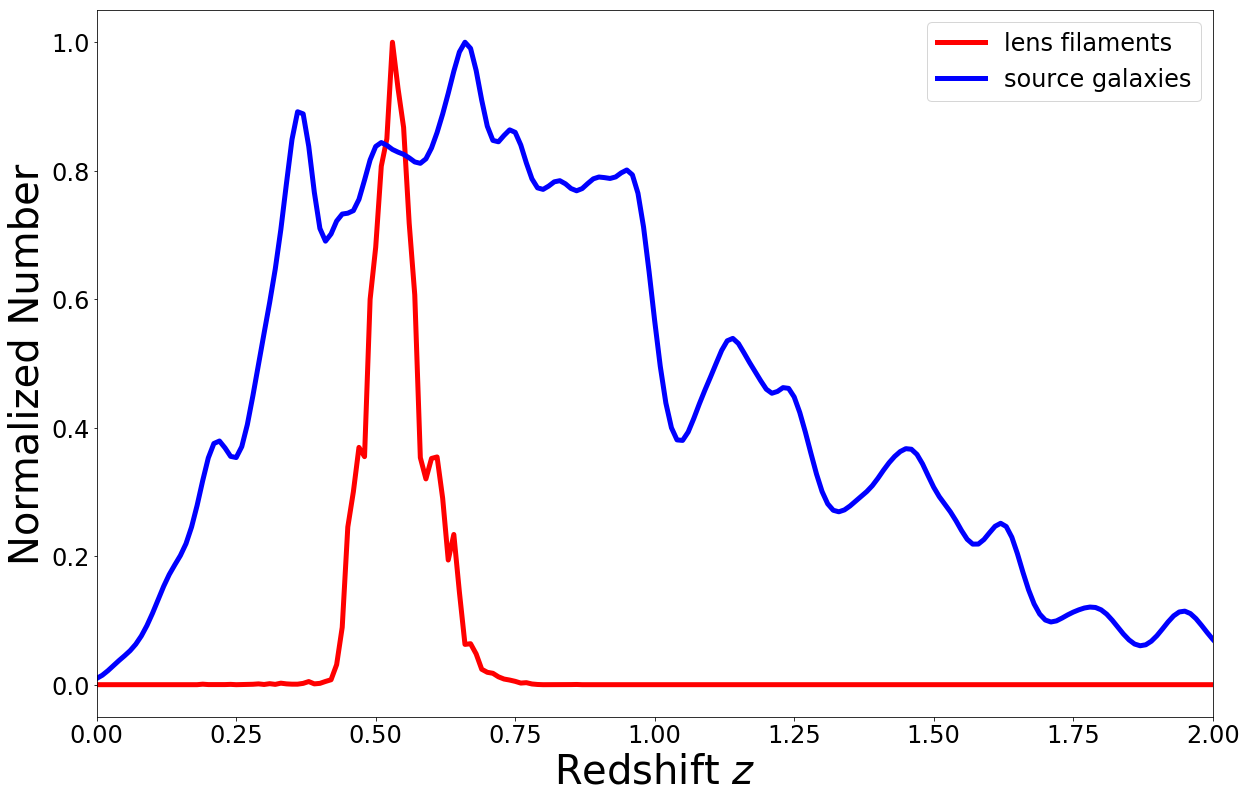 Figure 26
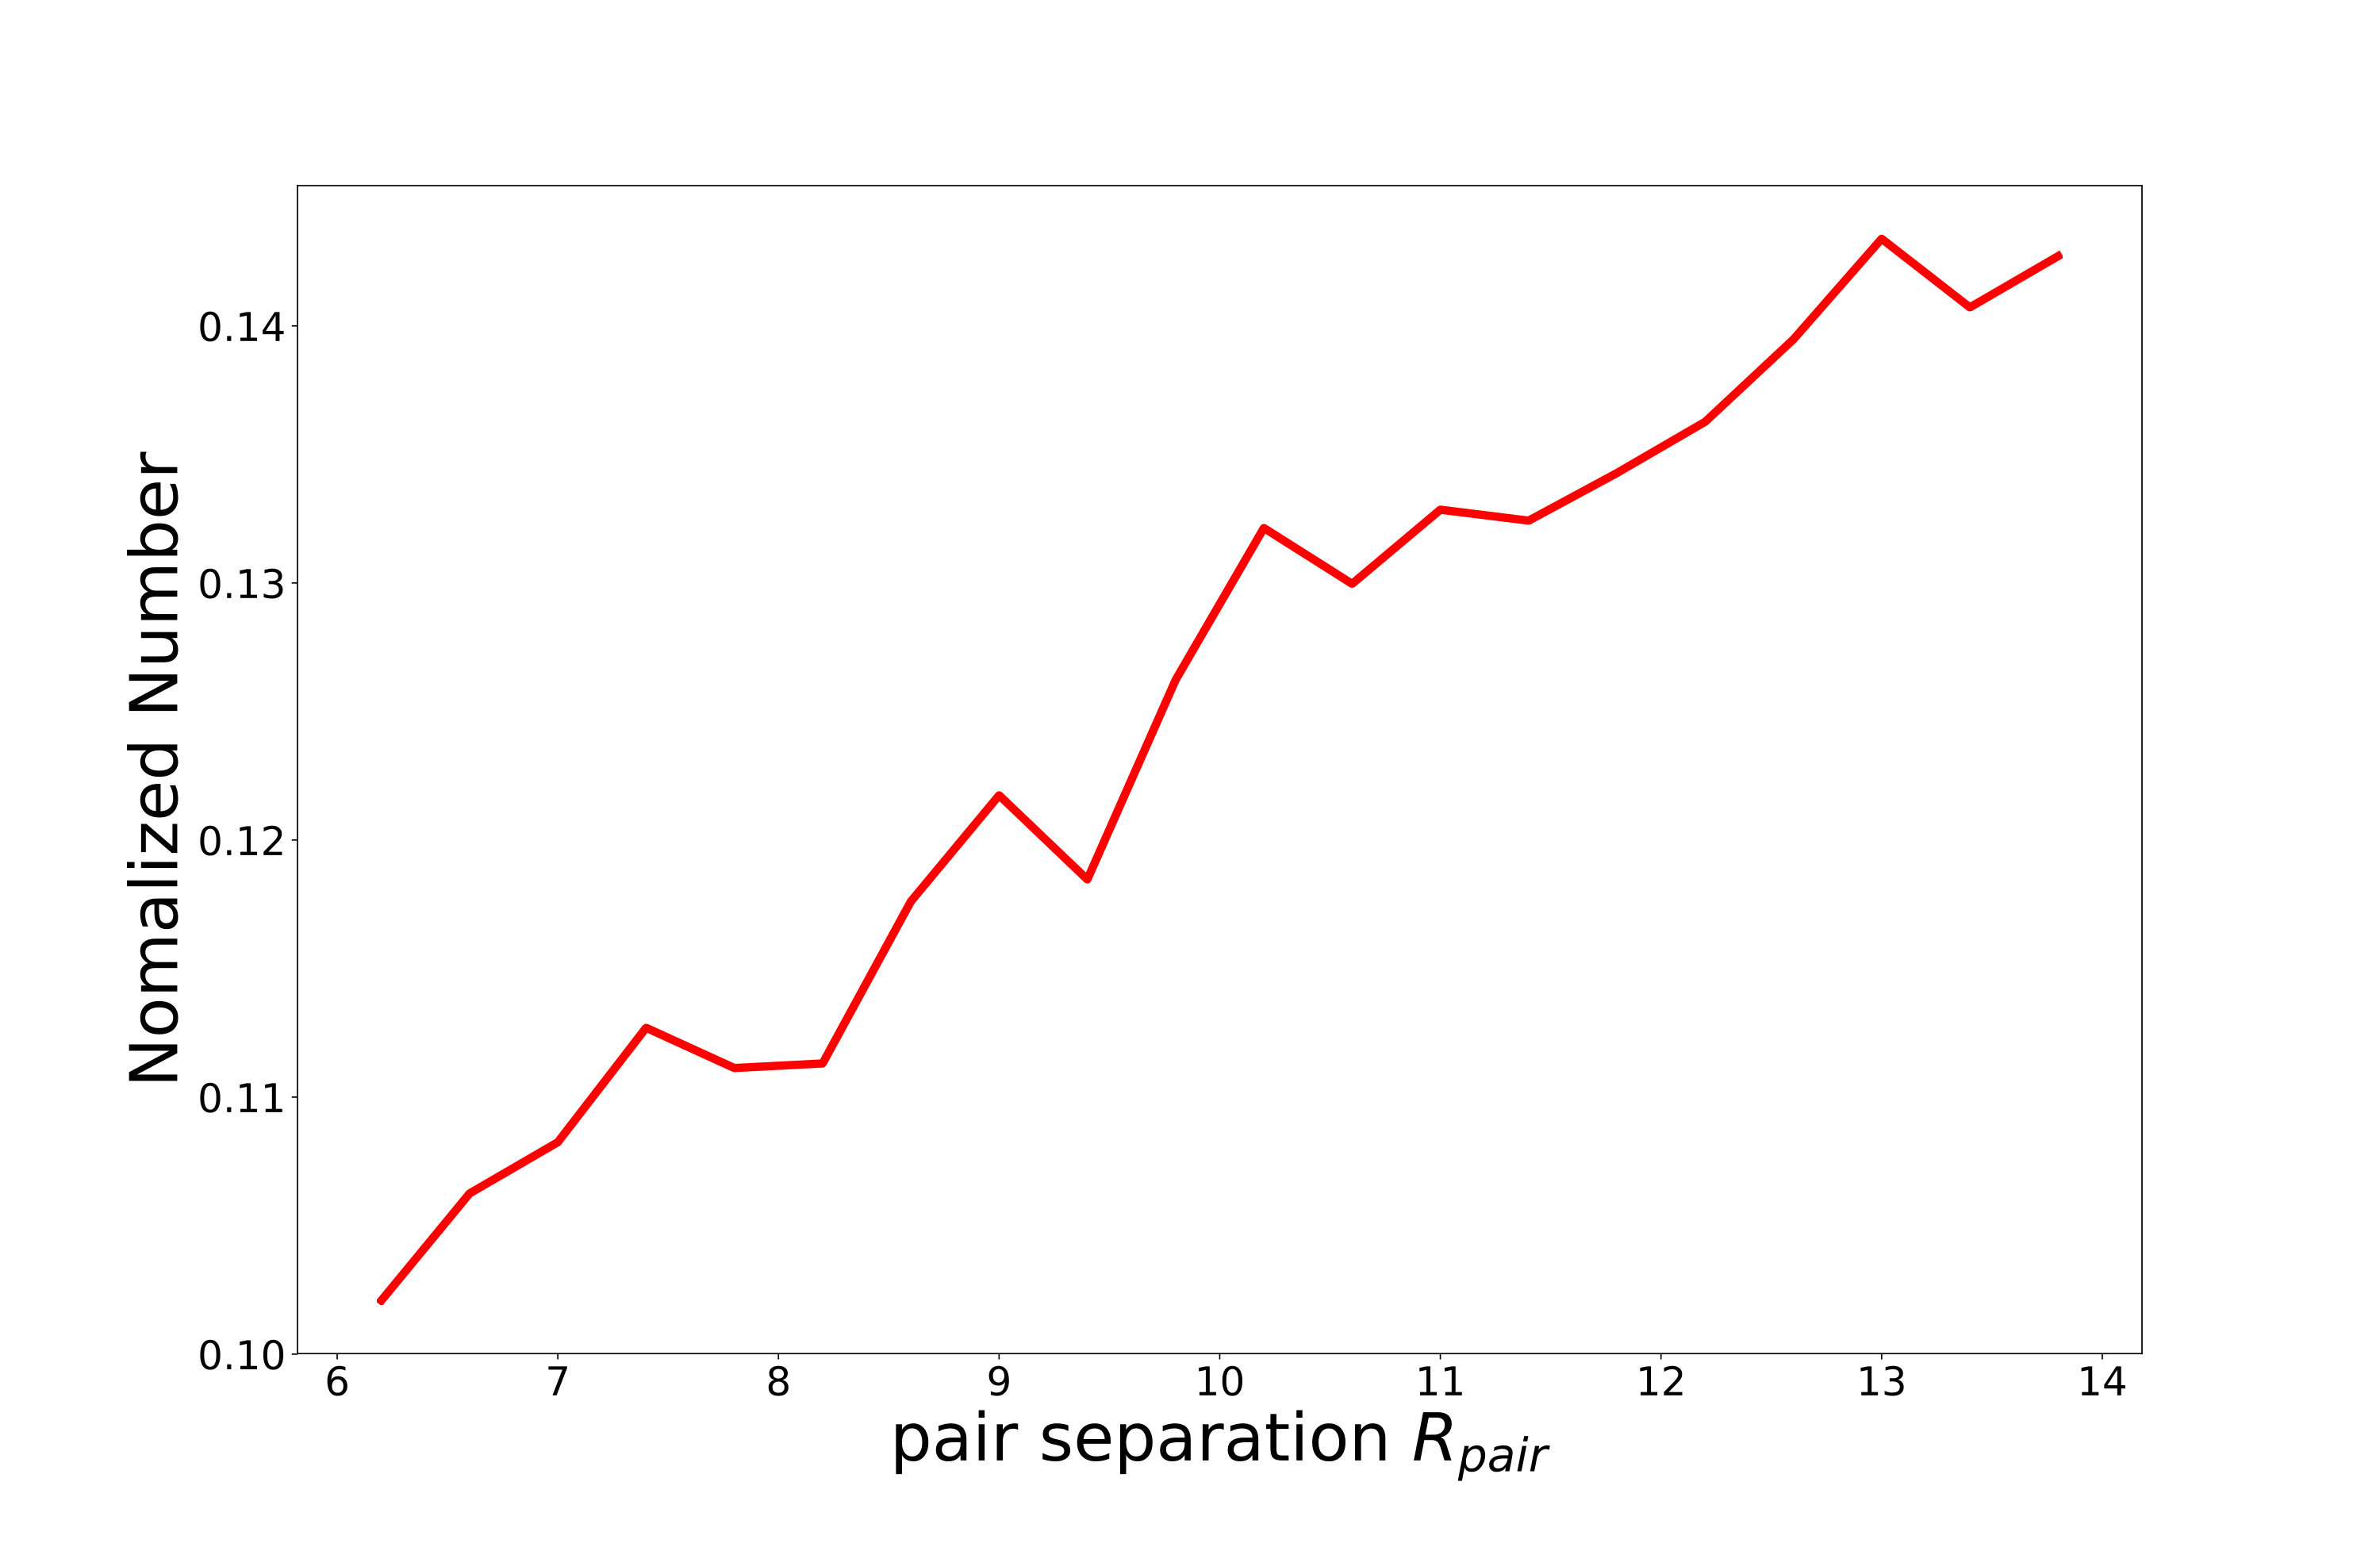 Figure 27
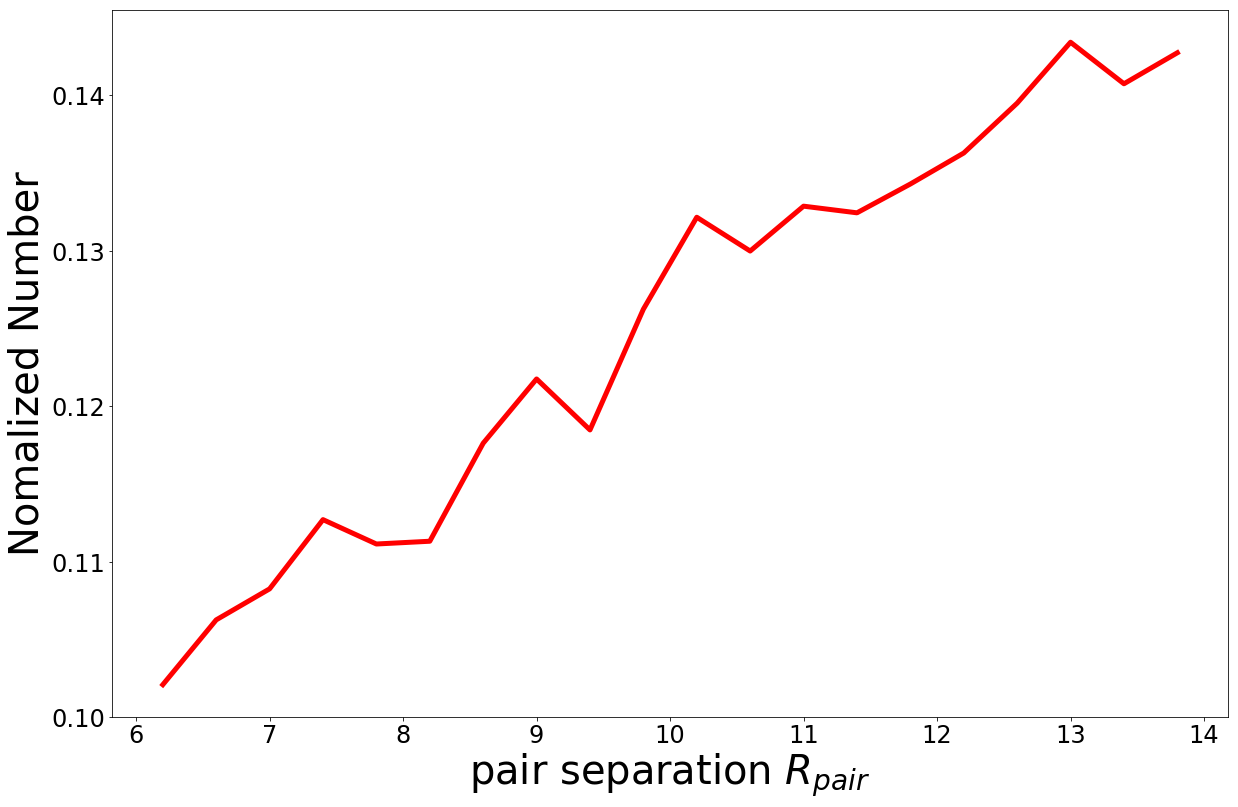 Figure 28
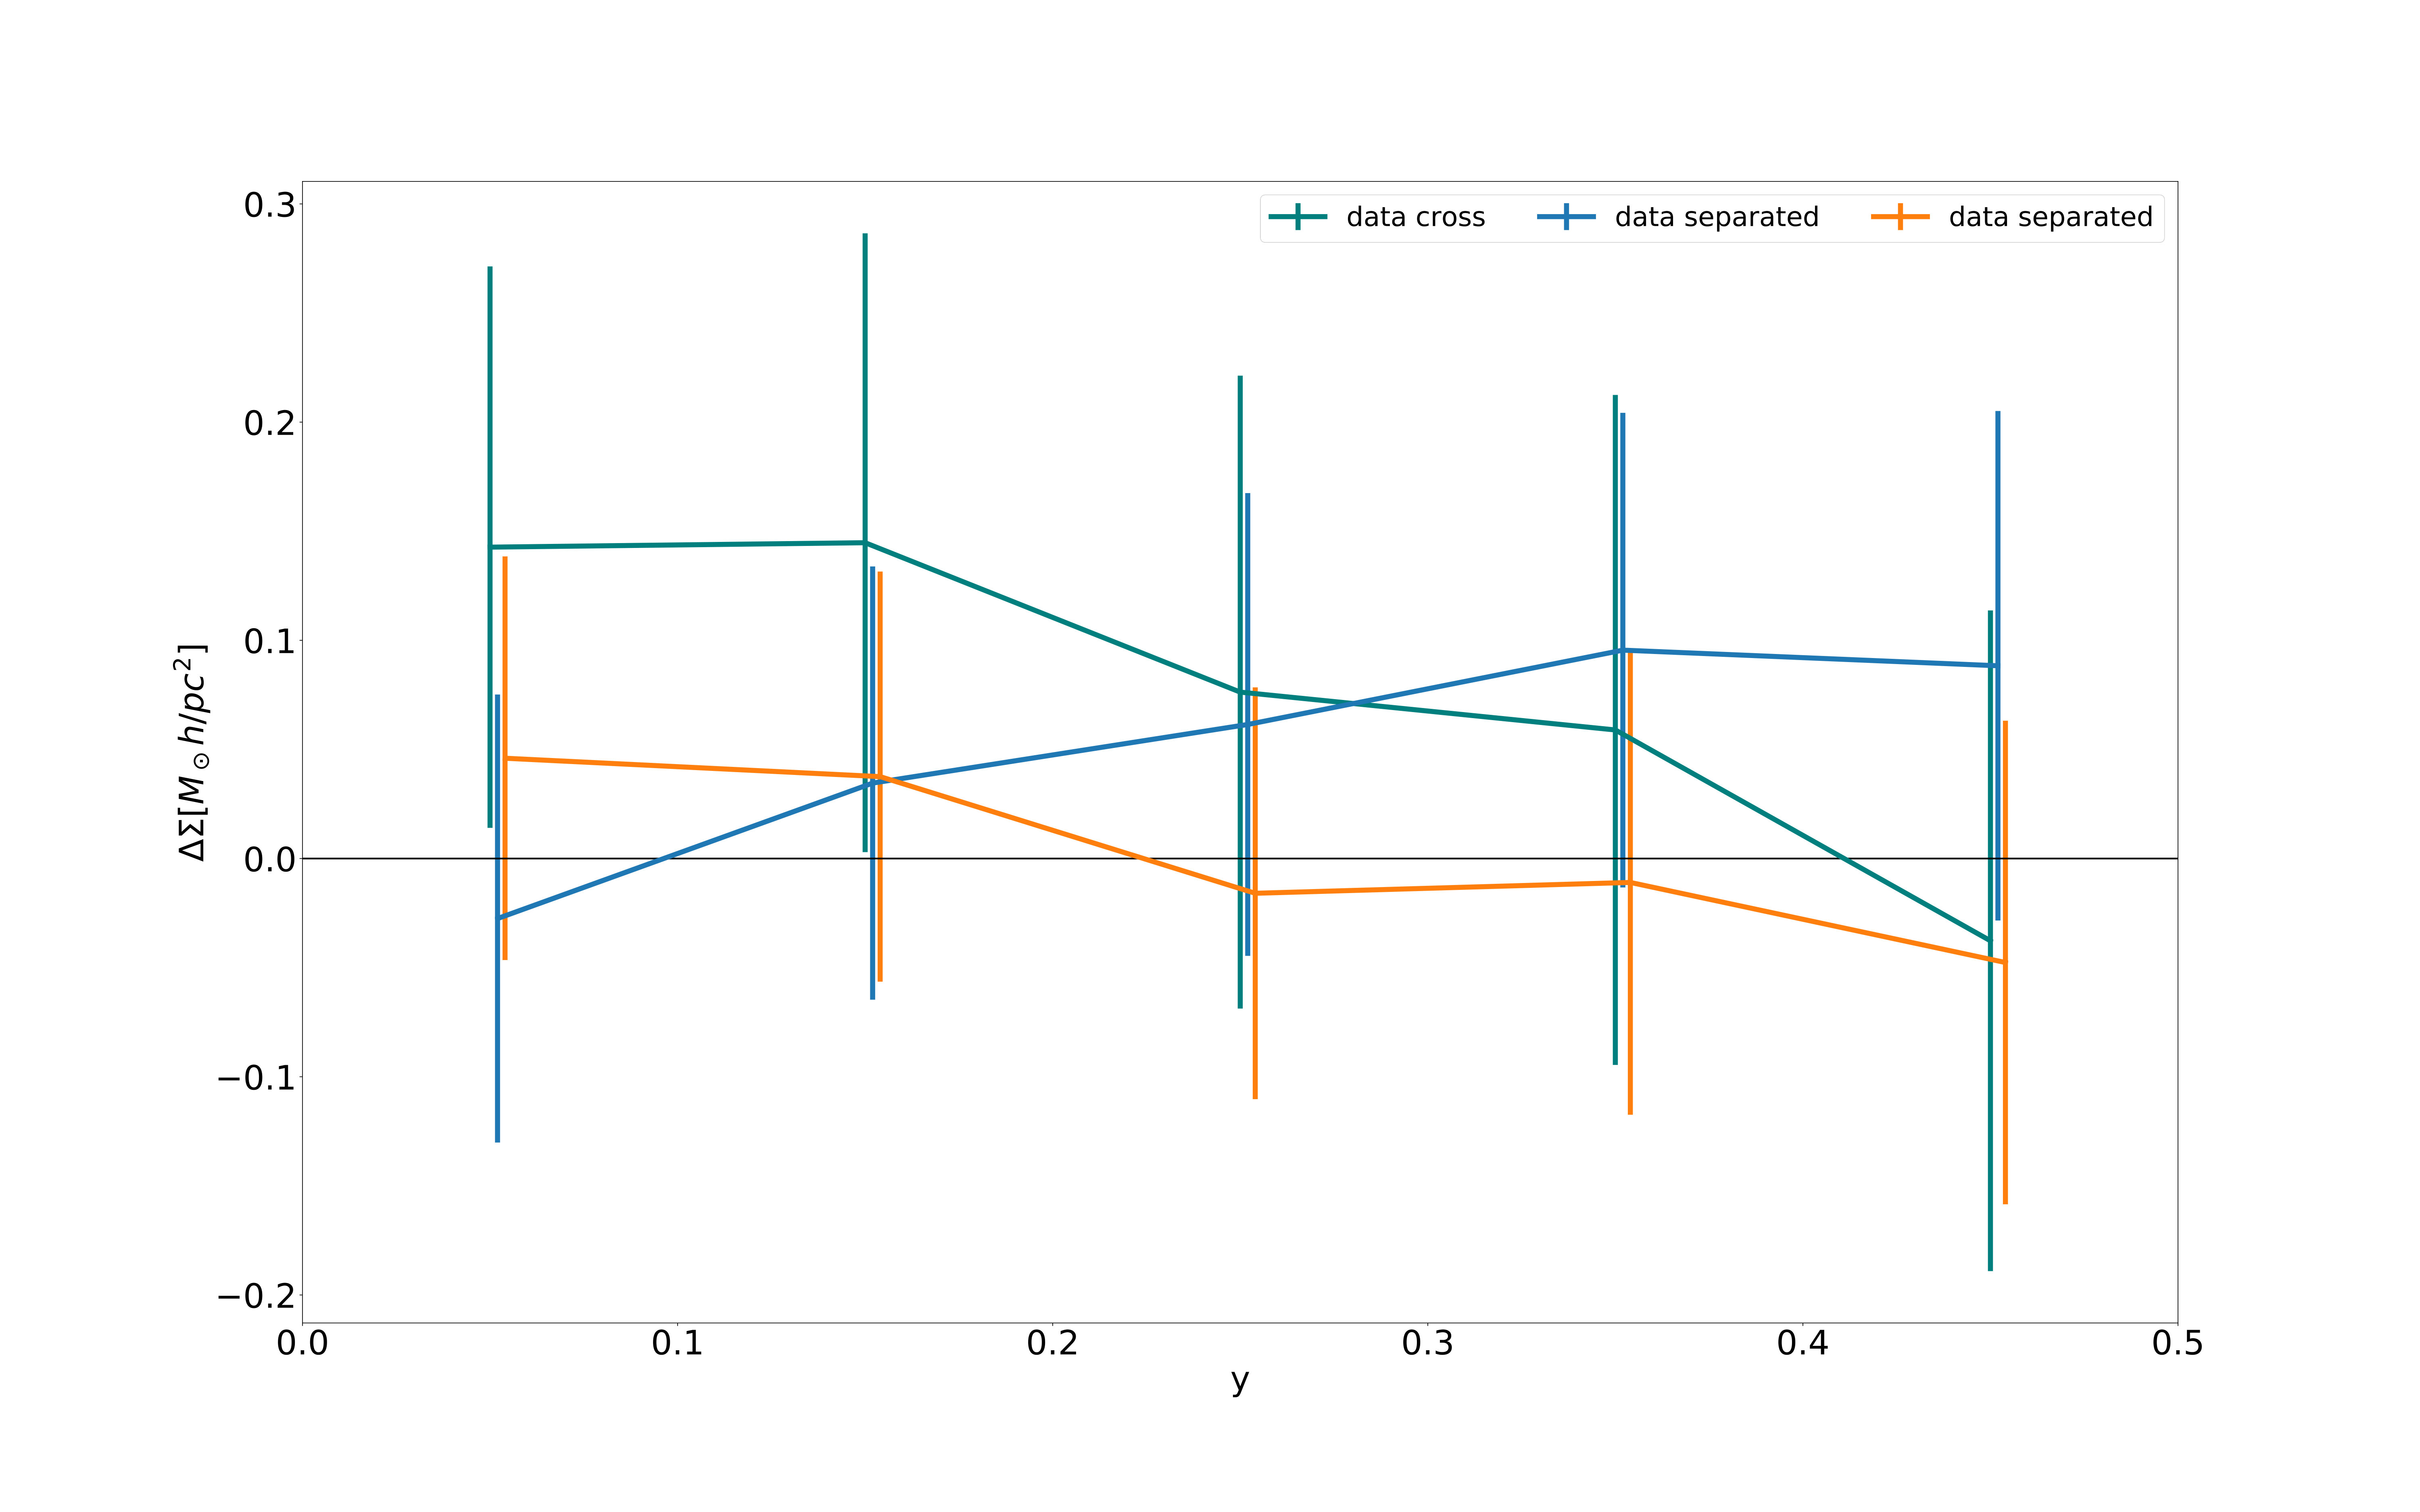 Figure 29
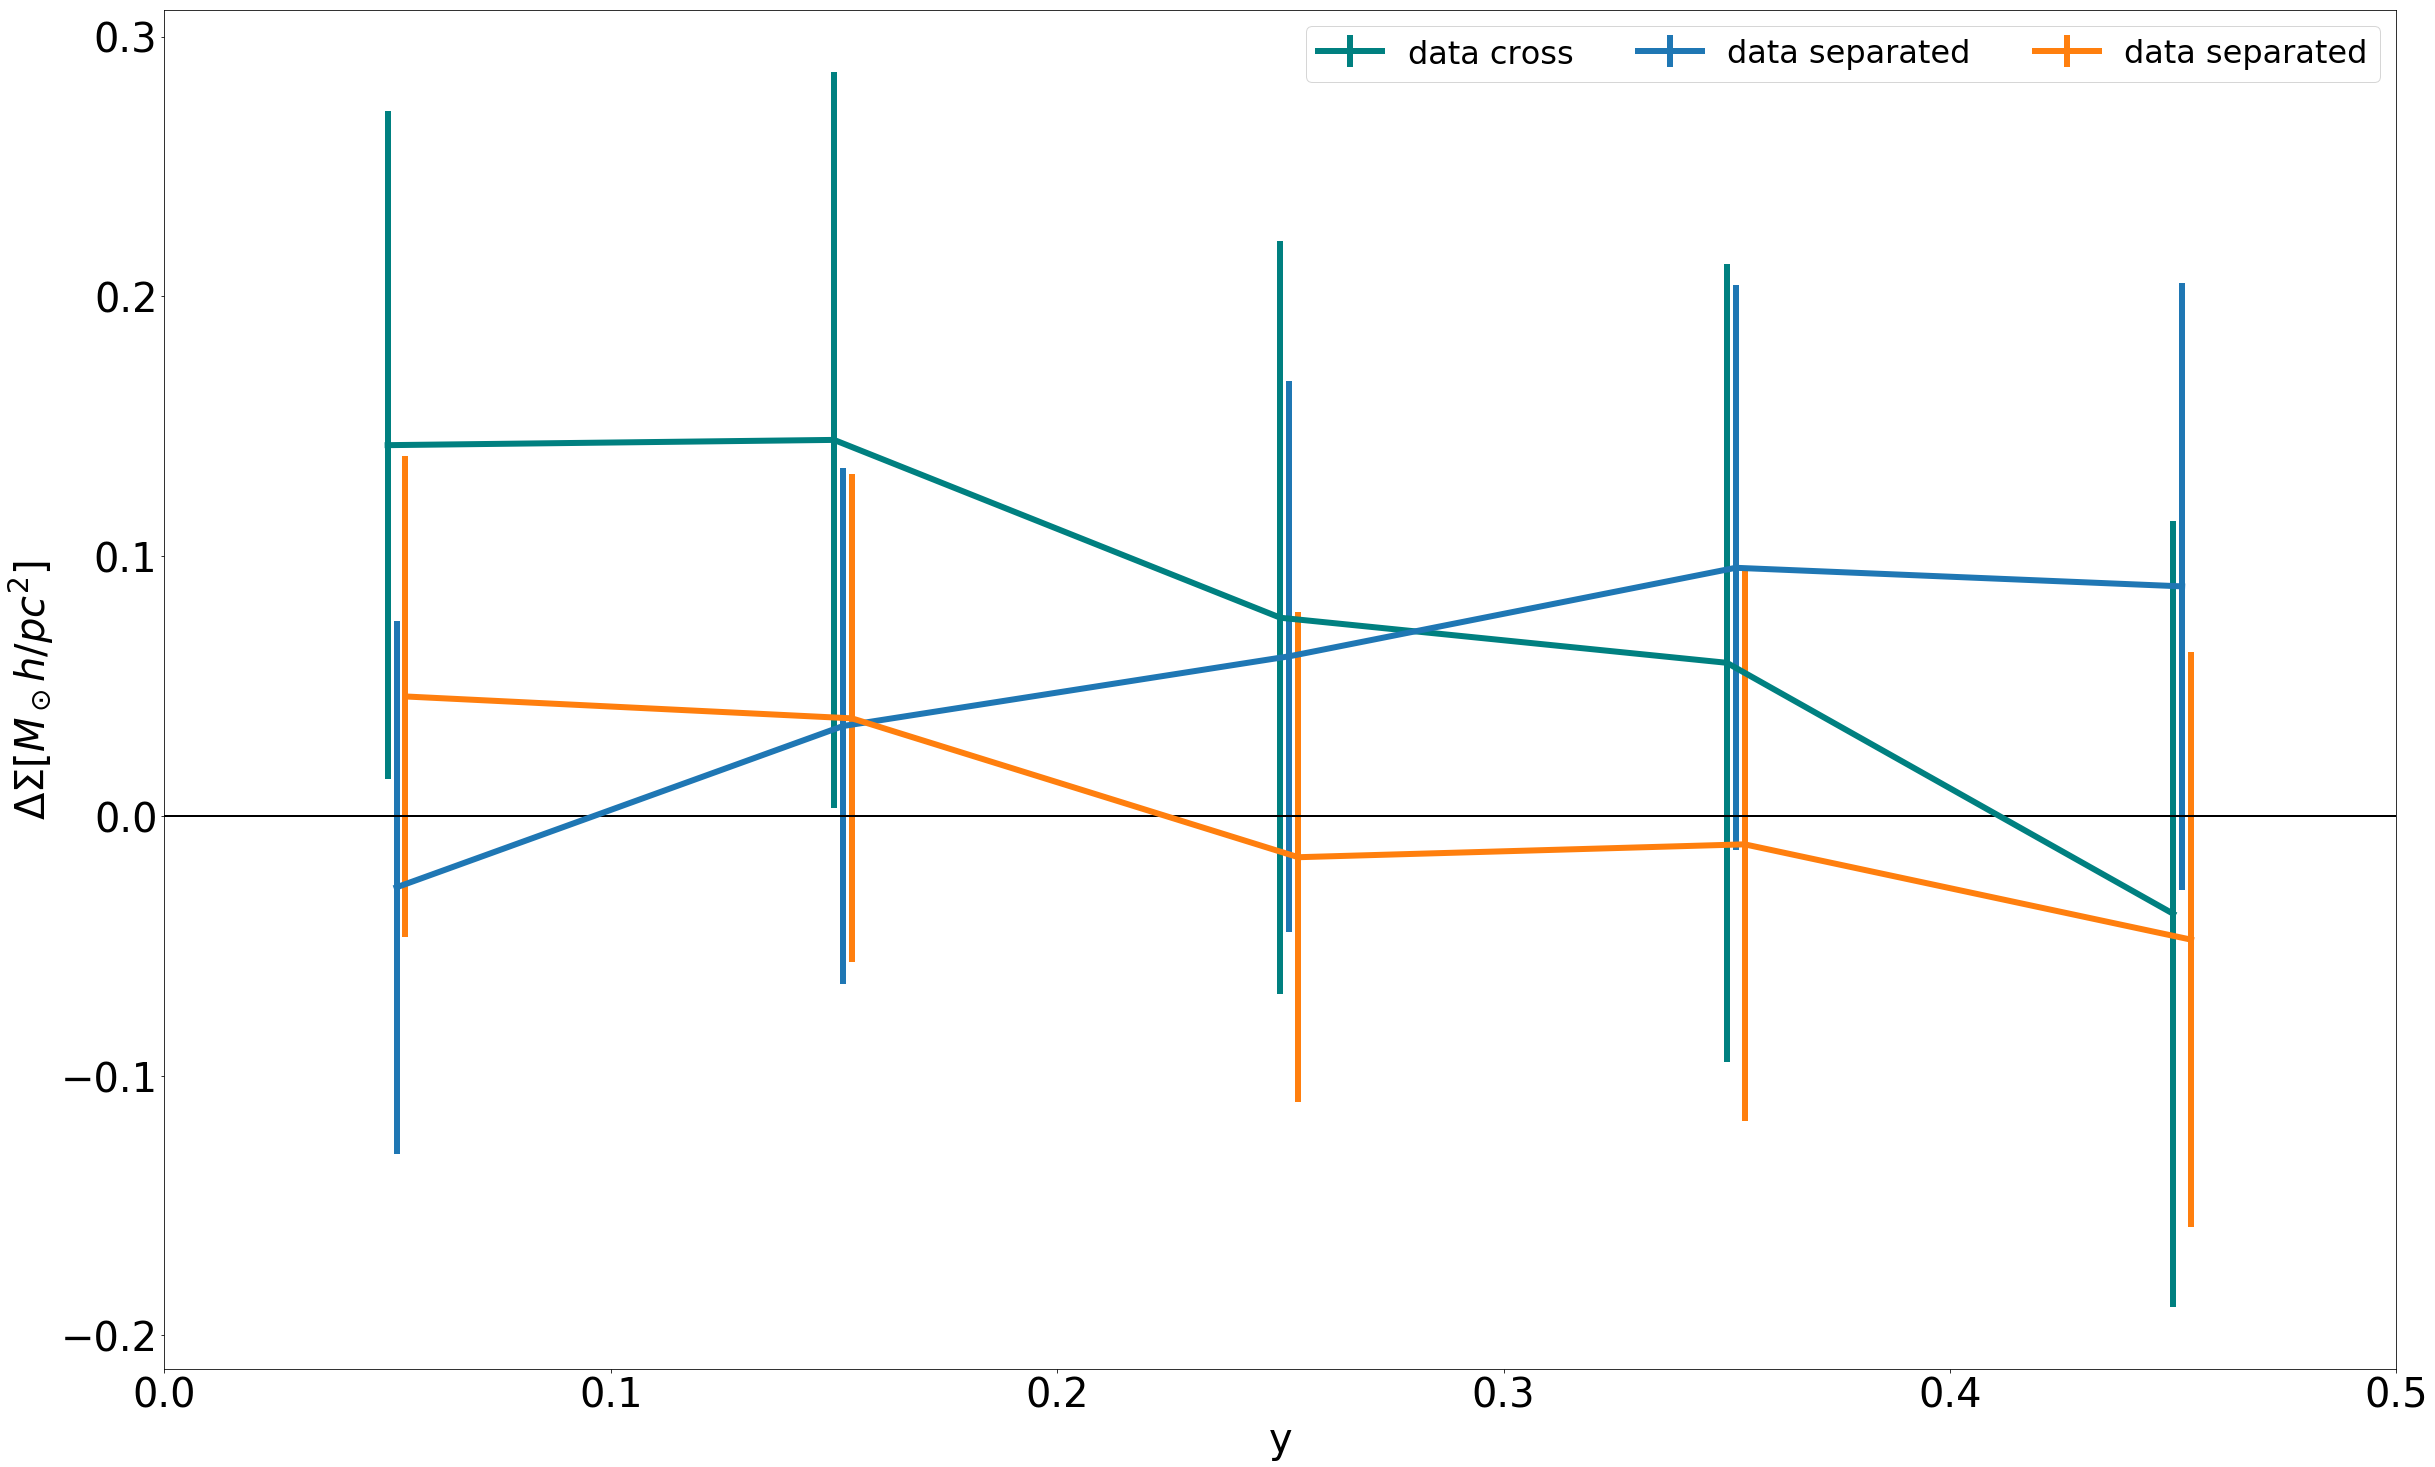 Figure 30
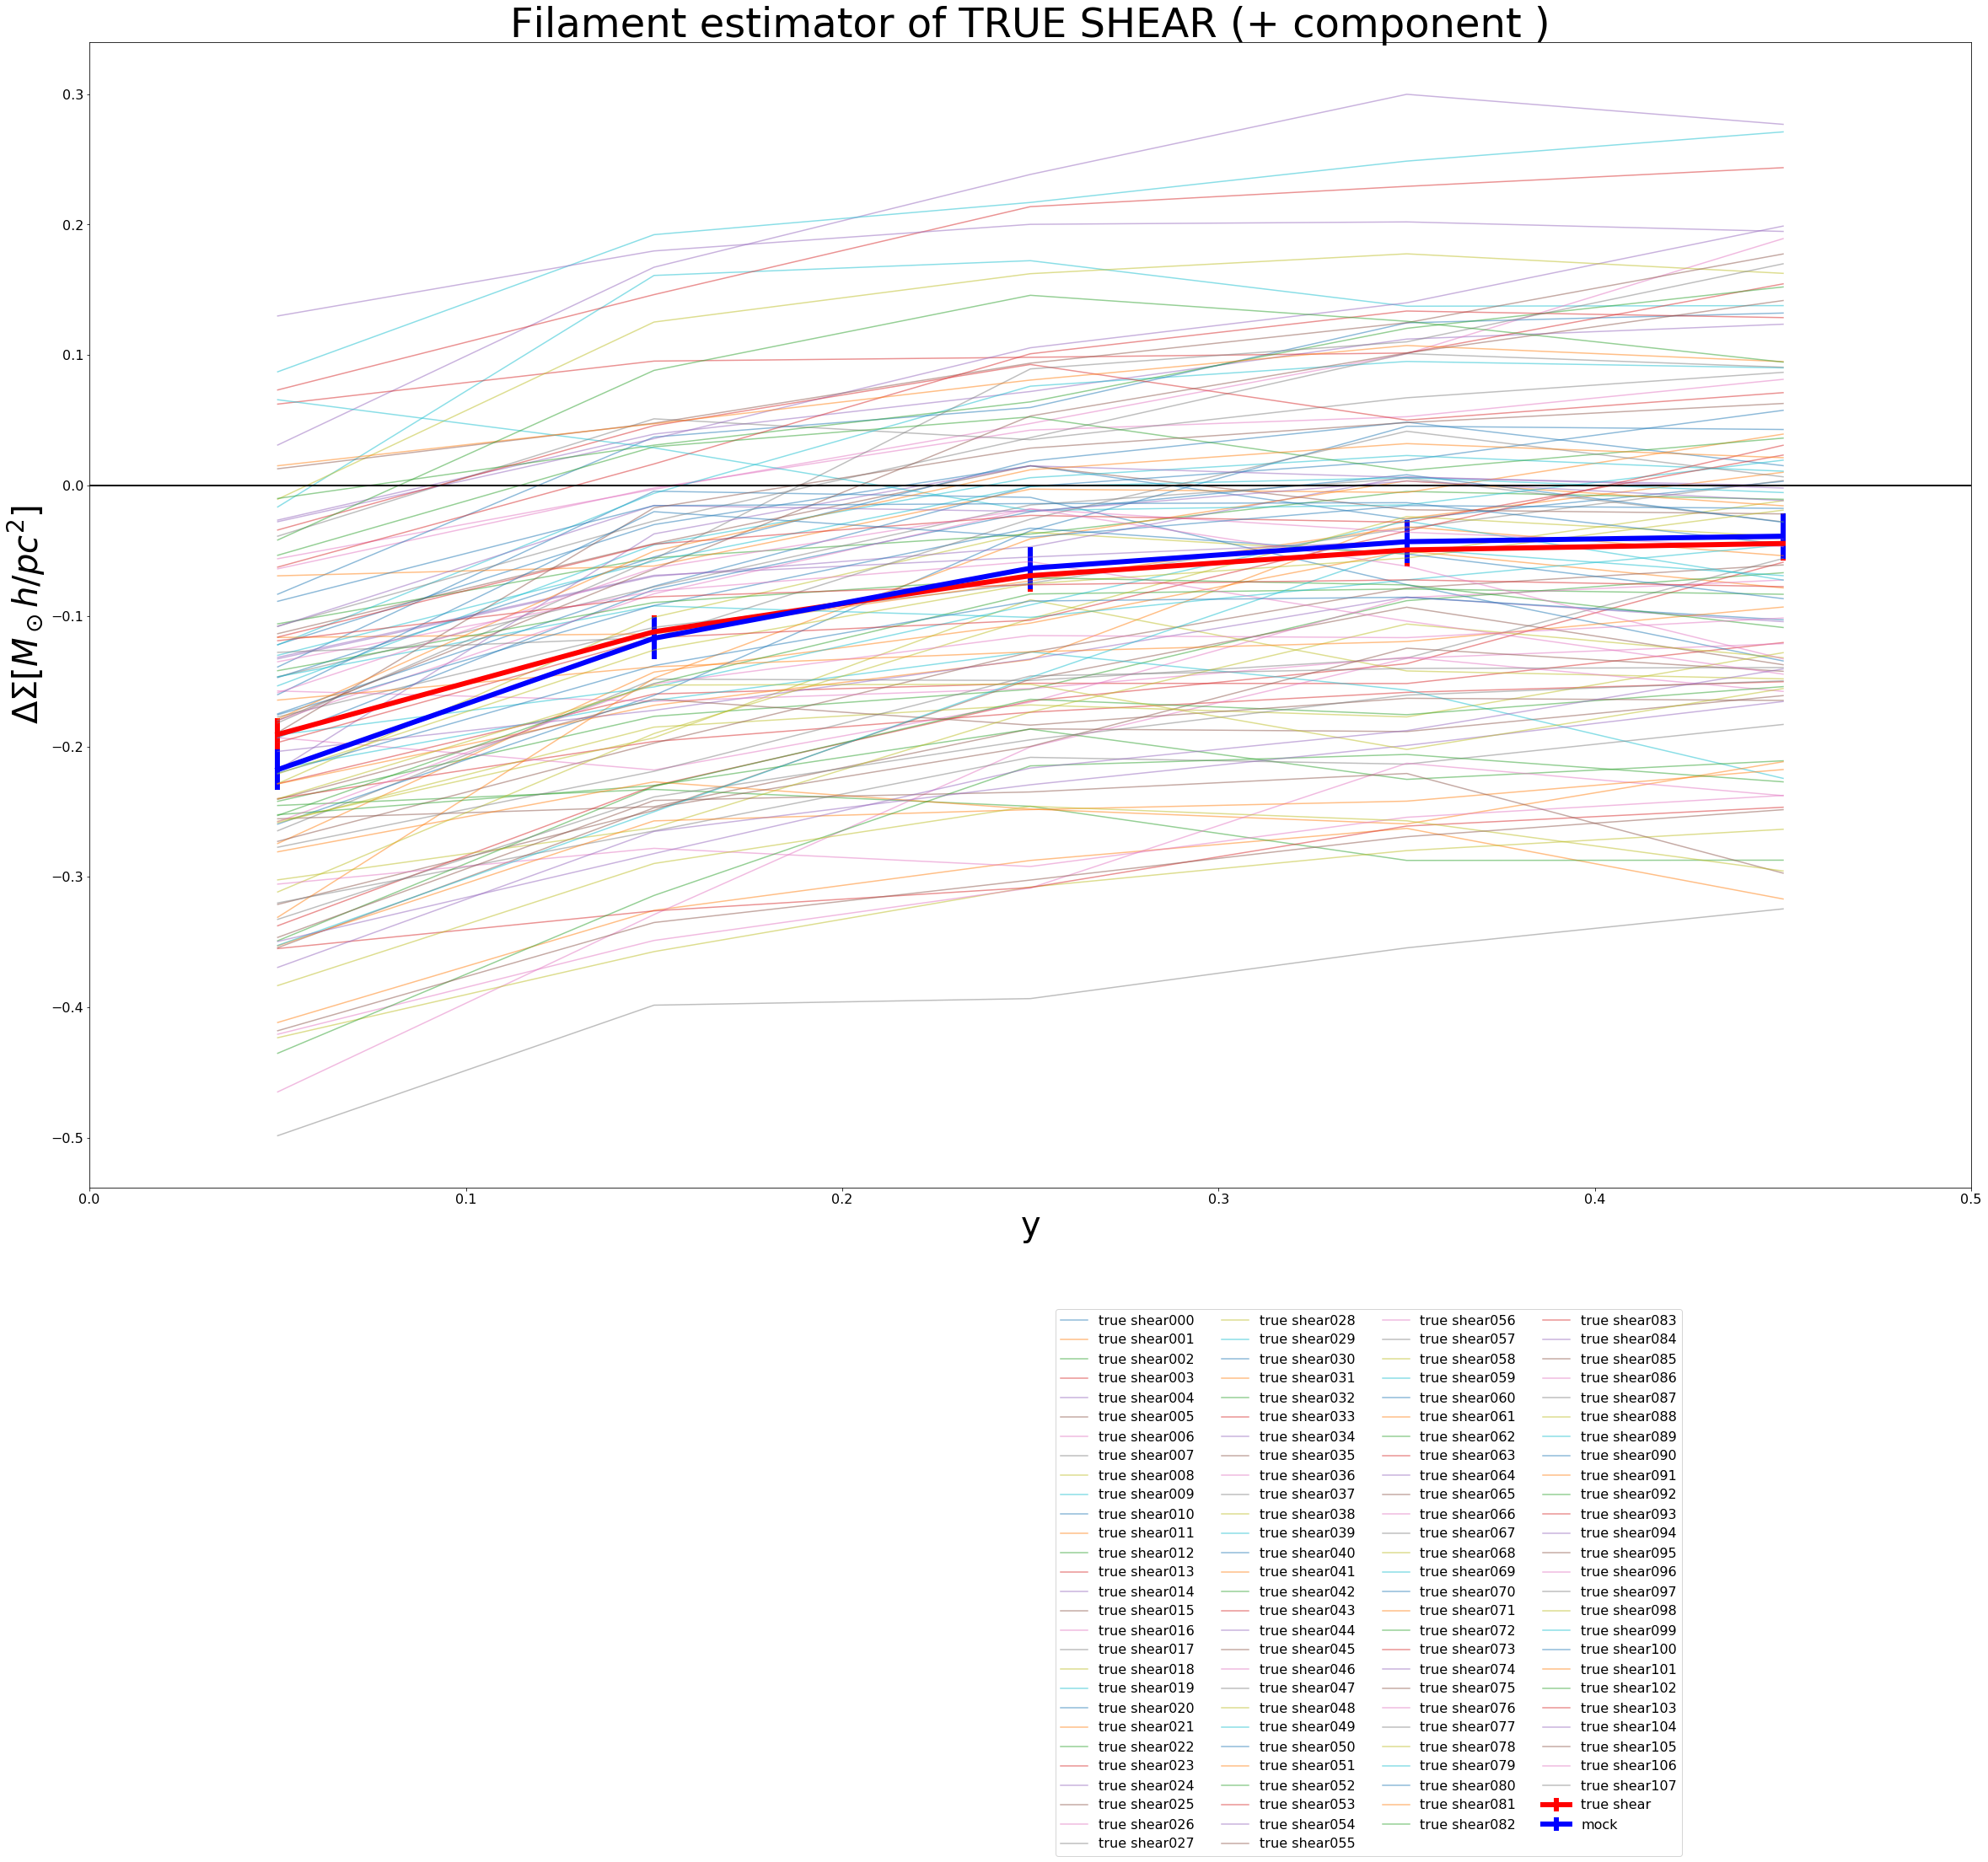 Figure 31
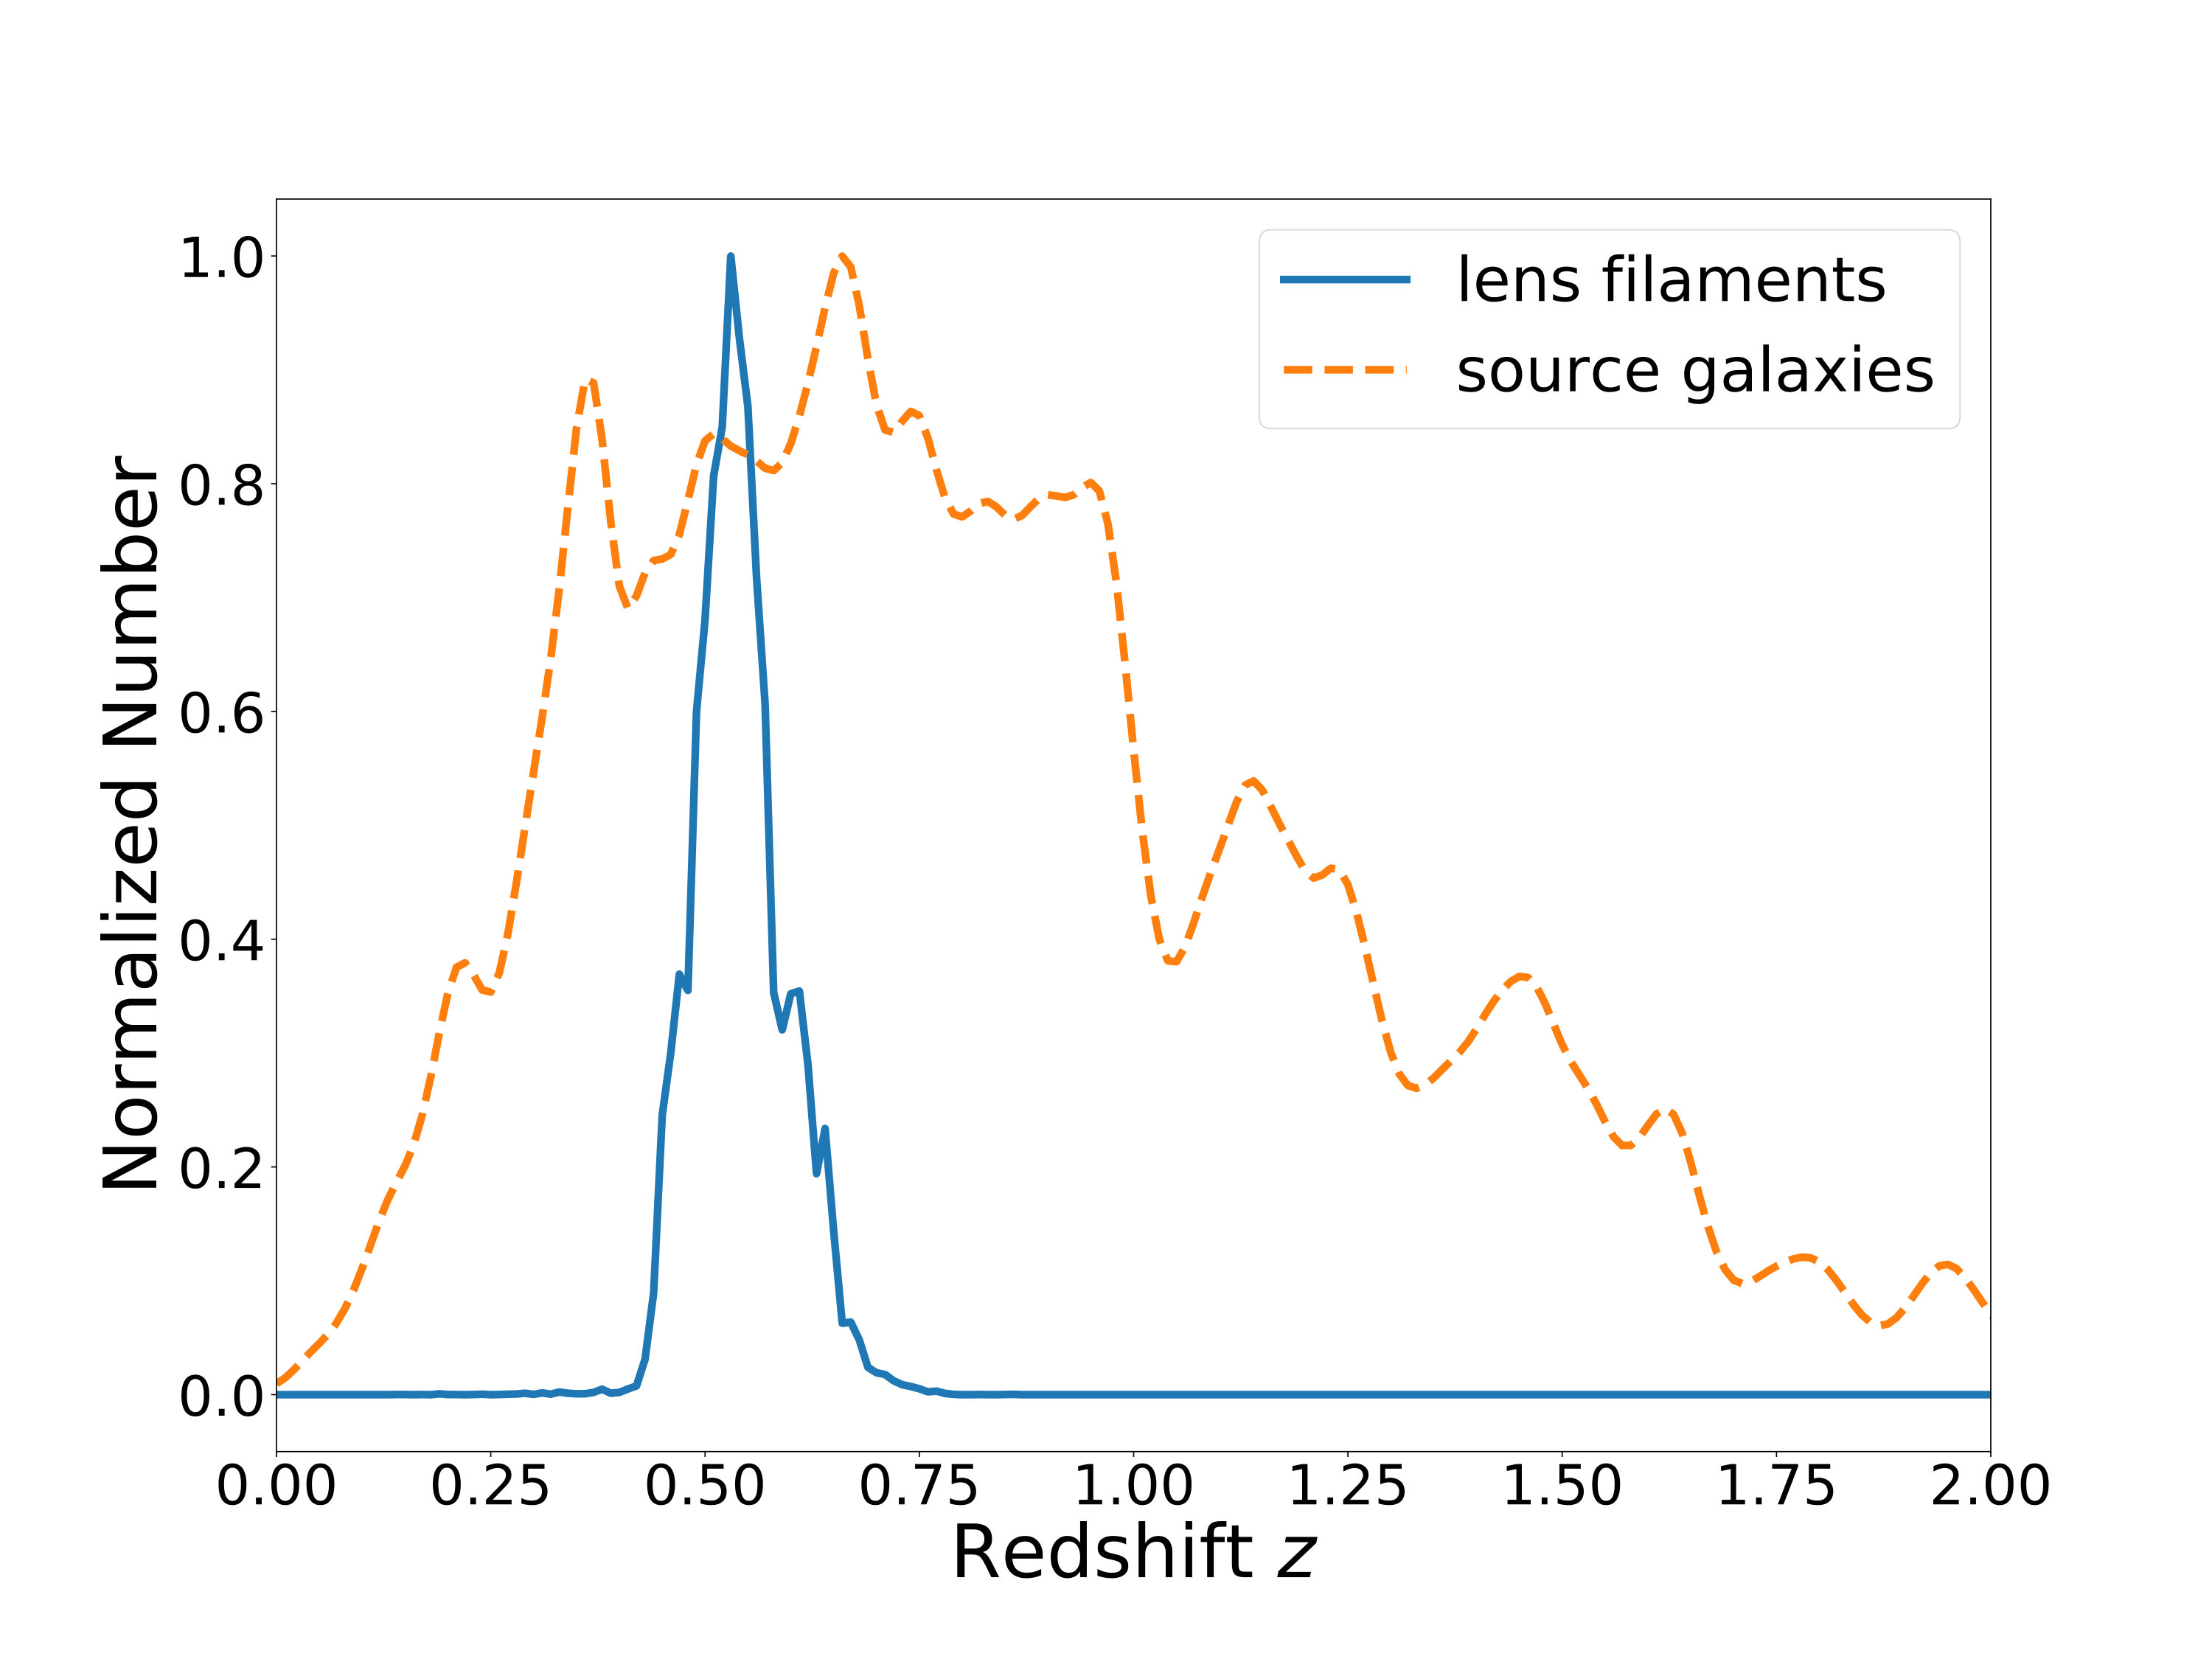 Figure 32
| null test | /dof | -value |
|---|---|---|
| mode | 7.27/5 | 0.20 |
| separated pair mode | 2.34/5 | 0.80 |
| separated pair mode | 6.05/5 | 0.30 |
Peer Reviews
No public reviews on file for this paper yet. If you reviewed it on a platform where reviews are public (OpenReview, ICLR, NeurIPS, ICML), you can paste yours below so the community can read it here.
Videos
No videos yet. Explain this paper in a talk, walkthrough, or lecture? Add one.
Weak Lensing Measurement of Filamentary Structure with the SDSS BOSS and Subaru Hyper Suprime-Cam Data
Hiroto Kondo,1 Hironao Miyatake,2,1,3 Masato Shirasaki,4 Naoshi Sugiyama,1,3 Atsushi J. Nishizawa2,1
1Division of Particle and Astrophysical Science, Graduate School of Science, Nagoya University, Furo-cho, Nagoya 464-8602, Japan
2Institute for Advanced Research, Nagoya University, Furo-cho, Nagoya 464-8601, Japan
3Kavli Institute for the Physics and Mathematics of the Universe (Kavli IPMU, WPI), UTIAS, The University of Tokyo, Kashiwa,
Chiba 277-8583, Japan
4National Astronomical Observatory of Japan, Mitaka, Tokyo 181-8588, Japan E-mail: [email protected]
(Accepted XXX. Received YYY; in original form ZZZ)
Abstract
We report the weak lensing measurement of filaments between Sloan Digital Sky Survey (SDSS) III/Baryon Oscillation Spectroscopic Survey (BOSS) CMASS galaxy pairs at , using the Subaru Hyper Suprime-Cam (HSC) first-year galaxy shape catalogue. Despite of the small overlap of deg2 between these surveys we detect the filament lensing signal at 3.9 significance, which is the highest signal-to-noise lensing measurement of filaments between galaxy-scale halos at this redshift range. We derive a theoretical prediction and covariance using mock catalogues based on full-sky ray-tracing simulations. We find that the intrinsic scatter of filament properties and the fluctuations in large scale structure along the line-of-sight are the primary component of the covariance and the intrinsic shape noise from source galaxies no longer limits our lensing measurement. This fact demonstrates the statistical power of the HSC survey due to its deep observations and high number density of source galaxies. Our result is consistent with the theoretical prediction and supports the “thick” filament model. As the HSC survey area increases, we will be able to study detailed filament properties such as the dark matter distributions and redshift evolution of filaments.
keywords:
large-scale structure of Universe – cosmology: observations – dark matter – gravitational lensing: weak
††pubyear: 2019††pagerange: Weak Lensing Measurement of Filamentary Structure with the SDSS BOSS and Subaru Hyper Suprime-Cam Data–Weak Lensing Measurement of Filamentary Structure with the SDSS BOSS and Subaru Hyper Suprime-Cam Data
1 Introduction
One of the key features of what the cold dark matter (CDM) model predicts is that the large scale structure of the Universe, which is formed from small scales such as stars and galaxies to large scales such as galaxy groups and clusters. In this process, the CDM collapses into dark matter halos and then galaxies are formed within a dark matter halo as a result of gas accretion. After a dark matter halo evolves, it hosts more galaxies and then galaxy groups and clusters are formed. Such massive halos are connected to each other via filamentary structure, the so-called cosmic web. Such filamentary structures have been clearly seen in the three-dimensional galaxy distribution observed by galaxy redshift surveys such as the 2dF Galaxy Redshift Survey (2dFGRS; Colless et al., 2001) and Sloan Digital Sky Survey (SDSS; York et al., 2000). Statistical measurement of the filamentary structure in the galaxy overdensity between massive halos has also been performed by stacking pairs of galaxy groups and clusters (e.g., Zhang et al., 2013)
In addition to these measurements, it is of great importance to measure the dark matter filaments, which will be a more direct proof of the CDM cosmology. Such a measurement can be made possible by weak gravitational lensing which manifests as a coherent distortion in observed galaxy shapes caused by foreground dark matter structures.
Several weak lensing measurements of a filament either between massive galaxy clusters or connected to a massive galaxy cluster are reported. Dietrich et al. (2012) detected a dark matter filament in the super cluster system consisting of Abell 222 and Abell 223. Jauzac et al. (2012) claimed the detection of a dark matter filament funnelling onto a core of massive galaxy cluster MACSJ0717.5+3745. Higuchi et al. (2015) measured the average surface mass density of a dark matter filament between galaxy clusters at , CL0015.9+1609 and RX J0018.3+1618.
Several attempts to make a statistical detection of dark matter filaments by stacking pairs of galaxies have been made. Clampitt et al. (2016) reported the detection of dark matter filaments at 4.5 significance by stacking 135,000 Luminous Red Galaxy (LRG) pairs from SDSS with the typical redshift , and claimed that their filament lensing signal is consistent with a “thick” filament model predicted from dark matter -body simulations rather than a “thin” filament model by a string of halo along the line connecting the two LRGs. Epps & Hudson (2017) pushed the pair redshift to using the SDSS-III/Baryon Oscillation Spectroscopic Survey (BOSS; Dawson et al., 2013) LOWZ and CMASS galaxy sample, and claimed the detection at 5 significance. He et al. (2018) claimed the filament lensing detection at 5 significance using the filament catalogue constructed from density ridges of CMASS galaxies (Chen et al., 2016) and weak lensing of cosmic microwave background (CMB) measured from the Planck satellite experiment (Planck Collaboration et al., 2014a, b).
In this paper, we report the weak lensing measurement of filaments between the SDSS-III/BOSS CMASS galaxy pairs using the Subaru Hyper Suprime-Cam (HSC; Miyazaki et al., 2018; Komiyama et al., 2018; Kawanomoto et al., 2018; Furusawa et al., 2018) Subaru Strategic Program (SSP; Aihara et al., 2018a) first-year data (Aihara et al., 2018b). Among the ongoing weak lensing surveys such as Dark Energy Survey (DES; Dark Energy Survey Collaboration et al., 2016) and the Kilo-Degree Survey (KiDS; de Jong et al., 2013), the HSC survey provides the deepest images, which enables us to perform one of the highest signal-to-noise measurements of filament weak lensing. We also use the mock CMASS and source galaxy catalogue to estimate theoretical prediction and covariance.
This paper is organised as follows. In Section 2, we describe the details of the data set used for our measurement, including CMASS galaxy pair generation, HSC galaxy shape catalogue, and mock catalogue generation. In Section 3, we describe measurement methods such as filament lensing estimator and covariance. We then present the results of our filament lensing measurement in Section 4, and conclude in Section 5. Throughout the paper, we assume the Planck 2015 cosmology (Planck Collaboration et al., 2016), i.e., with the flat CDM, unless otherwise stated.
2 Data
2.1 CMASS Galaxy Pairs
The goal of this paper is to measure the filamentary dark matter distribution between massive galaxies by stacking weak lensing signal around the galaxy pairs. To construct the galaxy pair catalogue, we use the SDSS-III/BOSS CMASS large-scale structure (LSS) galaxy catalogue (Alam et al., 2015) with the redshift cut Note that we do not impose any selections other than the redshift cut.
The spectroscopic redshift of the CMASS sample enables us to select galaxy pairs with the robust measurement of the line-of-sight distance. In contrast, if we rely on a photometric sample, the typical statistical uncertainty of a photometric redshift , which corresponds to the comoving distance at the typical CMASS redshift, introduces more galaxies pairs without filaments and thus dilutes the filament lensing signal.
We basically follow the process described in Clampitt et al. (2016) to create a galaxy pair sample. We first apply a spatial cut to select CMASS galaxies within the HSC first year full-depth full-color footprints defined in Mandelbaum et al. (2018a), which leaves 14,422 CMASS galaxies. We then apply the line-of-sight distance cut and the physical transverse separation cut . As a result we obtain 70,210 pairs over the HSC first-year fields. We define the position and redshift of the pair as the avarage of the CMASS galaxy positions and redshifts, respectively. The number of pairs is larger than that of galaxies since a galaxy can be shared among multiple pairs. Figure 1 shows the distribution of transverse separation between the CMASS pairs. Figure 2 shows the redshift distribution of the CMASS pairs. In our analysis, we use the weight provided by the BOSS LSS catalogue, i.e., , where accounts for the variation in number density due to local seeing, accounts for the contamination from stars which is a function of stellar density, accounts for the redshift failure, and accounts for the fibre collision. Note that we do not use the FKP weight , since we do not need to optimise galaxy clustering measurement when measuring the filament lensing signal. We define the pair weight as a product of the weights of the CMASS galaxies
We also create random pairs using the random catalogue associated with the CMASS LSS catalogue, following the same redshift and separation cuts as the galaxy pairs. We divide the random catalogue such that each sample has the same number of points as the CMASS galaxies, which results in 96 samples of random pairs. The random pairs are used for correcting observational systematics as described in Section 3.2.
For null tests, we create a separated galaxy pair catalogue with CMASS galaxies. Since galaxies largely separated along the line-of-sight are not expected to have filament between them, we select galaxies with the line-of-sight distance cut , while keeping the same projected physical transverse separation as our pair sample described above.
2.2 HSC Source Galaxies
We use the HSC first-year galaxy shape catalogue as sources to measure filament lensing signal. The details of galaxy shape catalogue is described in Mandelbaum et al. (2018a) and Mandelbaum et al. (2018b), and thus we describe a summary of these papers.
The HSC first-year lensing catalogue is based on the data taken during March 2014 through April 2016 with about 90 nights in total. The total sky coverage is 136.9 deg2 which consists of six distinct fields named GAMA09H, GAMA15H, HECTOMAP, VVDS, WIDE12H, and XMM, and fully overlaps with the BOSS footprint.
The shapes are measured using co-added -band images with a mean seeing FWHM 0.58*′′* and 5 point-source detection limit . Despite of the conservative magnitude cut to achieve robust shape calibration, the weighted number density of source galaxies is 21.8 arcmin*-2*. The galaxy shapes are estimated using the re-Gaussianization PSF correction method (Hirata & Seljak, 2003), which was extensively used and characterised in weak lensing studies with the Sloan Digital Sky Survey (SDSS) data (Mandelbaum et al., 2005; Reyes et al., 2012; Mandelbaum et al., 2013), and then calibrated with the image simulations (Mandelbaum et al., 2018b) generated by the open-source galaxy image simulation package GalSim (Rowe et al., 2015). The calibration factors consist of the multiplicative factor , which is shared among and , and the additive bias for each ellipticity component . The image simulations are also used to calibrate other quantities which are necessary for lensing signal measurement, i.e., the per-component rms shapes , the measurement noise of galaxy shapes , and the inverse variance weight from both and . Note that we use the shape catalogue with a star mask called Sirius.
Among the photo-s provided by the HSC first-year catalogue (Tanaka et al., 2018), we use the photo- estimated by a machine learning method based on self-organising map called MLZ (Carrasco Kind & Brunner, 2014) . This is because MLZ is one of the algorithms which yields the smallest systematic uncertainties in lensing measurement within the redshift range of CMASS galaxies (Miyatake et al., 2019) and is used for creating the mock catalogues which will be described in Section 2.3. The redshift distribution of source galaxies are shown in Fig. 2. The large fraction of source galaxies are at higher redshifts compared to filaments, which allows for high signal-to-noise filement lensing measurement.
2.3 Mock Catalogue
Predicting a filament lensing signal analytically is not straightforward since filaments are not entirely in the linear regime. Analytical estimation of covariance is not straightforward, either, since our filament lensing estimator, which will be described in Section 3.2, uses a source galaxy multiple times and thus strong correlation between spatial bins are expected. In addition, since the HSC first-year field is only deg2, we expect to have large cosmic variance which can contaminate the lensing signal through the intrinsic scatter of filament properties and fluctuations in large scale structure along the line-of-sight. For these reasons, we use the CMASS and source mock catalogue based on -body dark matter only simulations to estimate the theoretical prediction and covariance of filament lensing signal. When estimating these quantities, we use 108 realisations of mocks, each of which corresponds to the measurement with the real data performed in this paper.
For mock source galaxies, we use the mock catalogue generated by Shirasaki et al. (2019). Here we summarise how the source mock catalogue was created. Those who are interested in details should refer to the aforementioned paper. The weak lensing shear in mock catalogue is simulated by full-sky ray-tracing through multiple lens planes (Takahashi et al., 2017) which are constructed from 14 boxes with a different box size. Neighbouring lens planes have the comoving distance interval of . Source galaxies are distributed in the light-cone simulations following the spatial distribution extracted from the actual HSC shape catalogue and the photo- estimated by MLZ. The ellipticity of each galaxy is also extracted from the HSC shape catalogue, but is randomly rotated to vanish coherent shear caused by weak lensing in the actual data. The lensing shear obtained from the ray-tracing simulation is then added to the randomised galaxy shapes to mimic the observed galaxy shapes. Note that the weak lensing shear from ray-tracing simulations includes all light deflections by the density fluctuation along the line-of-sight, and thus can be used to derive covariance including the line-of-sight fluctuations. The mock source catalogue also includes the lensing shear without intrinsic shapes of galaxies, which will be used for estimating a theoretical prediction of our filament lensing signal.
We create our CMASS mocks by populating galaxies in dark matter halos in the N-body simulations used for the ray-tracing simulations, following the halo occupation distribution (HOD; Zheng et al., 2005) estimated from the CMASS galaxy-galaxy clustering and abundance. First, we divide the full CMASS LSS sample into five redshift bins so that the binning scheme should be the same as the lens plane definition in the ray-tracing simulations. When one of the edges of the full CMASS sample, i.e., or , falls within a redshift bin, we truncate the bin at the edge. Therefore, our final redshift binning is , , , , and . We then measure the galaxy abundance and the projected galaxy-galaxy clustering for each redshift bin in the same manner as Miyatake et al. (2015). While using jackknife covariance for clustering, we assume conservative statistical uncertainties for abundance, i.e., of the measured abundance, to absorb the systematic uncertainties in the CMASS selection function due to the depth variations of the survey. To obtain HOD parameters for the CMASS sample within a given redshift bin, we simultaneously fit the projected galaxy-galaxy clustering and abundance signals with cosmological parameters fixed. To model the clustering and abundance, we use the model based on Dark Emulator, which is described in Appendix G in Nishimichi et al. (2018) in detail, without off-centering parameters and incompleteness parameters. We populate central galaxies at the centre of halos and satellite galaxies using the measured HOD. When populating satellites, we assume their radial distribution follows that of dark matter in each host halo. The detail of generation of mock HOD galaxies is found in Shirasaki et al. (2017). We then generate mock pairs in the same manner as described in Section 2.1, which will be used to estimate theoretical prediction and covariance in Section 4.1 and Section 3.3, respectively.
3 Measurement
In this paper, we use the filament lensing signal estimator proposed by Clampitt et al. (2016). This estimator is computed as follows. First, we stretch the pairs such that the line connecting the pairs has the same length. This stretch is done in the same way to both directions of the connecting line and perpendicular to the connecting line. Second, we align the pairs, set up two-dimensional spatial bins by dividing the stretched coordinates into grid cells, and compute the stacked lensing shear in each bin. Finally, we combine the lensing shear computed in multiple bins to cancel out the contribution from dark matter halos. In the following sections, we describe how we compute the lensing signal in a given two-dimensional bin and explain how the Clampitt et al. (2016) estimator cancels out the contribution from halos. We also describe how we estimate the covariance of the filament lensing signal.
3.1 Weak Lensing Measurement
In this section, we describe how to measure the stacked weak lensing signal at a given 2-dimensional bin . Using the HSC galaxy shape catalogue, the stacked excess surface mass density is estimated as
[TABLE]
where denotes the shear component, i.e., is parallel to the line connecting two CMASS galaxies and is the one rotated by 45 degrees against the component, runs over lens-source pairs whose source position falls in the 2-dimensional bin , is the weight function of a lens-source pair based on the CMASS weight and source weight written as
[TABLE]
where and is the CMASS weight of each galaxy in a CMASS pair, is the expected critical surface mass density for a lens-source pair, which corrects for dilution of lensing signal due to foreground source contamination, defined as
[TABLE]
where is the normalised probability distribution function of a photo- of the source galaxy and is defined as
[TABLE]
for and for , where is the angular diameter distance at redshift , is the shear responsivity which corrects for the non-linear operation in the summation process of galaxy ellipticity (e.g., Bernstein & Jarvis, 2002)
[TABLE]
is the weighted mean of the multiplicative bias factor
[TABLE]
and is the additive bias for a lens-source pair .
In Section 4.3, we will show two-dimensional shear map. To compute stacked reduced shear at bin , we use the slightly modified version of Eq (1)
[TABLE]
where denotes the inverse-variance weight optimised for the shacked shear measurement
[TABLE]
3.2 Filament Lensing Estimator
To extract filament lensing signal from weak lensing shear caused by paired galaxies, we use the estimator proposed by Clampitt et al. (2016). This estimator is constructed to cancel out the contribution from lensing signal caused by dark matter halos. Figure 3 shows how this estimator works. Let us suppose to pick up a bin “p1”. Since the weak lensing shear caused by a spherically symmetric dark matter halo exhibits tangential alignment to the line from the halo centre to the source galaxy111As described in Appendix of Clampitt et al. (2016), elliptical dark matter halo would not significantly affect their filament estimator., adding the lensing signal at the point rotated by 90 degrees from “p1”, which is denoted as “p2”, cancels out the contribution from the halo on the left-hand side. In addition, both “p1” and “p2” are also contaminated by the halo on the right-hand side, which can be cancelled out by adding “p3” and “p4”, respectively. Note that the combination of “p3” and “p4” also cancels out the contribution from the halo on the left-hand side. Assuming the filament has translational and line symmetry along the line connecting the halos, the filament lensing estimator can be written as a function of the distance from the connecting line, which is denoted as ,
[TABLE]
Here, the centre of halo on the left-hand side is taken as the origin of the stretched coordinates and the distance between two halos is normalised to unity. We divide the connecting line into 10 bins. The each term in the summation on the right-hand side corresponds to Eq. (1) where we omit for simplicity. For example, when and , the first, second, third, and fourth term corresponds to “p1”, “p2”, “p4”, and “p3.”. The summation for the first bin is denoted as four arrows in Figure 3, which is denoted as the summation of the first four terms in Eq. (9). Under the assumption of line symmetry, the shear at positions mirrored against the connecting line are also in the summation. These shears correspond to the last four terms in Eq. (9). Note that we take the range of as , since are already included in calculating the estimator (see the top arrow in Fig. 3 for the case).
We also subtract filament signals estimated with the random pairs from Eq. (9). Although the random pairs do not exhibit any filament signal, the random signal subtraction corrects for observational systematics, such as imperfect PSF correction and imperfect shape noise cancellation at the edge of survey fields.
3.3 Covariance
Estimating the covariance of the filament lensing estimator is not straightforward, since the filament signal at different bins is expected to be significantly correlated due to intrinsic scatter of filament properties, large scale structure projected along the line-of-sight, and multiple use of source galaxies in the stacking process. Using the mock catalogue of CMASS galaxies and source galaxies populated in the ray-tracing simulations described in Section 2.3, we can estimate the covariance naturally taking into account these effects. More precisely, we estimate the filament lensing covariance as
[TABLE]
where denotes the or component, runs the 108 mock realisations, is the filament lensing estimator of -th mock realisation, and is the estimator averaged over the 108 mock realisations. The correlation matrix of the estimated covariance which is defined as
[TABLE]
The correlation matrix for the component is shown in the left panel of Fig. 4, which exhibits the strong correlation between bins beyond neighbours.
In addition to the observed ellipticity, the mock source galaxy catalogue has the pure weak lensing shear from the ray-tracing simulations. This allows us to estimate covariance without intrinsic shape noise of source galaxies. The right panel of Fig. 4 shows the ratio of the mock shear covariance to the total covariance. The mock shear covariance occupies about 60 percent of the total covariance and is almost constant over both diagonal and off-diagonal components. This means that our filament lensing measurement is no longer limited by the intrinsic shape noise of source galaxies. Rather, the shape noise is comparable to the combination of other sources of covariance which is not relevant to observational conditions, i.e., the fluctuation of large scale structure along the line of sight and the intrinsic scatter of filament properties. This is made possible by the source number density of the HSC survey which is the highest among the ongoing weak lensing surveys.
4 Results
4.1 Filament Lensing Signal
Figure 5 shows our filament lensing measurement of the CMASS pairs with the error bars estimated by the 108 realisations of mock catalogue. We detect the filament signal at 3.9 significance against null hypothesis. As described in Section 3.3, the intrinsic shape noise of source galaxies is already comparable to the combination of other components in the covariance. Therefore, increasing the number density of galaxies would not help to increase signal-to-noise ratio. Rather, increasing survey area will reduce both the shape noise and other components in the covariance.
The theoretical prediction estimated from the weak lensing shear recorded in the mock catalogues is also shown in Fig. 5. The value of the data against the theoretical prediction is with the degree of freedom of 5, which leads to the -value of . Hence, our measurement is consistent with the theoretical prediction. Our data points are consistently smaller from the theoretical prediction, and readers may think our value is too small. This is due to the fact that the filament lensing signals between bins are highly correlated as shown in Section 3.3.
4.2 Null Tests
To confirm our analysis is not dominated by systematic uncertainties we perform null tests by measureing the mode of the CMASS pair lensing signal and the and modes of the separated CMASS pair lensing signal.
We expect the mode of the filament lensing estimator is consistent with zero due to the translational symmetry of the filament along the line connecting the pair. The -mode signal is shown in Fig. 6 and the value and -value are summarised in Table 1, which confirms that the the mode is consistent with null.
We also expect both the mode and the mode of the separated pair signal are consistent with null, since the separated pair is defined such that their line-of-sight distance is as described in Section 2.1 and we do not expect massive filaments exist between the halos. These signals are shown in Fig. 6 and the values and -values are summarised in Table 1. We also confirm that separated pair signals are consistent with null.
4.3 Two-dimensional Shear and Convergence Map
The left panel of Fig. 7 shows two-dimensional stacked shear map of our CMASS pair sample. The vertical shear between CMASS halos are the sum of the tangential shear from CMASS halos and filament shear. Just from this figure it is not clear if there is a filament between halos. This demonstrates that it is hard to distinguish the filaments component from dark matter halos in two-dimensional shear map. However, the Clampitt et al. (2016) estimator nicely eliminates the contributions from halos, and thus isolates the signal from the filaments, as described in Section 4.1. In Fig. 7, we observe lensing shear surrounding the pair at large scales. This is part of the galaxy-galaxy-shear correlation function, which was measured by Simon et al. (2013).
From this shear map, we compute the convergence map, which is shown in the right panel of Fig. 7. In doing so, we use the prescription by Kaiser & Squires (1993) with the convolution kernel adopted in Miyazaki et al. (2015), i.e.,
[TABLE]
where is the tangential component of the shear at the position with respect to and is the convolution kernel
[TABLE]
We choose the width of kernel as . In this convergence map, we can clearly see the diffuse filament between circularly symmetric galaxy halos. This independently supports the “thick” filament predicted by the -body simulations rather than the “thin” filament modelled by a line of small halos.
4.4 Comparison with Previous Filament Lensing Measurements
The first detection of the filament between massive galaxy pairs was made by Clampitt et al. (2016) using SDSS LRG pairs at a typical redshift and SDSS source galaxies, where they used the exactly same estimator as ours. We significantly extend the redshift range of galaxy pairs to . The significance level of their detection in their measurement was 4.5, which is slightly higher than ours despite of their low number density of source galaxies ( arcmin*-2*). This is because their survey area ( deg2) is much larger than ours ( deg2), and thus their measurement is not limited by the large scale structure noise. This in turn means that we will soon be able to measure the lensing signal at a higher signal-to-noise ratio as the HSC survey area increases. The amplitude of their filament signal is as twice as large as ours. This is likely due to the difference in halo mass between the LRG and CMASS sample, i.e., the CMASS sample is less massive than LRG, which results in less massive filaments. This might be also because the structure growth is larger at than those at , so the filaments may have more masses even if the mass of the halos are the same. We may check this effect by using mock simulations, but this is beyond the scope of this paper.
Epps & Hudson (2017) reported the filament measurement of galaxy pairs of the combined BOSS LOWZ and CMASS sample with the mean redshift of , using the CFHTLenS source galaxies (Heymans et al., 2012). Using the two-dimensional convergence map where the contribution from halos was removed by using their “control” sample, they claimed the detection at 5 significance. They explored modelling the filament signal by the galaxy-galaxy-convergence three point correlation function, and found reasonable agreement with their measurement. In contrast, our pair sample purely consists of the CMASS sample which pushed the mean redshift to . We also derive the more robust theoretical prediction using the mock CMASS pairs and source galaxies based on ray-tracing simulations.
He et al. (2018) reported the first detection of filament lensing signal imprinted in CMB by cross-correlating the filament map derived from the CMASS galaxies (Chen et al., 2016) with the Planck CMB convergence map (Planck Collaboration et al., 2014b) in Fourier space. Note that their filament sample is intrinsically different from our sample. They observed filaments where CMASS galaxies reside whereas we observe filaments between CMASS pairs, and thus their filament sample is expected to be more massive than ours.
The main focus of de Graaff et al. (2019) was probing missing baryons through thermal Sunyaev-Zel’dovich effect (tSZ; Sunyaev & Zeldovich, 1969, 1972) from filaments between CMASS pairs, but they also measured lensing signal using the Planck convergence map to investigate the connection between gas and dark matter filaments. Their two-dimensional convergence measurement yielded 1.9, which is smaller than our measurement despite of their use of the entire CMASS sample without any spatial cut. This fact demonstrates the statistical power of the HSC survey enabled by the high number density or source galaxies. In addition, HSC source galaxies has the lensing kernel which matches to the CMASS sample better than CMB lensing.
5 Conclusions
We have measured weak gravitational lensing caused by filamentary structures between the CMASS galaxy pairs using the Subaru HSC first-year galaxy shape catalogue. Desite of the small overlap between BOSS and HSC ( deg2), the high number density of the HSC shape catalogue ( arcmin*-2*) enabled us to measure the filament lensing signal at 3.9 significance, which is the highest signal-to-noise measurement of the filament between high-redshift () galaxy-scale halos to date. We have used the Clampitt et al. (2016) estimator to cancel out the contribution from the dark matter halos and extract the signal from the filaments. We have found that the covariance is highly correlated and the contribution from the combination of the intrinsic scatter of filament properties and the fluctuations in large scale structure is already comparable to the contribution from the intrinsic shape noise from source galaxies. This demonstrates the statistical power of the HSC survey. We expect the signal-to-noise ratio will rapidly increase as the survey field grows. At the end of the HSC survey, the signal-to-noise ratio of our measurement will be improved by the factor of three, which will allows us to do more detailed studies such as the dark matter distribution and redshift evolution of filaments. We have observed negative value of the Clampitt et al. (2016) estimator, which supports the “thick” filament model and consistent with what Clampitt et al. (2016) found in the LRG pair sample. We have confirmed this fact by drawing the two-dimensional convergence map.
de Graaff et al. (2019) performed a pioneering work to combine multi-wavelength data to study the connection between light, gas, and dark matter within filaments. In coming years, as various surveys for imaging, spectroscopic, X-ray, and SZ will collect more data, more detailed studies to investigate such astrophysical properties of filaments will become possible.
Using the ongoing and upcoming spectroscopic surveys such as SDSS-IV/eBOSS (Dawson et al., 2016), Dark Energy Spectroscopic Instrument (DESI; DESI Collaboration et al., 2016), and Subaru Prime Focus Pectrograph (PFS; Takada et al., 2014), we can extend the redshift range of a filament sample. In addition, the upcoming imaging surveys such as Large Synoptic Survey Telescope (LSST; LSST Science Collaboration et al., 2009), Euclid (Laureijs et al., 2011), Wide-field Infrared Survey Telescope (WFIRST; Spergel et al., 2015) will enable us to pursue the weak lensing measurement of these filaments with even higher signal-to-noise ratio.
Acknowledgements
The Hyper Suprime-Cam (HSC) collaboration includes the astronomical communities of Japan and Taiwan, and Princeton University. The HSC instrumentation and software were developed by the National Astronomical Observatory of Japan (NAOJ), the Kavli Institute for the Physics and Mathematics of the Universe (Kavli IPMU), the University of Tokyo, the High Energy Accelerator Research Organization (KEK), the Academia Sinica Institute for Astronomy and Astrophysics in Taiwan (ASIAA), and Princeton University. Funding was contributed by the FIRST program from Japanese Cabinet Office, the Ministry of Education, Culture, Sports, Science and Technology (MEXT), the Japan Society for the Promotion of Science (JSPS), Japan Science and Technology Agency (JST), the Toray Science Foundation, NAOJ, Kavli IPMU, KEK, ASIAA, and Princeton University.
The Pan-STARRS1 Surveys (PS1) have been made possible through contributions of the Institute for Astronomy, the University of Hawaii, the Pan-STARRS Project Office, the Max-Planck Society and its participating institutes, the Max Planck Institute for Astronomy, Heidelberg and the Max Planck Institute for Extraterrestrial Physics, Garching, The Johns Hopkins University, Durham University, the University of Edinburgh, Queen’s University Belfast, the Harvard-Smithsonian Center for Astrophysics, the Las Cumbres Observatory Global Telescope Network Incorporated, the National Central University of Taiwan, the Space Telescope Science Institute, the National Aeronautics and Space Administration under Grant No. NNX08AR22G issued through the Planetary Science Division of the NASA Science Mission Directorate, the National Science Foundation under Grant No. AST-1238877, the University of Maryland, and Eotvos Lorand University (ELTE).
This paper makes use of software developed for the Large Synoptic Survey Telescope. We thank the LSST Project for making their code available as free software at http://dm.lsst.org.
Based in part on data collected at the Subaru Telescope and retrieved from the HSC data archive system, which is operated by the Subaru Telescope and Astronomy Data Center at National Astronomical Observatory of Japan.
HM acknowledges the support from JSPS KAKENHI Grant Number JP18H04350, JP18K13561, and JP19H05100. MS acknowledges the support in part from by JSPS KAKENHI Grant Number JP18H04358. Numerical computations were in part carried out on Cray XC50 at Center for Computational Astrophysics, National Astronomical Observatory of Japan. AJN acknowledges the support in part by MEXT KAKENHI Grant Number 15H05890.
The reference list from the paper itself. Each links out to its DOI / PubMed record.
- 1Aihara et al. (2018 a) Aihara H., et al., 2018 a, PASJ , 70, S 4 · doi ↗
- 2Aihara et al. (2018 b) Aihara H., et al., 2018 b, PASJ , 70, S 8 · doi ↗
- 3Alam et al. (2015) Alam S., et al., 2015, Ap JS , 219, 12 · doi ↗
- 4Bernstein & Jarvis (2002) Bernstein G. M., Jarvis M., 2002, AJ , 123, 583 · doi ↗
- 5Carrasco Kind & Brunner (2014) Carrasco Kind M., Brunner R. J., 2014, MNRAS , 438, 3409 · doi ↗
- 6Chen et al. (2016) Chen Y.-C., Ho S., Brinkmann J., Freeman P. E., Genovese C. R., Schneider D. P., Wasserman L., 2016, MNRAS , 461, 3896 · doi ↗
- 7Clampitt et al. (2016) Clampitt J., Miyatake H., Jain B., Takada M., 2016, MNRAS , 457, 2391 · doi ↗
- 8Colless et al. (2001) Colless M., et al., 2001, MNRAS , 328, 1039 · doi ↗