New Chandra observations of PG 1116+215 to investigate an extragalactic OVIII WHIM absorption line
Massimiliano Bonamente, Jussi Ahoranta, Jukka Nevalainen, Patrick Holt

TL;DR
This paper analyzes new Chandra observations of PG 1116+215 to assess the consistency of an OVIII WHIM absorption line detection, finding no significant line due to lower signal-to-noise in the new data.
Contribution
It provides a comparative analysis of new and previous Chandra data, highlighting the challenges in detecting faint WHIM absorption lines under varying observational conditions.
Findings
New observations are consistent with previous data at the OVIII line wavelength.
Lower signal-to-noise prevented a significant detection of the WHIM line.
The WHIM line detection remains inconclusive due to observational limitations.
Abstract
This is a short AAS Research Note on the analysis of new Chandra observations of PG 1116+215, for which an extragalactic OVIII WHIM line was reported by Bonamente et al. (2016). The new observations occurred at a time when the source flux was three times lower, and the background was three times higher, than in the earlier observations. The analysis described in this research note show that the new observations are consistent with the old one at the wavelengths of the OVIII WHIM line, and the lower signal-to-noise of the new data did not permit a significant detection of the line in the new data.
Click any figure to enlarge with its caption.
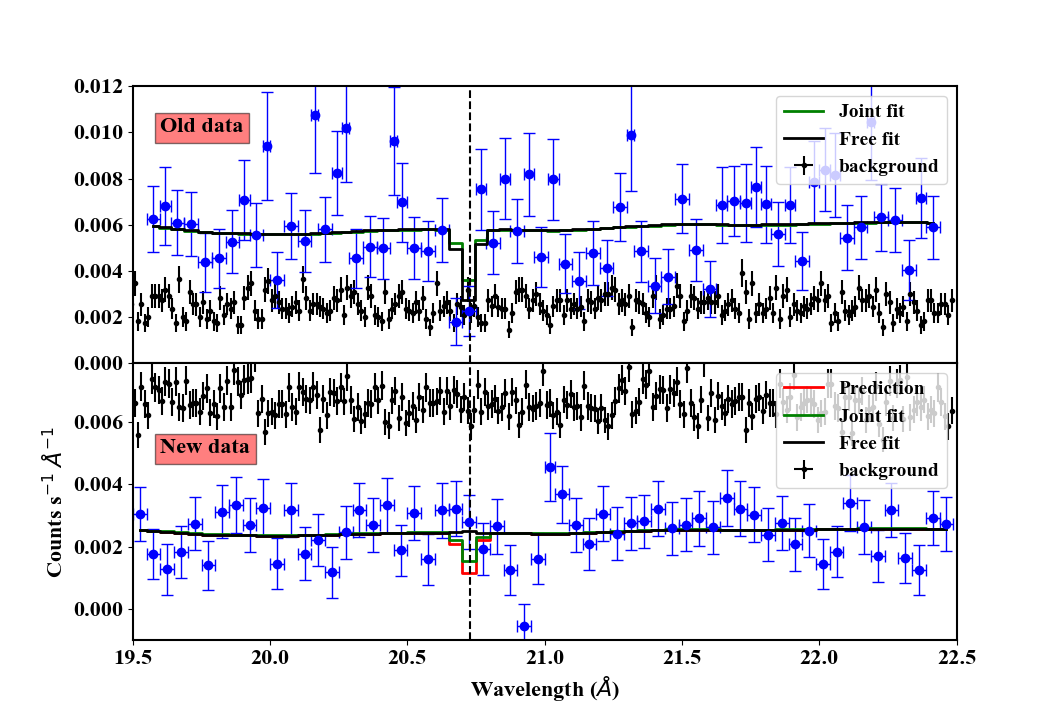 Figure 1
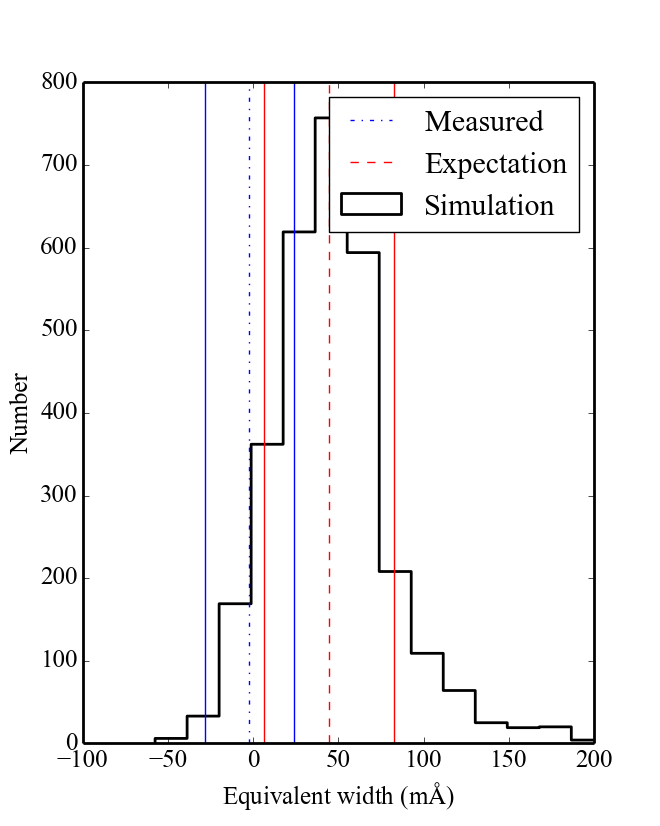 Figure 2
Peer Reviews
No public reviews on file for this paper yet. If you reviewed it on a platform where reviews are public (OpenReview, ICLR, NeurIPS, ICML), you can paste yours below so the community can read it here.
Videos
No videos yet. Explain this paper in a talk, walkthrough, or lecture? Add one.
New CHANDRA observations of PG 1116+215 to investigate an extragalactic O VIII WHIM absorption line
Massimiliano Bonamente
University of Alabama in Huntsville, Huntsville, AL 35899, USA
Jussi Ahoranta
University of Helsinki, Helsinki, Finland
Jukka Nevalainen
Tartu Observatory, Tartu, Estonia
Patrick Holt
University of Alabama in Huntsville, Huntsville, AL 35899, USA
(Received January 1, 2018; Revised January 7, 2018)
cosmology: observations; (cosmology): large-scale structure of the universe; X-rays: individual (PG 1116+215)
††journal: RNAAS
1 Introduction and Data Analysis
In Bonamente et al. (2016) we reported the detection of O VIII absorption line from the quasar PG 1116+215, associated with a O VI system (Tilton et al., 2012), and interpreted as warm–hot intergalactic medium (WHIM) along the sightline. The report was based on a 90 ks Chandra HRC/LETG observation taken in 2002. In 2018 we observed the source in the same Chandra configuration for an additional 280 ks.
The new and old data were reduced with the standard Chandra CIAO 4.9 tools (Fruscione et al., 2006) to generate a single spectrum that combines the order data. The spectra were then analyzed in XSPEC (Arnaud, 1996) in the 19.5–22.5 Å range, chosen to have a sufficient baseline to determine the continuum, and narrow enough for an accurate modelling of the background with a simple power–law model (Figure 1). The two spectra were fit simultaneously, each with a power–law plus a zgauss model with fixed redshift , corresponding to the Tilton et al. (2012) O VI detection. In the first fit, the zgauss normalizations are left free between the two models; at the wavelength of the expected O VIII K line ( Å), the 2002 data show a significant absorption feature (XSPEC normalization ) while the 2018 data show no significant absorption (), for a Cash fit statistic for 473 degrees of freedom. In the second fit, the zgauss models were linked to ensure the same equivalent width for the two O VIII lines; the normalization becomes for the 2002 data (and for the 2018 data, lower than the 2002 data because of its lower flux) for with 474 d.o.f. 111In the original analysis of the 2002 data, we reported , differences may be due to changes in calibrations and in the choice of fitting bands. We also reported a free-redshift analysis of this line, in which the best–fit redshift was .
In the new data the source intensity was fainter by approximately a factor of two ( photons s*-1* cm*-2* Å in 2018, in 2002), while the HRC/LETG first–order efficiency was also lower by % compared to the 2002 data, leading to an observed source flux 3 times lower in 2018. Moreover, the background was also times higher in the new 2018 data compared to the 2002 data, due to a known anti–correlation with Solar cycle activity. In the 19.5–22.5 Å band, the source accounts for 27.2% of the total counts for the 2018 data, and 69.8% for the 2002 data.
2 Simulations to assess statistical consistency between 2002 and 2018 data
To investigate whether the two datasets are consistent, we simulated 3,000 total and background spectra for the 2018 data, using the O VIII equivalent width predicted from the 2002 data and its error. The redshift of the O VIII line was fixed at the nominal value. We used an analytical model of the background in the 19.5–22.5 Å range; this model was used to simulate the background and the total spectrum using the fakeit command in XSPEC, for each iteration of the simulation. The equivalent width was calculated according to , negative values indicate excess emission (Figure 1, right panel).
3 Discussion and conclusions
The simulations indicate that the O VIII line was expected to have an equivalent width of mÅ, based on the estimates from the 2002 observations. The measurement was mÅ, i.e, the 2018 data did not provide a positive detection of the line.
We performed two quantitative tests of the consistency between the O VIII line in the 2002 and 2018 data. First, the 2018 measurement of the EW corresponds to the 6.6 one–sided percentile of the expected distribution based on the 2002 data, for a 6.6% probability to obtain such a small EW, or smaller. Second, the difference between the 2018 measurement and the expectation is mÅ, i.e., the measurement falls just outside the 1– interval. Assuming Gaussian distributions, there is a 32% probability for such value of the difference, or larger. Neither test can significantly exclude the hypothesis that the 2018 data are consistent with the 2002 data. We only used statistical (Poisson) errors in the simulation of the spectra. The use of an additional systematic errors would bring the measurement and expectation into an even better agreement.
We conclude that the 2018 observations of PG 1116+215 are consistent with the 2002 observations, at the wavelengths of the O VIII K line. The low flux of the source and higher background did not permit the confirmation of the WHIM line made in Bonamente et al. (2016) with greater confidence than in the original data.
The reference list from the paper itself. Each links out to its DOI / PubMed record.
- 1Arnaud (1996) Arnaud, K. A. 1996, in Astr. Data Analysis Software and Systems V, ed. G. H. Jacoby & J. Barnes, Vol. 101, 17
- 2Bonamente et al. (2016) Bonamente, M., Nevalainen, J., Tilton, E., et al. 2016, MNRAS, 457, 4236, doi: 10.1093/mnras/stw 285 · doi ↗
- 3Fruscione et al. (2006) Fruscione, A., Mc Dowell, J. C., Allen, G. E., et al. 2006, in SPIE Conference Series, Vol. 6270, 62701 V
- 4Tilton et al. (2012) Tilton, E. M., Danforth, C. W., Shull, J. M., & Ross, T. L. 2012, Ap J, 759, 112, doi: 10.1088/0004-637X/759/2/112 · doi ↗