An Effective Semiclassical Approach to IR Spectroscopy
Marco Micciarelli, Fabio Gabas, Riccardo Conte, and Michele Ceotto

TL;DR
This paper introduces a new semiclassical molecular dynamics method for calculating IR spectra that captures quantum effects, anharmonicities, and spectral shapes, enabling analysis of complex molecular systems without state-to-state calculations.
Contribution
The novel approach improves IR spectral calculations by avoiding state-to-state computations and accurately including spectral shapes, quantum effects, and anharmonicities.
Findings
Accurate IR spectra for water and glycine obtained
Method captures spectral shapes and quantum effects
Applicable to systems with dense vibrational states
Abstract
We present a novel approach to calculate molecular IR spectra based on semiclassical molecular dynamics. The main advance from a previous semiclassical method [M. Micciarelli, R. Conte, J. Suarez, M. Ceotto J. Chem. Phys. 149, 064115 (2018)] consists in the possibility to avoid state-to-state calculations making applications to systems characterized by sizable densities of vibrational states feasible. Furthermore, this new method accounts not only for positions and intensities of the several absorption bands which make up the IR spectrum, but also for their shapes. We show that accurate semiclassical IR spectra including quantum effects and anharmonicities for both frequencies and intensities can be obtained starting from semiclassical power spectra. The approach is first tested against the water molecule, and then applied to the 10-atom glycine aminoacid.
Click any figure to enlarge with its caption.
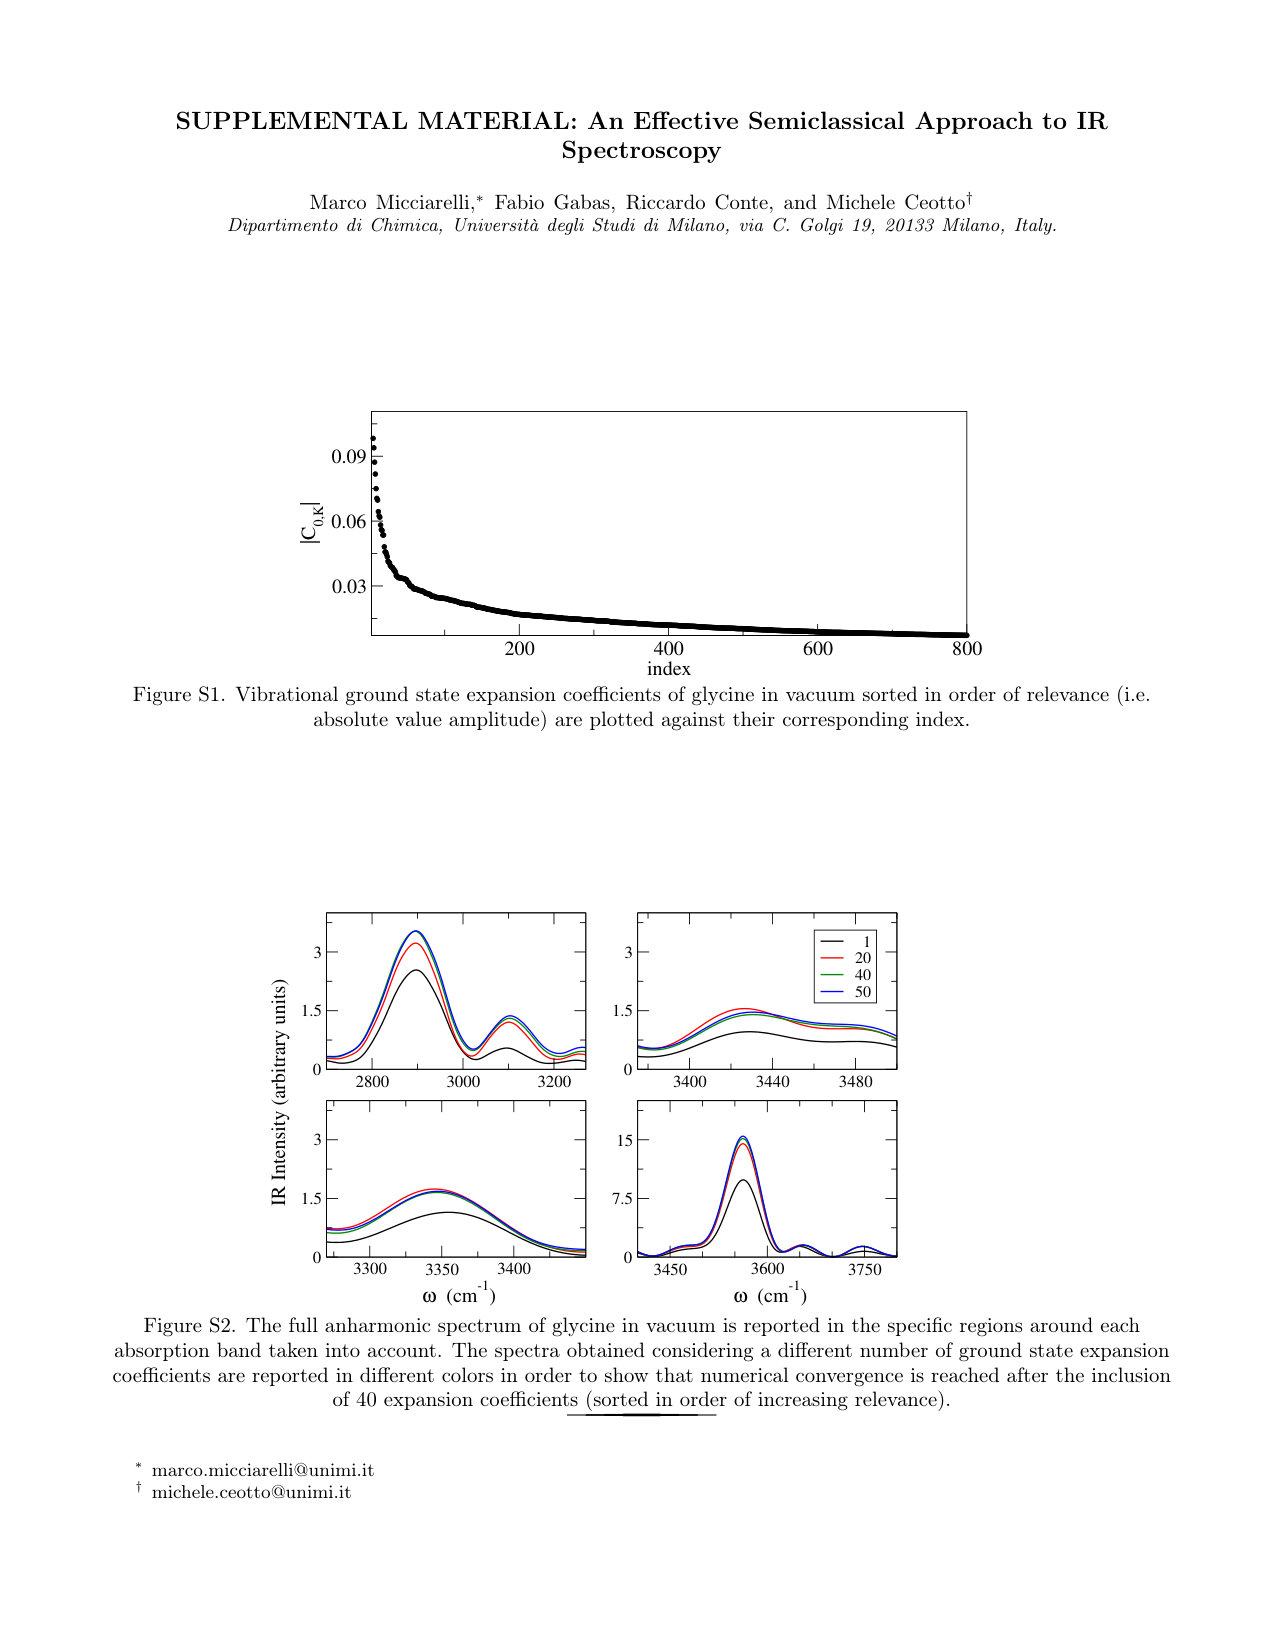 Figure 1
| Assignment | MC-TA-SCIVR | |||||||||||||
| (Modes) | Harmonic | Anharmonic | ||||||||||||
| (B3LYP/aug-cc-pVDZ) | ||||||||||||||
| aaaaaaaa | aaaaaaaa | aaaaaaaa | aaaaaaaa | |||||||||||
| (20;21) | 3051; 3089 | 0.08; 0.03 | 2900 | 0.07 | Expt. | |||||||||
| (22;23) | 3495; 3568 | 0.01; 0.02 | 3345; 3430 | 0.03; 0.01 | ||||||||||
| OH (24) | 3735 | 0.25 | 3563 | 0.25 | aaaa | aaaa | ||||||||
| GVPT2 | 0.04 | |||||||||||||
| Harmonic | Anharmonic | 0.03;0.01 | ||||||||||||
| (B3LYP/N07D) | 0.25 | |||||||||||||
| aaaaaaaa | aaaaaaaa | aaaaaaaa | aaaaaaaa | |||||||||||
| (20;21) | 3044; 3079 | 0.08; 0.03 | 2938; 2929 | 0.09; 0.04 | ||||||||||
| (22;23) | 3509; 3582 | 0.01; 0.03 | 3387; 3407 | 0.01; 0.02 | ||||||||||
| OH (24) | 3750 | 0.25 | 3568 | 0.25 | ||||||||||
Peer Reviews
No public reviews on file for this paper yet. If you reviewed it on a platform where reviews are public (OpenReview, ICLR, NeurIPS, ICML), you can paste yours below so the community can read it here.
Videos
No videos yet. Explain this paper in a talk, walkthrough, or lecture? Add one.
An Effective Semiclassical Approach to IR Spectroscopy
Marco Micciarelli
Fabio Gabas
Riccardo Conte
Michele Ceotto
Dipartimento di Chimica, Università degli Studi di Milano, via C. Golgi 19, 20133 Milano, Italy.
Abstract
We present a novel approach to calculate molecular IR spectra based on semiclassical molecular dynamics. The main advance from a previous semiclassical method [M. Micciarelli, R. Conte, J. Suarez, M. Ceotto J. Chem. Phys. 149, 064115 (2018)] consists in the possibility to avoid state-to-state calculations making applications to systems characterized by sizable densities of vibrational states feasible. Furthermore, this new method accounts not only for positions and intensities of the several absorption bands which make up the IR spectrum, but also for their shapes. We show that accurate semiclassical IR spectra including quantum effects and anharmonicities for both frequencies and intensities can be obtained starting from semiclassical power spectra. The approach is first tested against the water molecule, and then applied to the 10-atom glycine aminoacid.
I Introduction
Infrared (IR) spectroscopy is commonly employed for chemical characterization owing to some peculiar features which include its cheapness, portability to different environments, and generally short execution times. The main features of an IR spectrum, from which important information about molecular structure and interactions can be obtained, include the frequencies of vibrational transitions, the shapes of absorption bands, and their intensities. However, experimental measures can be of difficult interpretation. This is especially true when the IR spectrum consists of many overlapping absorption bands, which make it hard to assign fingerprint and stretch vibrations. It is in this setting that theoretical simulations of IR spectra may be crucial, allowing to decompose the spectrum into specific molecular motions. This is usually achieved first relying on the normal modes of vibration as a basic harmonic approximation, and then refining the theory by including anharmonicity effects.(Mathias et al., 2011; Gaigeot, 2010)
The frequencies of vibrational transitions can be calculated reliably and accurately through Semiclassical (SC) molecular dynamics.(Heller, 1981a; Kaledin and Miller, 2003a, b) In fact, a SC propagator is able to regain quantum effects from a classical Hamiltonian dynamics and several SC methods have been introduced to estimate quantum frequencies of vibration upon calculation of power spectra.(Heller, 1981b; Herman and Kluk, 1984; Miller, 2001, 2005; Zhang and Pollak, 2004a, 2005, b; Shalashilin and Child, 2004, 2001) In practice, a quantum reference state is chosen and the vibrational eigenenergies are obtained from the Fourier transform of its survival amplitude. It is then trivial to calculate the vibrational transition frequencies by difference with respect to the zero-point energy (ZPE).(Ma et al., 2018; Tamascelli et al., 2014; Di Liberto and Ceotto, 2016)
Recent advances have permitted to get SC power spectra of systems characterized by many degrees of freedom. This has been achieved in our group by developing innovative methodologies like the multiple coherent (MC) and the divide-and-conquer (DC) semiclassical initial value representation (SCIVR). MC SCIVR is based on a tailored choice of reference state and dynamics initial conditions. In this way, accurate results are collected running just a few or even a single classical trajectory.(Ceotto et al., 2009a; Ceotto, Tantardini, and Aspuru-Guzik, 2011; Conte, Aspuru-Guzik, and Ceotto, 2013; Ceotto, Dell‘ Angelo, and Tantardini, 2010) Such a reduction in the needed computational effort has opened up the possibility to employ ab initio on-the-fly dynamics and to apply the semiclassical formalism to systems with many degrees of freedom.(Ceotto et al., 2009b, 2011; Ceotto, Zhuang, and Hase, 2013; Zhuang et al., 2012) When dealing with high dimensional systems, though, it is not always possible to get a sensible spectroscopic signal with a full dimensional SC approach. In the case of a system-bath model, one can employ a mixed semiclassical approach with an accurate semiclassical propagator for the system and a less accurate one for the bath.(Buchholz, Grossmann, and Ceotto, 2016, 2017, 2018) However, in general, DC SCIVR has been introduced to overcome the curse of dimensionality issue.(Ceotto, Di Liberto, and Conte, 2017) The technique, still based on full dimensional classical molecular dynamics, allows to compute semiclassical power spectra in reduced dimensionality within a set of appropriately chosen subspaces. The total spectrum is eventually obtained by collecting the low dimensional spectra calculated in the subspaces. Some representative applications of these techniques include fullerene,(Ceotto, Di Liberto, and Conte, 2017) glycine,(Gabas, Conte, and Ceotto, 2017) benzene,(Di Liberto, Conte, and Ceotto, 2018a) water clusters,(Di Liberto, Conte, and Ceotto, 2018b) the protonated glycine dimer and H2-tagged protonated glycine.(Gabas et al., 2018)
Regarding band shapes, they arise naturally in dynamical approaches, like SC ones, from the Fourier transform and include the effect of any interactions experienced along the dynamics. This is different from common stick spectra in which a single central transition is representative of the whole absorption band whose shape is modeled by means of an ad hoc Lorentzian function.
Finally, the accurate estimate of spectral intensities is still a partially open issue and the missing tile for a complete semiclassical simulation of IR spectra. The straightforward approach to the problem deals with the calculation of the dipole autocorrelation, since its Fourier transform returns the correct estimates for both transition frequencies and intensities.(Heller, 1981a; Wehrle, Sulc, and Vanicek, 2014; Patoz, Begusic, and Vanicek, 2018; Wehrle, Oberli, and Vaníček, 2015; Zambrano, Šulc, and Vaníček, 2013; Šulc and Vaníček, 2012; Antipov et al., 2017; Begušić, Roulet, and Vaníček, 2018; Begušić et al., 2018; Tatchen and Pollak, 2009) Strictly speaking, though, the presence of two propagators leads semiclassically to a double phase-space integration, which makes the calculation very hard to converge due to the oscillations produced by the phase differences between trajectories with different initial conditions.
Several methods have been developed to try to overcome this issue. A possible strategy consists in easing the calculation by means of a filter able to damp the oscillations, hopefully without spoiling the results.(Filinov, 1986; Makri and Miller, 1988; Church, Antipov, and Ananth, 2017) Another possibility is represented by the linearization approximation, which leads to a semiclassical expression based on a single phase space integration and formally equal to its classical counterpart, but with Wigner functions replacing classical ones.(Sun and Miller, 1997; Sun, Wang, and Miller, 1998a, b; Liu and Miller, 2007, 2008) This kind of approximation has the drawback that it is unable to account for quantum coherence between distinct trajectories and is affected by the zero point energy leakage problem, which is not the case for the original SCIVR formulation.(Buchholz et al., 2018) A more accurate approach would be based on the rearrangement of the dipole autocorrelation in a suitable way for application of the forward-backward SC formula obtained by stationary phase approximating the primitive SC expression. In this way a single phase space integration is needed, quantum coherences are included, and oscillations are quenched due to the evolution of trajectories first forward and then backward in time.(Makri and Thompson, 1998; Shao and Makri, 1999; Sun and Miller, 1999; Martin-Fierro and Pollak, 2006; Pollak and Martin-Fierro, 2007) In all cases, though, the challenge is to go beyond model systems and to be able to get semiclassical IR spectra even for molecules of sizable dimensionality, i.e. the goal already reached for power spectra.
For this purpose a SC methodology able to reproduce IR spectra has been introduced very recently.(Micciarelli et al., 2018) It is based on the calculation of oscillator strengths from vibrational eigenfunctions represented as linear combinations of harmonic functions. The coefficients of the linear combinations are obtained after collecting information from an appropriate set of SC power spectrum simulations in which harmonic states are employed as reference states. The approach takes advantage from the techniques developed for power spectra, and applications to systems with many degrees of freedom are in principle feasible. Results for the water molecule are indeed in excellent agreement with the quantum benchmark, but the method has the drawback to require calculation of contributions from all states involved in the transitions that make up the several absorption bands in the IR spectrum, which is unpractical for systems characterized by large densities of vibrational states.
The principal aim of the present paper is to take SC IR spectroscopy to the same level of applicability as SC power spectrum investigations. The goal is achieved by decomposing the IR spectrum into a sum of dynamical correlation functions, which can be calculated from SC power spectra and allows to avoid the undesired state-to-state computations. The paper outline is as follows: In Section II we detail the theory behind the new method; Section III is devoted to two representative applications. Specifically, application to water yields results of excellent accuracy, while application to the high energy fundamentals of glycine points out the importance of electrical and mechanical anharmonicity, and demonstrates the possibility to get reliable IR spectra for higher dimensional systems. A summary and some conclusions end the paper.
II Theory
**Eigenvalues, eigenfunctions and transition dipoles **For a molecular system governed by the vibrational Hamiltonian operator
[TABLE]
with potential energy surface (PES) given by the electronic Born-Oppenheimer adiabatic energy, we are interested in studying the spectral decomposition of in terms of vibrational bound states beyond the harmonic approximation, i.e. in solving the eigenvalue problem
[TABLE]
An analytical solution to Eq.(2) is in general not available, so numerical and approximate strategies are needed. For this purpose, the theoretical foundation of the formalism employed in this work lies on the adoption of the time propagation operator
[TABLE]
to compute the time dependent survival amplitude of an arbitrary reference state
[TABLE]
where the second equality is obtained upon introduction of the representation of the propagator in the basis of the Hamiltonian eigenvectors.
Eq. (4) implies that both squared projections of the reference state onto the eigenvectors and eigenvalues can be determined respectively from peak amplitudes and positions of the following power spectrum
[TABLE]
The dynamical convolution function is a delta-nascent function centered on with amplitude approaching zero as . It has the analytical form of a sinc function if the exact propagator is employed.
While eigenvalues are obtained straightforwardly, determination of eigenvectors requires a more elaborated strategy. In a recent paper(Micciarelli et al., 2018) we have shown how vibrational eigenstates can be derived from SC power spectra. For a generic system with vibrational degrees of freedom, the starting point is the representation of the eigenvectors as a linear combination of -dimensional harmonic states
[TABLE]
is the number of states in the basis set, are real coefficients, and is the generic -th element of the complete and orthonormal N-dimensional basis set \left\{\ket{\textbf{\phi}_{{\mathbf{K}}}}\right\}. Each element of the basis set is obtained as the Hartree product of one-dimensional harmonic states
[TABLE]
and
[TABLE]
where , , and are, respectively, the -th normal mode coordinate displacement from equilibrium, frequency, and quantum number. indicates the -th order Hermite polynomial in the variable . The square modulus of coefficients can be computed considering that they are proportional to the intensity, at the eigenvalue of the vibrational Hamiltonian, of the Fourier transform of the survival amplitude with reference harmonic state , i.e. . As shown in details in our previous work,(Micciarelli et al., 2018) the signed coefficients in Eq. (6) can be calculated from survival amplitudes using the following working formula
[TABLE]
where is the harmonic ground state, is the value at energy of the power spectrum obtained with the harmonic state , and
[TABLE]
The same coefficients can be exploited to evaluate the transition dipole between an initial state and a final state
[TABLE]
which is needed for calculating the absorption spectrum. In Eq.(11) and is the molecular dipole made of two contributions: is the nuclear part; is the electronic dipole with representing the adiabatic electronic ground state wavefunction for a given nuclear configuration. Calculation of the nuclear contribution is trivial, while the electronic one requires a Monte Carlo estimate.(Micciarelli et al., 2018) The latter can be avoided by means of the widely employed linearization approximation to the dipole
[TABLE]
Eq.(11) then can be rearranged as
[TABLE]
where is a quantity easy to compute and routinely returned by the most popular electronic structure softwares. Eq.(13) represents the fully anharmonic estimate of transition dipoles within the linearized dipole approximation. Other, more approximate formulae can be adopted to ease the calculation. For instance, the initial state can be approximated by a single harmonic state , i.e. . This leads to
[TABLE]
We refer to Eq.(14) as the semi-anharmonic transition dipole. Finally, the harmonic approximation can be invoked also for the final state, so that and the transition dipole takes the simpler form
[TABLE]
This is the case commonly known as the harmonic electrical approximation, which is often coupled in basic spectroscopy calculations to its mechanical counterpart (i.e. the harmonic estimate of frequencies) under the collective name of double harmonic approximation.
A matrix element like the one in Eq.(15) can be readily evaluated. In fact
[TABLE]
which is obtained starting from , with and being the harmonic oscillator creation and annihilation operators, respectively, for normal mode . Eq.(16) incorporates the harmonic selection rules, which permit to simplify Eq.(13) by neglecting many zero-valued terms
[TABLE]
The second sum in Eq.(13) is restricted in Eq.(17) to the basis set elements obtained by exciting or de-exciting the -th degree of freedom, i.e. the states such that or . Furthermore
[TABLE]
**The IR spectrum from power spectra **Our target is the calculation of the following spectrum
[TABLE]
in which the sum runs over all the spectral lines from the -th to the -th vibrational states. This is an approximate expression for the IR absorption of a system initially lying on the -th pure Hamiltonian eigenstate and perturbed by a radiation of frequency polarized along the direction, which takes the energy of the system to . The spectral lines are broadened over a finite range of energies by means of the dynamical convolution function . Details on this approach and derivation of Eq.(19) are presented in Appendix A.
It is convenient to start by considering the following IR spectrum in which the transition dipoles are treated by means of the semi-anharmonic approximation (see Eq.(14))
[TABLE]
where
[TABLE]
Inserting Eq.(17) (with ) into Eq.(20) and expanding the square in the sum, we get
[TABLE]
where the indexes and run over the normal modes. Proper combination of Eq.(5), Eq.(6), and Eq.(10) permits to rearrange Eq.(22) in terms of power spectra only. In fact, by means of
[TABLE]
and inverting in Eq.(22) the sum over (that we do not want to compute) and the sum over (that we want to keep explicit), after some straightforward algebra we get
[TABLE]
It is worth noting that in Eq.(24) the dependence of the power spectra on the radiation frequency has been explicitly indicated, as derived from the anticipated key relation .
Eventually, the (fully anharmonic) IR spectrum defined in Eq.(19) can be obtained (see Appendix B for derivation details) as
[TABLE]
where in the sum over the elements of the basis set are sorted in some arbitrary way. Eq.(24) and Eq.(25) demonstrate that a state-to-state computation is not required, and that, if power spectra are calculated exactly, it is only the fully anharmonic estimate that demands for coefficients (i.e. for knowledge of the eigenfunction of the initial state).
**Semiclassical power spectra **In semiclassical dynamics the quantum propagator is usually approximated by means of the Herman-Kluk (HK) expression
[TABLE]
where and are the classical normal mode displacement and momentum vectors at time t, obtained from the classical propagation of the trajectory started at under the classical vibrational Hamiltonian. are coherent states of the form
[TABLE]
where is a diagonal matrix with diagonal elements equal to the harmonic frequencies ; is the classical action at time computed along the trajectory, and, finally, is the HK prefactor at time that accounts for second order quantum fluctuations around each classical path and which is defined as
[TABLE]
The multi-dimensional integral over the initial phase space conditions is usually performed by means of Monte Carlo techniques, and the method has been applied successfully in many instances, yielding accurate results.(Bonella, Montemayor, and Coker, 2005; Grossmann, 2006; Tao and Miller, 2011, 2012; Conte and Ceotto, pted) However, the number of different classical trajectories to run is often prohibitively high for an effective interface to ab initio on-the-fly evaluations of energies and gradients.
The computational cost required for this kind of simulations can be much decreased by employing Kaledin and Miller’s time average filter with separable approximation to the prefactor.(Kaledin and Miller, 2003a) This approximation consists in imposing that the amplitude of the HK prefactor is constant in time, i.e.
[TABLE]
a condition that is exactly fulfilled in the case of the harmonic oscillator. In this way, the TA SCIVR power spectrum is
[TABLE]
Calculation of the time averaged power spectrum still requires to perform a multidimensional integration but yields converged results orders of magnitude faster with a loss in accuracy in peak positions of just a few . Notwithstanding, the computational overhead of ab initio on-the-fly simulations demands for a further reduction of the number of trajectories to be run.
This goal has been reached by means of the MC-SCIVR approach in which rather than relying on a full Monte Carlo sampling of the phase space, the SC time propagator is built using only a handful of tailored classical trajectories. The trajectories are ideally selected according to the Einstein-Brillouin-Keller (EBK) quantization rules
[TABLE]
where are positive integers, while and are Maslov indexes. Indeed the EBK quantization condition is exact for the harmonic oscillator with Maslov indexes and . In this particular case
[TABLE]
so that the classical trajectories have total energies (and energy partition) corresponding to the harmonic oscillator spectral energies
[TABLE]
The EBK quantization conditions are still exact when the PES anharmonicity preserves the generalized periodicity of the motion (i.e. when each mode performs a periodic motion). In fact, Eq.(32) and Eq.(33) become
[TABLE]
where are the classical frequencies of the generalized periodic dynamics, which depend on the energy since the PES is not harmonic.
The trajectories employed in SC dynamics require a short time evolution (1 ps or less) without any preliminary equilibration. Therefore, the harmonic EBK quantization conditions of Eq.(32) can be easily fulfilled at the initial step by setting
[TABLE]
These conditions still realize a good approximation to the proper EBK quantization condition of Eq.(34) if the energy dependence of the anharmonic frequencies is moderate enough, i.e. if . The MC-SCIVR power spectrum is eventually computed as
[TABLE]
In calculations where the term is analytical.(Micciarelli et al., 2018) We have indicated with the -th Hamiltonian eigenvalue corresponding to the vector of integers via Eq.(35). The label has been added explicitly to the MC propagator to indicate that it gives a reliable approximation to the exact propagator only in the region of the energy spectrum close to , i.e.
[TABLE]
with
[TABLE]
and
[TABLE]
where the constants account for both the potential loss of amplitude due to the separable approximation and the fact that, having used a single trajectory, the amplitudes of the different states are not converged uniformly.
In practice, the initial EBK conditions are chosen according to the state to be investigated, and each different trajectory is used to build a different propagator specialized in the energy range around the eigenenergy of the target state. The MC-SCIVR approach has been numerically tested in several applications returning accurate eigenvalues and eigenvectors.(Ceotto et al., 2009a; Micciarelli et al., 2018) The typical strategy consists in obtaining a first estimate of the SC frequencies of the fundamental transitions by means of the ground state propagator. Calculations are then refined by employing a different and tailored MC-SCIVR propagator (i.e. a different trajectory) for each state. Using this approach, hence, the full SC power spectrum can be composed piece after piece as a collection of different single-trajectory propagators. In particular, for a given state , the MC-SCIVR power spectrum obtained after a run of classical molecular dynamics of length can be written as
[TABLE]
where, as already anticipated, the broadening functions have the shape of squared sync functions. The constants can be eventually derived enforcing the normalization of the eigenstates, i.e.
[TABLE]
In fact, by selecting in Eq.(40) , , and (see Appendix A for a justification for this choice)
[TABLE]
which means that the constant for the -th state can be calculated as the sum of the (non-negligible) intensities at energy of all power spectra obtained using the harmonic states of the basis set as reference states. For systems with sizable densities of states, many different states and transitions may contribute to power spectra and absorption bands. To avoid calculating all needed normalization constants, they can be considered to be the same for all vibrational states in the confidence energy range of each propagator. This is justified by some tests which show that only a very mild discrepancy () in the value of normalization constants comes from a change in the reference energy position within the same confidence energy window. This approximation is instead no longer valid when different energy ranges and/or different propagators are taken into consideration.
III RESULTS AND DISCUSSION
H2O molecule The first test application we propose concerns the non-rotating water molecule in vacuum. MC SCIVR was already applied to this system in our previous study(Micciarelli et al., 2018) and results for both eigenenergies and eigenstates were in excellent agreement with reference calculations performed using the Grid Time-Dependent Schrödinger Equation (GTDSE) computational package(Suarez et al., 2009). From that work we borrowed the same, pre-existing analytical H2O PES(Dressler and Thiel, 1997), and the same pre-existing dipole surface.(Lodi, Tennyson, and Polyansky, 2011)
The initial step of any SC approach consists in providing a harmonic estimate of vibrational frequencies. To this end, the Hessian matrix at the equilibrium geometry has been diagonalized to get the three harmonic frequencies of vibration, which are related to the symmetric stretch ( ), the bending (), and the asymmetric stretch () motions. Consistently with the MC-SCIVR methodology presented above, to investigate the 5 lowest-lying vibrational states we selected the appropriate harmonic EBK initial conditions and then generated five classical trajectories to build five MC-SCIVR propagators. The trajectories were associated to the following triplets of harmonic quantum numbers (in increasing order of energy): . Each trajectory was propagated for a total of 1.2 ps with Hessians calculated at each step along the dynamics to evaluate the time evolution of the Herman-Kluk prefactor (specifically its phase). We then applied Eq.(36) to get 5 distinct MC-SCIVR power spectra . The final, total power spectrum has been obtained as a direct sum of the 5 single power spectra.
In panel (a) of Fig. 1 we report the total MC-SCIVR power spectrum. As discussed above, the Hamiltonian eigenenergies correspond to the positions of the different peaks. In panel (b) of the same Figure we present the total power spectrum obtained from the 5 normalized power spectra, i.e. . The constants have been obtained from Eq.(42) by employing a truncated harmonic basis set made of all possible harmonic functions with quantum numbers not greater than 10, i.e. the total number of harmonic states in the basis set was . The different intensities of peaks between panel (a) and (b) in Fig. 1 point out the importance of the normalization factors for this new SC approach very clearly. It is also worth noting that the different peak intensities in panel (b) of Fig. 1 are due to anharmonicity effects, which are related to the squared projections . However, as observed in our previous work,(Micciarelli et al., 2018) the main contribution to a generic anharmonic state is given by its purely harmonic counterpart. Therefore all peak intensities are indeed close to 1, since most of the character of each anharmonic state is given by its harmonic associate. This is particularly true for the ground and first bunch of excited states, while anharmonicity increases in the excitation of bond stretches (corresponding to the two peaks at the highest energies in Figure 1). For the latter, in fact, the normalized peak intensities become smaller. The effect is larger for the symmetric stretch (blue curve) than for the asymmetric one (green line). The reason is that a Fermi resonance between the symmetric stretch and the bending overtone is present.
In panel (c) of Fig. 1 we show the fully anharmonic semiclassical IR spectrum of water under the effect of unpolarized light () obtained using the ground state as a reference state. This is, hence, the IR absorption spectrum at temperature K. The ground state eigenfunction was expanded in terms of the harmonic states already employed in our previous work,(Micciarelli et al., 2018) and the related coefficients employed in Eq.(25). We note that the intensity of the bending transition, located at , is correctly almost twice as intense as the two stretching ones at and respectively. Furthermore, the bending overtone transition, estimated at , is very weak but not exactly 0 because of the anharmonicity of the PES.
The exact anharmonic intensities of these absorption peaks have been derived in our previous work by means of a DVR approach.(Micciarelli et al., 2018) They are reported as vertical black lines in Fig. 2 for the bright vibrational fundamental transitions of water and compared to the peaks of the SC IR spectrum. The agreement is excellent and all three absorption intensities are perfectly reproduced within a negligible error due to the dipole linearization and/or the semiclassical approximation. Fig. 2 also points out the enhanced accuracy of fully anharmonic IR spectra with respect to the semi-anharmonic ones reported in dashed lines.
These results validate the proposed approach and show that it is equivalent to the direct state-to-state calculation of the oscillator strengths (i.e. the square moduli of transition dipoles). However, the decrease in computational overhead is evident already at this low dimensionality. In fact, the IR spectrum reported above asks only for the dipole derivative with respect to nuclear displacements at the equilibrium geometry in addition to what is needed to get a SC power spectrum. Any subsequent dipole evaluation is not required.
Glycine We move to the 10-atom glycine molecule in its neutral form in gas phase. Being the smallest among all aminoacids, this molecule has both a great biological relevance and a manageable size, so several theoretical methods have been applied to calculate its vibrational spectrum beyond the harmonic approximation.(Biczysko et al., 2012; Bludsky et al., 2000; Senent et al., 2005; Brauer, Chaban, and Gerber, 2004; Stepanian et al., 1998; Barone et al., 2013) In a recent work,(Gabas, Conte, and Ceotto, 2017) MC-SCIVR power spectra have been calculated for the four main conformers of glycine using on-the-fly ab initio molecular dynamics. Semiclassical energies are in very good agreement with other theoretical calculations as well as experimental data.(Stepanian et al., 1998) Here we extend the previous study by evaluating intensities and absorption bands for the high-energy fundamental transitions, i.e. the CH2 and NH2 stretches and the OH vibration, of the global minimum conformer (Conf I). This spectroscopic region is of great interest and the key target of investigation in bigger aggregates because it is influenced by the hydrogen bonding responsible for the structural stability of the complexes.(Gabas et al., 2018)
We performed ab initio on-the-fly molecular dynamics runs at DFT-B3LYP level of theory with aug-cc-pVDZ basis set using the NWChem(Valiev et al., 2010) suite of codes. The structure obtained for the global minimum conformer is reported in ball-and-stick representation in Fig. 3. The molecular dipole derivatives, which are necessary for calculating the harmonic transition dipoles, the set of normal mode coordinates and the harmonic spectrum have been computed at this molecular geometry with the same level of theory and basis set. Starting from the double harmonic approximation thus obtained, as anticipated, we focused on the anharmonic corrections to the highest energetic fundamentals in the energy range between and , for which harmonic estimates are known to be inaccurate.
In Fig. 4 we report the five unpolarized light semi-anharmonic IR spectra obtained using five different EBK trajectories. For each trajectory, the initial conditions were determined by means of the harmonic EBK quantization rule with vectors ** **obtained giving one quantum of excitation to modes 20-24 as indicated in the legend of the different figure panels. All trajectories have been evolved for 5000 time steps giving a total evolution time of . It is worth mentioning that, according to Eq.(24), for glycine the total number of power spectra to be computed in order to get the semi-anharmonic IR spectrum would add up to for each trajectory (i.e. for each SC propagator). However, for many of the 24 single-excited harmonic reference states the power spectra appearing in Eq.(24) give no contribution in the energy range of interest. Furthermore, in these cases the terms vanish for all , thus decreasing substantially the total number of power spectra to be evaluated. In practice, the sole contributors to the high energy bands investigated are the six modes from to , decreasing the total number of power spectra calculated to just 21.
Interestingly, energy shifts of the order of and variations in band shapes are observed among different spectra, but, consistently with the MC-SCIVR recipe, we consider each IR spectrum reliable only within a given confidence energy range. These ranges are selected in a way that they contain the absorption band located where vibrational states have a significant component on the harmonic state corresponding to the EBK trajectory adopted. The energy windows are revealed by considering the (principal) band of the survival probability power spectrum , with (reported with black dashed lines in each panel) and have been highlighted in Fig. 4. As it can be seen from panel (a) and (b) of Fig. 4, the confidence regions relative to modes 20 and 21 (corresponding to the symmetric and asymmetric CH2 stretches) coincide. Furthermore, the two IR spectra obtained are equivalent within method accuracy, and hence any of the two is representative of the IR spectrum in that specific energy region, i.e. it is the result of the sum of contributions from both CH2 absorption bands. A different situation applies in the case of the two stretches, whose confidence regions and absorption bands are not equal. Specifically, data shown in panel (c) and (d) are obtained from the EBK trajectories for the symmetric and asymmetric stretch, respectively. From the survival probability power spectra, two non-overlapping confidence windows can be determined. In panel (c) a double peak structure is present and we assign the symmetric stretch to the peak at lower energy. In panel (d) a single band conceals both states and its peak is taken as the reference for the absorption of the asymmetric stretch fundamental, in agreement with the underlying EBK trajectory. In this way, though, the intensity of this band is expected to be overestimated because contributions from the symmetric stretch are also included. However, it turns out that in this specific case they are small. Finally, a well defined single band characterizes the OH stretch fundamental in panel (e).
As discussed in the theory Section and already pointed out for water, the relative intensities of the different bands in Fig. 4 are not directly comparable to each other in absence of a preliminary normalization. Each IR spectrum in Fig. 4 has been globally normalized by applying Eq.(42) at the energy corresponding to the maximum of the absorption band in the confidence region (i.e. in correspondence of the vertical dashed lines reported in Fig. 4). The relative intensities of absorption bands in confidence regions obtained with different propagators are hence meaningful. In order to determine the normalization constants via Eq.(42), the sum over has been performed over a truncated set of harmonic basis set elements. The truncation strategy adopted consisted in considering all possible 24-dimensional direct products of 1-dimensional harmonic eigenstates up to the total quantum number with a maximum of 2 modes simultaneously excited. The truncated basis set obtained in this way contains harmonic states. Not surprisingly, looking at the amplitude of the expansion coefficients associated to each peak, in all cases the largest coefficient belongs to the harmonic excited state corresponding to the absorption band. However, dozens of other relevant contributions are also present and many of them are due to (dark) harmonic states in resonance with the principal one. So, while within the harmonic approximation at T=0 K only fundamental transitions give non-zero contributions to the IR spectrum, multiple Fermi resonances mixing the bright harmonic states with many others imply that the number of non-dark states becomes much larger in the real anharmonic case. The absorption bands obtained in Fig. 4, hence, are made of multiple energetically close vibrational transitions. This is different from the simpler picture of absorption bands as made of a single broadening function around a central bright transition. Any state-by-state approach would fail to describe this phenomenology, unless all oscillator strengths relative to transitions from a given reference state to all states under the absorption band are taken into account. Apart from the computational overhead required, this procedure would be numerically unfeasible.
In Fig. 5 we report our estimate for the zero temperature fully anharmonic IR spectrum . In the same figure, the semi-anharmonic spectrum is also presented in dashed lines. The different colors (the same adopted in Fig. 4) identify the single trajectory propagator used in each confidence energy range and, for all bands reported, the relative intensities are meaningful. The spectrum has been obtained by sorting the elements of the harmonic basis set in order of relevance (i.e. absolute value) of the corresponding ground state expansion coefficients and then applying Eq.(25) with the sum over harmonic states performed over the first basis set elements. With this cutoff, all coefficients with absolute value bigger than in the ground state expansion (see Fig. S1 in Supporting Information) are considered. However, in order to keep under control the number of power spectra to evaluate, we have limited the sum over normal mode contributions to the same set of coordinates used for the calculation of . The total number of power spectra taken into account in this way, in fact, already adds up to . As shown in Fig. S2 of the Supporting Information, inclusion of more and more harmonic contributions does have an observable effect on the intensity of all bands with convergence obtained only after the inclusion of the basis set element. The observed increment in absorption intensities, however, is proportionally almost equivalent for all bands. Hence, after a global re-normalization, the overall effects of taking into account the anharmonicity of the vibrational ground state (in terms of change in relative band intensities) become minor.
It is worth noting that for absorption bands composed of more than one transition line, the maximum may not formally coincide with the maximum of a given survival amplitude power spectrum. A not negligible change in the estimate of the position of the maximum of absorption bands is indeed observed for the semi-anharmonic spectra of glycine in panels (a)-(d) of Fig. 4. Furthermore, an additional even if less significant shift of most band maxima is observed when ground state anharmonicity is also taken into account (see Fig. S2 in Supporting Information). In Fig. 5 we report also the experimental spectrum recorded in Argon matrix at low temperature.(Stepanian et al., 1998) A satisfactory overall agreement between our theoretical prediction and the experimental spectrum is observed. The key difference is in the region between and , where the experimental signature of another conformer, not included in our theoretical investigation, stands out. The most intense absorption band is centered at and associated to the OH stretch. The second most intense experimental band is located in the energy range between and , with an overall absorption intensity times smaller than the OH one. This band features a barely distinguishable bimodal shape and is associated to the two (symmetric and asymmetric) stretches. The bimodality of this band is not resolved in our semiclassical spectrum in which the broadening functions resulting from the dynamics are indeed too large to recover this effect. Notably, however, a secondary much less intense band located between and appears in the computed spectrum. In fact, as revealed by the power spectra reported in Fig. 4 (black dashed curves), in this spectral energy range vibrational states with relevant components on the harmonic excited states of the two stretches are present, most probably originated by the presence of Fermi resonances coupling them with (dark) harmonic excited states. The intensity of this secondary band, as expected, is much reduced compared to the principal one in the semi-anharmonic spectrum, but its oscillator strength increases upon inclusion of ground state anharmonicities making it non negligible. However, the signal is not enough intense to be assigned in the experimental spectrum and to be discernible from noise or signals coming from other conformers. Finally, another absorption band (assigned to the stretches) in the experimental spectrum spans the energy range between and Its intensity, even if an order of magnitude smaller than that of the OH stretch, makes it clearly distinguishable from the experimental baseline and well matched in position and intensity by the semiclassical prediction.
Energies and intensities obtained from the semiclassical IR spectrum are reported in Table 1 and compared to both experimental values and theoretical estimates provided by the double harmonic approximation and by perturbative methods at a similar level of electronic structure theory.(Biczysko et al., 2012) In order to facilitate the comparison, all intensities have been globally re-normalized by leveling off the intensities assigned by the different approaches to the intense OH stretch band. This reference value is set equal to the experimental value of 0.25. From Table 1 it is clear that a double harmonic approximation is not efficient especially in estimating the frequencies of vibration, while a better prediction is obtained for intensities. Results are neatly improved moving to the SC and GVPT2 calculations. Both methods are in excellent agreement with the experiment for all modes, taking alternatively the lead as the most accurate approach. This demonstrates that the SC approach works appropriately and accurately if compared to benchmark calculations in both low (water) and high (glycine) dimensionality, opening the way to the quantum simulation of IR spectra of systems currently not achievable.
IV Summary and Conclusions
We have presented a new semiclassical approach to simulate anharmonic IR spectra. The method is able to deal with medium-large molecular systems with sizable densities of vibrational states. At the heart of the strategy are MC-SCIVR power spectra, which are combined linearly to give, in addition to frequencies of vibration, IR intensities and band shapes.
Meaningful IR intensities are indeed obtained exploiting a proper decomposition of the absorption spectrum in terms of survival amplitude power spectra. As for band shapes the method relies on the fact that, as the number of absorption lines under a given band becomes large and in the limit in which the width of the band is much larger than the width of the single lines, the shape of the band is independent of the broadening function adopted. This allows to employ the convolution function associated to the finite-time survival amplitude Fourier transform as a broadening function in lieu of the usual Gaussian or Lorentzian envelopes. Furthermore, this feature permits to avoid undesired state-to-state oscillator strength calculations, whose number becomes huge for large systems making their computation hardly feasible. In fact, even though MC-SCIVR power spectra need a proper normalization to allow comparisons between different energy regions, normalization constants refer to the central peak of absorption bands and barely vary within it. Thus, only one constant per absorption band has to be computed, a figure that in large systems is much smaller than the actual number of lines composing each band.
The approach is also based on the linearization of the molecular dipole, but intensities of absorption spectra can still be calculated at the double harmonic, semi-anharmonic, or fully anharmonic level. The difference depends on the way the states contributing to the linearized transition dipoles are treated. The accuracy of the method has been tested against exact results for the water molecule with more than satisfactory outcome. Furthermore, the study of the IR spectrum of glycine has provided results in agreement with both experiments and previous VPT2 calculations and demonstrated the effectiveness of the method in dealing with a 24-dimensional system. Investigation of glycine focused on the absorption bands of high energy fundamentals, an energy region where anharmonicities are relevant. The importance of anharmonicities at both electrical and mechanical level is evident after a comparison to the widely employed double harmonic approximation. In both cases explored, the double harmonic approximation is off the mark, which raises serious questions about the legitimacy of employing such a rough guess in a black box fashion.
A still open issue is that, due to the short duration of the semiclassical propagation, the SC absorption bands obtained for glycine are wider than the low-temperature experimental ones. This effect could be less relevant for spectra at higher temperature, where experimental bands are expected to extend over a larger interval of energies. Furthermore, the quality of the SC calculation could be improved by reducing the impact of spurious rotations, which may contribute to the enlargement of peaks and are due to the adoption of a normal mode reference frame. Advances on this aspect are currently being undertaken.
We conclude by remarking that SC spectroscopy, through power spectra calculations, had already well established two of its hallmark features. They are the possibility of application to large dimensional molecular systems, which is often precluded to other quantum approaches, and the capability to reproduce and explain experimental findings where other theoretical approaches (like scaled harmonic or classical ones) fail. Now we have increased the appeal of semiclassical spectroscopy by demonstrating that semiclassical IR spectra are also achievable without any restrictions due to the density of states. This gives SC approaches the potential to be reference methods for IR spectroscopy of medium-large systems.
SUPPLEMENTARY MATERIAL
See supplementary material for additional data about the expansion coefficients of the ground state vibrational eigenfunction of glycine and an additional plot about convergence of the full-anharmonic IR spectrum of glycine as a function of the number of expansion coefficients taken into account.
Acknowledgements.
Authors acknowledge financial support from the European Research Council (Grant Agreement No. (647107)—SEMICOMPLEX—ERC- 2014-CoG) under the European Union’s Horizon 2020 research and innovation programme. Additional cpu time was provided by CINECA (Italian Supercomputing Center) under ISCRAB project “QUASP”.
Appendix A
From quantum linear response theory in its sum-over-state version, the functional form of the IR spectrum of isotropic and homogeneous molecular systems is
[TABLE]
where is the difference between the vibrational energies of a given transition, is the corresponding transition dipole, and is the vibrational state population at a given temperature T (with being the partition function). In this work we are interested in the modeling of the IR spectrum in the region of the high energy fundamentals of a system at a given (reasonable) temperature . Hence, and it can be assumed that all the arrival state populations are zero. Eq.(A.1) simplifies to
[TABLE]
where
[TABLE]
In experimental IR spectra each spectral line is broadened over a finite range of energies. This is due to several known effects. For instance thermal Doppler, collisional, and Stark effect broadening all play an important role in a gas phase environment. These effects can be accounted for phenomenologically by assuming that the transition probability distributions of the system are broadened, so that in Eq.(A.3) the Dirac delta function can be substituted by some bell shaped function of finite amplitude . Eq. (A.3) in this case becomes
[TABLE]
It is straightforward to notice from a comparison between Eq. (A.3) and Eq. (A.4) that the term , characteristic of a transition between two single and well defined states, has been substituted by in the case of an absorption band. This is necessary to account for the gain of a quantum of energy by the system (and, correspondingly, for the loss of an equal amount of energy by the electromagnetic field) in the neighborhood of with probability density given by . Depending on the most relevant phenomenological effect to take into account, is generally described by either a Gaussian or a Lorentzian function. In this work is substituted by the dynamical convolution function , a legitimate procedure as explained in the Summary and Conclusions Section of the paper. Therefore the calculated spectrum in presence of a radiation polarized along the direction , , descends from Eq.(19).
It is common practice to use normalized broadening functions that integrate to unity over the energy axis. This choice, in fact, has the advantage to preserve the oscillator strength summation rules. The most convenient choice for our purposes, instead, is to normalize them by setting 1. This choice has the advantage to allow a straightforward calculation of the normalization constants of the eigenstates expanded on the harmonic basis via Eq.(42). These two normalization choices are in any case equivalent because the resulting absorption spectra just differ in a multiplicative constant.
Appendix B
We derive the decomposition of the fully anharmonic IR spectrum of Eq.(19) in terms of power spectra, i.e. the result reported in Eq.(25). First, Eq.(17) for transition dipoles has to be inserted into Eq.(19), leading to
[TABLE]
At this point the square modulus is expanded to allow inversion of the order of the sums over and over . From an algebraic point of view this procedure is not straightforward because of the presence of multiple sums, so we perform it starting from the following general expansion
[TABLE]
If
[TABLE]
then
[TABLE]
and upon substitution into Eq.(B.1)
[TABLE]
The final Eq.(25) is obtained starting from Eq.(B.5) by noting that: i) the terms in brackets are the semi-anharmonic spectra ; ii) in the last line, the terms in parentheses are also easily related to survival amplitudes of the kind of Eq.(23).
The reference list from the paper itself. Each links out to its DOI / PubMed record.
- 1Mathias et al. (2011) G. Mathias, S. D. Ivanov, A. Witt, M. D. Baer, and D. Marx, J. Chem. Theory Comput. 8 , 224 (2011).
- 2Gaigeot (2010) M.-P. Gaigeot, Phys. Chem. Chem. Phys. 12 , 3336 (2010).
- 3Heller (1981 a) E. J. Heller, Acc. Chem. Res. 14 , 368 (1981 a).
- 4Kaledin and Miller (2003 a) A. L. Kaledin and W. H. Miller, J. Chem. Phys. 118 , 7174 (2003 a) . · doi ↗
- 5Kaledin and Miller (2003 b) A. L. Kaledin and W. H. Miller, J. Chem. Phys. 119 , 3078 (2003 b) . · doi ↗
- 6Heller (1981 b) E. J. Heller, J. Chem. Phys. 75 , 2923 (1981 b) . · doi ↗
- 7Herman and Kluk (1984) M. F. Herman and E. Kluk, Chem. Phys. 91 , 27 (1984) . · doi ↗
- 8Miller (2001) W. H. Miller, J. Phys. Chem. A 105 , 2942 (2001).