Thermal Components in Gamma-ray Bursts. I. How Do They Affect Non-Thermal Spectral Parameters?
Liang Li

TL;DR
This study examines how thermal components influence the spectral parameters of gamma-ray bursts, revealing significant effects on spectral shape and physical interpretation, especially when thermal emission is prominent.
Contribution
It provides a detailed analysis of thermal effects on nonthermal spectral parameters in GRBs, highlighting their importance in spectral modeling and physical understanding.
Findings
Thermal components make the low-energy photon index harder.
Peak energy is smaller and between blackbody temperature and cutoff energy.
Spectral parameter relations are significantly altered by thermal flux.
Abstract
The spectral components of the prompt emission of gamma-ray bursts (GRBs) mainly consist of two possible origins: synchrotron (nonthermal) and photosphere (thermal). The typical spectral properties of GRBs can be modeled by a dominant nonthermal component (a Band-like function or cutoff power law), while some of them have an additional thermal component (a Planck-like function). In this paper, we investigate the effects of thermal components on the nonthermal spectral parameters. We focus on eight {\it Fermi} Gamma-ray Burst Monitor bursts of which the spectra deviate from a Band-only function, and the thermal components are significant. We sort them into thermal-subdominant Group I (e.g. GRB 110721A) and thermal-dominant Group II (e.g., GRB 090902B). Several interesting results are found assuming the spectral component is totally attributed to the nonthermal component: (i) the…
Click any figure to enlarge with its caption.
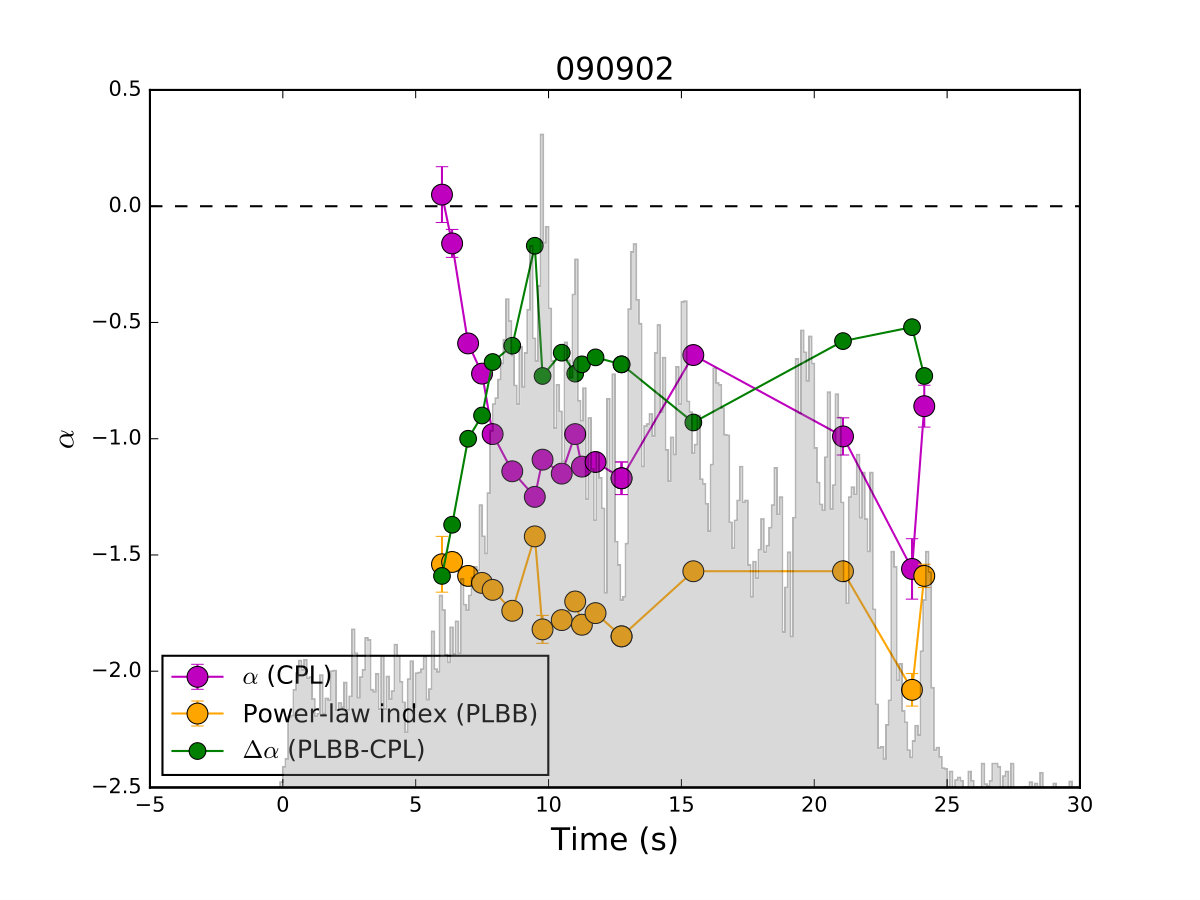 Figure 1
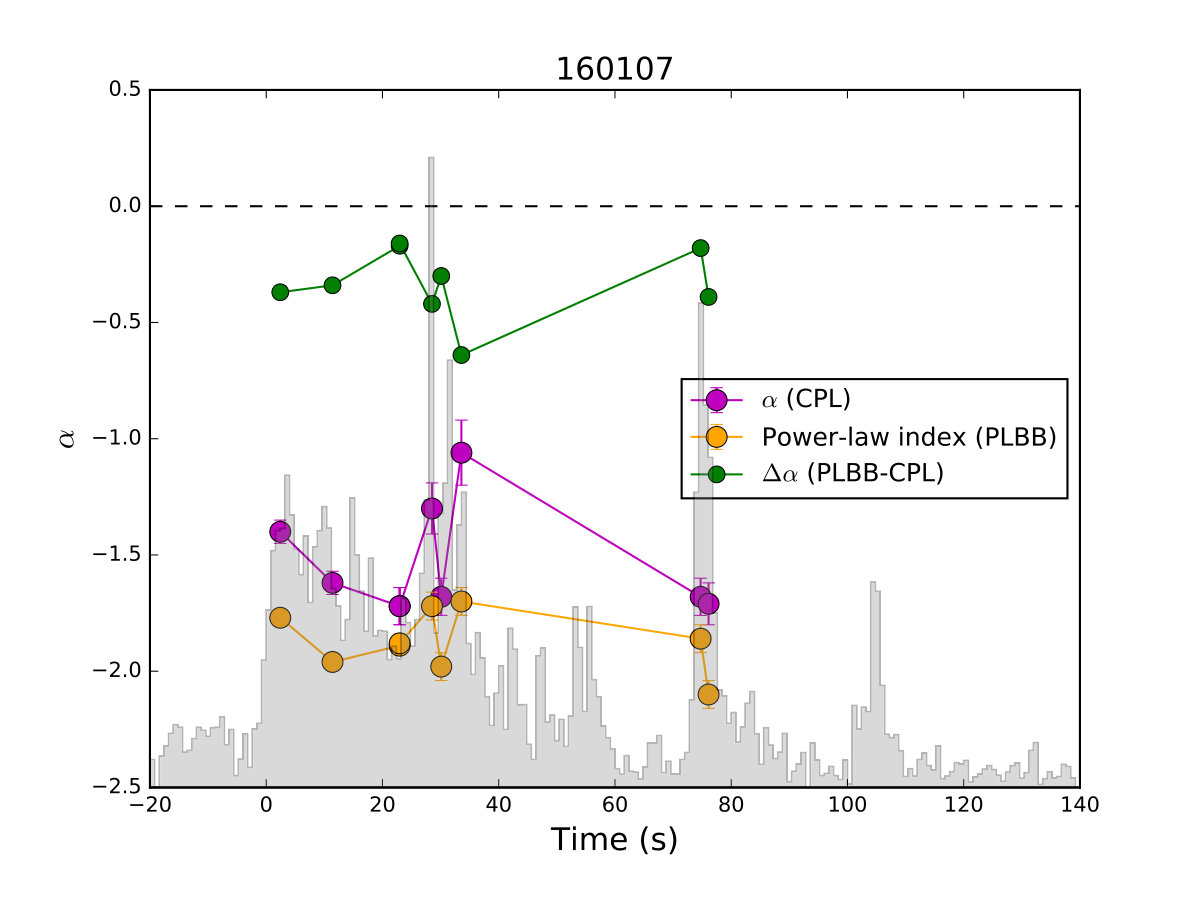 Figure 2
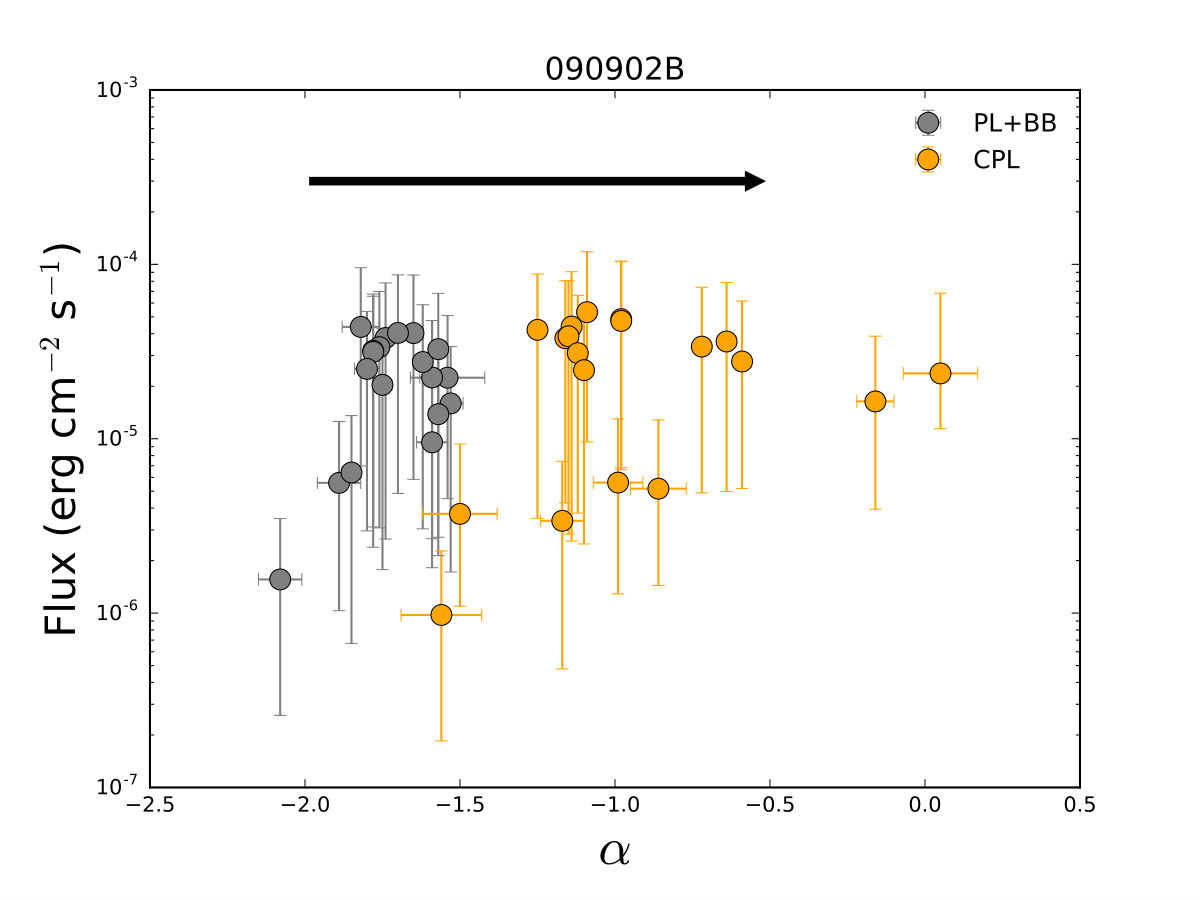 Figure 3
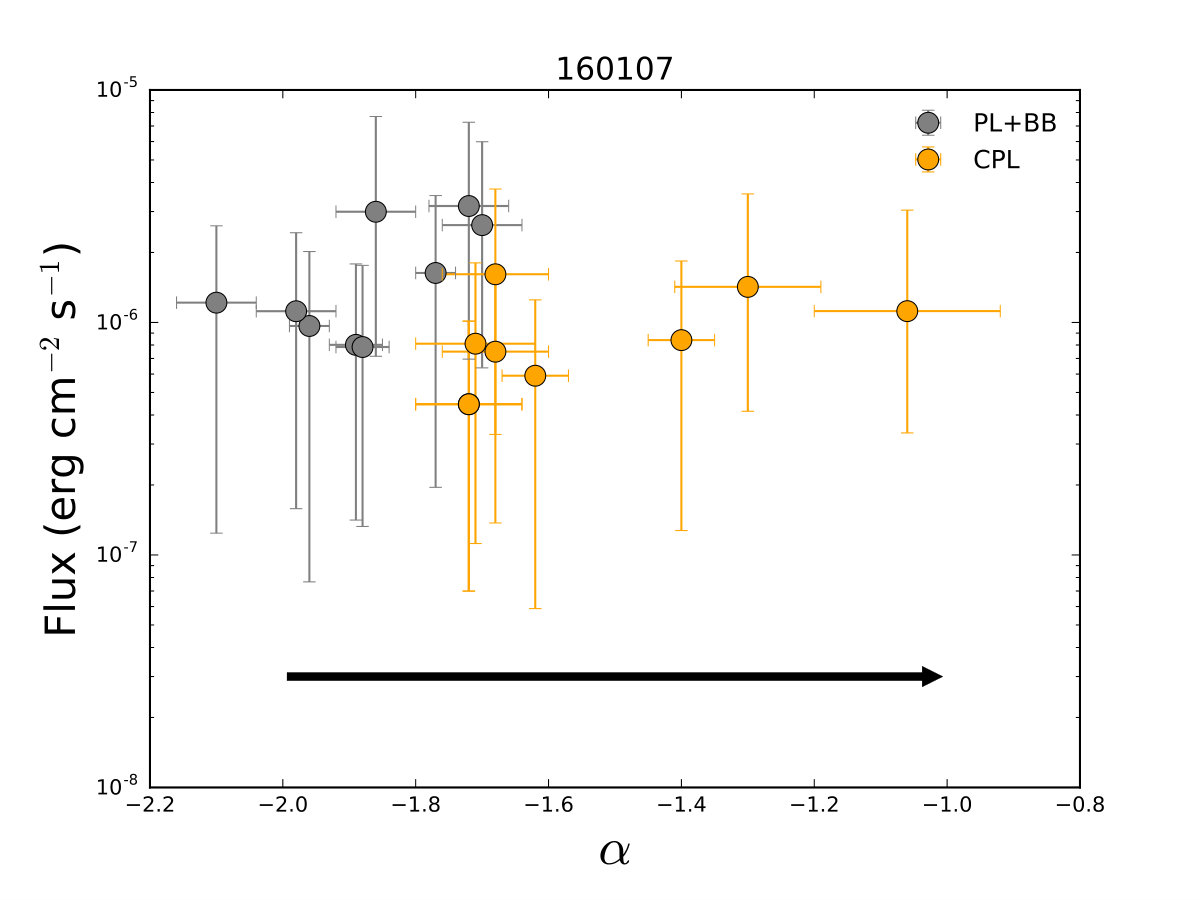 Figure 4
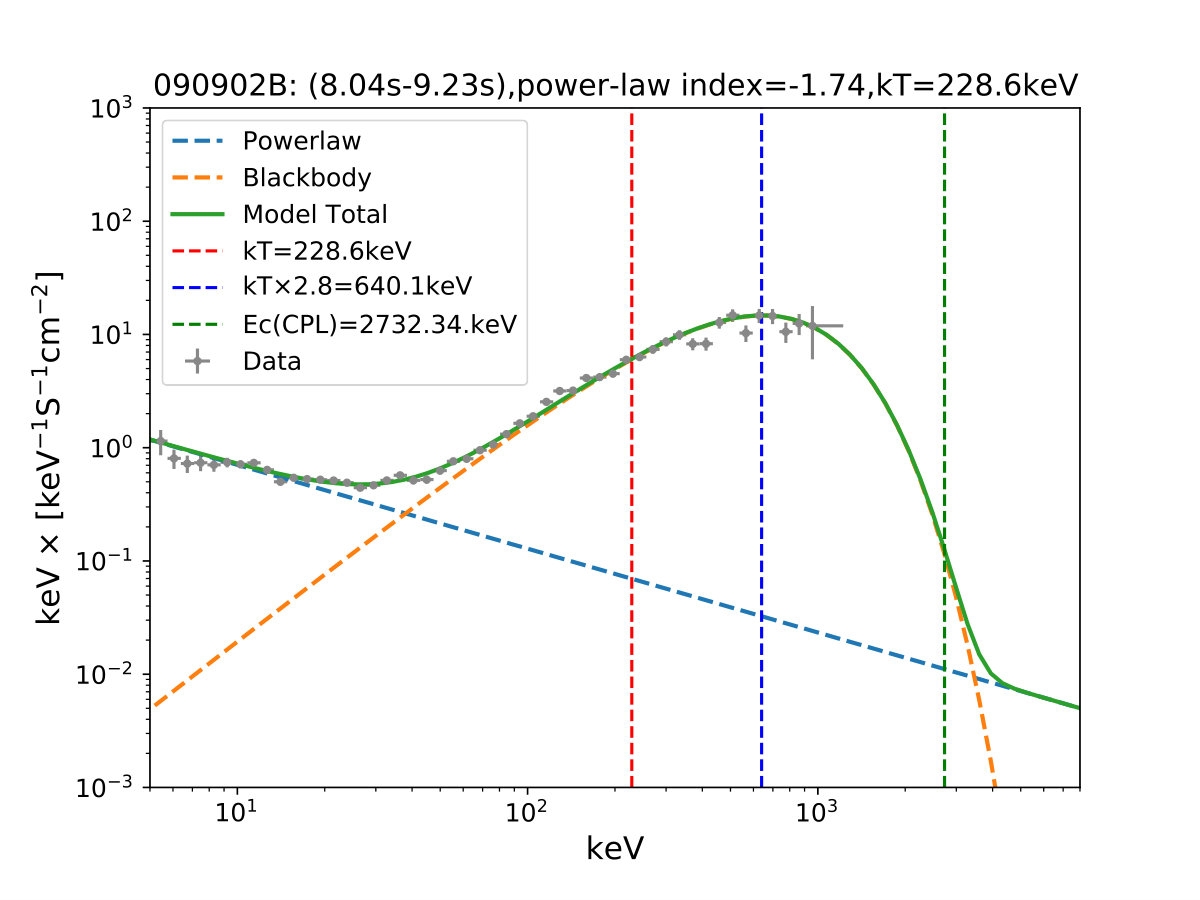 Figure 5
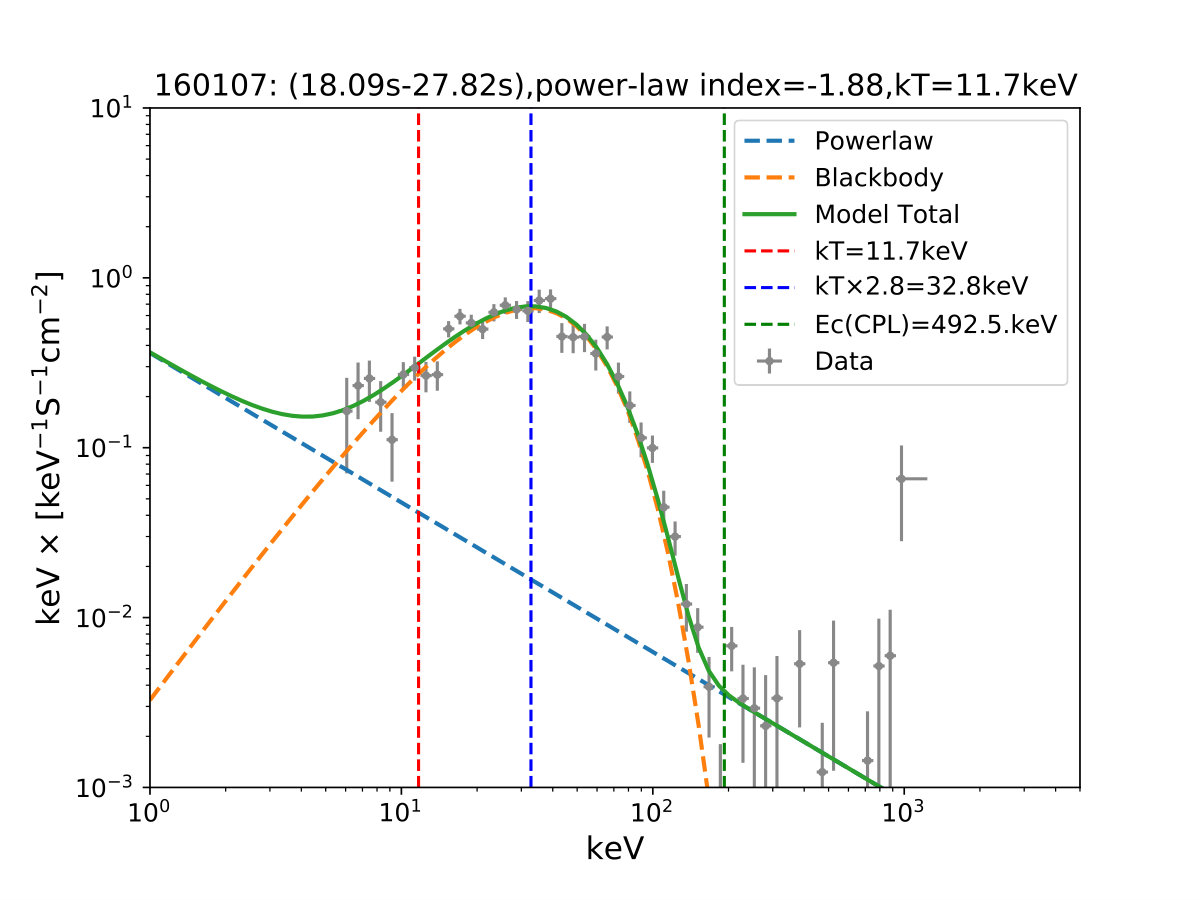 Figure 6
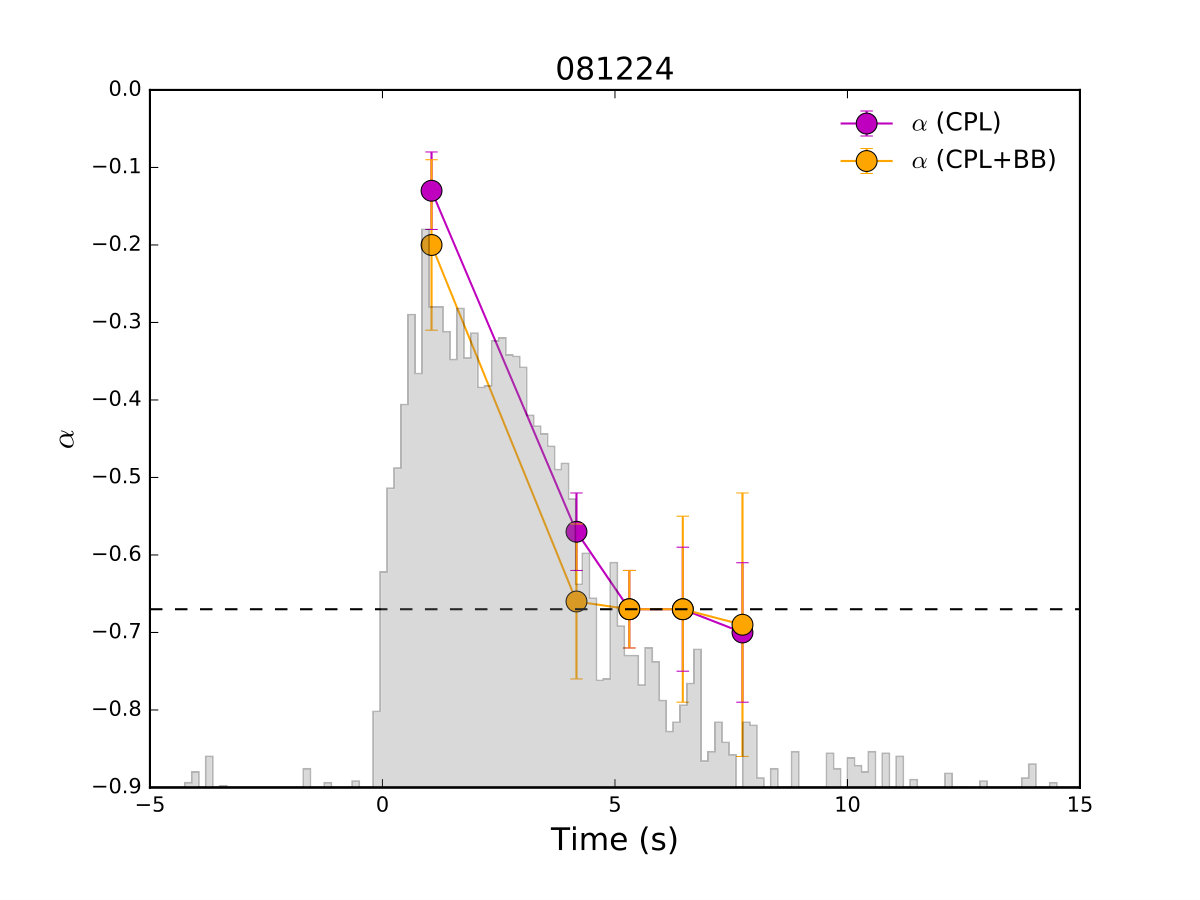 Figure 7
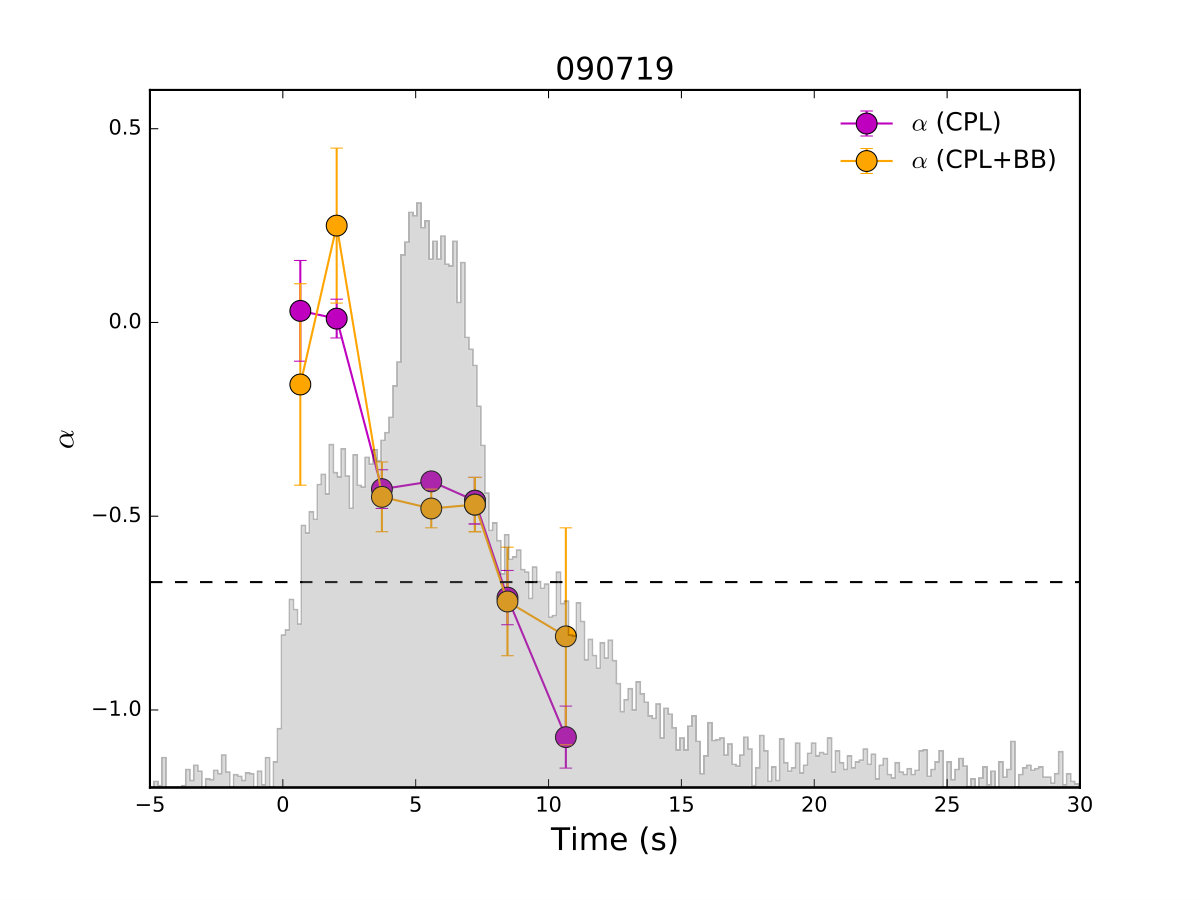 Figure 8
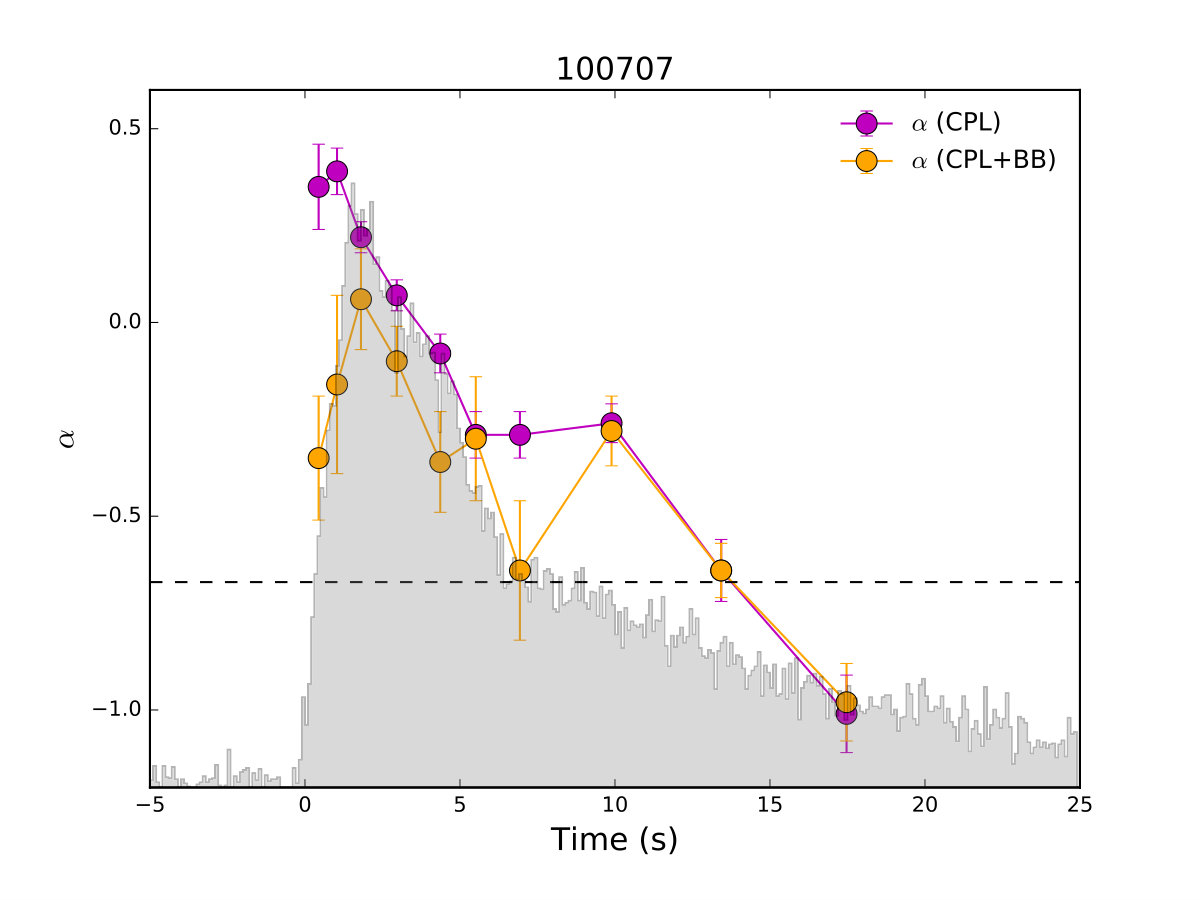 Figure 9
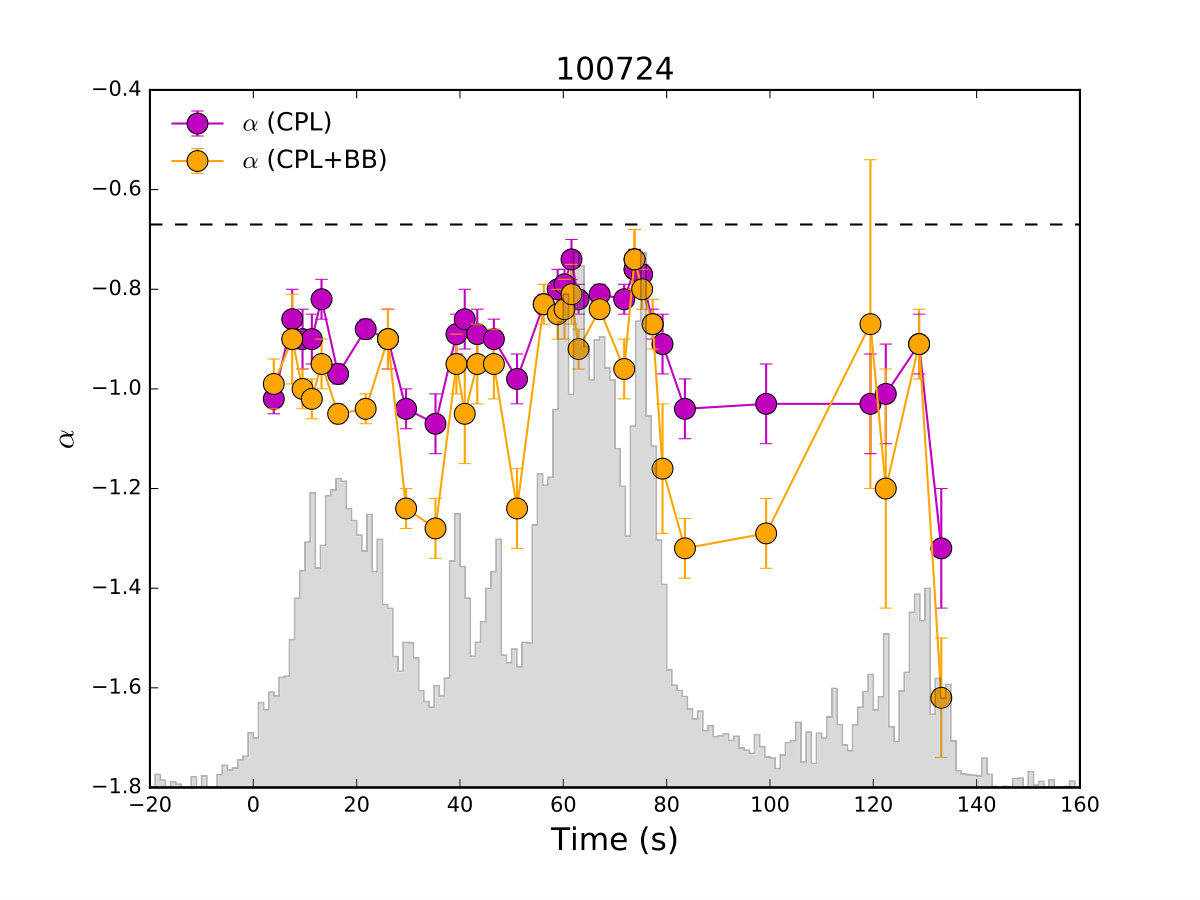 Figure 10
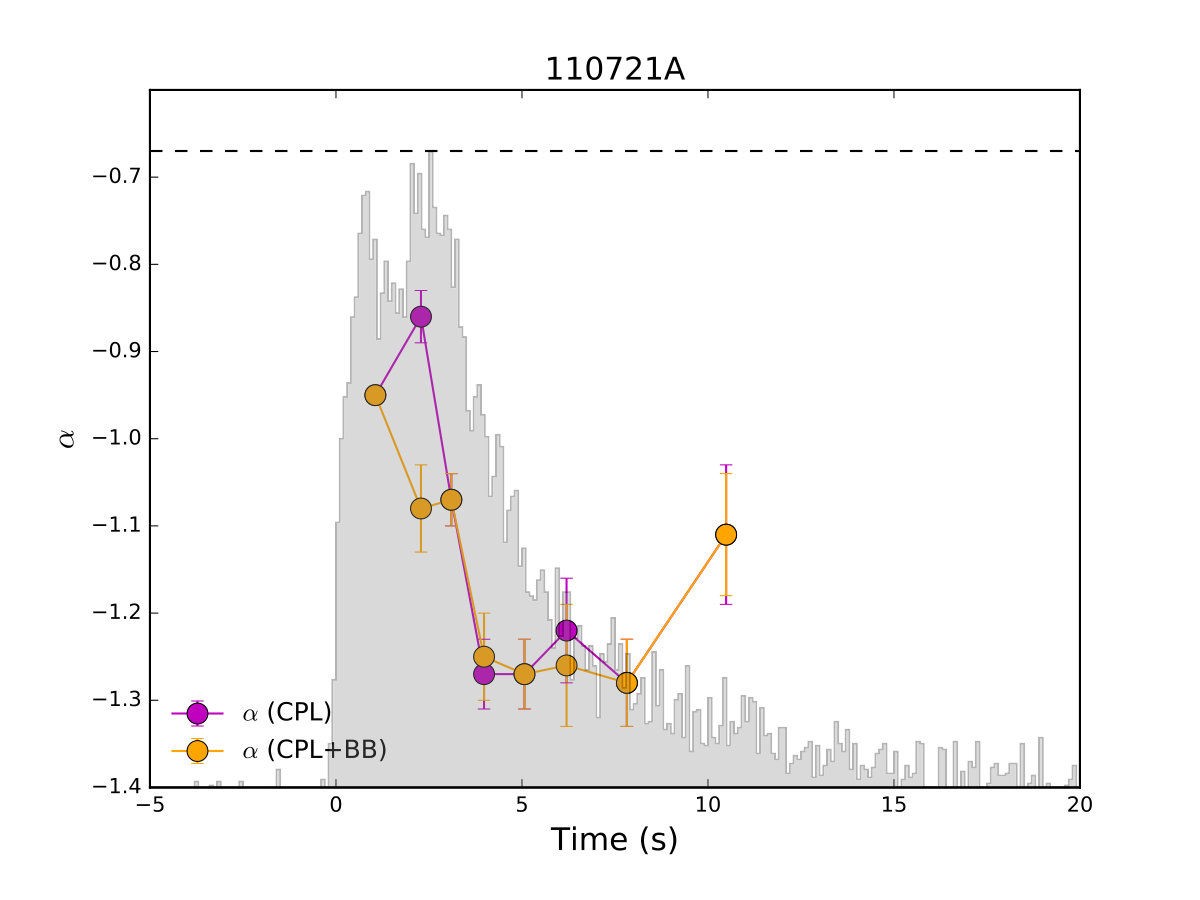 Figure 11
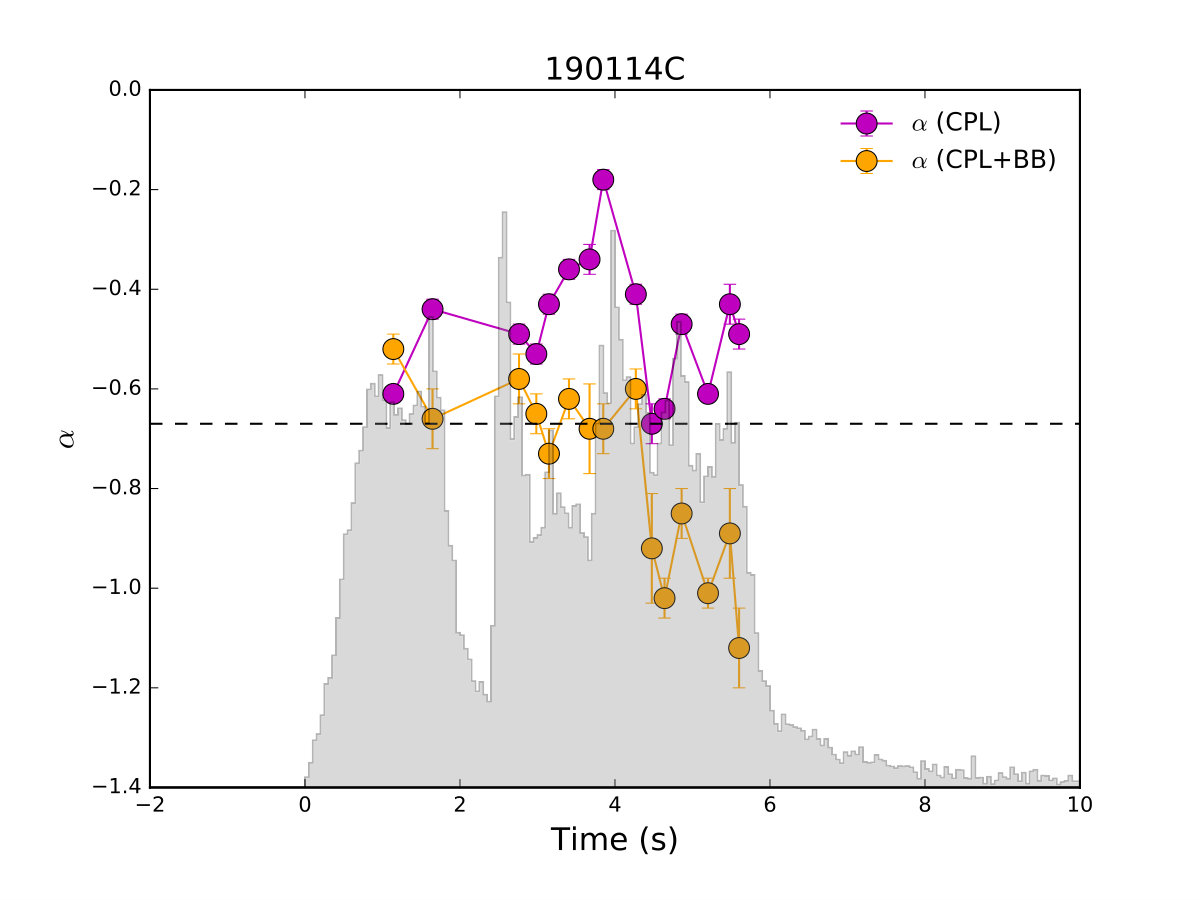 Figure 12
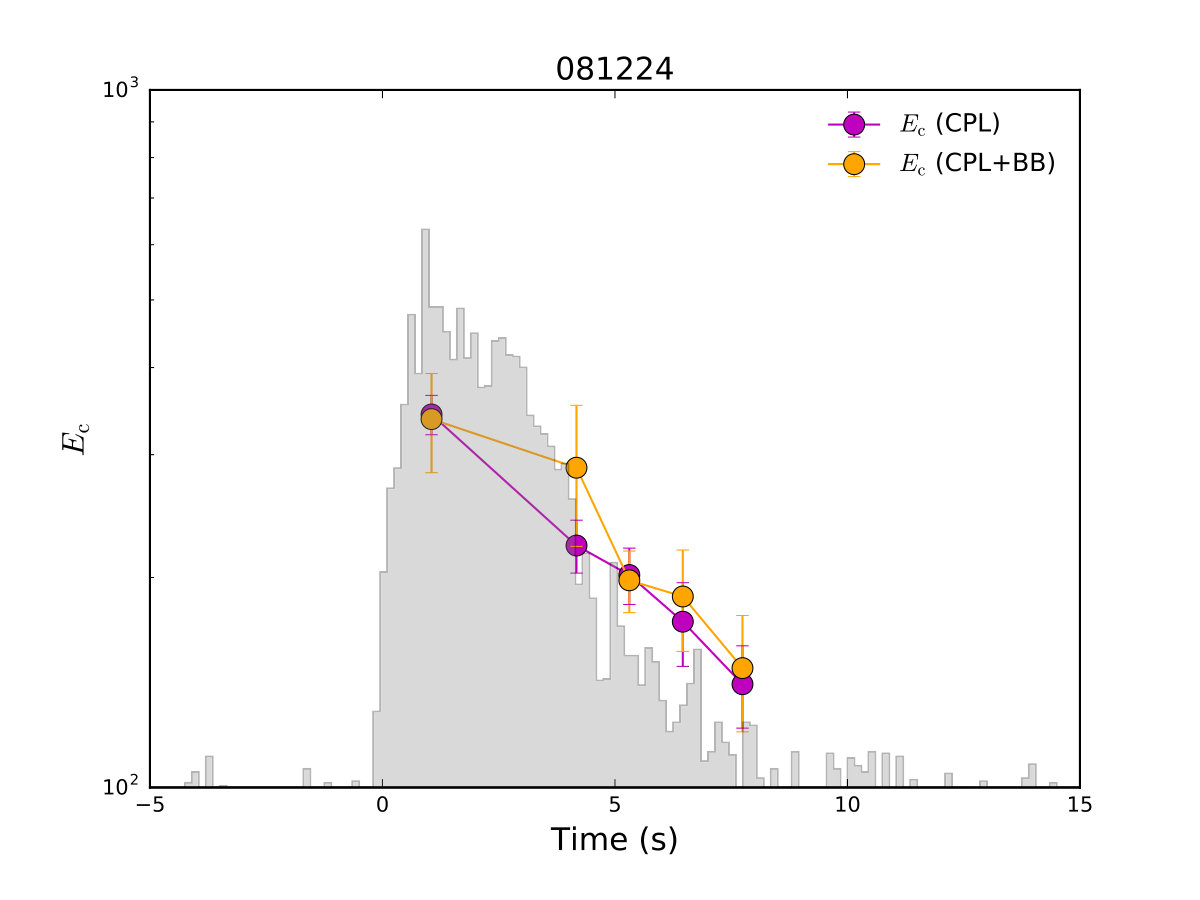 Figure 13
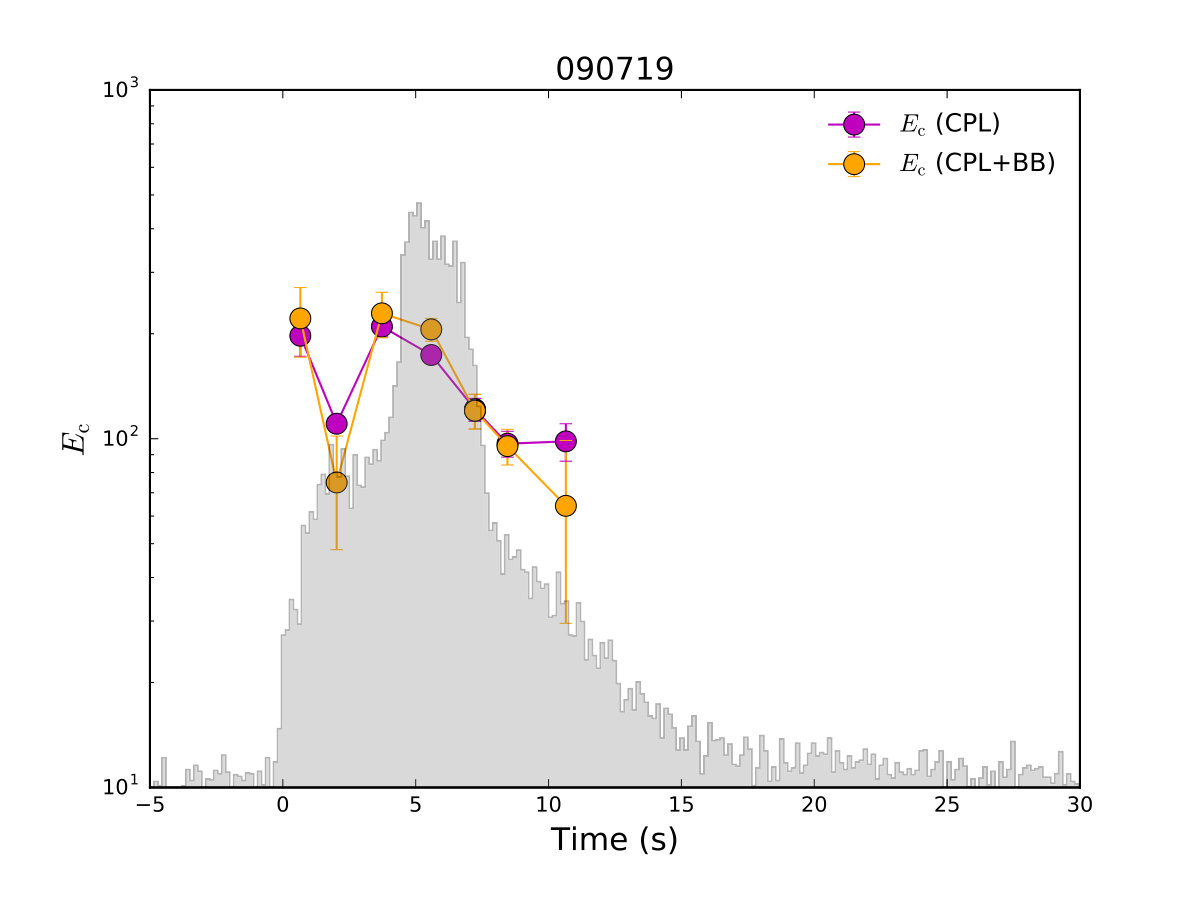 Figure 14
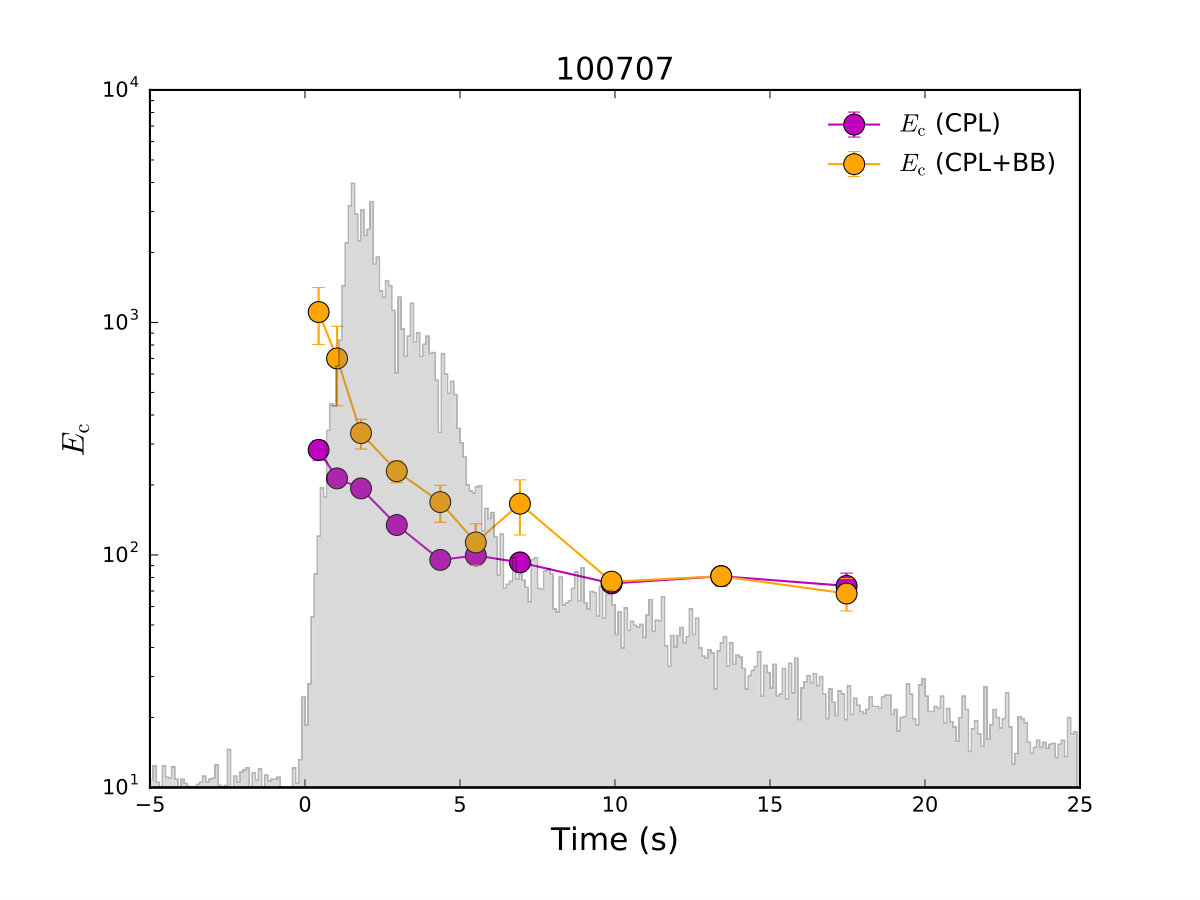 Figure 15
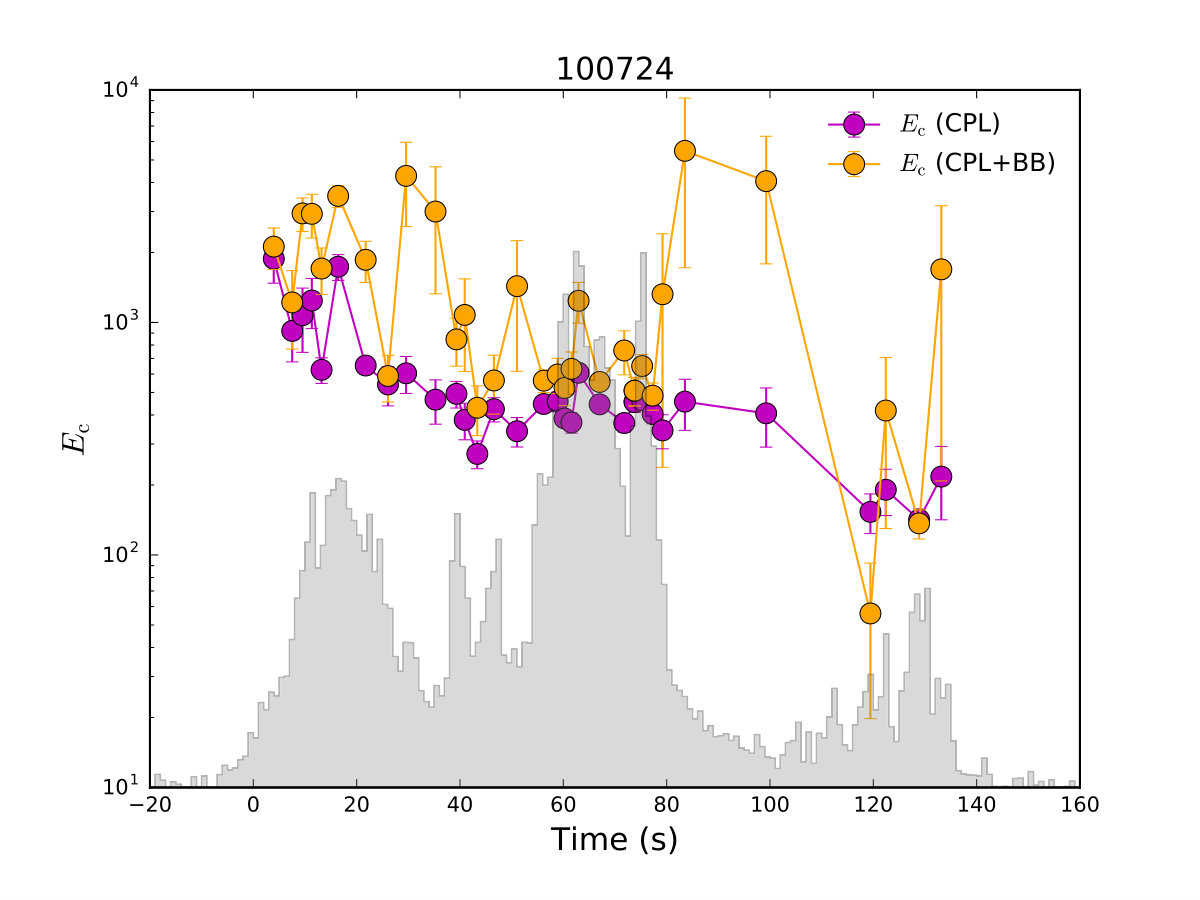 Figure 16
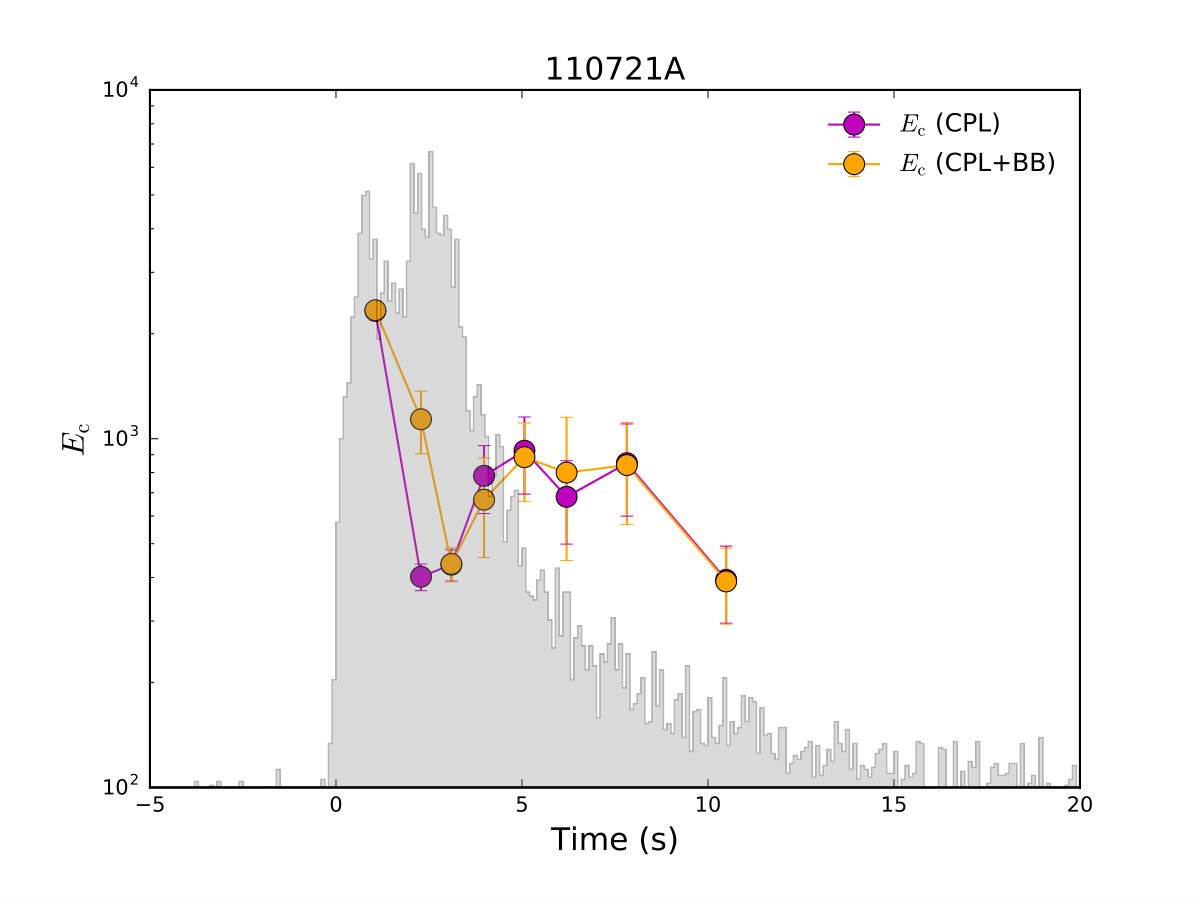 Figure 17
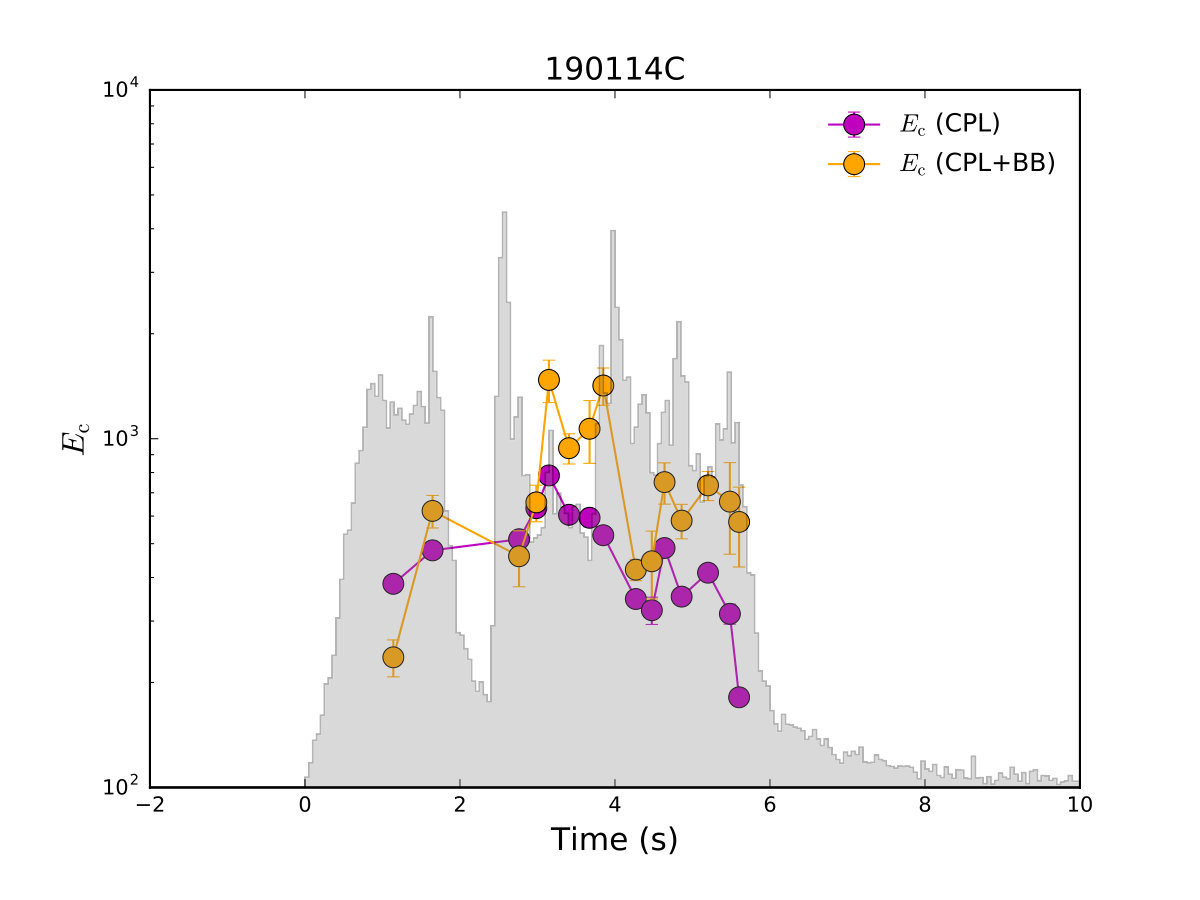 Figure 18
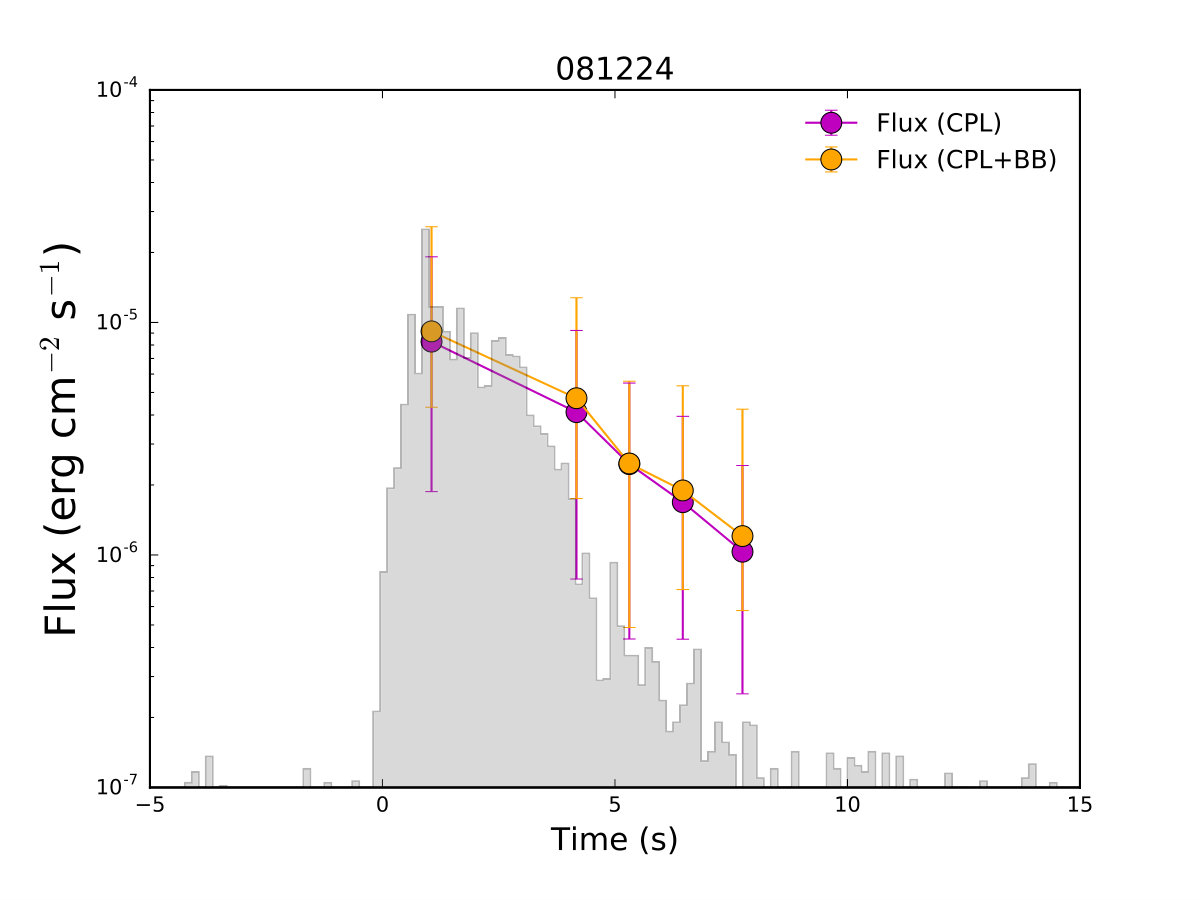 Figure 19
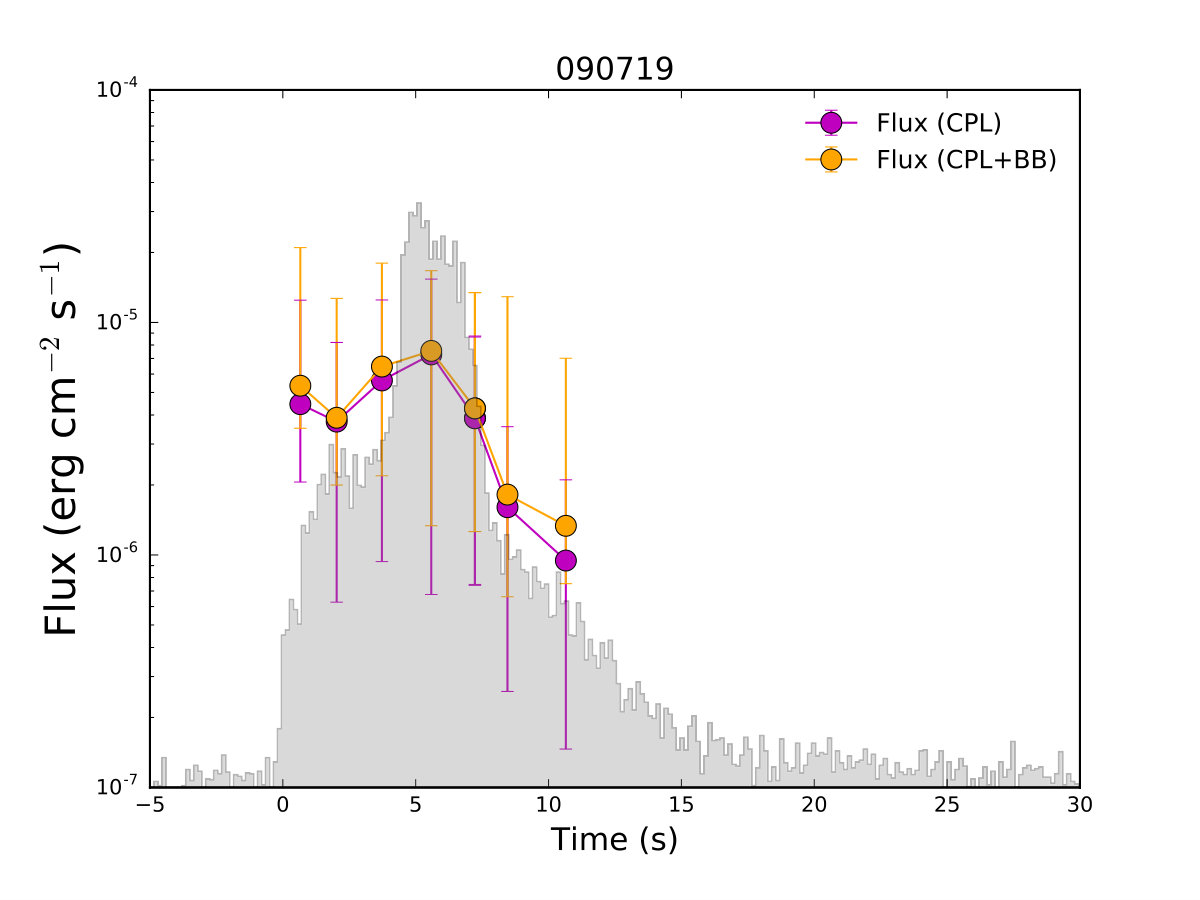 Figure 20
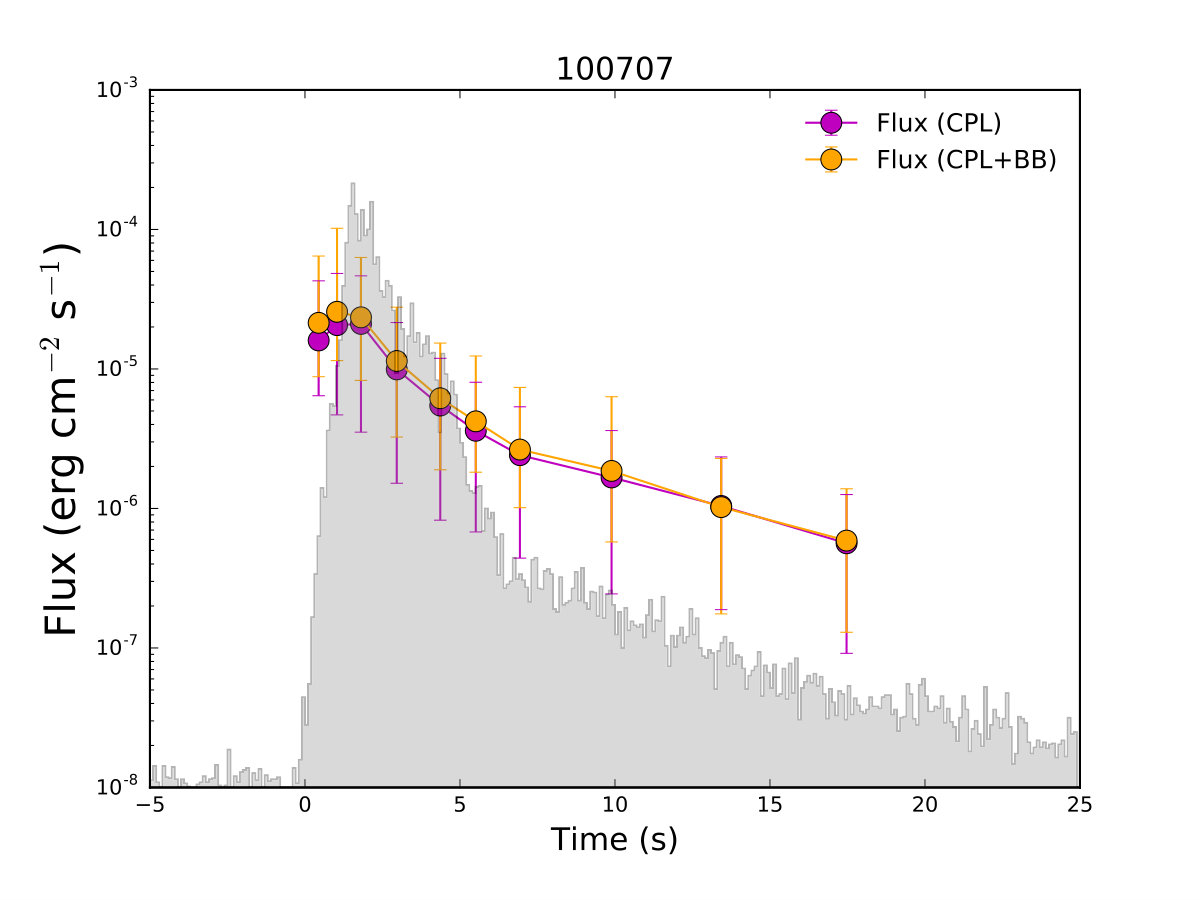 Figure 21
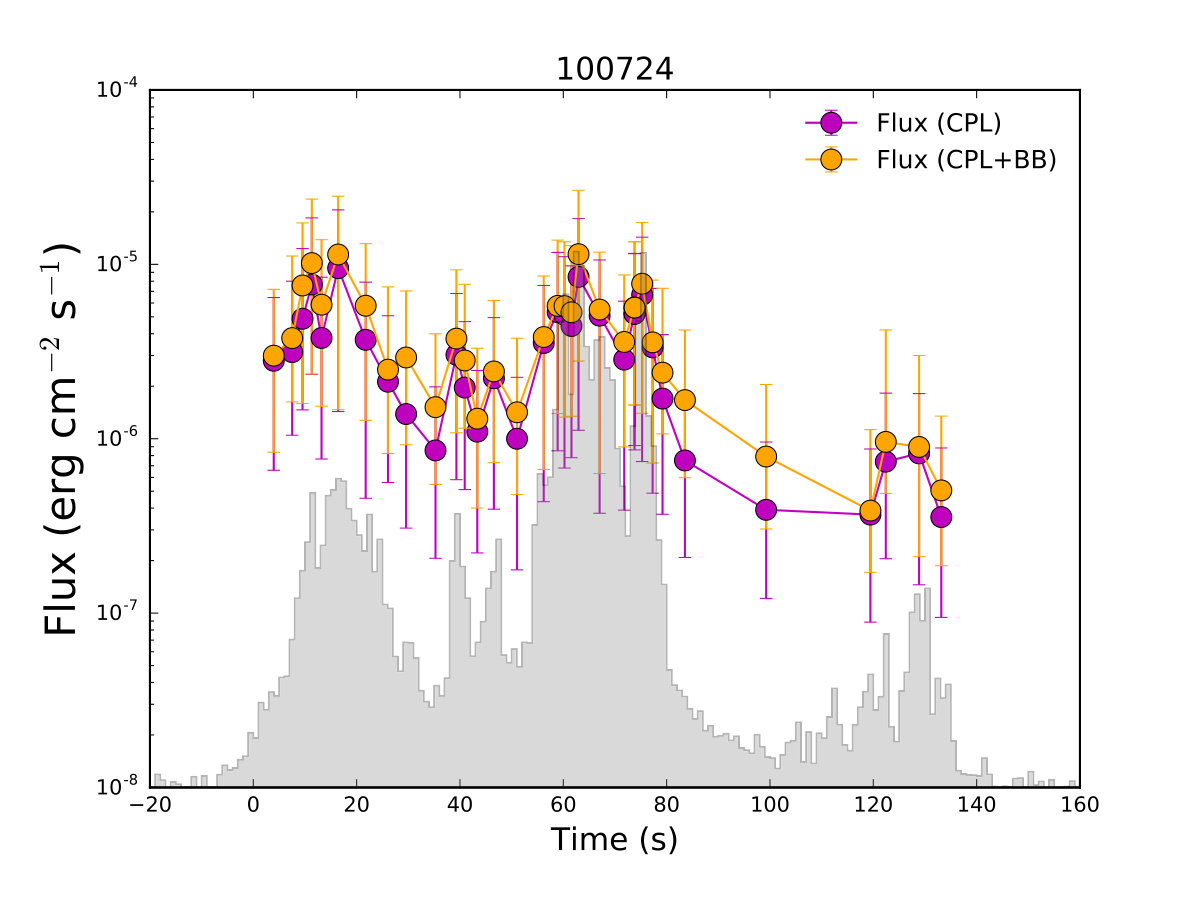 Figure 22
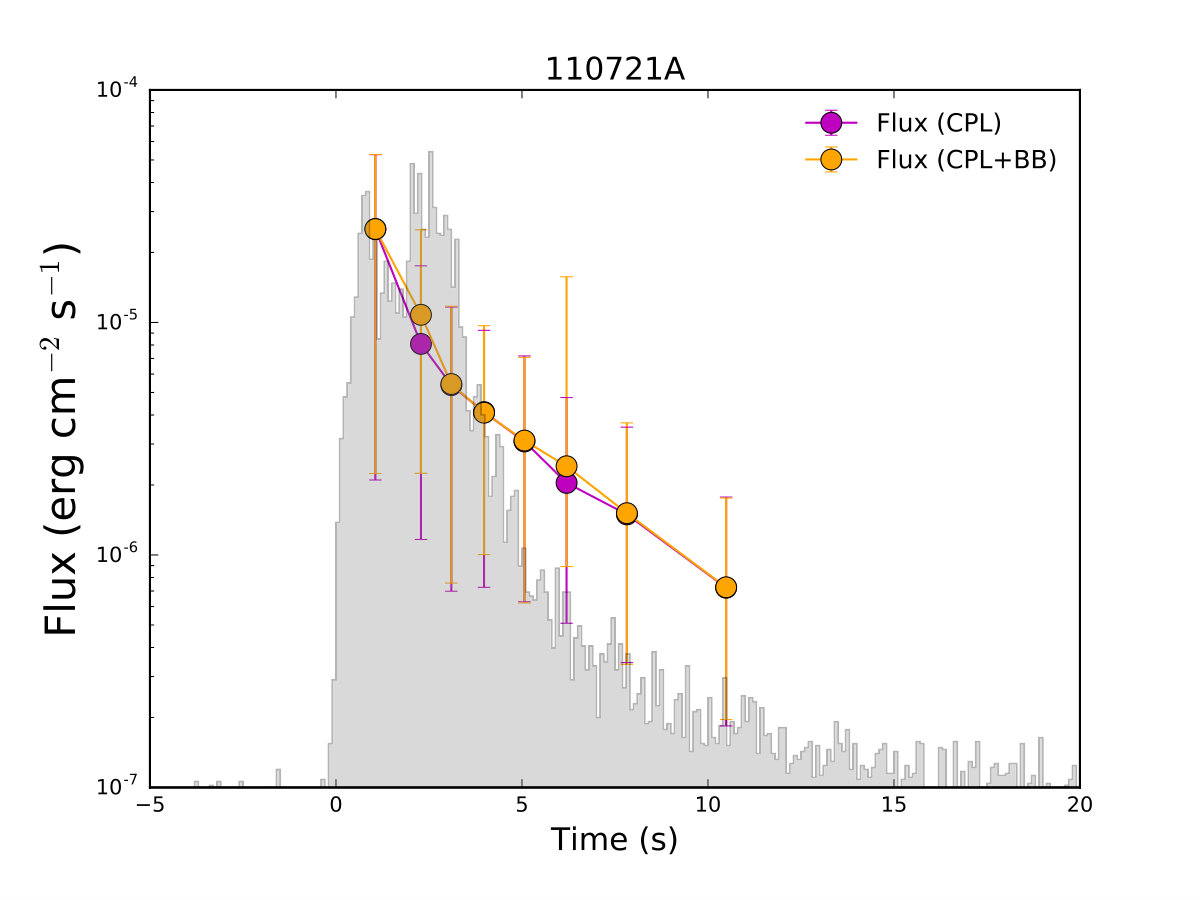 Figure 23
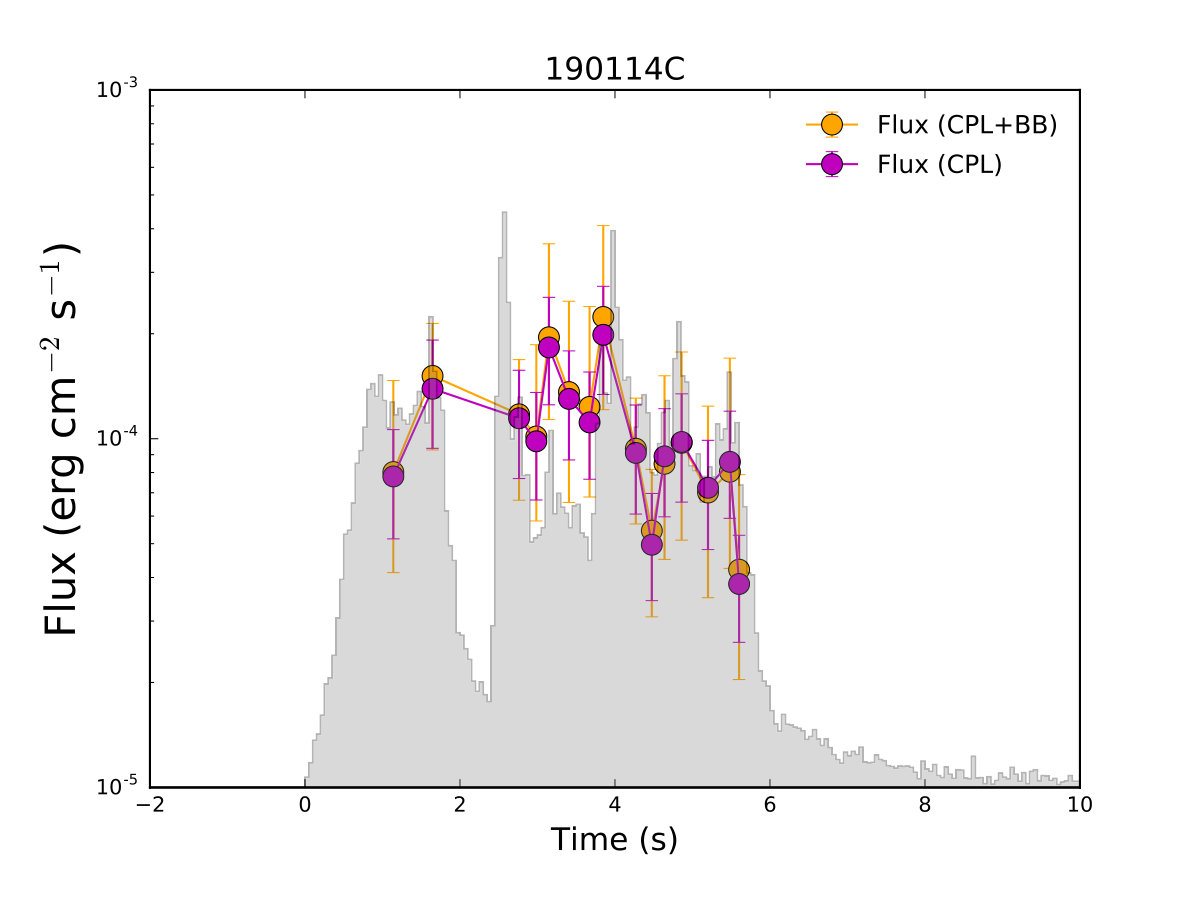 Figure 24
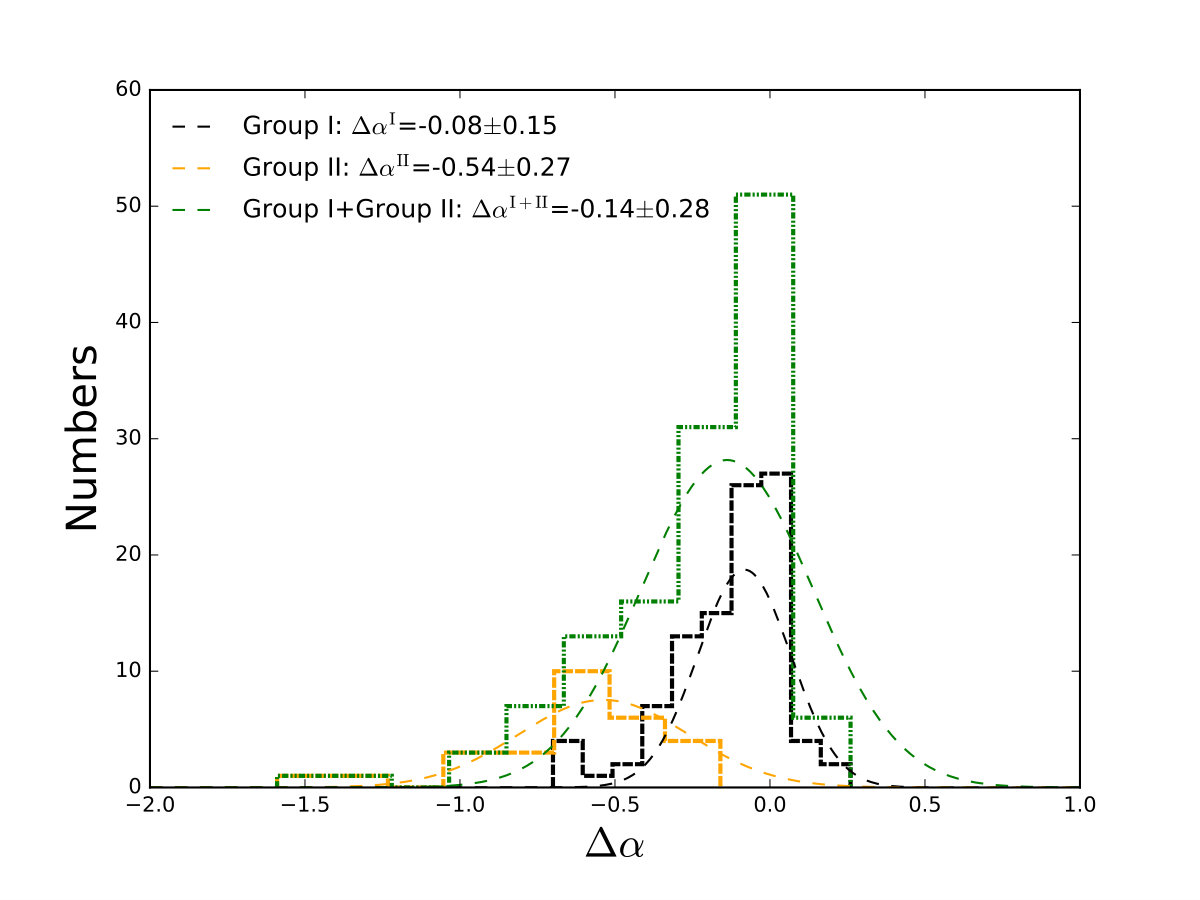 Figure 25
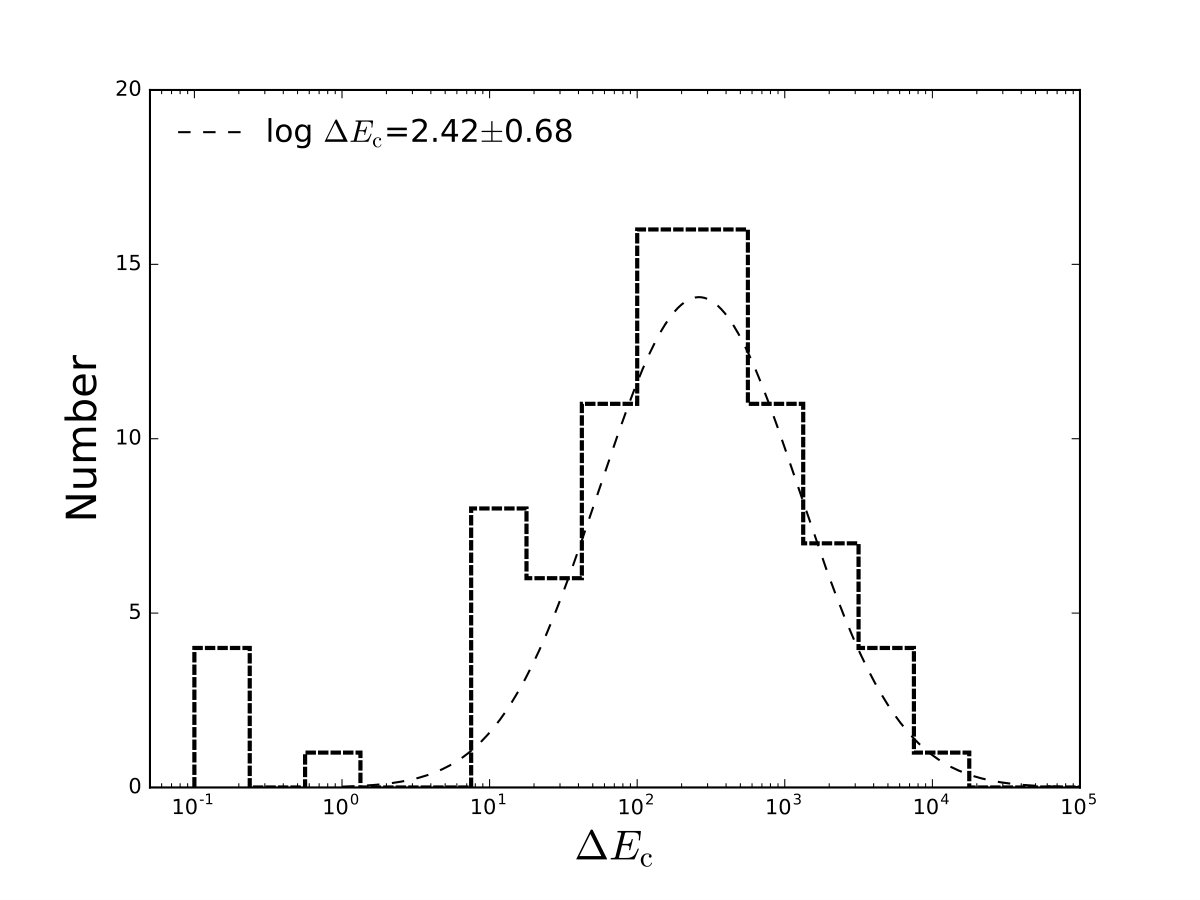 Figure 26
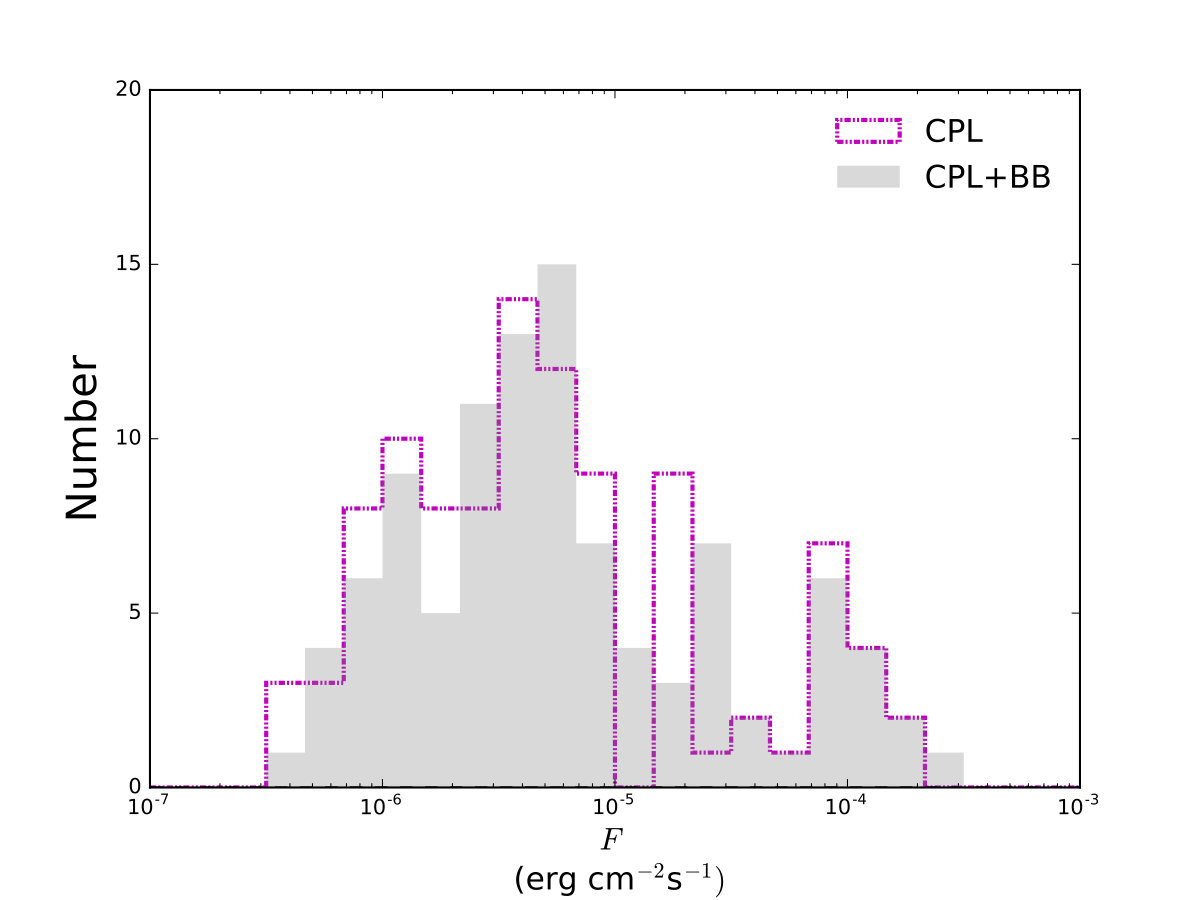 Figure 27
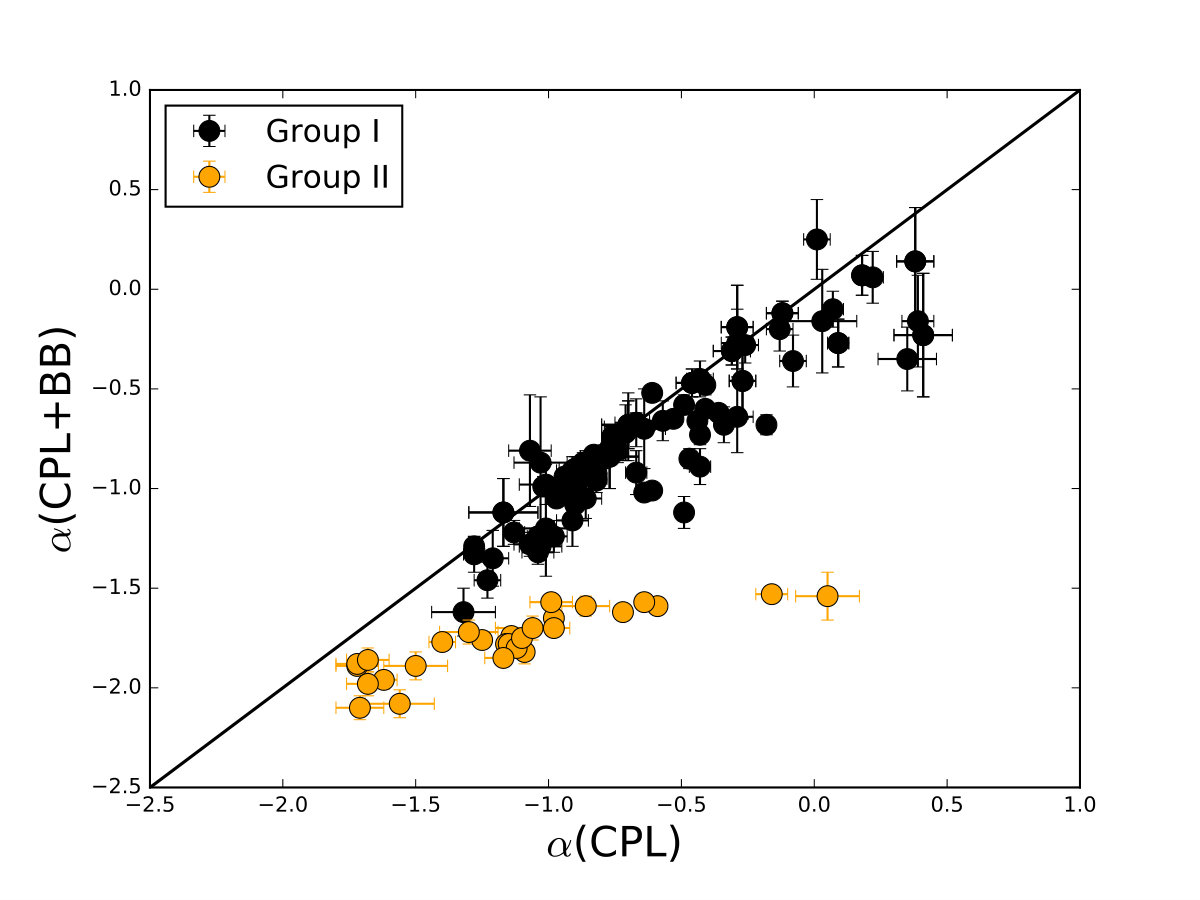 Figure 28
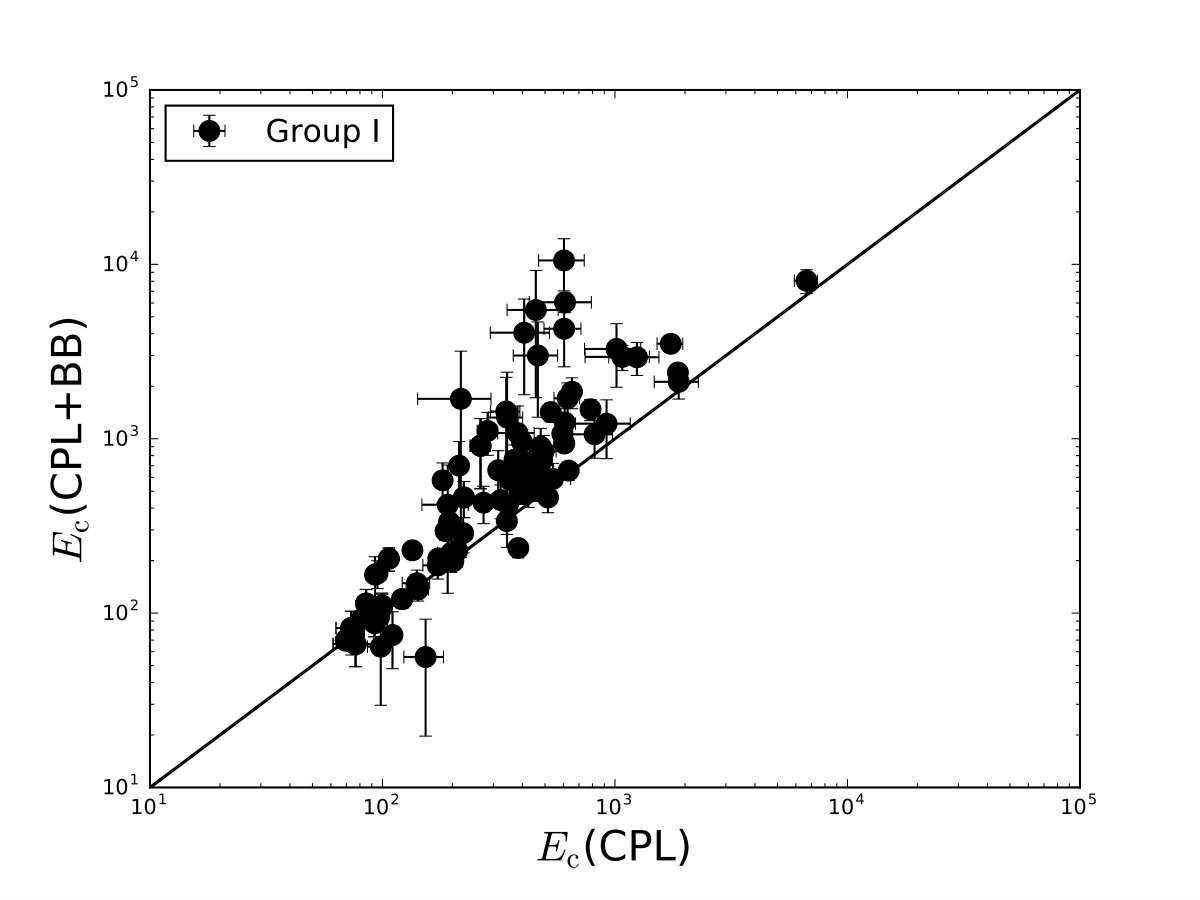 Figure 29
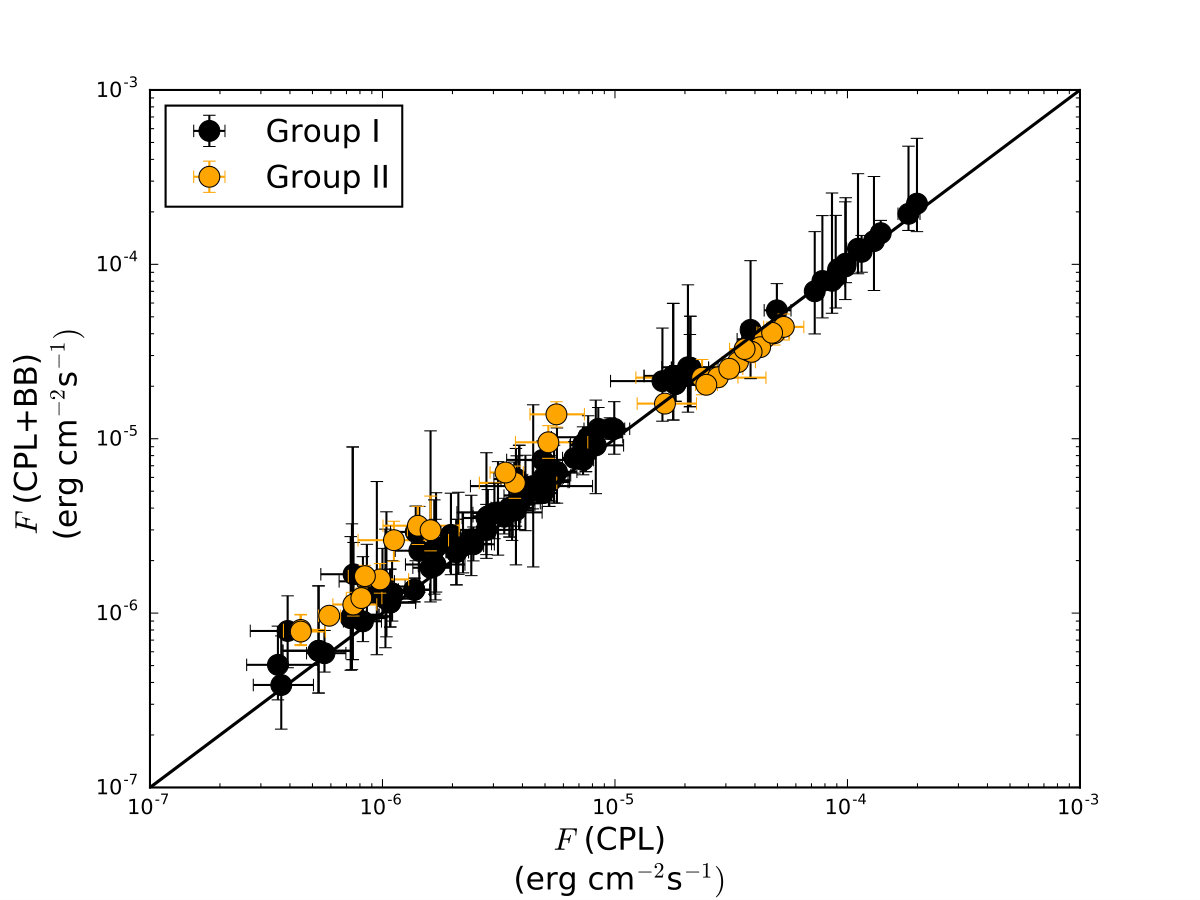 Figure 30
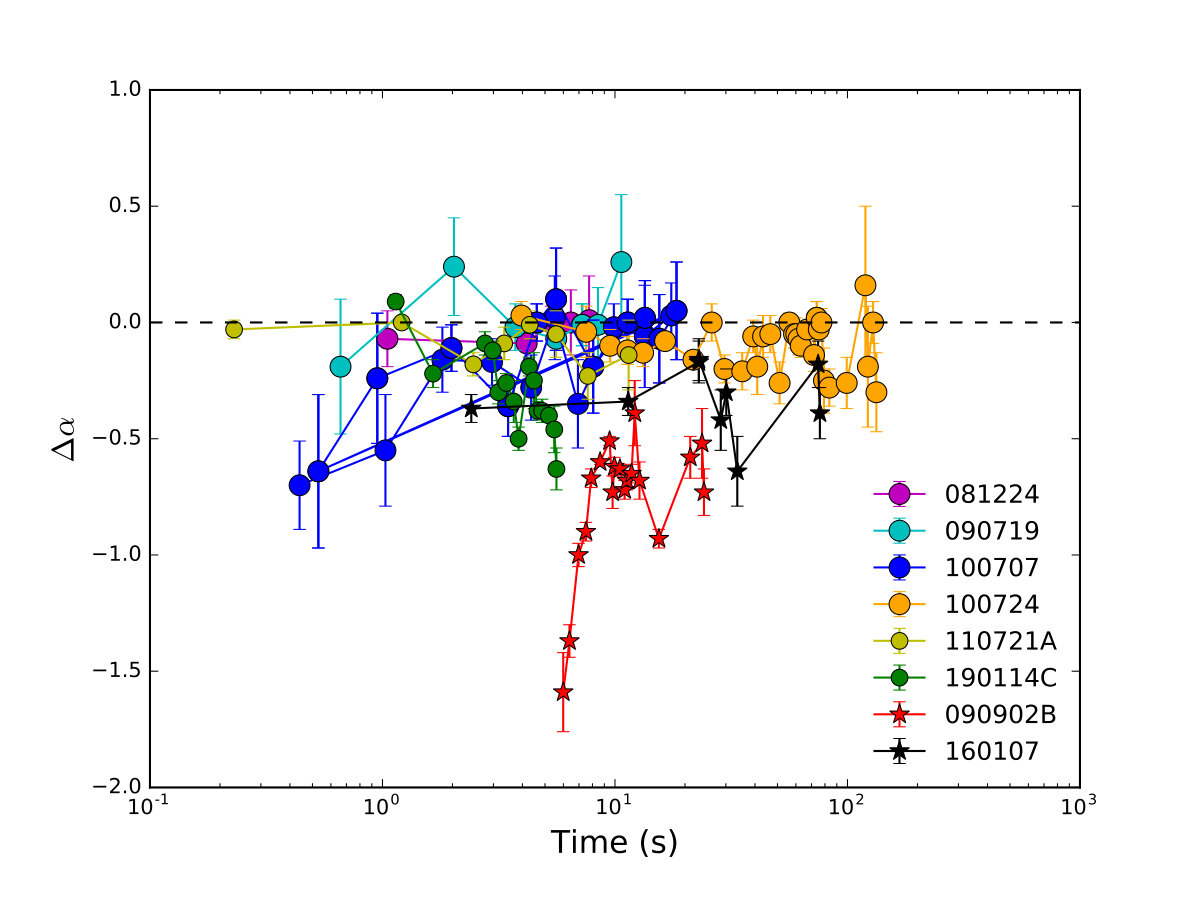 Figure 31
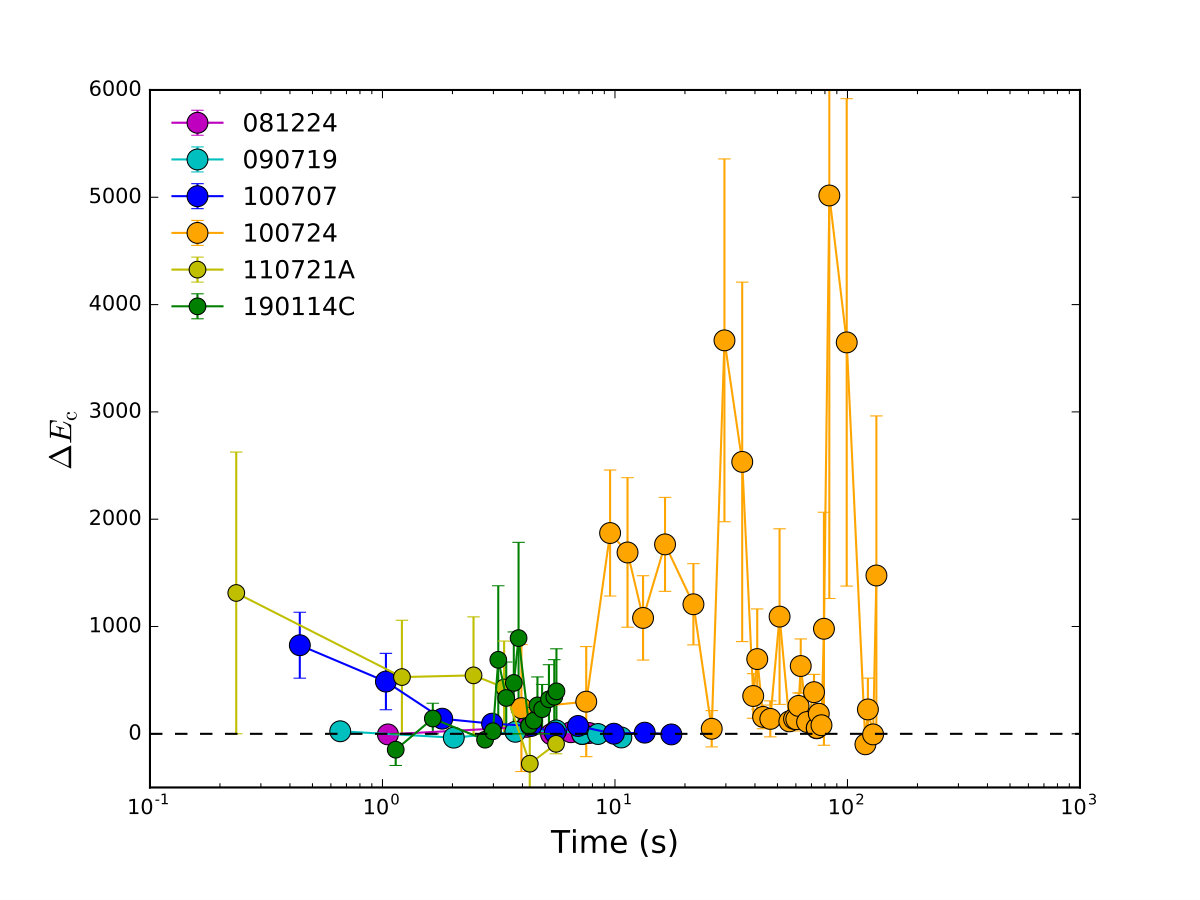 Figure 32
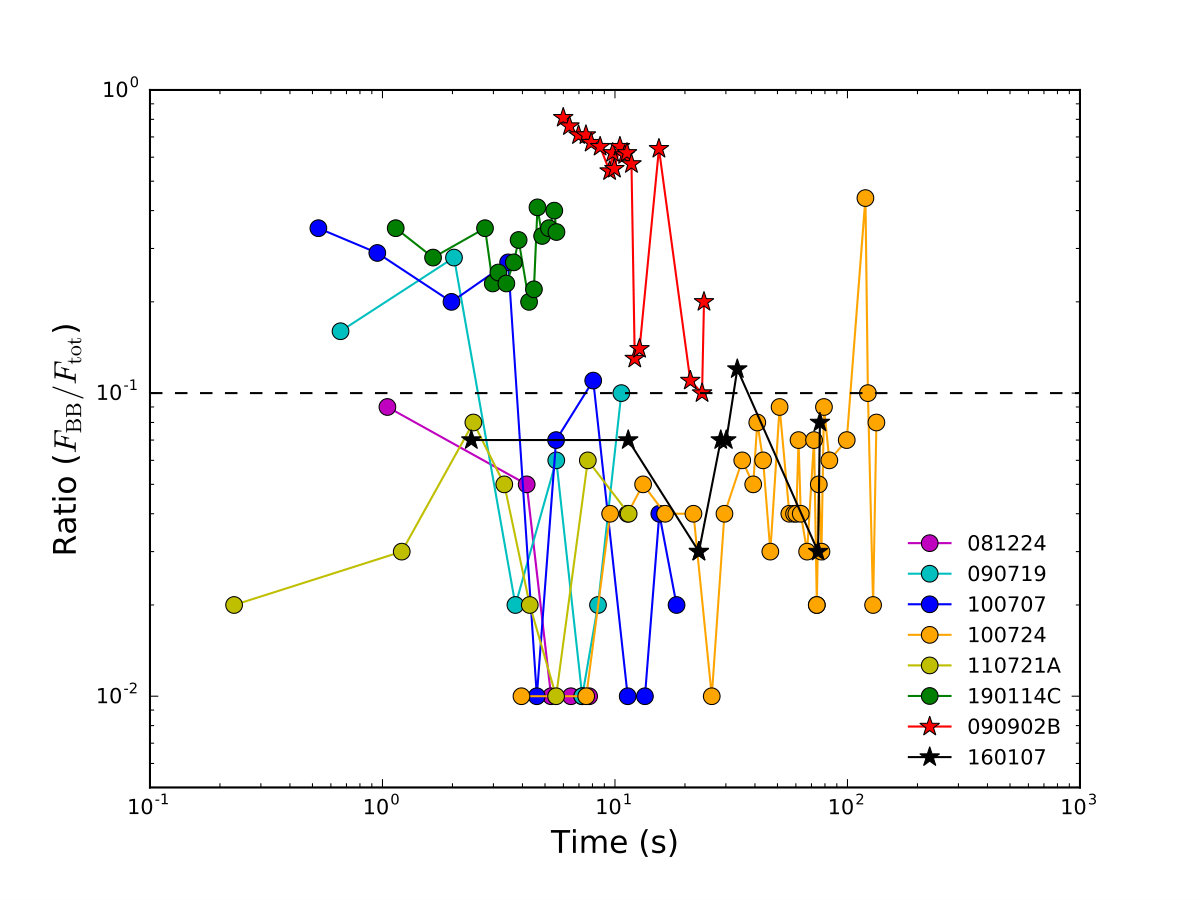 Figure 33
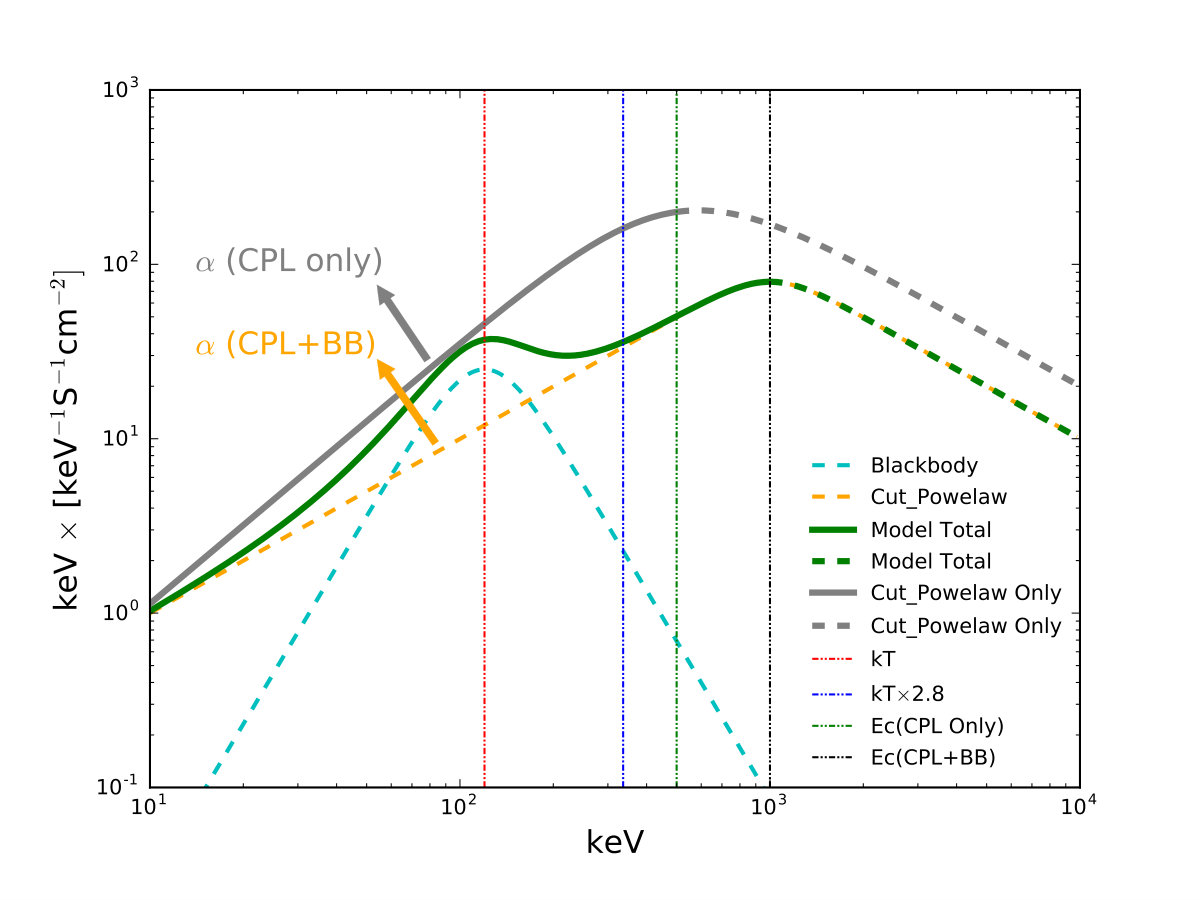 Figure 34
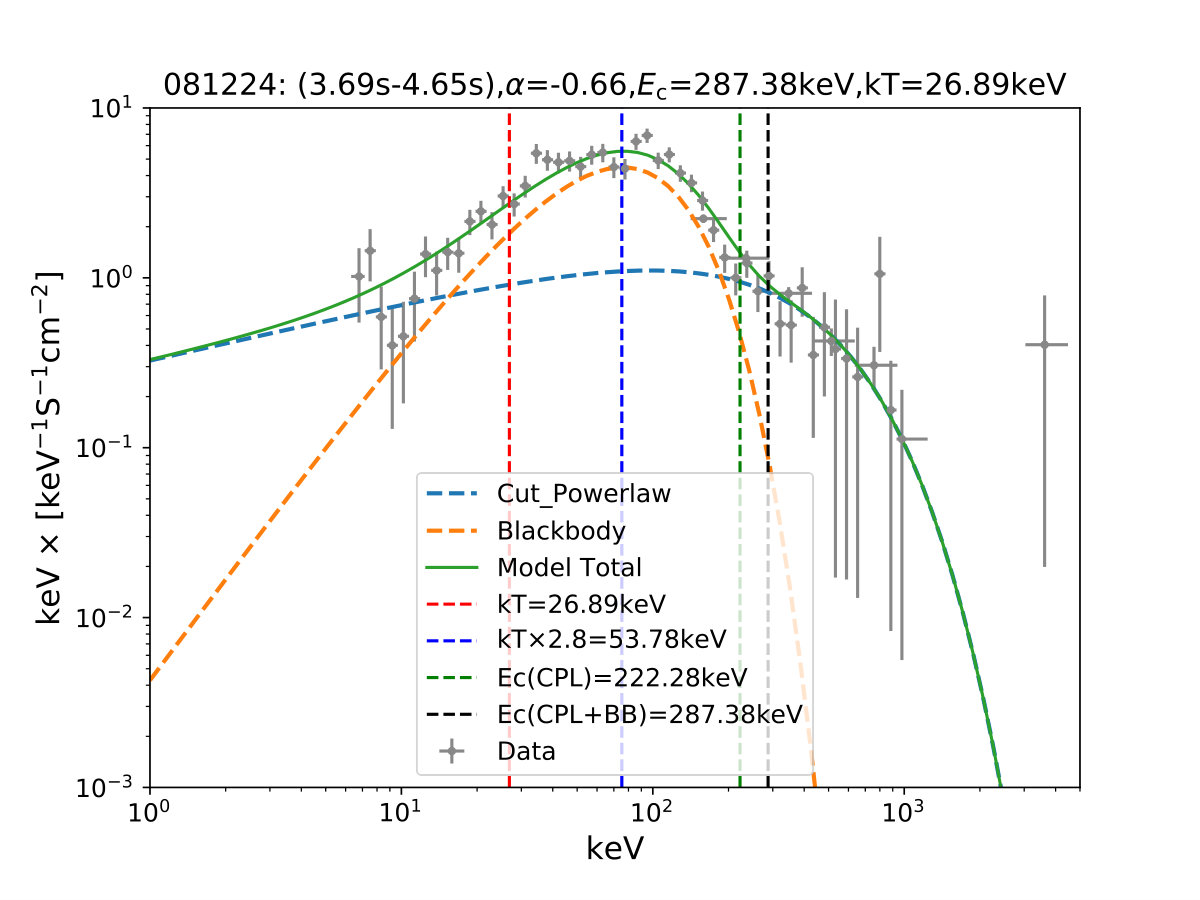 Figure 35
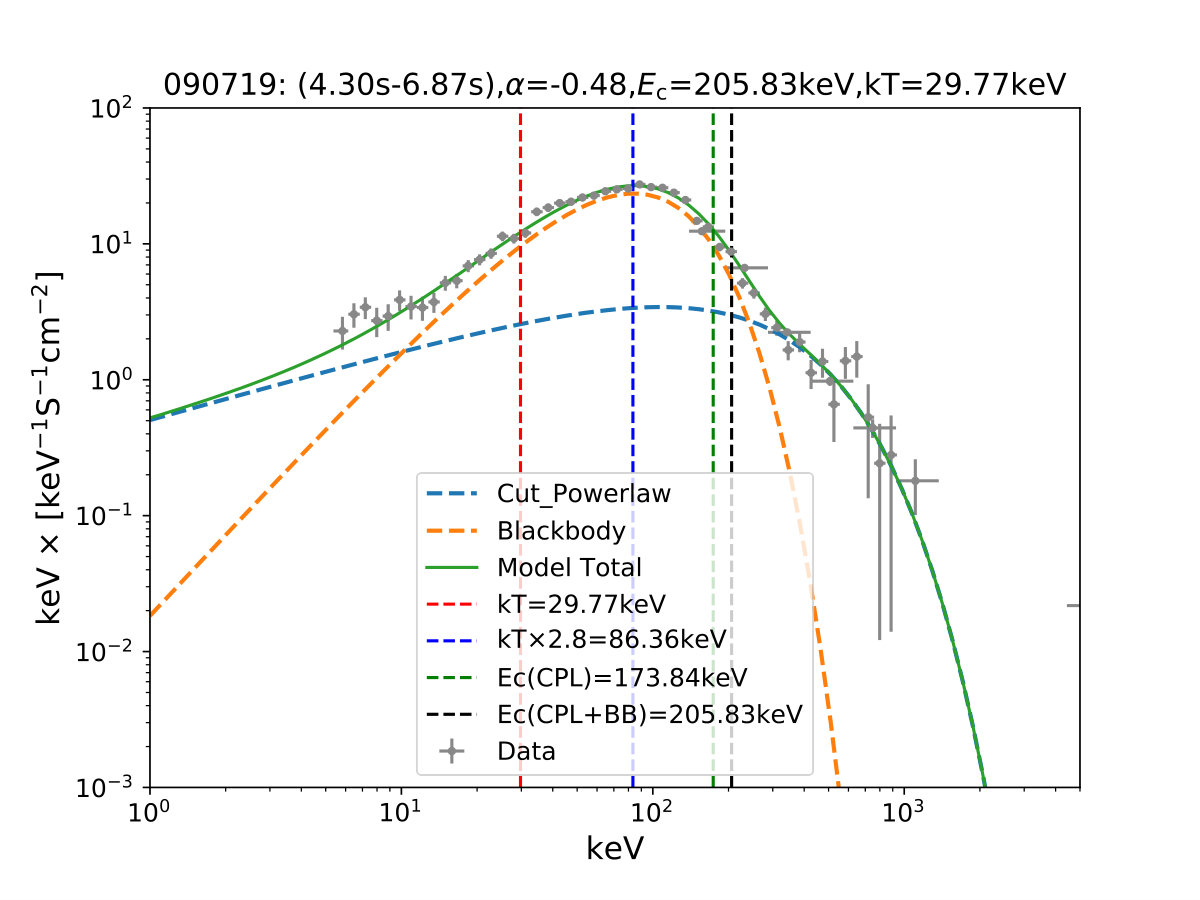 Figure 36
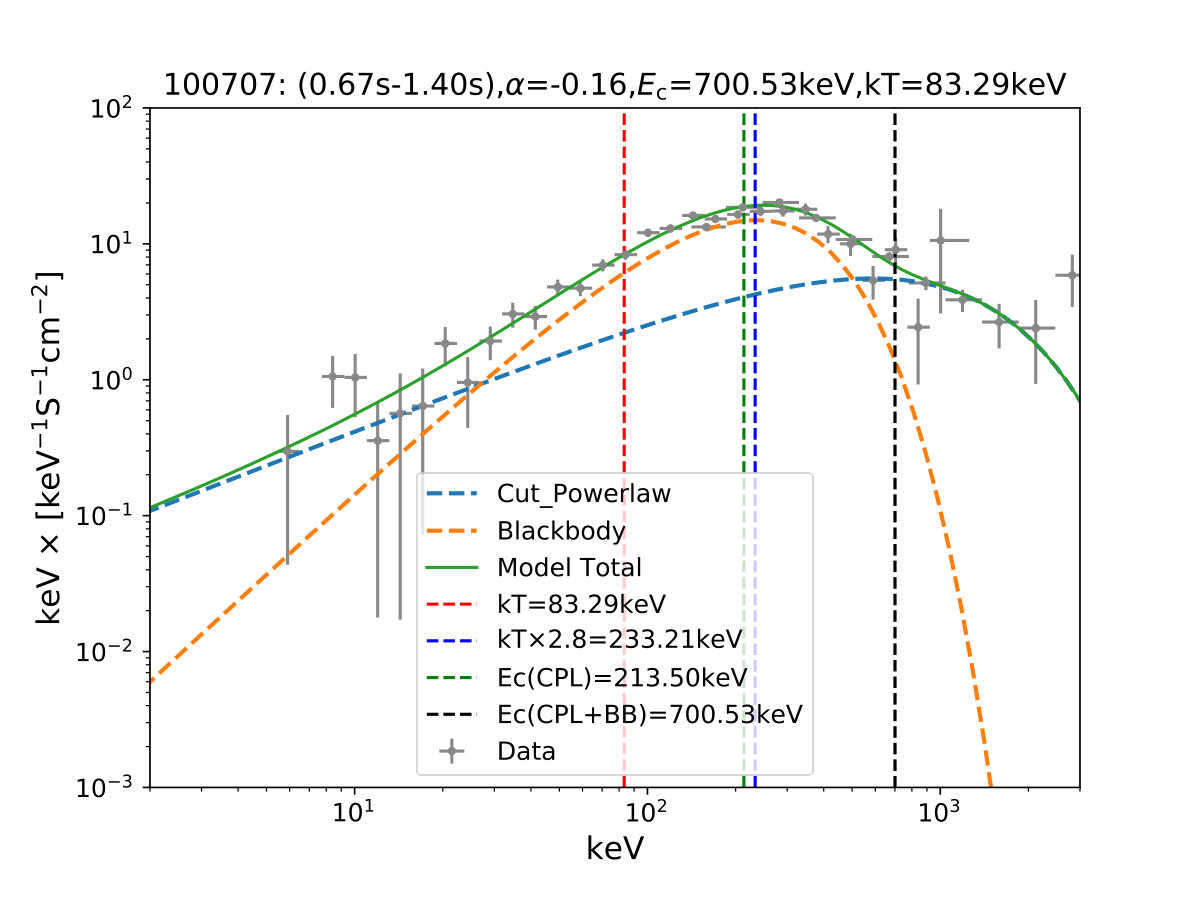 Figure 37
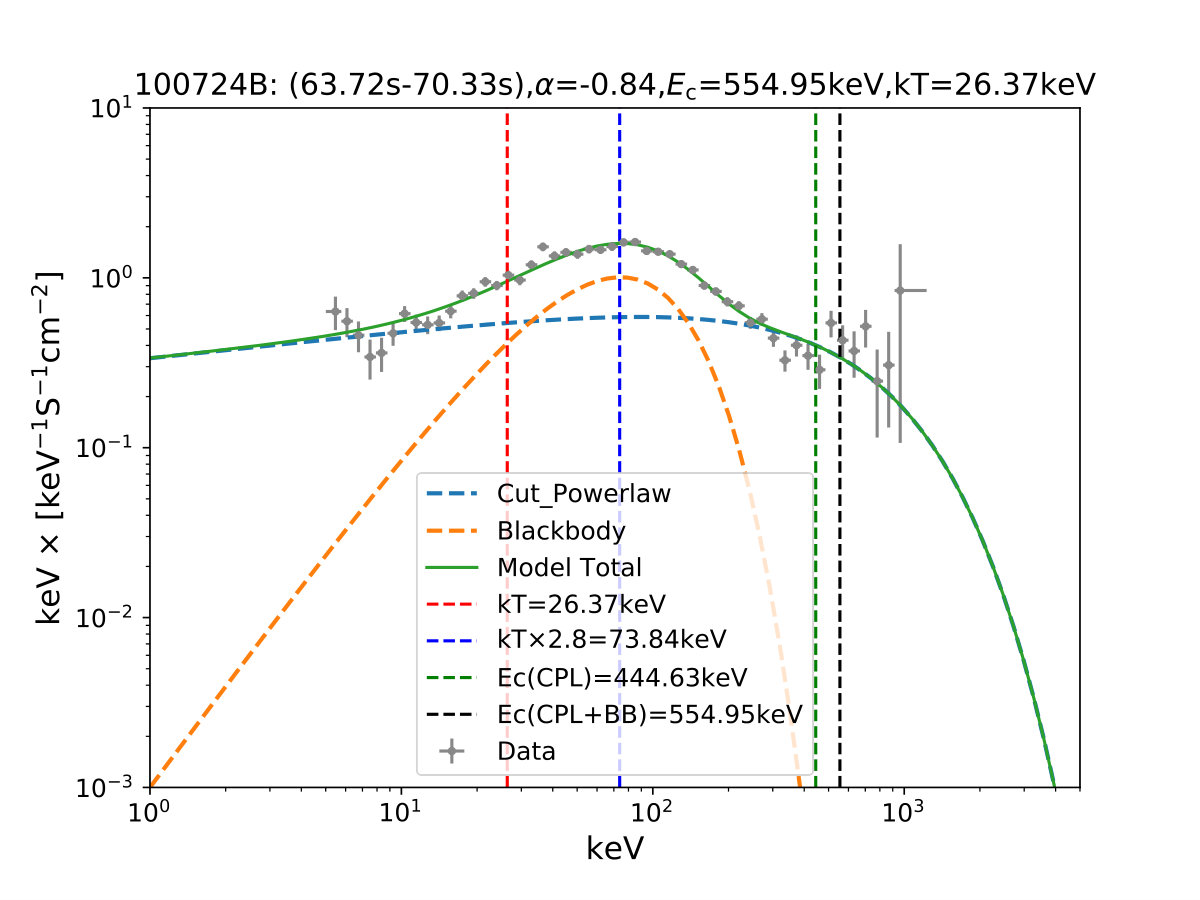 Figure 38
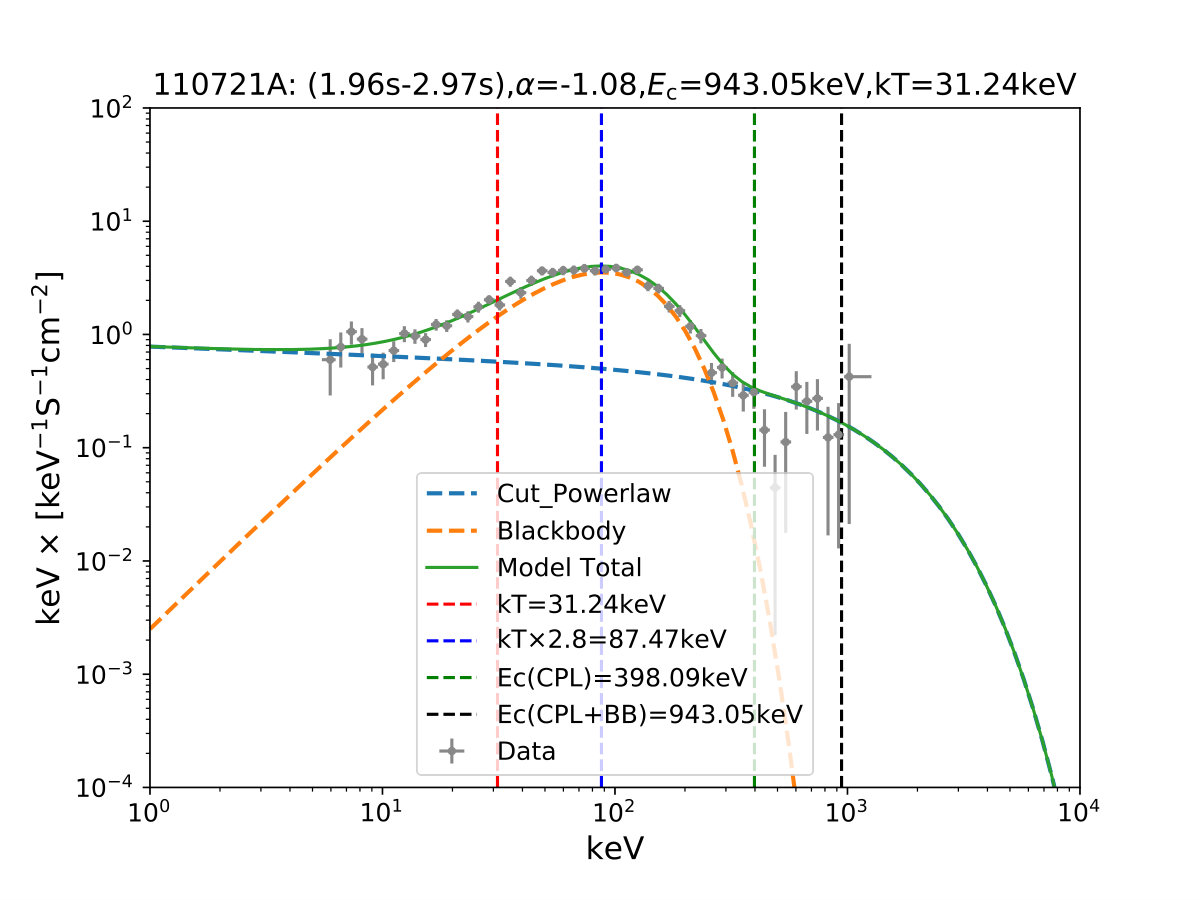 Figure 39
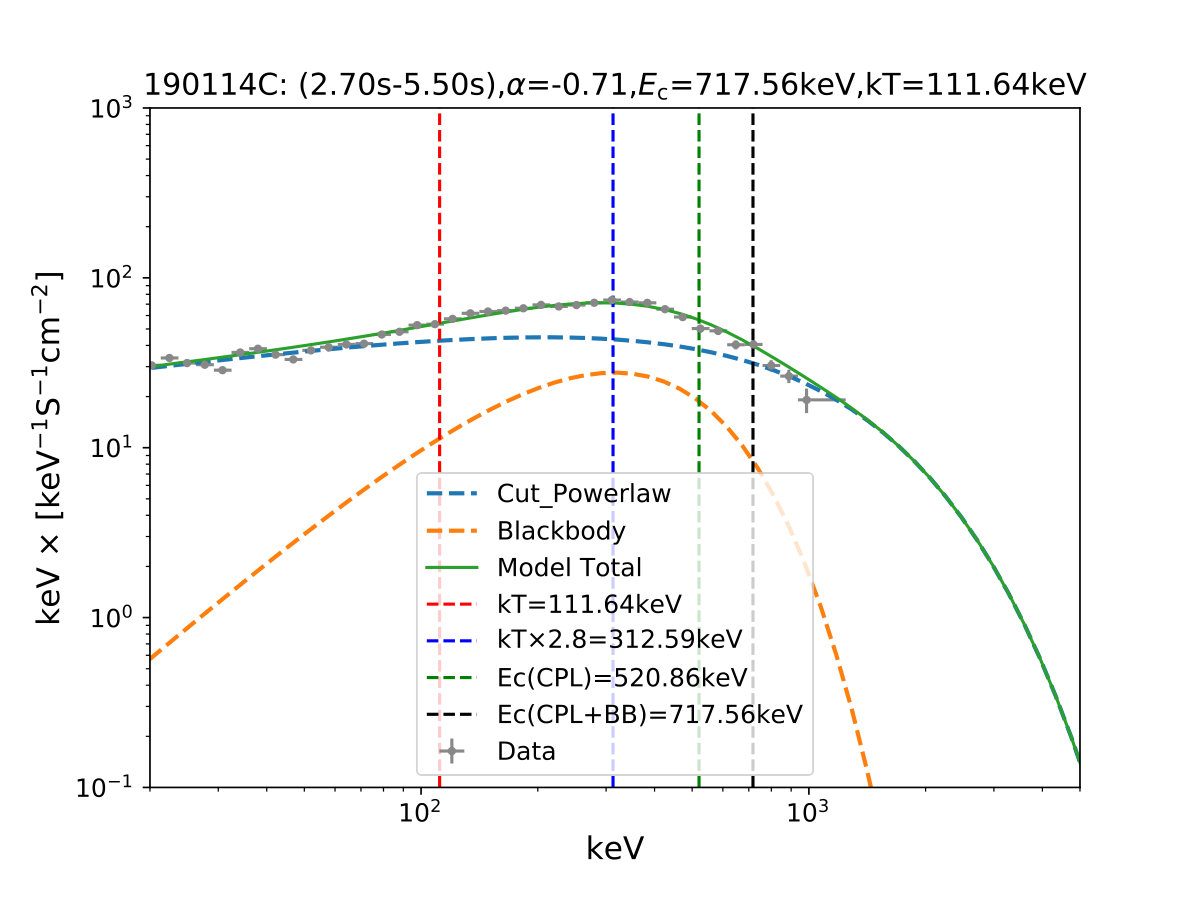 Figure 40
| Fermi ID | Fluence | Dector | Source | Background | 20/Total | Best Model | Reference | |
|---|---|---|---|---|---|---|---|---|
| (s) | ( erg cm-2) | (Bin) | (For Best Model) | |||||
| 081221681 | 29.700.41 | 3.000.01 | n1(n2)b0 | -1.-45. | [-20–10,60-80] | 14/18 | PL+BB | Basak & Rao (2013) |
| 081224887 | 16.451.16 | 3.760.02 | (n6)n7n9b1 | 0.-20. | [-20–10,40-60] | 5/8 | Band+BB | Iyyani et al. (2016) |
| 090719063 | 11.390.47 | 4.680.02 | n7(n8)b1 | 0.-15. | [-20–10,40-60] | 11/11 | Band+BB | Iyyani et al. (2016) |
| 090902462 | 19.330.29 | 22.120.03 | n0(n1)n9b0 | -1.-25. | [-20–10,60-80] | 48/57 | PL+BB | Ryde et al. (2010) |
| 100507577 | 44.035.22 | 1.000.01 | (n9)nanbb1 | -1.-30. | [-20–10,60-80] | 0/4 | Band+BB | Ghirlanda et al. (2013) |
| 100707032 | 81.79 1.21 | 8.770.02 | n7(n8)b1 | 0.-80. | [-50–10,80-100] | 11/13 | Band+BB | Iyyani et al. (2016) |
| 100724029 | 114.693.24 | 21.750.06 | n0(n1)n2b0 | -1.-140. | [-20–10,150-170] | 33/38 | Band+BB | Guiriec et al. (2011) |
| 101219686 | 51.011.78 | 0.400.005 | n3n6(n7)b1 | -1.-30. | [-20–10,60-80] | 0/2 | Band+BB | Larsson et al. (2015) |
| 110721200 | 21.820.57 | 3.700.004 | (n6)n7n9b1 | 0.-25. | [-20–10,40-60] | 8/9 | Band+BB | Iyyani et al. (2013) |
| 110920546 | 160.775.22 | 17.230.02 | (n0)n1n3b0 | 0.-15. | [-18–10,180-190] | 8/10 | PL+2BB | Iyyani et al. (2015) |
| 120323162 | 4.350.72 | 0.140.002 | n9na(nb)b1 | -1.-5. | [-20–10,60-80] | 0/3 | Band+BB | Guiriec et al. (2013) |
| 160107931 | 113.9217.76 | 2.730.01 | (n1)n2n5b0 | -1.-110. | [-100–80,150-170] | 9/32 | PL+BB | Kawakubo et al. (2018) |
| 190114873 | 116.352.56 | 44.330.05 | n3(n4)n7b0 | 0.-25. | [-20–10,180-200] | 48/51 | Band+BB | Wang et al. (2019) |
| Cutoff Power-law Fitting | Cutoff Power-law Plus Blackbody Fitting | Difference | ||||||||
|---|---|---|---|---|---|---|---|---|---|---|
| RatioI | DICI | |||||||||
| (s) | (keV) | (keV) | ||||||||
| 0.351.76 | 48.23 | -0.13 | 342.6 | -0.20 | 337.4 | 129.1 | -0.07 | -5.2 | 0.09 | -55.3 |
| 3.694.65 | 45.88 | -0.57 | 222.3 | -0.66 | 287.4 | 26.9 | -0.09 | 65.1 | 0.05 | -378.3 |
| 4.655.97 | 40.97 | -0.67 | 201.7 | -0.67 | 198.2 | 104.0 | 0.00 | -3.5 | 0.01 | -16.8 |
| 5.976.95 | 28.07 | -0.67 | 172.9 | -0.67 | 187.8 | 15.1 | 0.00 | 15.0 | 0.01 | -61.7 |
| 6.958.54 | 27.23 | -0.70 | 140.6 | -0.69 | 148.3 | 14.5 | 0.01 | 7.7 | 0.01 | -188.4 |
| Cutoff Power-law Fitting | Cutoff Power-law Plus Blackbody Fitting | Difference | ||||||||
|---|---|---|---|---|---|---|---|---|---|---|
| RatioI | DICI | |||||||||
| (s) | (keV) | (keV) | ||||||||
| 0.420.89 | 21.01 | 0.03 | 197.4 | -0.16 | 221.3 | 83.4 | -0.19 | 23.9 | 0.16 | -30.0 |
| 0.893.16 | 62.62 | 0.01 | 110.4 | 0.25 | 74.9 | 85.7 | 0.24 | -35.5 | 0.28 | -99.6 |
| 3.164.30 | 53.97 | -0.43 | 209.8 | -0.45 | 228.9 | 25.5 | -0.02 | 19.1 | 0.02 | -3658.8 |
| 4.306.87 | 106.00 | -0.41 | 173.8 | -0.48 | 205.8 | 29.8 | -0.07 | 32.0 | 0.06 | -22.1 |
| 6.877.59 | 43.30 | -0.46 | 121.5 | -0.47 | 120.3 | 38.2 | -0.01 | -1.1 | 0.01 | -351.5 |
| 6.877.59 | 43.30 | -0.46 | 121.3 | -0.47 | 120.3 | 38.2 | -0.01 | -1.0 | 0.01 | -351.5 |
| 7.599.32 | 41.19 | -0.71 | 96.8 | -0.72 | 95.2 | 20.4 | -0.01 | -1.5 | 0.02 | -7936.8 |
| 9.3211.98 | 34.50 | -1.07 | 98.3 | -0.81 | 64.2 | 49.4 | 0.26 | -34.1 | 0.10 | -7169.2 |
| Cutoff Power-law Fitting | Cutoff Power-law Plus Blackbody Fitting | Difference | ||||||||
|---|---|---|---|---|---|---|---|---|---|---|
| RatioI | DICI | |||||||||
| (s) | (keV) | (keV) | ||||||||
| 0.360.70 | 34.38 | 0.41 | 264.1 | -0.23 | 911.0 | 111.6 | -0.64 | 646.9 | 0.35 | -32.4 |
| 0.701.19 | 54.98 | 0.38 | 223.9 | 0.14 | 460.5 | 79.3 | -0.24 | 236.6 | 0.29 | -57.1 |
| 1.192.77 | 123.61 | 0.18 | 187.1 | 0.07 | 295.5 | 52.0 | -0.11 | 108.4 | 0.20 | -120.2 |
| 2.774.17 | 100.54 | 0.09 | 106.5 | -0.27 | 205.2 | 34.4 | -0.36 | 98.8 | 0.27 | -65.2 |
| 4.175.04 | 72.69 | -0.12 | 91.5 | -0.12 | 91.7 | 154.5 | 0.00 | 0.1 | 0.01 | -24.3 |
| 5.046.12 | 62.16 | -0.29 | 99.4 | -0.19 | 107.8 | 16.3 | 0.10 | 8.4 | 0.07 | -57.7 |
| 6.1210.00 | 80.36 | -0.27 | 85.0 | -0.46 | 113.5 | 22.0 | -0.19 | 28.5 | 0.11 | -42.5 |
| 10.0012.69 | 55.57 | -0.31 | 69.5 | -0.31 | 69.7 | 155.3 | 0.00 | 0.3 | 0.01 | -20.8 |
| 12.6914.21 | 35.75 | -0.70 | 92.5 | -0.68 | 87.7 | 60.4 | 0.02 | -4.8 | 0.01 | -20.7 |
| 14.2116.81 | 37.36 | -0.77 | 73.3 | -0.84 | 82.1 | 42.1 | -0.07 | 8.8 | 0.04 | -7076.7 |
| 16.8120.00 | 31.74 | -1.17 | 76.6 | -1.12 | 66.4 | 48.7 | 0.05 | -10.2 | 0.02 | -103.2 |
| Cutoff Power-law Fitting | Cutoff Power-law Plus Blackbody Fitting | Difference | ||||||||
|---|---|---|---|---|---|---|---|---|---|---|
| RatioI | DICI | |||||||||
| (s) | (keV) | (keV) | ||||||||
| 1.196.72 | 25.69 | -1.02 | 1880.0 | -0.99 | 2119.6 | 26.9 | 0.03 | 239.5 | 0.01 | -21.8 |
| 6.728.32 | 22.18 | -0.86 | 920.1 | -0.90 | 1219.9 | 38.4 | -0.04 | 299.8 | 0.01 | -112.9 |
| 8.3210.73 | 39.04 | -0.90 | 1074.7 | -1.00 | 2946.0 | 38.3 | -0.10 | 1871.4 | 0.04 | -63.9 |
| 10.7311.92 | 36.78 | -0.90 | 1243.2 | -1.02 | 2933.3 | 48.7 | -0.12 | 1690.1 | 0.04 | -41.9 |
| 11.9214.49 | 41.85 | -0.82 | 625.7 | -0.95 | 1705.8 | 34.8 | -0.13 | 1080.1 | 0.05 | -44.9 |
| 14.4918.34 | 65.31 | -0.97 | 1737.3 | -1.05 | 3502.9 | 48.5 | -0.08 | 1765.5 | 0.04 | -130.2 |
| 18.3425.16 | 68.80 | -0.88 | 653.0 | -1.04 | 1860.3 | 37.1 | -0.16 | 1207.3 | 0.04 | -48.9 |
| 25.1626.98 | 27.72 | -0.90 | 541.3 | -0.90 | 588.5 | 14.6 | 0.00 | 47.2 | 0.01 | -2108.9 |
| 26.9832.17 | 34.57 | -1.04 | 604.6 | -1.24 | 4271.4 | 29.4 | -0.20 | 3666.8 | 0.04 | -22.3 |
| 32.1738.35 | 27.64 | -1.07 | 465.8 | -1.28 | 3000.1 | 26.7 | -0.21 | 2534.3 | 0.06 | -27.1 |
| 38.3540.27 | 41.93 | -0.89 | 493.3 | -0.95 | 846.0 | 25.3 | -0.06 | 352.7 | 0.05 | -29.8 |
| 40.2741.57 | 27.68 | -0.86 | 381.1 | -1.05 | 1077.9 | 31.3 | -0.19 | 696.8 | 0.08 | -22.5 |
| 41.5745.13 | 32.65 | -0.89 | 272.1 | -0.95 | 429.8 | 19.9 | -0.06 | 157.8 | 0.06 | -26.3 |
| 45.1348.00 | 43.13 | -0.90 | 424.0 | -0.95 | 563.3 | 26.2 | -0.05 | 139.3 | 0.03 | -56.2 |
| 48.0054.09 | 37.12 | -0.98 | 340.7 | -1.24 | 1433.2 | 29.9 | -0.26 | 1092.5 | 0.09 | -27.3 |
| 54.0958.33 | 66.51 | -0.83 | 446.2 | -0.83 | 562.3 | 23.6 | 0.00 | 116.1 | 0.04 | -40.6 |
| 58.3359.48 | 48.64 | -0.80 | 457.7 | -0.85 | 597.6 | 29.3 | -0.05 | 139.9 | 0.04 | -18.2 |
| 59.4860.99 | 63.64 | -0.79 | 386.6 | -0.84 | 523.0 | 29.1 | -0.05 | 136.4 | 0.04 | -25.0 |
| 60.9962.17 | 46.49 | -0.74 | 371.4 | -0.81 | 631.7 | 27.9 | -0.07 | 260.3 | 0.07 | -43.4 |
| 62.1763.72 | 70.70 | -0.82 | 608.0 | -0.92 | 1239.9 | 32.2 | -0.10 | 631.9 | 0.04 | -51.9 |
| 63.7270.33 | 107.98 | -0.81 | 444.6 | -0.84 | 555.0 | 26.4 | -0.03 | 110.3 | 0.03 | -53.1 |
| 70.3373.24 | 52.97 | -0.82 | 369.6 | -0.96 | 758.0 | 29.0 | -0.14 | 388.3 | 0.07 | -45.2 |
| 73.2474.33 | 44.68 | -0.76 | 457.1 | -0.74 | 509.0 | 22.8 | 0.02 | 51.9 | 0.02 | -19.1 |
| 73.2474.33 | 44.68 | -0.76 | 454.7 | -0.74 | 509.0 | 22.8 | 0.02 | 54.3 | 0.02 | -18.9 |
| 74.3376.18 | 72.29 | -0.77 | 462.5 | -0.80 | 649.7 | 27.7 | -0.03 | 187.2 | 0.05 | -54.7 |
| 76.1878.39 | 54.59 | -0.87 | 404.1 | -0.87 | 484.5 | 21.4 | 0.00 | 80.4 | 0.03 | -21.6 |
| 78.3980.02 | 31.16 | -0.91 | 343.5 | -1.16 | 1322.5 | 32.9 | -0.25 | 979.0 | 0.09 | -24.8 |
| 80.0287.06 | 27.17 | -1.04 | 456.6 | -1.32 | 5473.5 | 31.2 | -0.28 | 5016.9 | 0.06 | -22.5 |
| 87.06111.46 | 20.87 | -1.03 | 406.9 | -1.29 | 4054.7 | 26.5 | -0.26 | 3647.8 | 0.07 | -26.9 |
| 117.17121.70 | 22.60 | -1.03 | 153.3 | -0.87 | 56.0 | 41.6 | 0.16 | -97.3 | 0.44 | -78.5 |
| 121.70123.12 | 21.20 | -1.01 | 190.8 | -1.20 | 418.2 | 20.7 | -0.19 | 227.4 | 0.10 | -2049.3 |
| 126.92130.80 | 41.82 | -0.91 | 142.0 | -0.91 | 136.8 | 81.1 | 0.00 | -5.2 | 0.02 | -382.2 |
| 130.80135.52 | 23.19 | -1.32 | 217.3 | -1.62 | 1693.0 | 16.3 | -0.30 | 1475.6 | 0.08 | -12.0 |
| Cutoff Power-law Fitting | Cutoff Power-law Plus Blackbody Fitting | Difference | ||||||||
|---|---|---|---|---|---|---|---|---|---|---|
| RatioI | DICI | |||||||||
| (s) | (keV) | (keV) | ||||||||
| 0.000.47 | 33.73 | -0.95 | 6669.0 | -0.98 | 8054.5 | 128.8 | -0.03 | 1385.6 | 0.02 | -24.2 |
| 0.471.96 | 77.74 | -0.94 | 1864.5 | -0.94 | 2397.4 | 39.5 | 0.00 | 532.9 | 0.03 | -94.8 |
| 1.962.97 | 74.04 | -0.90 | 397.9 | -1.08 | 958.0 | 31.4 | -0.18 | 560.1 | 0.08 | -62.0 |
| 2.973.70 | 49.77 | -1.13 | 479.3 | -1.22 | 899.6 | 23.5 | -0.09 | 420.3 | 0.05 | -28.1 |
| 3.704.90 | 45.72 | -1.28 | 817.1 | -1.29 | 1060.3 | 17.8 | -0.01 | 243.2 | 0.02 | -31.7 |
| 4.906.25 | 36.04 | -1.28 | 1015.4 | -1.33 | 3271.4 | 25.6 | -0.05 | 2256.0 | 0.01 | -231.3 |
| 6.259.03 | 33.51 | -1.23 | 603.5 | -1.46 | 10532.3 | 34.6 | -0.23 | 9928.8 | 0.06 | -27.4 |
| 9.0313.87 | 22.49 | -1.21 | 609.7 | -1.35 | 6061.0 | 29.7 | -0.14 | 5451.3 | 0.04 | -125.5 |
| Cutoff Power-law Fitting | Cutoff Power-law Plus Blackbody Fitting | Difference | ||||||||
|---|---|---|---|---|---|---|---|---|---|---|
| RatioI | DICI | |||||||||
| (s) | (keV) | (keV) | ||||||||
| 0.701.58 | 240.02 | -0.61 | 383.8 | -0.52 | 236.2 | 230.3 | 0.09 | -147.5 | 0.35 | -44.3 |
| 1.581.71 | 111.95 | -0.44 | 478.6 | -0.66 | 621.1 | 155.8 | -0.22 | 142.5 | 0.28 | -367.7 |
| 2.642.88 | 125.08 | -0.49 | 515.0 | -0.58 | 460.3 | 197.4 | -0.09 | -54.7 | 0.35 | -622.0 |
| 2.883.09 | 95.22 | -0.53 | 632.4 | -0.65 | 656.8 | 187.6 | -0.12 | 24.4 | 0.23 | -12.4 |
| 3.093.21 | 87.32 | -0.43 | 784.8 | -0.73 | 1474.5 | 162.1 | -0.30 | 689.8 | 0.25 | -19.7 |
| 3.213.60 | 137.87 | -0.36 | 605.2 | -0.62 | 939.7 | 149.2 | -0.26 | 334.4 | 0.23 | -36.7 |
| 3.603.74 | 72.47 | -0.34 | 593.5 | -0.68 | 1068.1 | 151.0 | -0.34 | 474.7 | 0.27 | -20.0 |
| 3.743.96 | 131.51 | -0.18 | 528.9 | -0.68 | 1421.1 | 140.4 | -0.50 | 892.2 | 0.32 | -62.7 |
| 4.104.44 | 159.08 | -0.41 | 347.1 | -0.60 | 421.3 | 114.8 | -0.19 | 74.2 | 0.20 | -921.9 |
| 4.444.51 | 60.65 | -0.67 | 322.4 | -0.92 | 445.3 | 96.6 | -0.25 | 122.9 | 0.22 | -207.4 |
| 4.514.77 | 132.57 | -0.64 | 486.0 | -1.02 | 751.0 | 111.1 | -0.38 | 265.0 | 0.41 | -132.9 |
| 4.774.95 | 125.55 | -0.47 | 352.6 | -0.85 | 582.4 | 89.9 | -0.38 | 229.9 | 0.33 | -53.9 |
| 4.955.45 | 169.35 | -0.61 | 412.9 | -1.01 | 735.0 | 91.0 | -0.40 | 322.1 | 0.35 | -176.2 |
| 5.455.51 | 74.54 | -0.43 | 314.7 | -0.89 | 660.2 | 81.5 | -0.46 | 345.5 | 0.40 | -92.9 |
| 5.515.69 | 101.53 | -0.49 | 181.4 | -1.12 | 577.4 | 47.9 | -0.63 | 396.0 | 0.34 | -47.1 |
| Cutoff Power-law Fitting | Power-law Plus Blackbody Fitting | Difference | ||||||
|---|---|---|---|---|---|---|---|---|
| Power-law Index | RatioII | DICII | ||||||
| (s) | (keV) | (keV) | ||||||
| 5.946.04 | 26.05 | 0.05 | 377.8 | -1.54 | 146.0 | -1.59 | 0.81 | -2.4 |
| 6.046.70 | 44.89 | -0.16 | 499.4 | -1.53 | 161.6 | -1.37 | 0.76 | -1.9 |
| 6.707.24 | 51.25 | -0.59 | 1047.7 | -1.59 | 187.3 | -1.00 | 0.71 | -114.7 |
| 7.247.75 | 59.81 | -0.72 | 1279.4 | -1.62 | 199.3 | -0.90 | 0.71 | -185.9 |
| 7.758.04 | 59.62 | -0.98 | 2429.5 | -1.65 | 253.4 | -0.67 | 0.67 | -222.7 |
| 8.049.23 | 133.37 | -1.14 | 2736.4 | -1.74 | 228.6 | -0.60 | 0.65 | -1306.4 |
| 9.239.74 | 98.08 | -1.25 | 3163.4 | -1.76 | 180.0 | -0.51 | 0.54 | -447.5 |
| 9.749.81 | 51.14 | -1.09 | 1635.5 | -1.82 | 149.9 | -0.73 | 0.62 | -132.0 |
| 9.8110.07 | 76.08 | -1.16 | 1727.8 | -1.78 | 144.3 | -0.62 | 0.55 | -218.0 |
| 10.0710.92 | 107.41 | -1.15 | 2554.4 | -1.78 | 201.0 | -0.63 | 0.65 | -821.7 |
| 10.9211.09 | 61.85 | -0.98 | 1516.1 | -1.70 | 169.7 | -0.72 | 0.61 | -160.2 |
| 11.0911.42 | 67.86 | -1.12 | 1904.0 | -1.80 | 161.5 | -0.68 | 0.62 | -246.9 |
| 11.4212.11 | 81.20 | -1.10 | 1770.6 | -1.75 | 151.9 | -0.65 | 0.57 | -323.3 |
| 12.1112.22 | 22.09 | -1.50 | 467.0 | -1.89 | 27.3 | -0.39 | 0.13 | -11.0 |
| 12.5112.99 | 51.63 | -1.17 | 135.9 | -1.85 | 20.2 | -0.68 | 0.14 | -14.9 |
| 15.2115.69 | 76.43 | -0.64 | 840.0 | -1.57 | 156.4 | -0.93 | 0.64 | -6.5 |
| 21.0021.16 | 35.59 | -0.99 | 214.0 | -1.57 | 24.8 | -0.58 | 0.11 | -1.2 |
| 23.3224.04 | 23.29 | -1.56 | 166.6 | -2.08 | 14.7 | -0.52 | 0.10 | -1.2 |
| 24.0424.24 | 30.08 | -0.86 | 278.9 | -1.59 | 44.4 | -0.73 | 0.20 | -14.6 |
| Cutoff Power-law Fitting | Power-law Plus Blackbody Fitting | Difference | ||||||
|---|---|---|---|---|---|---|---|---|
| Power-law Index | RatioII | DICII | ||||||
| (s) | (keV) | (keV) | ||||||
| 0.104.73 | 38.19 | -1.40 | 322.5 | -1.77 | 24.0 | -0.37 | 0.07 | -3.3 |
| 4.7318.08 | 45.68 | -1.62 | 283.3 | -1.96 | 20.3 | -0.34 | 0.07 | -4.9 |
| 18.0927.82 | 29.50 | -1.72 | 492.5 | -1.89 | 12.2 | -0.17 | 0.03 | -42.0 |
| 18.0927.82 | 29.50 | -1.72 | 492.5 | -1.88 | 11.7 | -0.16 | 0.03 | -43.6 |
| 28.2828.75 | 21.62 | -1.30 | 295.6 | -1.72 | 23.0 | -0.42 | 0.07 | -6.3 |
| 28.7531.47 | 27.10 | -1.68 | 532.4 | -1.98 | 24.1 | -0.30 | 0.07 | -5.2 |
| 33.3133.85 | 20.08 | -1.06 | 181.6 | -1.70 | 23.4 | -0.64 | 0.12 | -2.4 |
| 74.4075.08 | 24.50 | -1.68 | 741.1 | -1.86 | 17.8 | -0.18 | 0.03 | -1722.1 |
| 75.0877.13 | 27.40 | -1.71 | 223.9 | -2.10 | 15.9 | -0.39 | 0.08 | -7.9 |
Peer Reviews
No public reviews on file for this paper yet. If you reviewed it on a platform where reviews are public (OpenReview, ICLR, NeurIPS, ICML), you can paste yours below so the community can read it here.
Videos
No videos yet. Explain this paper in a talk, walkthrough, or lecture? Add one.
Thermal Components in Gamma-ray Bursts. I.
How Do They Affect Non-Thermal Spectral Parameters?
ICRANet, Piazza della Repubblica 10, I-65122 Pescara, Italy Liang Li [email protected]
(Received 2019 May 7; Revised 2019 September 3; Accepted 2019 September 5)
Abstract
The spectral components of the prompt emission of gamma-ray bursts (GRBs) mainly consist of two possible origins: synchrotron (nonthermal) and photosphere (thermal). The typical spectral properties of GRBs can be modeled by a dominant nonthermal component (a Band-like function or cutoff power law), while some of them have an additional thermal component (a Planck-like function). In this paper, we investigate the effects of thermal components on the nonthermal spectral parameters. We focus on eight Fermi Gamma-ray Burst Monitor bursts of which the spectra deviate from a Band-only function, and the thermal components are significant. We sort them into thermal-subdominant Group I (e.g. GRB 110721A) and thermal-dominant Group II (e.g., GRB 090902B). Several interesting results are found assuming the spectral component is totally attributed to the nonthermal component: (i) the low-energy photon index becomes harder; (ii) the peak energy is significantly smaller and lies between the peak temperature of blackbody component and the peak energy of the cutoff power law + blackbody (CPL+BB) model; (iii) total flux , is generally the same; (iv) the changes ( and ) are positively correlated with the ratio between the thermal flux and total flux; and (v) parameter relations (, and -) also changed prominently. The GRBs in both groups show the same results. Our analysis indicates that the thermal component is important, and it significantly affects the spectral parameters and the consequential physical interpretations.
gamma-ray burst: general – methods: data analysis – radiation mechanisms: thermal
††facilities: Fermi-GBM††software: 3ML(Vianello et al., 2015), and RMFIT
\published
2019 November 1
1 Introduction
The synchrotron emission producing nonthermal photons (Meszaros et al., 1994; Rees & Meszaros, 1994; Daigne & Mochkovitch, 1998; Lloyd & Petrosian, 2000; Bošnjak et al., 2009; Daigne et al., 2011; Zhang & Yan, 2011; Beniamini & Piran, 2013, 2014; Deng et al., 2015; Beniamini et al., 2018; Geng et al., 2018; Lazarian et al., 2019) and the photosphere of the fireball (Thompson, 1994; Rees & Mészáros, 2005; Pe’er et al., 2006; Giannios, 2008; Pe’er, 2008; Beloborodov, 2009, 2010, 2011; Lazzati & Begelman, 2009, 2010; Ioka, 2010; Pe’er & Ryde, 2011; Ryde et al., 2011; Toma et al., 2011; Aksenov et al., 2013; Bégué et al., 2013; Lundman et al., 2013; Ruffini et al., 2013, 2014; Deng & Zhang, 2014; Vereshchagin, 2014; Beniamini & Giannios, 2017; Pe’Er & Ryde, 2017; Meng et al., 2018, 2019) generating the Comptonized quasi-thermal photons are two leading candidates of the radiation mechanism to explain the gamma-ray burst (GRB) prompt emission. The observed GRB spectrum in the keV-MeV energy range is usually described by a nonthermal phenomenological Band function (Band et al., 1993) in both the time-integrated (also called ‘time-averaged’) and the time-resolved spectra. The Band function is considered to be a phenomenological representation of the nonthermal synchrotron model. It involves the low-energy and the high-energy segments, in which the photon indices are (the low-energy index, with a typical value of about -1.0), and (the high-energy index, with a typical value of about -2.2), respectively. These two segments are smoothly connected at a peak energy, (with a typical value 250 keV), in the case of the spectrum. Although GRBs generally exhibit a nonthermal Band-like spectrum, the thermal component also plays a very important role, at least in some GRBs. Previous studies suggested that the GRB spectra may contain three basic components (e.g., Zhang et al., 2011): (i) the nonthermal component generally fitted with the Band function (broad spectral peak); (ii) the thermal component generally fitted with Planck’s blackbody (BB) function (a narrow spectral peak); and (iii) an additional power-law spectral component extending to the high energy range that is present in some Fermi-Large Area Telescope GRBs. The observed spectrum of a GRB can be a combination of two of these components or a combination of all the three components simultaneously in one GRB (Guiriec et al., 2015).
Observationally, some GRBs have confirmed an additional subdominant BB component embedded into the left shoulder of the Band shape (e.g, GRB 110721A; Axelsson et al., 2012). Thermal-dominant GRBs are rare. The time-resolved spectral analysis based on the Burst And Transient Source Experiment (BATSE) on board the Compton Gamma Ray Observatory (CGRO) revealed that a few bright bursts exhibit thermal domination during the entire burst duration, e.g., GRB 930214, GRB 941023, GRB 951228 (Ryde, 2004), and GRB 990413 (Bosnjak et al., 2006), or only at the beginning of the burst, see e.g., GRB 910807, GRB 910927, GRB 911119, GRB 970111, and GRB 980326 (Ghirlanda et al., 2003). These results were confirmed later by the observations of Gamma-ray Burst Monitor (GBM) on board the Fermi Gamma-ray Space Telescope (see the detailed discussion in §2).
Due to the rarity and the dimness of the thermal component, the common spectral analysis often adopts only the nonthermal model, which inevitably brings bias to those GRBs containing evident thermal emission. One interesting question therefore arises: how does the thermal component affect the nonthermal spectral parameters? In this work, we are going to address this issue by analyzing eight bursts with significant thermal components. We fit these GRBs with and without the inclusion of a thermal component and then compare their , evolution, and the relationship of , , and , respectively.
This paper is organized as follows. In §2, we perform the sample selection, data reduction, and sample definition. In §3, we present the results, including the global parameter evolution and parameter relations. The conclusions are presented in §4. Throughout the paper, the standard -CDM cosmology with the parameters of , , and is adopted (Planck Collaboration et al., 2018). The convention is adopted in cgs units.
2 Methodology
2.1 Sample Selection
Compared to the BATSE (25-1800 keV), the Fermi-GBM provides a broader energy range (8 keV-40 MeV), which can fully assess all the current GRB spectral models (e.g., Ghirlanda et al., 2007). We, therefore, carry out this task by working with Fermi GBM data. The Fermi-GBM (Meegan et al., 2009) contains 12 sodium iodide (NaI, 8 keV-1 MeV) detectors (n0 to n9, na and nb) and two bismuth germanate (BGO, 200 keV-40 MeV) detectors (b0 and b1). The time tagged event (TTE) and the standard response files provided by the GBM team are used. We collect the data from all the triggered NaI detectors and one BGO detector, of which the selection is dependent on the sequence of NaI detectors, b0 if n0 to n5, and b1 otherwise.
The Fermi-GBM GRBs with thermal components reported in previous studies are systematically searched; 13 cases are obtained in our sample (see Table 1). These bursts are reported to have an additional thermal component that significantly improves the spectral fitting. Here, we first review the spectral characteristics of these bursts reported in the literature. Guiriec et al. (2011) reported that the spectrum of GRB 100724B is dominated by the typical Band function, while it also includes a statistically highly significant thermal contribution. Likewise, this two-component scenario is also reported by a few other bursts. Burgess et al. (2014) reported five bursts, GRB 081224 (Wilson-Hodge et al., 2008; Iyyani et al., 2016), GRB 090719A (van der Horst, 2009; Iyyani et al., 2016), GRB 100707A (Wilson-Hodge & Foley, 2010; Iyyani et al., 2016), GRB 110721A (Axelsson et al., 2012; Iyyani et al., 2013), and GRB 110920A (Iyyani et al., 2016), in which an additional BB component was required for the synchrotron components (Band+BB model) to produce acceptable spectral fits. Ghirlanda et al. (2013) analyzed the time-resolved spectrum of GRB 100507 and reported that the burst has a BB spectrum for the entire duration ( 30 s) of the prompt emission.
A BB spectrum in the prompt gamma-ray emission was found in a long burst, GRB 101219B, which was analyzed by Larsson et al. (2015), making it the second such burst observed by Fermi-GBM. Guiriec et al. (2013, 2017) argued that both the time-integrated and time-resolved spectral analyses in GRB 120323A can be described by a two-component scenario similarly, in which thermal emission is observed simultaneously with a nonthermal component. Recently, a very bright GRB, 190114C, was reported in Wang et al. (2019), adding a BB was found to improves the fitting over the cutoff power law (CPL) only. Besides, Li (2019a) recently analyzed the time-resolved spectra of four Fermi bright bursts (GRB 140206B, GRB 140329B, GRB 150330A, and GRB 160625B, see also Zhang et al. 2018) and found that the thermal component is detected only at the beginning of the burst, and followed up by a nonthermal synchrotron component. Note that a few bursts may show a thermal dominate form, which is represented by narrower spectra, with the most prominent case being GRB 090902B (Ryde et al., 2010). The emission of GRB 160107A (Kawakubo et al., 2018) is reported to come from the jet photosphere combined with nonthermal emission described by a single power law. GRB 081221 can be described with multi-color BB spectra (Basak & Rao, 2013; Hou et al., 2018). The best spectral fitting in GRB 110920A is a power-law plus two BBs fitting (Iyyani et al., 2015), see also McGlynn & Fermi GBM Collaboration (2012); Shenoy et al. (2013).
2.2 Data Reduction
The time-resolved spectral analyses in previous works mainly make use of the frequentist approach. In this paper, we performed a Bayesian analysis using the package called the Multi-Mission Maximum Likelihood Framework (3ML; Vianello et al. 2015) as the main tool to carry out the time-resolved spectral analyses for Fermi-GBM data (see also, Yu et al., 2018; Li, 2019a, b).
The background is selected by fitting the pre- and post-source intervals with an order of 0-4 polynomial for one of the bright NaIs in photon counts. The optimal order of the polynomial is determined by applying a likelihood ratio test. This optimal polynomial is then used to fit each of the 128 energy channels (TTE) to estimate the background model. The background photon counts for each channel are obtained by integrating the optimal polynomial over source interval. The maximum likelihood-based statistics are used, i.e., the so-called Pgstat, given by a Poisson (observation; Cash 1979)-Gaussian (background) profile likelihood. For the Poisson-Gaussian profile likelihood to be valid, we bin the spectra at least one background count per spectral bin. The source is selected as the time interval of for each burst. To perform the time-resolved spectral analysis, we first rebin the TTE data by using the Bayesian Blocks method (BBlocks; Scargle et al. 2013) with a false alarm probability of =0.01 to the TTE light curve of the brightest NaI detector. All of the other used detectors are then binned in matching time bins. This can be done by selecting the detector with the highest significance during the source interval for the case where more than one NaI detector is triggered. We then use the brightest one for the BBlocks and background fitting. To better study the time-resolved spectral evolution, we select the number of spectra with statistical significance S20 to be at least greater than 4 for each burst111The detail derivation of significance , as well as the relationship with signal-to-noise ratio S/N, can be found in Vianello (2018) for a Poisson (sources)-Gaussian (backgrounds) profile and in Li & Ma (1983) for a Poisson (sources)-Poisson (backgrounds) profile.. The sample then reduced to eight bursts with this criterion. The spectra with S20 usually have a huge error from the fitting.
In Table 1, we listed 13 bursts satisfying all aforementioned criteria (Column 1), along with their (Column 2), the fluence (column 3) between 10 and 1000 keV, the detectors used (Column 4), the source (Column 5) and background (Column 6) intervals, the number of the time bins of /total using the BBlocks analysis across the source (Column 7), and the best model suggested in the literature (Column 8) and its reference (Column 9).
Since thermal components are generally observed in the left shoulder of the Band spectrum in the low-energy region (below ), its presence does not affect the high-energy index (above ). Therefore, we uniformly employ the CPL model to replace the Band function to perform all the spectral fitting throughout the paper. The spectral analysis is performed by fitting Bayesian statistical models using the Markov Chain Monte Carlo (MCMC) technique. The parameters of our model in the Monte Carlo fit allow in the following range index (PL model): [-5, 1]; (keV, BB model): [1, 103]; (CPL model): [-5, 1]; and (keV, CPL model): [1, 104]. The informative priors are adopted by the typical spectral parameters from the -GBM catalog: ; ; and . The priors are used and multiplied to the likelihood, which combines the model and the observed data, yielding a posterior distribution of the parameters. Uncertainties are given at the 68% (1) Bayesian credible level calculated from the last 80% of the MCMC chain for 10000 iterations. To select the best model from two different given models, the deviance information criterion (DIC) is adopted in this paper, which is defined as DIC=-2log[(data)]+2, where is the posterior mean of the parameters, and is the effective number of parameters. The preferred model is the model with the lowest DIC score. Here, we define DIC=DIC(CPL+BB)-DIC(CPL). If DIC is negative, it indicates better CPL+BB.
2.3 Sample Definition
Following the above methodology, we select the time bins with 20 as222Our selected criteria only consider the number of spectra with 20 at least greater than 4 for a further analysis. having enough photons to perform the precise spectral fitting. We first fit the data with a canonical CPL model. Then, an additional BB component is added to check whether it improves the fitting statistics (DIC). The DIC score is greater than 10 for all time bins in our samples after the BB component is introduced (CPL+BB fit over CPL-alone fitting). Some of them are even as high as hundreds, indicating a firm detection of a BB component. Our results confirm the thermal component of these 13 GRBs as reported in the previous articles.
After the Bayesian analysis, we finally sort these Fermi bursts into two groups depending on whether the thermal emissions are subdominant (adhering to the left shoulder of the Band shape) or dominate (narrower) components that appear in the observed spectra.
- •
Group I: bursts for which the thermal components are typically subdominant. The group is made of six GRBs: GRB 081224, GRB 110721A, GRB 090719, GRB 100724B, and GRB 190114C. The temporal evolution of the parameters (, and ) is shown in Figure 1, 2 and 3, and the parameter relations (, and ) are displayed in Figure 4, 5, and 6.
- •
Group II: bursts for which the thermal components are dominant. Two GRBs are in this group: GRB 090902B and GRB 160107. The temporal evolution of the parameters ( or the power-law index, and ) are shown in Figure 7, and the parameter relations (the or index) are displayed in Figure 8.
To account for the difference of two models and two groups, we define:
[TABLE]
[TABLE]
[TABLE]
[TABLE]
[TABLE]
[TABLE]
[TABLE]
Their values for each burst are presented from Tables A1 to Table A8.
3 Results
The time-resolved spectral fitting results for each selected burst of Group I are listed from Tables A1 to Table A6, and the results of Group II are listed from Tables A7 and A8. For each table, we list the time interval (Column 1), (Column 2), parameters of the CPL-alone fitting ( and : Column 3 - Column 4), parameters of the CPL plus BB fitting (, and : Column 5 - Column 7) or parameters of a power-law plus BB fitting (power-law index and : Column 5 - Column 6), and the difference of parameters ( or , , RatioI or RatioII, and DICI or DICII) between these two models (Group I: Column 8 - Column 11 and Group II: Column 7- Column 9).
3.1 Parameter Evolutions
The evolutionary analysis is performed on the bins that satisfy the aforementioned criteria (DIC 0 and 20). We present temporal evolution of the spectral parameters ( and ) and the energy flux (erg cm*-2s-1*) from Figures 1-3 for the Group I bursts, along with their GBM light curves.
The comparison of parameters show that is systemically harder333Note that a harder is defined as \Delta$$\alpha$$>0 ( index increases) and a smaller is defined as \Delta$$E_{\rm c}$$<0 ( value decreases). (Figure 1), and is significantly smaller (Figure 2) in the CPL model than that in the CPL+BB model. There is no obvious difference for the temporal evolution of the energy flux fitted by different models for all the cases (Figure 3). Besides, GRB 081224, GRB 090719, GRB 100707, and GRB 190114C present very hard spectra, in which the majority of the indices are beyond the synchrotron limit (Preece et al., 1998). This is in agreement with the previous results where the hard indices are consistent with the thermal origin. Furthermore, generally can be softer after adding a thermal component, even crossing the synchrotron limit in GRB 190114C. For this type of the spectral evolution, we find most of them exhibit the hard-to-soft pattern, both in - and -evolution.
To compare the results between different bursts and to investigate the difference quantitatively, we further calculate the difference of the parameters ( and ), as shown in Figure 9. To have a global view on the difference, we plot the distributions of parameters (top panels of Figure 9). For , one has =-0.140.28; For , we get log=2.420.68. These results indicate that the spectral parameters are prominently changed. The distribution of the energy flux shows two peaks, with the first dominant one around 310*-6*, and the second smaller one peaks at 10*-4*. Both the CPL and CPL+BB models exhibit similar behaviors. The majority of is below 0 and is above 0, which are consistent with the above results (see bottom panels of Figure 9). To determine the prominence of the thermal component, we also calculate the ratio (/) between the thermal flux and the total flux (see bottom panels of Figure 9). We find the ratio varies from burst to burst, and within a burst, with the range from 0.2 % to 70%. The results indicate that some bursts (e.g. GRB 100724B) present no obvious evolution of the ratio, while other bursts present dramatically evolution within the burst (e.g. GRB 100707).
To denote the interesting results shown above, we use a cartoon picture (Figure 10) to vividly demonstrate why hardens and gets smaller if ignoring the contribution of the thermal component—namely, the difference of and between the CPL+BB to CPL-alone fittings. We take the typical observed parameters (e.g., Preece et al., 2000; Ryde & Pe’er, 2009) and the same normalization: =1000 keV, =-1, =150 keV. As seen in the picture, the BB component is strong. It raises the shape and shifts the peak energy () to the left. The stronger the BB emission, the harder the and the smaller the become. Typically, the values of the CPL model fall in between the peak of BB emission ( 2.8) and of the CPL+BB model. If the BB emission is extremely strong, can be even smaller than the peak of BB emission, but must be greater than the temperature of the BB.
In order to test our cartoon model (Figure 10), one time bin with the biggest DIC (or the highest thermal ratio) is used to present the observed spectral variation between the models. The results are shown in Figure 11. The BB temperature ; the of CPL; and CPL+BB for GRB 110721A are 31.24 keV, 398.09 keV, and 943.05 keV, respectively. The peak of BB emission, (BB), is 87.47 keV (2.8 ). Therefore, we find (BB)(CPL)(CPL+BB). The index derived from the CPL model in this time bin is -0.90, which is harder than that from the CPL+BB model (-1.08).
Likewise, the same results are also found in other cases. For GRB 081224, (BB)=53.78 keV<$$E_{\rm c}(CPL)=222.28 keV<$$E_{\rm c}(CPL+BB)=287.38 keV; (CPL)=-0.57 harder than (CPL+BB)=-0.66. For GRB 090719, (BB)=86.36 keV<$$E_{\rm c}(CPL)=173.84 keV<$$E_{\rm c}(CPL+BB)=205.83 keV; and (CPL)=-0.41 harder than (CPL+BB)=-0.48. For GRB 100707, (BB)=233.21 keV>$$E_{\rm c}(CPL)=
213.50 keV<$$E_{\rm c}(CPL+BB)=700.53 keV; (CPL)=0.39 is harder than (CPL+BB)=-0.16. Note that here, is smaller than the peak of the BB temperature. This is because the thermal component in this time bin is very strong, with the ratio of 30%, which is much higher than the typical value of the observation. For GRB 100724B, (BB)=73.84 keV<$$E_{\rm c}(CPL)=444.63 keV<$$E_{\rm c}(CPL+BB)=554.95 keV; (CPL)=-0.81 is harder than (CPL+BB)=-0.84. For GRB 190114C, (BB)=312.59 keV<$$E_{\rm c}(CPL)=520.86 keV<$$E_{\rm c}(CPL+BB)=717.56 keV; (CPL)=-0.49 is harder than (CPL+BB)=-0.71.
3.2 Global Parameter Relations
Based on our findings that the addition of the BB component changes the parameters, like and , while the flux remains constant, we want to check how those parameters affect the relations of , , and usually found in GRBs. We assume that the parameters—namely , , and flux—are related with each other by power-laws444Here, note that and relations are denoted in semi-log space and in log-log space. (e.g., Li et al., 2019). For the relation, since remains about constant and becomes harder, the relation will shifts toward the right (see the arrows marked in Figure 4) but with almost the same slope. For the relation, since remains about constant and tends to be smaller, the relation will moves toward the left (see the arrows marked in Figure 5) still with a same slope. For the relation, since both and will change, so the case could be more complicated. Generally speaking, the relation will move toward the top left direction (see the arrows marked in Figure 6), and the slope could also be changed with all possibilities (greater, less, and the same). On the other hand, stronger thermal components will results in greater and changes, leading to more significant changes of the global parameter relations.
Figures 4 to 6 show three plots of parameter pairs (also see the middle panels of Figure 9 for the global sample): , and . It is observed that in the high-significance cases, 20. The majority of cases in both and exhibit monotonous positive relations, but the relations are shifted. The relation displays a more complicate behavior (see Figure 6), because both and are altered. The observations, therefore, are self-similar to the picture as described by the cartoon (Figure 10).
Two ‘ideal’ cases can be used to the better demonstration of the evolutionary properties of the parameters: GRB 190114C (the burst has a strong thermal emission) and GRB 100707 (the burst has a dramatic thermal evolution). Figure 9 shows the temporal evolution of the flux ratio. Within Group I, GRB 190114C has particularly significant thermal emission. It owns the highest averaged ratio of 30%, and all the time-resolved ratios are greater than 0.1 (marked with a dashed line), which is much higher than other bursts with typical thermal ratios of -. GRB 100707 has the most obvious variation of a thermal ratio within a burst. Its ratios are very high in the early time but decrease fast with time. Correspondingly, its spectral parameters evolve significantly from the early time to the late time. derived from the CPL is softer than that from the CPL+BB, with a range much higher than the late time. The CPL and CPL+BB fittings give a significantly diverse in the early time but a similar value in the late time. Both and evolve consistently with the description shown in the cartoon (Figure 10).
3.3 The Results in Thermal-dominated Case
The temporal evolution of parameters for the thermal-dominated cases (Group II) with its differences are shown in Figure 7. (Group I) is found to be much greater than (Group II). This is consistent with the fact that a narrower spectrum leads to more obvious results. The parameters relations for our Group II bursts are presented in Figure 8. The relation has a marked tendency of moving to the left, which is consistent with the results of Group I. In Figure 12, we present the observed spectral variation between the CPL and the PL+BB models. For GRB 090902B, (BB)=640.1 keV<$$E_{\rm c}(CPL)=2732.34 keV; (CPL)=-1.14 is much harder than the index (PL+BB)=-1.74. Similarly, the same results are also found in GRB 160107, =32.8 keV<$$E_{\rm c}(CPL)=492.5 keV; (CPL)=-1.72 is harder than the index (PL+BB)=-1.88.
The results indicate that the two Groups bursts share the same results. The difference is that the magnitude of parameter variation for Group II is much higher than Group I.
4 Conclusion
In this paper, the Fermi-GBM bursts, of which the thermal components significantly contribute to the observed spectra as reported in previous literature, are analyzed and confirmed by our Bayesian analysis. Our samples are divided in two groups depending on whether the thermal component is dominant or not. We investigated how the thermal components affect the nonthermal spectral parameters by comparing the spectral parameters between the CPL+BB (or PL+BB) model and CPL-alone models. Our analysis supports the fact that if ignoring the strong BB component, the spectral parameters from the CPL-alone fitting model are misleading. We discussed, in detail, on two ideal cases: GRB 100707 and GRB 190114C. All of their characteristics of the spectral evolution comply with the paradigm described in the cartoon (Figure 10).
In summary, we reach the following conclusions:
- •
Low-energy photon index : softens when BB component is introduced, and such a characteristic is particularly evident in Group II. For Group I, \Delta$$\alpha=0.080.15. For Group II, \Delta$$\alpha=-0.540.27. For the global sample, \Delta$$\alpha=-0.140.28.
- •
Peak energy : obtained from CPL only is significantly less than that of the CPL+BB model but is typically greater than the peak of the BB temperature ( and 2.8), with log \Delta$$E_{\rm c}=2.420.68.
- •
Parameters relations: both the and relations are generally present the same slope with an offset, whereas - relation is possibly altered in all cases (the slope increases, or decreases, or remains unchanged).
- •
The magnitude of change of spectral parameters ( and , goes to harder and goes to smaller) are positively monotonous correlated with the intensity () of the thermal components.
- •
In GRB 190114C, a majority of indices are across the synchrotron limit (-2/3) with the hard-to-soft trend when BB component is introduced.
We conclude that if the thermal component is present and strong in a GRB, the spectral parameters from the fitting adopting only the nonthermal model may deviate from parameters from the proper fitting considering the nonthermal model with an additional thermal component. We caution that the existence of the thermal component shall be duly examined during the GRB spectral analysis.
I appreciate to the referee for the constructive report. I would like to wish thank to Prof. Felix Ryde, and Dr. Yu Wang for useful discussions. I particularly thank to the support from Prof. Remo Ruffini. This research made use of the High Energy Astrophysics Science Archive Research Center (HEASARC) Online Service at the NASA/Goddard Space Flight Center (GSFC). Part of this work made use of our personal Python library.
A0.1 Figures
It is important to address the questions of whether or not the results obtained from various fitting tools and binning techniques are consistent with each other. We, therefore, use GRB 081224 as an example to investigate the difference of evolution of parameters and the relation of parameters by the 3ML and the RMFIT (version 3.3pr7) software packages, and the and the BBloacks techniques. To compare the results between 3ML and RMFIT, we adopt the same time bin information based on the BBloacks method, which is then applied to both the 3ML and the RMFIT tools. Based on the 3ML tool, we also compare the results from different time bin techniques (S and BBloacks) and different values (=30 and =40). Temporal evolution of parameters ( and ) and the relation of parameters (-) are presented in Figure A1 and A2, respectively. We find that they all generally present the same results. The slopes of the parameter relation are also almost the same.
A0.2 Tables
Tables A2-A8 include the results of the time-resolved spectra fits for five Group I bursts (GRB 090719, GRB 100707, GRB 100724B, GRB 110721A, and GRB 190114C) and two Group II bursts (GRB 090902B and GRB 160107).
The reference list from the paper itself. Each links out to its DOI / PubMed record.
- 1Aksenov et al. (2013) Aksenov, A. G., Ruffini, R., & Vereshchagin, G. V. 2013, MNRAS, 436, L 54, doi: 10.1093/mnrasl/slt 112 · doi ↗
- 2Axelsson et al. (2012) Axelsson, M., Baldini, L., Barbiellini, G., et al. 2012, Ap J, 757, L 31, doi: 10.1088/2041-8205/757/2/L 31 · doi ↗
- 3Band et al. (1993) Band, D., Matteson, J., Ford, L., et al. 1993, Ap J, 413, 281, doi: 10.1086/172995 · doi ↗
- 4Basak & Rao (2013) Basak, R., & Rao, A. R. 2013, Ap J, 768, 187, doi: 10.1088/0004-637X/768/2/187 · doi ↗
- 5Bégué et al. (2013) Bégué, D., Siutsou, I. A., & Vereshchagin, G. V. 2013, Ap J, 767, 139, doi: 10.1088/0004-637X/767/2/139 · doi ↗
- 6Beloborodov (2009) Beloborodov, A. M. 2009, Ap J, 703, 1044, doi: 10.1088/0004-637X/703/1/1044 · doi ↗
- 7Beloborodov (2010) —. 2010, MNRAS, 407, 1033, doi: 10.1111/j.1365-2966.2010.16770.x · doi ↗
- 8Beloborodov (2011) —. 2011, Ap J, 737, 68, doi: 10.1088/0004-637X/737/2/68 · doi ↗