Study of muon pairs in hadronic events with bottom tag using L3 data recorded near the Z resonance
Thomas Hebbeker, Stefan Roth

TL;DR
This paper analyzes muon pairs in hadronic events with bottom quark tags using L3 data near the Z resonance, comparing observed di-muon mass spectra to Monte Carlo simulations to investigate potential anomalies.
Contribution
It provides a measurement of the di-muon mass spectrum with bottom tags in L3 data and compares it to theoretical predictions, extending previous ALEPH findings.
Findings
No significant excess near 30 GeV observed in L3 data
Comparison with Monte Carlo predictions shows consistency within uncertainties
Results contribute to understanding di-muon spectra in b-quark events
Abstract
A recent publication based on ALEPH data taken near the Z resonance reports an excess, near 30 GeV, in the di-muon mass spectrum for events containing b quarks. In this paper we measure the di-muon mass spectrum for L3 data with a bottom tag, recorded in the years 1994 and 1995 at the LEP collider at CERN, and compare it to Monte Carlo predictions.
Click any figure to enlarge with its caption.
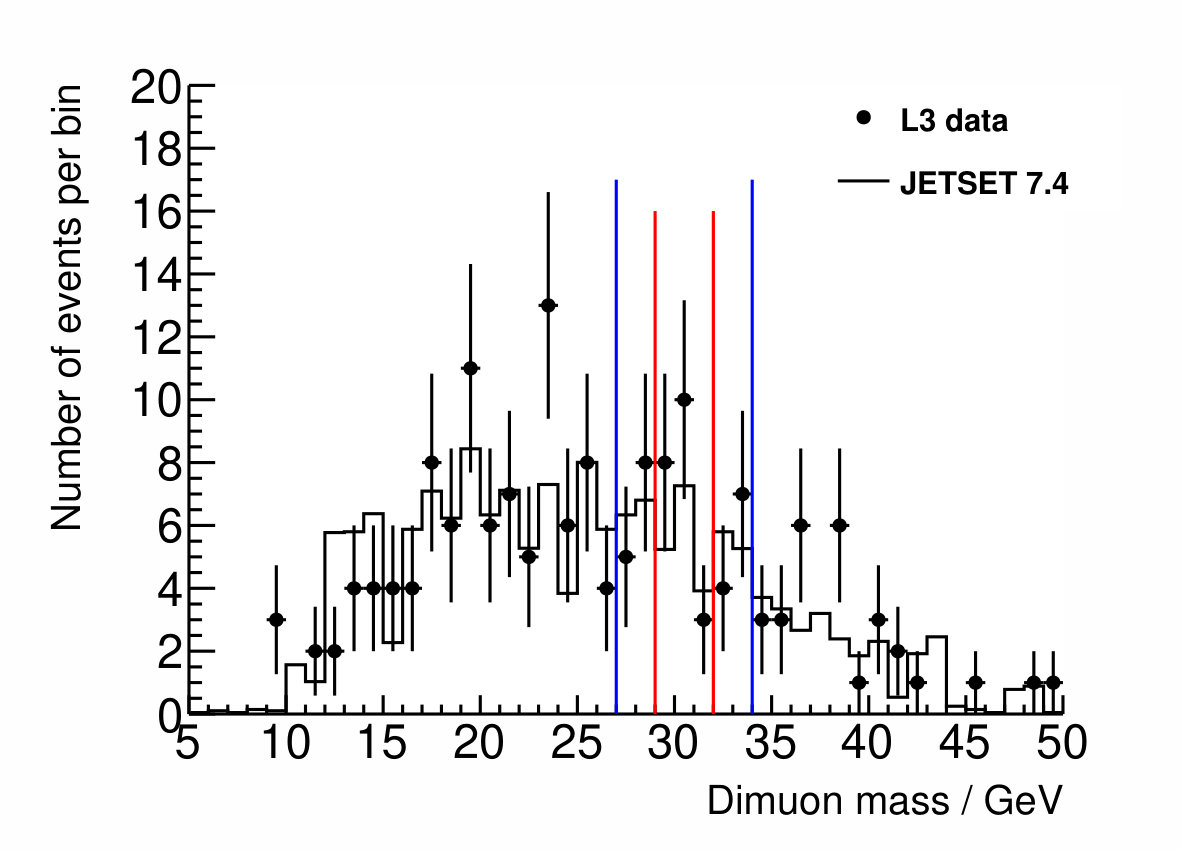 Figure 1
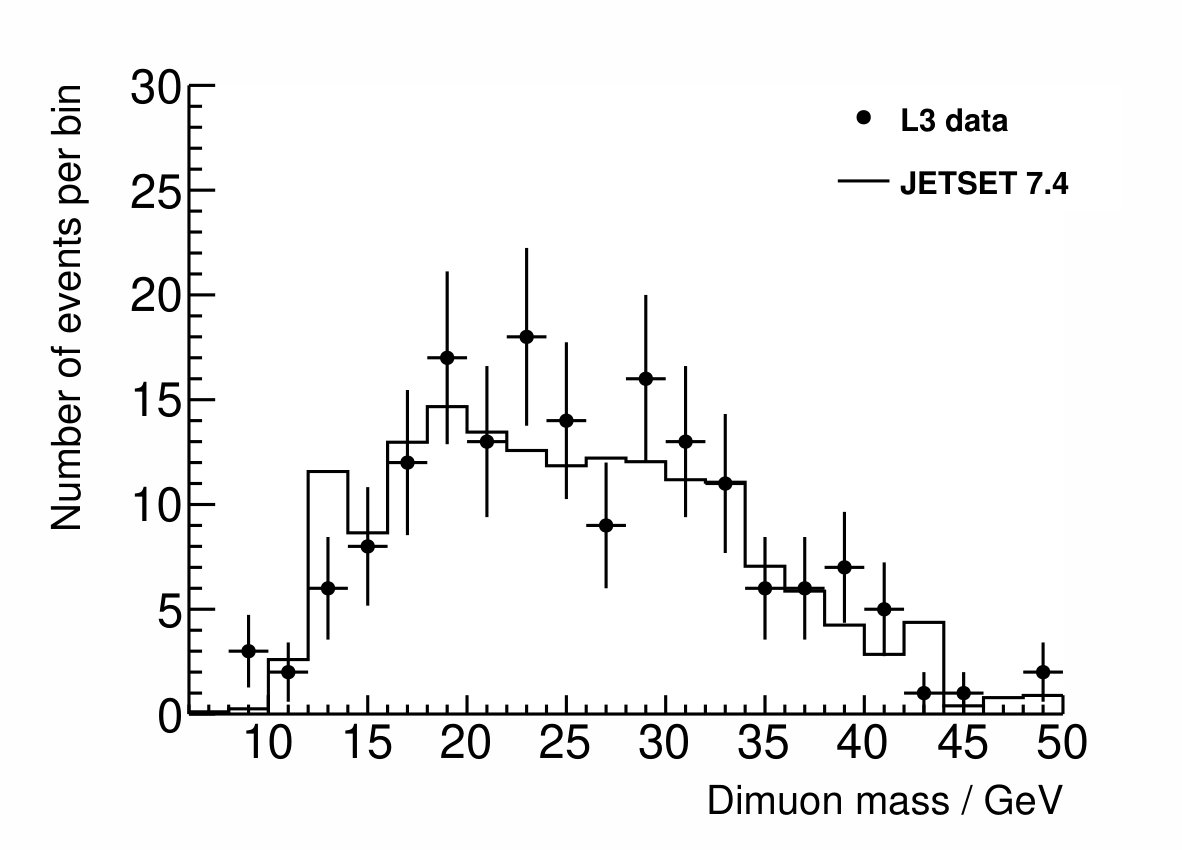 Figure 2
Peer Reviews
No public reviews on file for this paper yet. If you reviewed it on a platform where reviews are public (OpenReview, ICLR, NeurIPS, ICML), you can paste yours below so the community can read it here.
Videos
No videos yet. Explain this paper in a talk, walkthrough, or lecture? Add one.
Taxonomy
TopicsParticle physics theoretical and experimental studies · Quantum Chromodynamics and Particle Interactions · High-Energy Particle Collisions Research
{Authlist} Thomas Hebbeker\InstfootiiiaRWTH Aachen University, Physics Institute III A Stefan Roth\InstfootiiibRWTH Aachen University, Physics Institute III B
A recent publication based on ALEPH data taken near the Z resonance reports an excess, near 30 GeV, in the di-muon mass spectrum for events containing b quarks. In this paper we measure the di-muon mass spectrum for L3 data with a bottom tag, recorded in the years 1994 and 1995 at the LEP collider at CERN, and compare it to Monte Carlo predictions.
1 Introduction
Recently, ALEPH LEP collision data were reanalyzed [1]. In the event sample recorded at, or close, to the Z resonance in the years between 1992 and 1995 the opposite sign dimuon mass spectrum was investigated in hadronic final states with a bottom tag. An excess of events was reported at , with an intrinsic peak width of , relative to an assumed smooth background, with a significance of 3 after correcting for the look-elsewhere-effect.
Using archived L3 events, we investigate if a similar excess can be seen in the L3 data set recorded around the Z resonance. Since the detectors ALEPH [2] and L3 [3] are different (muon angular acceptance, muon efficiency at low momenta, bottom tagging etc), we can not make a direct comparison between the dimuon mass spectra measured with the ALEPH and L3 analyses. Nevertheless, we implement as far as possible similar selection cuts as used for the ALEPH data [1] for the L3 event selection. We have fixed all selection criteria and the search regions before inspecting the final dimuon mass distribution. We have not performed any optimization or variation of cuts, therefore the results presented here are free of look-elsewhere effects. The L3 data are not compared to a model-dependent phenomenological background curve as done in Ref. [1], but, rather, to a Standard Model Monte Carlo prediction.
2 Data set and Event selection
We use the data recorded in 1994 and 1995, at center of mass energies between and , corresponding to an integrated luminosity of . Earlier data could not be used because the L3 silicon vertex detector [4] was only installed in 1993 and is needed for bottom tagging. Note that, for the 1995 data set, the L3 muon endcap detectors [5] were available and are used in this analysis as well.
The events were selected by making the following requirements:
- •
at least two reconstructed muon candidates.
- •
hadronic activity: number of calorimeter clusters [6].
- •
no huge momentum imbalance: [1], where the sum runs over all calorimeter clusters and all muons.
- •
bottom tag, [7].
is a weighted discriminant, combining the probabilites for tracks to originate from the primary vertex [7]. The cut value was chosen such that the contamination of light quark events (u,d,s,c) in the final event sample is predicted to be as low as by the Monte Carlo simulation.
The muon candidates have to fulfill the following criteria:
- •
number of measured segments in the bending plane of the the central region plus number of segments in the endcap regions of the muon detector equal to two or more.
- •
at least one z measuring segment (coordinate along the beam) in the muon detectors.
- •
transverse momentum with respect to the beam axis of [1].
- •
distance of closest approach to the nominal vertex position in the plane perpendicular to the beam less than .
- •
distance to the nominal vertex position along the beam axis less than .
The last two cuts are chosen such that dimuon events near the Z mass are accepted with greater than probability. Most muons from bottom hadron decays survive these vertex cuts because the average decay length is well below in that case. If more than two muon candidates remain, we select the two having the highest energy. If their charges are not of opposite sign, the event is rejected. In total we select 227 events. We have verified from the angular distribution of the muons that the contamination of cosmics is negligible in this data set.
3 Standard Model background
In the Standard Model the most important sources of bottom-tagged di-muon events are, by far, processes of type
[TABLE]
The muons are produced mostly in semileptonic bottom decays. The Monte Carlo generator JETSET 7.4 [8] was used to generate events of type
[TABLE]
where stands for all quark flavors accessible at LEP energies. These events were subsequently passed through the full L3 detector simulation. The simulated events were reconstructed in the same way as the measured events. The total Monte Carlo event statistics are 3.5 times higher than for the L3 data sample.
4 Results
In this section we compare the number of measured and expected events in two search regions in the distribution of the dimuon mass :
- •
peak region:
This mass window is approximately centered on the ALEPH peak position () and the width is about the width of the ALEPH peak () [1].
- •
signal region:
This interval is also centered on the ALEPH peak position, with a width that is about twice the width of the ALEPH peak.
The dimuon invariant mass resolution was studied with the L3 Monte Carlo event sample. Near it is approximately ( = relative).
Figure 1 shows the opposite sign dimuon invariant mass spectra obtained from L3 data and from the JETSET Monte Carlo simulation, in the mass window (170 events). We use exactly the same binning as employed for the ALEPH analysis [1] (Figure 7). Figure 2 displays the same data, though with a doubled bin width in order to reduce the statistical fluctuations.
The Monte Carlo histogram is normalized to the dimuon mass distribution measured from L3 data. The signal region has been excluded in the normalization calculation. The Monte Carlo needs to be scaled up by a factor of 1.2, relative to the normalization according to luminosity. Overall the measured opposite charge dimuon mass distribution is well reproduced by the Standard Model Monte Carlo.
In Figure 1 both the signal region and the peak region are marked with blue and red vertical lines. Integrating over the corresponding bins and computing the difference: L3 data - Monte Carlo prediction, we obtain the following results:
[TABLE]
Only statistical uncertainties are given.
5 Summary
We have analyzed archived L3 data recorded near the Z peak. In the oppositely charged dimuon spectrum, measured for hadronic events with a bottom tag, we investigated the region around the peak observed near in ALEPH data [1]. We find a slight excess in the data compared to the Monte Carlo prediction, but the deviation of the measured event yield from the Standard Model prediction is not statistically significant (about one standard deviation).
6 Acknowledgements
We thank Arno Heister for interesting discussions and Shawn Zaleski for useful comments on the paper draft.
The reference list from the paper itself. Each links out to its DOI / PubMed record.
- 1[1] A. Heister, Observation of an excess at 30 Ge V in the opposite sign di-muon spectra of Z → b b ¯ + X → 𝑍 𝑏 ¯ 𝑏 𝑋 Z\to b\,\bar{b}+X events recorded by the ALEPH experiment at LEP, ar Xiv:1610.06536 [hep-ex] version 8.
- 2[2] The ALEPH Collaboration, D. Decamp et al, ALEPH: A detector for electron-positron annnihilations at LEP, Nucl. Instrum. Meth. A 294 (1990) 121, and A 303 (1991) 393.
- 3[3] The L 3 Collaboration, B. Adeva et al, The Construction of the L 3 experiment, Nucl. Instrum. Meth. A 289 (1990) 35.
- 4[4] The L 3 SMD Collaboration, M. Acciarri et al, The L 3 silicon microvertex detector, Nucl. Instrum. Meth. A 351 (1994) 300.
- 5[5] The L 3 F/B Muon Group, A. Adam et al, The Forward muon detector of L 3, Nucl. Instrum. Meth. A 383 (1996) 342.
- 6[6] The L 3 Collaboration, M. Acciarri et al, Measurements of cross sections and forward-backward asymmetries at the Z resonance and determination of electroweak parameters, Eur. Phys. J. C 16 (2000) 1.
- 7[7] The L 3 Collaboration, P. Achard et al, Study of Hadronic Event Shape in Flavour Tagged Events in e + e − superscript 𝑒 superscript 𝑒 e^{+}e^{-} Annihilation at s 𝑠 \sqrt{s} = 197 Ge V, PMC Phys. A 2 (2008) 6.
- 8[8] T. Sjöstrand, High-energy physics event generation with PYTHIA 5.7 and JETSET 7.4, Comp. Phys. Comm. 82 (1994) 74.