GBTrans: A commensal search for radio pulses with the Green Bank twenty metre telescope
Golnoosh Golpayegani, Duncan R. Lorimer, Steven W. Ellingson, Devansh, Agarwal, Olivia Young, Frank Ghigo, Richard Prestage, Kaustubh Rajwade, Maura, A. McLaughlin, Michael Mingyar

TL;DR
GBTrans is a real-time system using the Green Bank 20-m telescope to search for fast radio bursts, detecting known pulsars but no new FRBs over 503 days, and constraining the FRB fluence distribution.
Contribution
This paper introduces GBTrans, a novel real-time FRB search system operating with a small radio telescope, and provides constraints on the FRB fluence distribution.
Findings
Detected pulses from four known pulsars.
No new FRBs detected in 503 days.
Constrained the FRB fluence index to less than 2.5.
Abstract
We describe GBTrans, a real-time search system designed to find fast radio bursts (FRBs) using the 20-m radio telescope at the Green Bank Observatory. The telescope has been part of the Skynet educational program since 2015. We give details of the observing system and report on the non-detection of FRBs from a total observing time of 503 days. Single pulses from four known pulsars were detected as part of the commensal observing. The system is sensitive enough to detect approximately half of all currently known FRBs and we estimate that our survey probed redshifts out to about 0.3 corresponding to an effective survey volume of around 124,000~Mpc. Modeling the FRB rate as a function of fluence, , as a power law with , we constrain the index at the 90% confidence level. We discuss the implications of this result in the context of constraints from other…
Click any figure to enlarge with its caption.
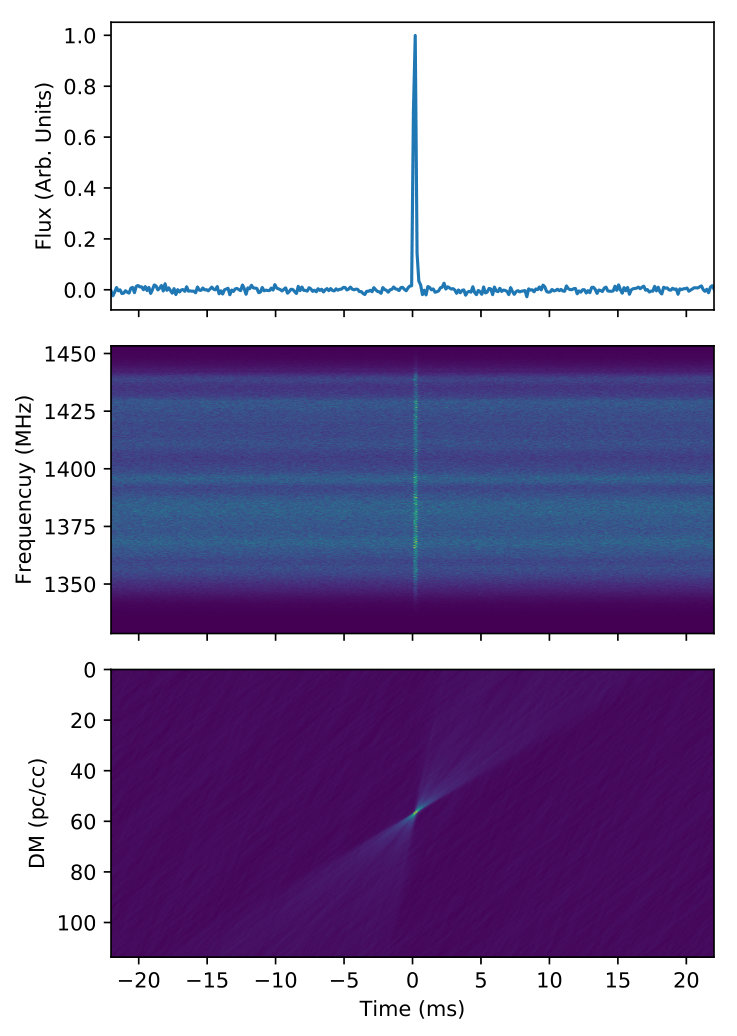 Figure 1
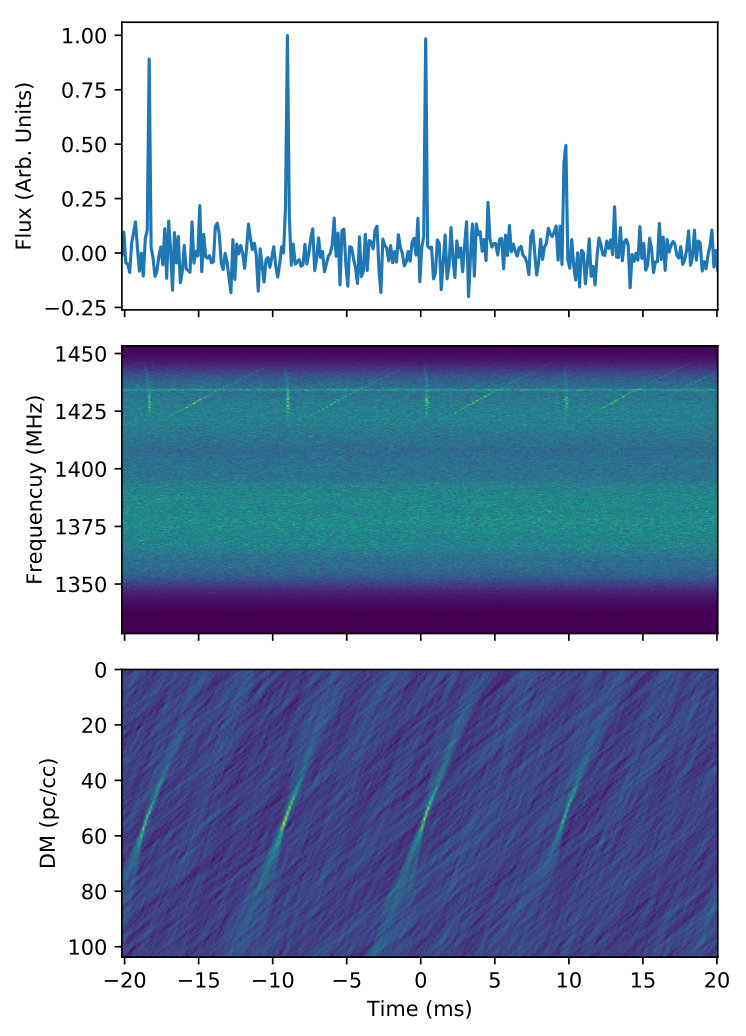 Figure 2
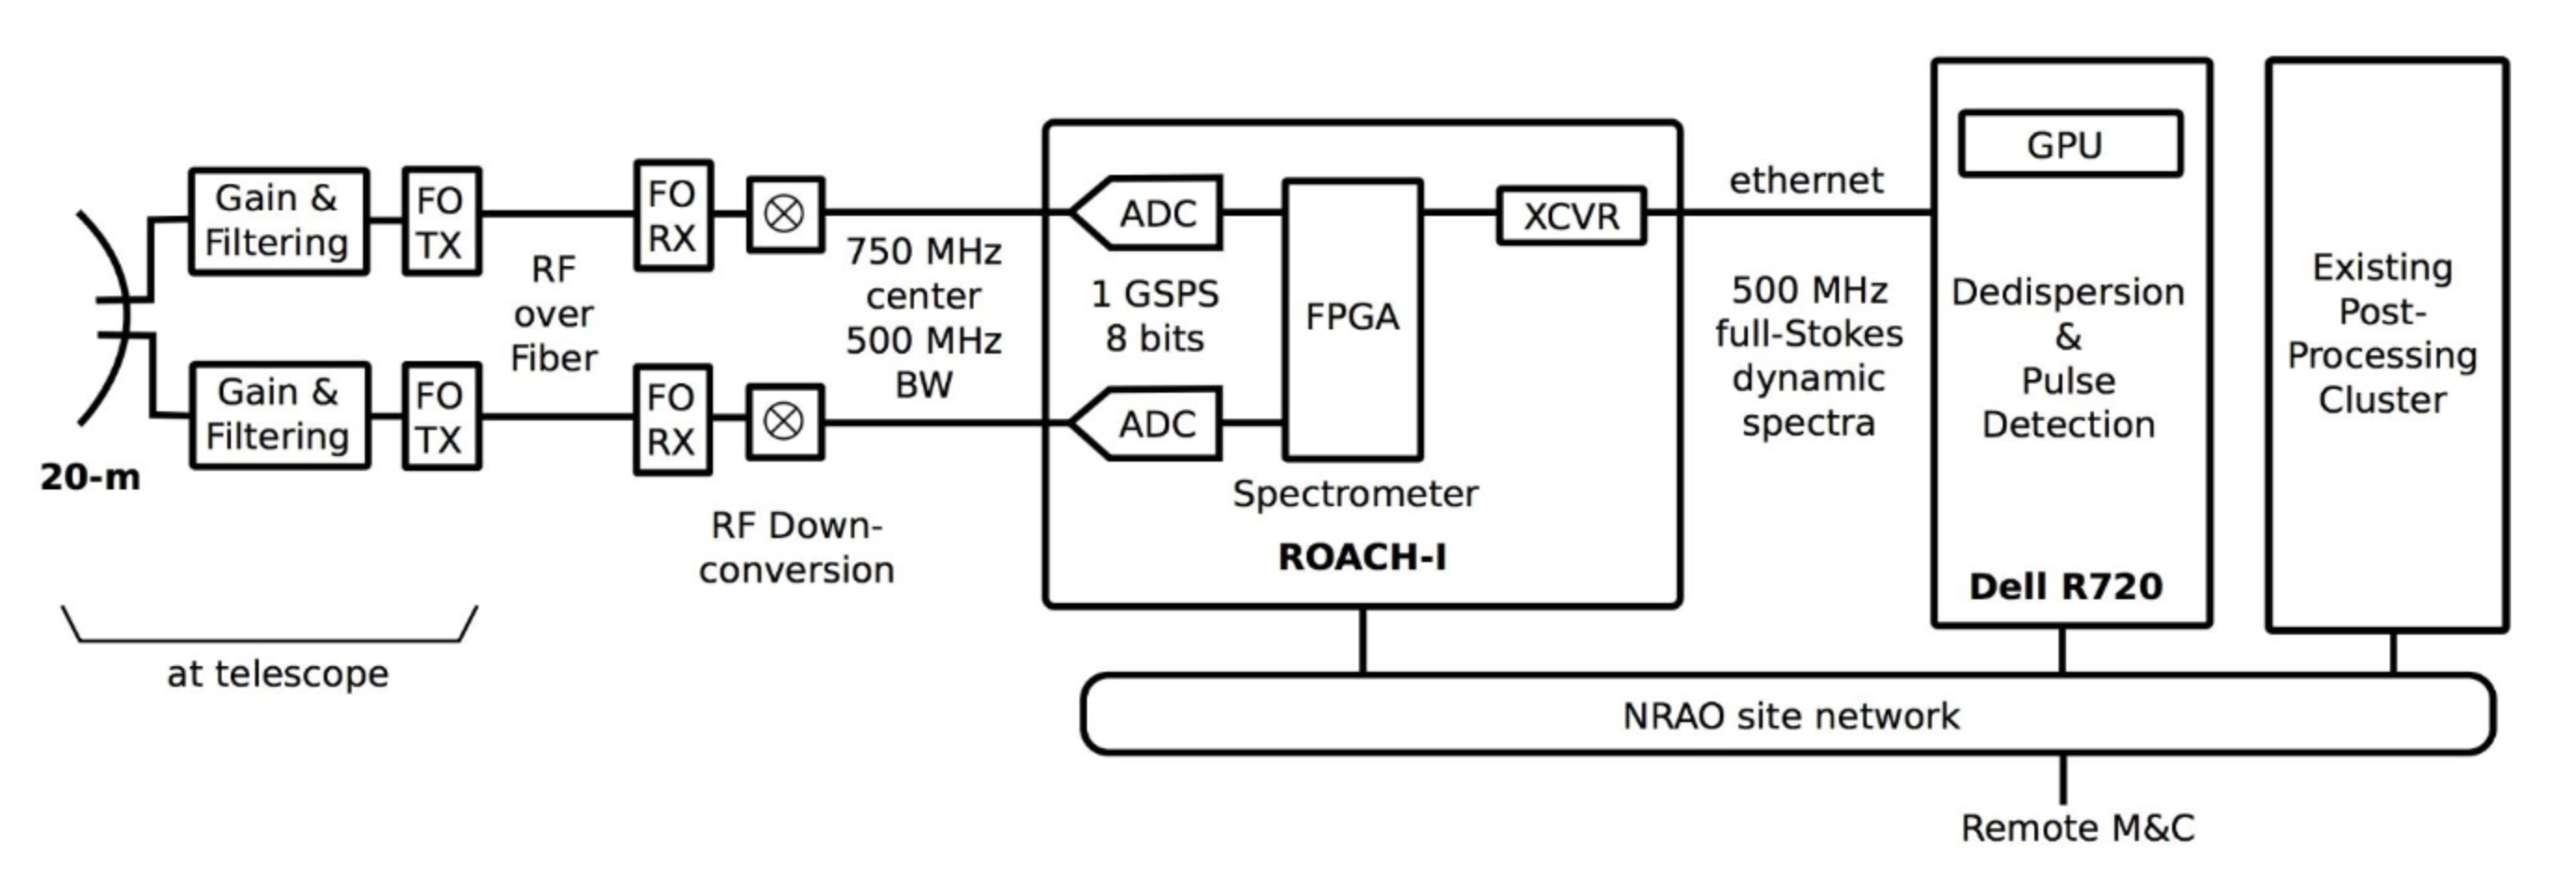 Figure 3
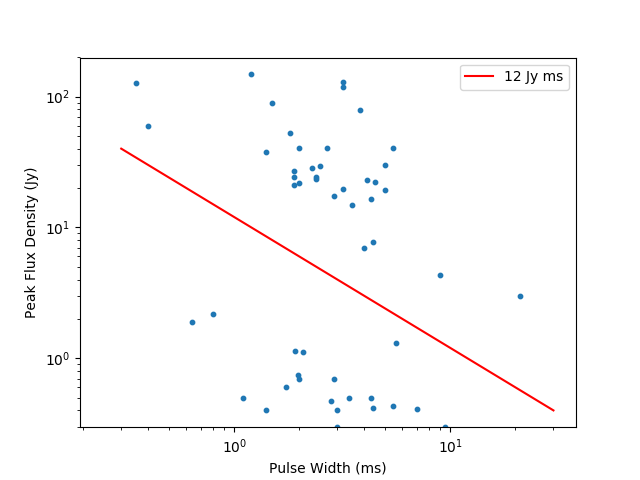 Figure 4
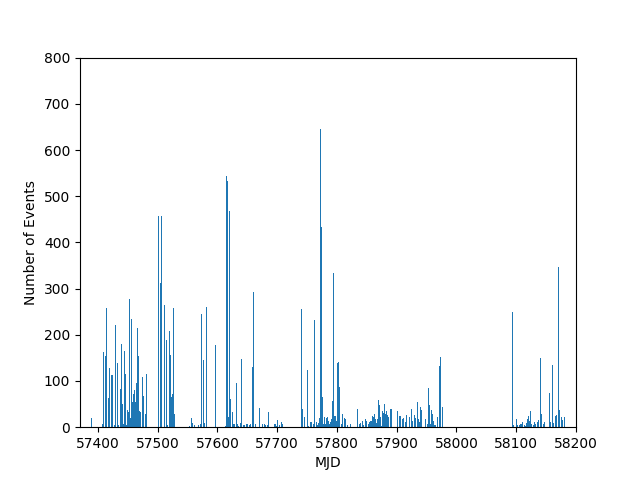 Figure 5
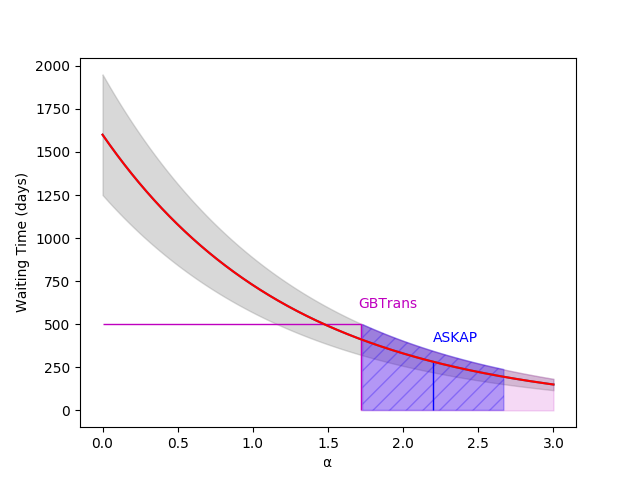 Figure 6
| PSR | S1400 | DMcat | Npulses | S/Nmax | |
|---|---|---|---|---|---|
| (mJy) | (cm–3 pc) | ||||
| J0332+5434 | |||||
| J0534+2200 | |||||
| J0835–4510 | |||||
| J1644–4459 | |||||
| J2022+5154 |
| Source count index, | Reference |
|---|---|
| Macquart & Ekers (2018) | |
| Bhandari et al. (2018) | |
| (ASKAP) | James et al. (2019) |
| Shannon et al. (2018) | |
| GBTrans — this paper | |
| (Parkes) | James et al. (2019) |
| 0.91 | Lawrence et al. (2017) |
| 0.8 – 1.7 | Oppermann et al. (2016) |
| Caleb et al. (2016) | |
| 0.5 – 0.9 | Vedantham et al. (2016) |
| Li et al. (2017) |
Peer Reviews
No public reviews on file for this paper yet. If you reviewed it on a platform where reviews are public (OpenReview, ICLR, NeurIPS, ICML), you can paste yours below so the community can read it here.
Videos
No videos yet. Explain this paper in a talk, walkthrough, or lecture? Add one.
GBTrans: A commensal search for radio pulses with the Green Bank twenty metre telescope
Golnoosh Golpayegani1,2, Duncan R. Lorimer1,2, Steven W. Ellingson 3, Devansh Agarwal1,2, Olivia Young1,2, Frank Ghigo 4, Richard Prestage1,2,Kaustubh Rajwade5, Maura A. McLaughlin1,2 and Michael Mingyar1,2
1Department of Physics and Astronomy, West Virginia University, Morgantown, WV 26505, USA
2Center for Gravitational Waves and Cosmology, West Virginia University, Chestnut Ridge Research Building, Morgantown, WV 26505, USA
3Bradley Department of Electrical and Computer Engineering, Virginia Tech, Blacksburg, VA 24061, USA
4Green Bank Observatory, 155 Observatory Rd, Green Bank, WV 24944, USA
5Jodrell Bank Centre for Astrophysics, University of Manchester, Oxford Road, Manchester M13 9PL, United Kingdom E-mail: [email protected]
(Accepted 2019 August 22. Received 2019 August 19; in original form 2019 May 01)
Abstract
We describe GBTrans, a real-time search system designed to find fast radio bursts (FRBs) using the 20-m radio telescope at the Green Bank Observatory. The telescope has been part of the Skynet educational program since 2015. We give details of the observing system and report on the non-detection of FRBs from a total observing time of 503 days. Single pulses from four known pulsars were detected as part of the commensal observing. The system is sensitive enough to detect approximately half of all currently known FRBs and we estimate that our survey probed redshifts out to about 0.3 corresponding to an effective survey volume of around 124,000 Mpc3. Modeling the FRB rate as a function of fluence, , as a power law with , we constrain the index at the 90% confidence level. We discuss the implications of this result in the context of constraints from other FRB surveys.
keywords:
radio continuum: transients – methods: observational – methods: data analysis
††pubyear: 2019††pagerange: GBTrans: A commensal search for radio pulses with the Green Bank twenty metre telescope–References
1 Introduction
Pulsar searches and their need for high time and frequency resolution have opened new windows on the transient Universe. The best example of this so far is the discovery of fast radio bursts (FRBs; Lorimer et al., 2007; Thornton et al., 2013). FRBs are very bright transient radio pulses that occur on short (ms) timescales, but emit about as much energy as the Sun produces in about a month. However, for the brightest known FRBs this number is about a day. At the time of writing, ninety FRBs have been published111http://www.frbcat.org (for an up-to-date list, see Petroff et al., 2016). Although this sample is currently not large enough to unambiguously characterize their origin and emission mechanism, it is clear that they form a cosmological population (see, e.g., Caleb et al., 2016; Tendulkar et al., 2017).
Though most FRBs have been detected as one-off events, a few of them have shown repetitions (Spitler et al., 2016; CHIME/FRB Collaboration et al., 2019b; The CHIME/FRB Collaboration et al., 2019). FRB 121102 was localized to a star-forming region in a dwarf galaxy with redshift 0.19, using the Karl G. Jansky Very Large Array (VLA) acting jointly with single-dish observations using the 305-m William E. Gordon Telescope at the Arecibo Observatory (Chatterjee et al., 2017).
Follow-up studies showed a large and variable rotation measure towards this source, suggesting that FRB 121102 is in an extreme and dynamic magneto-ionic environment. A neutron star origin is consistent with both such an environment and the short burst durations (Michilli et al., 2018).
The second repeating FRB, 180814.J0422+73, was recently discovered by CHIME (Canadian Hydrogen Intensity Mapping Experiment CHIME/FRB Collaboration et al., 2019b). The CHIME collaboration reported the detection of six repeat bursts from FRB 180814.J0422+73 among 13 detected FRBs during the telescope’s pre-commissioning phase (CHIME/FRB Collaboration et al., 2019a). Most recently, CHIME discovered eight repeating FRBs, varying from two repeating bursts to ten (The CHIME/FRB Collaboration et al., 2019). The variety of these recently detected repeaters is suggestive of different environmental properties (e.g., larger burst widths) and emission mechanisms for the repeating FRBs. Further discoveries with CHIME and other instruments are greatly anticipated.
Besides FRB 121102, two other single FRBs were recently localized using interferometry: The Australian Square Kilometre Array Pathfinder (ASKAP) interferometer, was able to localize FRB 180924 to a position 4 kpc from the center of a luminous galaxy (Bannister et al., 2019). This sub-arcsecond localization allowed them to identify the massive host galaxy with the redshift of 0.3214. FRB 190523 was detected with the Deep Synoptic Array ten-antenna prototype (DSA-10), which consists of 4.5-m radio dishes separated by 6.75 m to 1300 m, located at the Owens Valley Radio Observatory. This FRB was also localized to a few-arcsecond region containing a single massive galaxy at a redshift of 0.66 which is the likely host galaxy of the burst (Ravi et al., 2019).
Over the past decade, many different hypotheses for the origin of FRBs have been suggested, from which some could be tested based on data from observed FRBs (Katz, 2016). The main proposed models include giant pulses from pulsars (Cordes & Wasserman, 2016; Lyutikov et al., 2016), magnetar giant flares (Nicholl et al., 2017; Metzger et al., 2017), merging or colliding neutron stars (Wang et al., 2016), neutron star collapse (Falcke & Rezzolla, 2014), interaction of a pulsar with its environment (Zhang, 2017), primordial black holes falling into neutron stars (Abramowicz et al., 2018), and coalescing white dwarf binaries (Kashiyama et al., 2013).
Many of the surveys carried out so far (Petroff et al., 2019, see their section 4.3 for a review) use telescopes with large collecting areas and high sensitivities, motivated by the relatively large flux densities of some FRBs (see, e.g., Shannon et al., 2018), we have developed a real-time FRB detector on the 20-m telescope at the Green Bank Observatory, taking advantage of the extensive sky coverage available (approximately 80% of the sky) and a large field of view of this smaller dish. This experiment, which we call GBTrans, is a synergistic effort partially supported from the Skynet Robotic Telescope Network Project222http://skynet.unc.edu. The 20-m telescope is also being used in a companion project (Gregg et al. 2019) which focuses on coordinated observations with the Neil Gehrels Swift Observatory. The plan for the rest of this paper is as follows. In §2, we describe the GBTrans system and detection pipeline. In §3, we summarize the observations carried out and present the results of the survey including detected single pulses and giant pulses from known pulsars and candidate astrophysical pulses. In §4 we explain the method we used to estimate the FRB rate and survey volume for this survey and possible explanations for our non-detection of FRBs so far and speculate on future developments, and finally, in §5, we draw conclusions and make suggestions for future work.
2 GBTrans description
The 20-m telescope at the Green Bank Observatory in Green Bank, WV, has been in operation since late 1994. Originally funded by the US Naval Observatory, it was part of the National Earth Orientation Service telescope network, and participated in a global program of Earth Orientation VLBI (very long baseline interferometry) measurements in cooperation with the International Earth Rotation Service, and with the NASA Space Geodesy program. Following a shut down in 2000, the telescope was restored, automated, and made accessible as part of Skynet (Smith et al., 2016; Hosmer et al., 2013). The main receiver currently in use operates at a central frequency of 1.4 GHz and provides a cryogenically cooled dual-polarization channel input for pulsar and spectral line work. Although there was some variation due to occasional cryogenics failures as well as telescope time spent on bright sources, the typical system temperature was found to be 40 K. The observing bandwidth is 80 MHz, centred at 1400 MHz.
A block diagram summarising the signal path from the sky to the data acquisition system developed for GBTrans is shown in Fig. 1. The signals are down-converted to a centre frequency of 750 MHz and digitized at 1 GHz before being converted to incoherent fully-polarimetric dynamic spectra using a ROACH-I FPGA-based spectrometer. The spectrometer output is 2048 frequency channels with spectral resolution of 244 kHz and time resolution of s, represented as 8-bit integers for all four Stokes parameters. The resulting data stream is slightly greater than 500 Mb/s, including meta-data.
Real time analysis and detection is implemented on a GPU-equipped Dell R720 rack mount server using purpose-built software developed by Virginia Tech. The server consists of dual Intel Xeon E5-2640 2.5 GHz 6-core CPUs, 32 GB RAM, TB hot-pluggable hard drives, and an Nvidia Tesla K10 Graphics Processing Unit (GPU). Data analysis software is implemented in C and was developed to run on a Linux platform. The principal software components include a ring buffer, an executive processor, and a GPU-based processor. The ring buffer transfers data arriving synchronously from the spectrometer into shared memory, which allows the executive processor to operate asynchronously. The executive processor operates on arriving dynamic spectra in contiguous 13.1-s segments. Each segment is examined for data integrity (e.g., checking for correctly-ordered frame counters). As a diagnostic, spectra and total power for all four Stokes parameters are integrated over the segment and recorded.
We take the 13.1-s data segments and use a GPU to produce de-dispersed total power time series using a brute-force algorithm for 531 trial dispersion measures (DMs) spanning the range 0–9900 cm*-3* pc. Each time series is subsequently box-car averaged in powers of 2 to search for single-sample pulses with widths in the range 131 s to 268 ms. The resulting detection metrics are saved, and any data segments containing pulses with signal-to-noise (S/N) ratios exceeding 10 and DM trigger a data-preservation protocol which causes a block of data to be written which we henceforth refer to as an event. Each event consists of the raw segment of full-Stokes data as well as all available meta-data which is saved on a post-processing cluster for long-term storage and follow-up analysis.
3 Observations and data processing
We have collected data with the aforementioned system from the beginning of December 2014 to the beginning of March 2018. Taking into account the days in which the system was down due to maintenance on the telescope or equipment failures, where no events were recorded, GBTrans was in operation for 503 days. Fig. 2 shows the distribution of events over the entire duration.
For each event, we applied a post-detection pipeline where the data were processed using the heimdall333https://sourceforge.net/projects/heimdall-astro single-pulse software package. The generated candidates were clustered using the “friends-of-friends” algorithm (Huchra & Geller, 1982) in which groups of events were identified with the same DM within a tolerance of 20 cm*-3* pc, a time of arrival within 32 raw samples, and associated with an event of the highest S/N and pulse width. The resulting candidates were then appended to the output list and tested against the following criteria: Pulse widths shorter than 33.5 ms and S/N above 10. For each event that met these constraints, a diagnostic plot was generated which contained the original dynamic spectrum, the de-dispersed dynamic spectrum using the DM at which the pulse was detected with the highest S/N, along with a frequency collapsed time series of the detection with the length equal to twice the DM-dependant delay time, and were inspected visually. These were reviewed and categorised into three classes: known pulsar, radio-frequency interference and unidentified single pulses (i.e. candidate FRBs). Five known pulsars were labelled as such by cross-correlating meta-data from the headers with the ATNF pulsar catalogue (Manchester et al., 2005)444http://www.atnf.csiro.au/research/pulsar/psrcat. The detection statistics for these pulsars are summarized in Table 1. The other two classes were reviewed and labelled manually. Although we did not detect any FRBs in this analysis, we did detect giant pulses from the Crab pulsar which will be published elsewhere as part of a dedicated study of the Crab. An example Crab giant pulse is shown in Fig. 3. Since L-band is more problematic in terms of RFI, a significant amount of RFI events were present in our candidate output plots. In particular, 25115 false positive events, excluding the single pulses from known sources were detected. Fig. 4. shows an exotic RFI candidate example caused by a frequency-modulation continuous wave radar.
4 Discussion
4.1 Expected FRB Rate
When this experiment was being designed in 2013, the all-sky FRB rate, , was thought to be much higher than current estimates which are now based on larger samples of FRBs. Recent studies (see, e.g., Lawrence et al., 2017) now show that the event rate is almost an order of magnitude lower than previously thought (see, e.g., Thornton et al., 2013). With this in mind, the lack of FRB detections in the survey, while disappointing, still provides useful constraints on the rate–fluence distribution. In our analysis below, we first determine the instantaneous sensitivity and field of view of our experiment to FRBs. We then adopt a recent determination of the all-sky FRB rate bursts per sky per day with 1.4 GHz fluences above 26 Jy ms which was found from an analysis of ASKAP detections (Shannon et al., 2018) to determine realistic expectation times needed to make a detection.
To compute the sensitivity and sky coverage of GBTrans, we take the measured gain of the 20–m telescope, , where the effective surface area m2 assumes an aperture efficiency of 75% based on the modeled feed patterns, and is Boltzmann’s constant. From this, we find K Jy*-1*. Next, we use the radiometer equation (see, e.g., Lorimer & Kramer, 2004) to compute for some limiting signal-to-noise ratio (S/N) the minimum detectable fluence
[TABLE]
where the typical system temperature K and the bandwidth MHz. For consistency with the ASKAP survey, we adopt their minimum FRB pulse width ms, and a S/N threshold of 10. This gives Jy ms. The minimum detectable fluence at the full-width half maximum (FWHM) of the main beam of GBTrans is therefore about 12 Jy ms. We adopt this as a fluence-complete limit in the analysis below. Fig. 5 shows the survey sensitivity among with previously detected FRBs. It appears that more than half of the current FRBs are detectable with GBTrans. Because our time resolution is better than for the ASKAP survey, as shown in Fig. 5, we also are sensitive to FRBs with widths shorter than 1 ms. Such FRBs do exist, and the observed sample is currently dominated by CHIME discoveries (CHIME/FRB Collaboration et al., 2019a). Because of the scaling between fluence and pulse width in Eq. (1), the fluence limit at our sampling interval (131 s) is about 4 Jy ms.
Having found the sensitivity out to the beam FWHM, we next need to compute the corresponding solid angle, , which represents the instantaneous amount of sky sampled at this limit. For a gaussian beam response (for a discussion, see Condon & Ransom, 2016) we have , where for an observing wavelength, m,
[TABLE]
From this, we find that the beam solid angle at the FWHM, sr or of the whole sky.
We model the rate–fluence distribution as a power law such that
[TABLE]
where the index for Euclidean geometry. Keeping as a free parameter but setting , then we find an expression for the mean “waiting time”, , to detect a pulse. Since this is just the reciprocal of the rate scaled by the solid angle coverage, we find that
[TABLE]
In Fig. 6 we show Eq. 4 alongside these various values of from earlier studies and our experimental limit on . To be consistent with our experimental results, days. From this, as shown in Fig. 6, we estimate that .
Care should be taken when interpreting this simple point estimate of the upper limit because there is no confidence interval associated with it. To demonstrate this, assuming that FRBs as a population follow Poissonian statistics in their event rate, the probability of finding at least one FRB in our data set . Setting in Eq. 3 to find and days, we find . To set a robust limit on , we can repeat this calculation to find as a function of . Requiring , we find that we should have detected at least one FRB with 90% confidence if . We therefore conclude that at the 90% confidence level.
Table 2 summarizes different constraints reported in literature. There is currently a wide range of values that are quoted. An Euclidean rate–fluence distribution would therefore lead to yr. Macquart & Ekers (2018) estimate, based on a recent maximum likelihood analysis on the Parkes FRBs, that . For this range of values, we would expect waiting times in the range days. In contrast, Li et al. (2017) estimate . This would correspond to days.
4.2 Survey Volume
Assuming a pulse width of 1 ms (consistent with the ASKAP FRB rate assumption), our nominal fluence limit discussed above corresponds to a peak flux limit of about 12 Jy. Adopting the standard candle model discussed by Lorimer et al. (2013) which gives a peak flux–redshift relationship (see their Eq. 9), we find a maximum redshift reached by GBTrans to be approximately . Given the beam solid angle computed in the previous section, the comoving volume corresponding to this limit assuming a standard set of cosmological parameters for a flat universe (Bennett et al., 2014) is 124,000 Mpc3. As expected, this is substantially less than what Foster et al. (2018) reported ( and 600,000 Mpc3) for the more sensitive ALFABURST survey even with its smaller field of view. We note here that due to the limited sensitivity of GBTrans, the survey volume is significantly smaller than what we would naively expect from searching out to DM = 9900 pc cm*-3*. For DMs dominated by intergalactic dispersion, the implied redshift for this DM is about . Our choice of searching to such a high DM value is, therefore, very conservative but it mitigates against additional dispersion from FRBs buried in high-density environments with significant amounts of ionised plasma. Future discoveries of highly dispersed FRBs along with directly-measurable redshifts will be able to better quantify the local environments in these sources.
5 Conclusions
GBTrans was an automated system that searched for FRBs commensally for over 500 days on a 20-m class telescope at Green Bank. The observations were nominally sensitive to FRBs with redshifts out to about 0.3. Our non-detection during this experiment leads to an upper limit on the power law index of the event rate–fluence exponent, with 90% confidence. With the torrent of discoveries expected from CHIME and ASKAP in the near future, the brightness distribution will undoubtedly be well probed by these and other experiments.
Our detection of numerous pulses from known pulsars has validated the observing system. In addition to a forthcoming publication concerning giant pulses from the Crab pulsar found during the course of this project, future uses of the 20-m in the FRB field are migrating to targeted searches such as the Swift survey described in the companion paper by Gregg et al. Ongoing work aims to adapt the system to operate as a rapid response observer of radio transient signals associated with gamma-ray bursts.
ACKNOWLEDGEMENTS
GBTrans activities are supported by a National Science Foundation (NSF) award AST-1516958. D.R.L. was supported by NSF award number OIA-1458952. G.G. would like to thank Mayuresh Surnis and Dan Werthimer for useful discussions and Nate Garver-Daniels for the technical support of this work. G.G., D.R.L., R.P. and M.A.M. are members of the NANOGrav Physics Frontiers Center which is supported by NSF award 1430284. S.W.E. was supported by NSF award AST-1516170 to Virginia Tech. K.R. would like to acknowledge financial support from European Research Council Horizon 2020 grant (no. 694745). The Green Bank Observatory is a facility of the National Science Foundation operated under cooperative agreement by Associated Universities, Inc. We thank the referee for very helpful comments on an earlier version of the manuscript.
The reference list from the paper itself. Each links out to its DOI / PubMed record.
- 1Abramowicz et al. (2018) Abramowicz M. A., Bejger M., Wielgus M., 2018, Ap J , 868, 17 · doi ↗
- 2Bannister et al. (2019) Bannister K. W., et al., 2019, ar Xiv e-prints, p. ar Xiv:1906.11476
- 3Bennett et al. (2014) Bennett C. L., Larson D., Weiland J. L., Hinshaw G., 2014, Ap J , 794, 135 · doi ↗
- 4Bhandari et al. (2018) Bhandari S., et al., 2018, MNRAS , 475, 1427 · doi ↗
- 5CHIME/FRB Collaboration et al. (2019 a) CHIME/FRB Collaboration et al., 2019 a, Nature , 566, 230 · doi ↗
- 6CHIME/FRB Collaboration et al. (2019 b) CHIME/FRB Collaboration et al., 2019 b, Nature , 566, 235 · doi ↗
- 7Caleb et al. (2016) Caleb M., Flynn C., Bailes M., Barr E. D., Hunstead R. W., Keane E. F., Ravi V., van Straten W., 2016, MNRAS , 458, 708 · doi ↗
- 8Chatterjee et al. (2017) Chatterjee S., et al., 2017, Nature , 541, 58 · doi ↗