Leveraging Deep Learning to Improve the Performance Predictability of Cloud Microservices
Yu Gan, Yanqi Zhang, Kelvin Hu, Dailun Cheng, Yuan He, Meghna, Pancholi, and Christina Delimitrou

TL;DR
Seer is an online deep learning-based system that predicts and prevents QoS violations in cloud microservices, enhancing performance reliability and aiding in microservice architecture optimization.
Contribution
Introduces Seer, a novel system combining distributed tracing and hardware monitoring with deep learning to predict and diagnose performance issues in microservices before they occur.
Findings
Seer predicts QoS violations with 91% accuracy.
Seer successfully prevents 84% of predicted violations.
Identifies application design bugs and suggests architectural improvements.
Abstract
Performance unpredictability is a major roadblock towards cloud adoption, and has performance, cost, and revenue ramifications. Predictable performance is even more critical as cloud services transition from monolithic designs to microservices. Detecting QoS violations after they occur in systems with microservices results in long recovery times, as hotspots propagate and amplify across dependent services. We present Seer, an online cloud performance debugging system that leverages deep learning and the massive amount of tracing data cloud systems collect to learn spatial and temporal patterns that translate to QoS violations. Seer combines lightweight distributed RPC-level tracing, with detailed low-level hardware monitoring to signal an upcoming QoS violation, and diagnose the source of unpredictable performance. Once an imminent QoS violation is detected, Seer notifies the cluster…
Click any figure to enlarge with its caption.
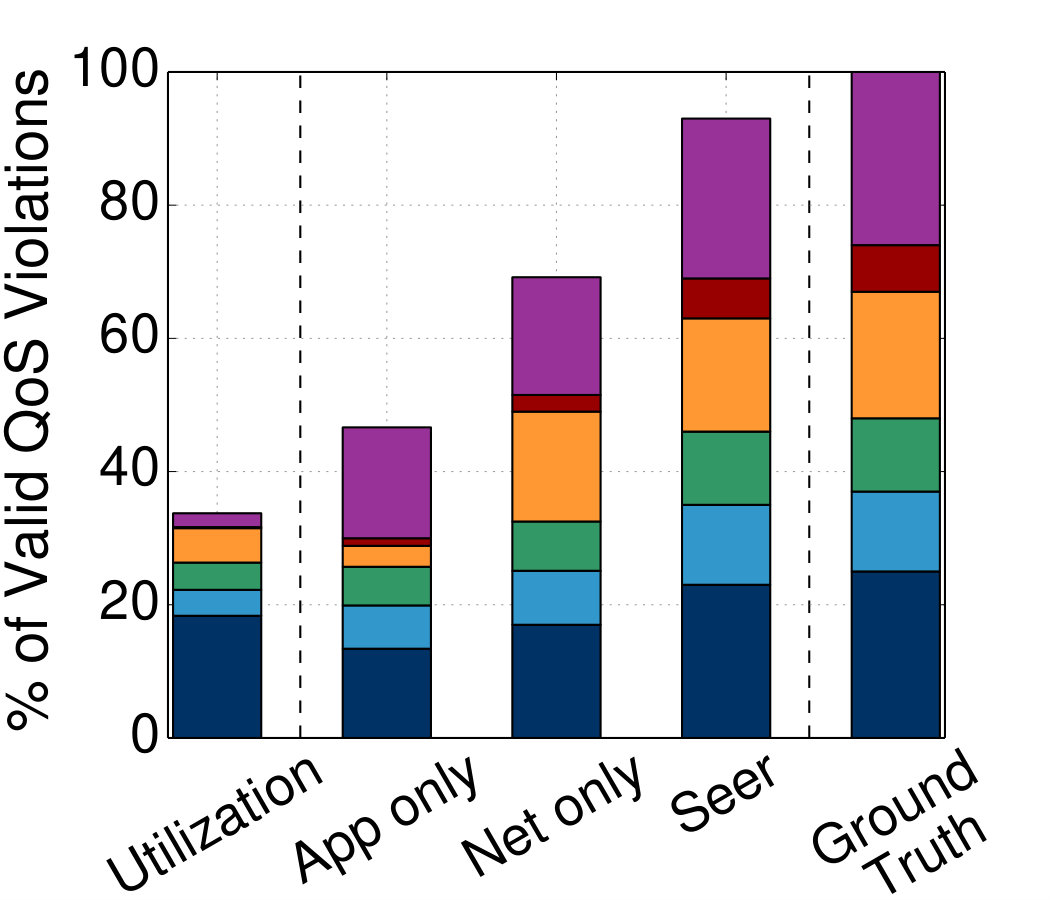 Figure 1
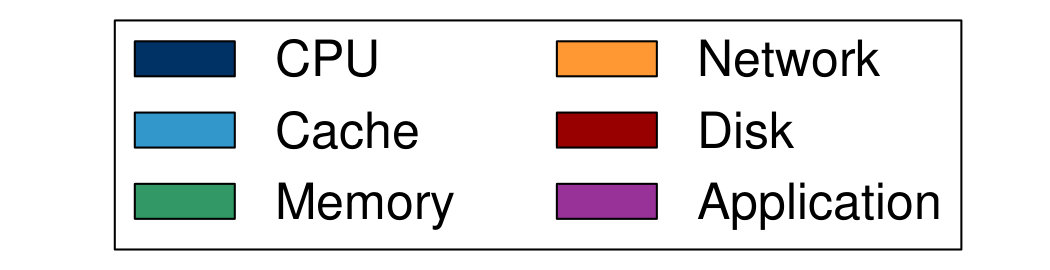 Figure 2
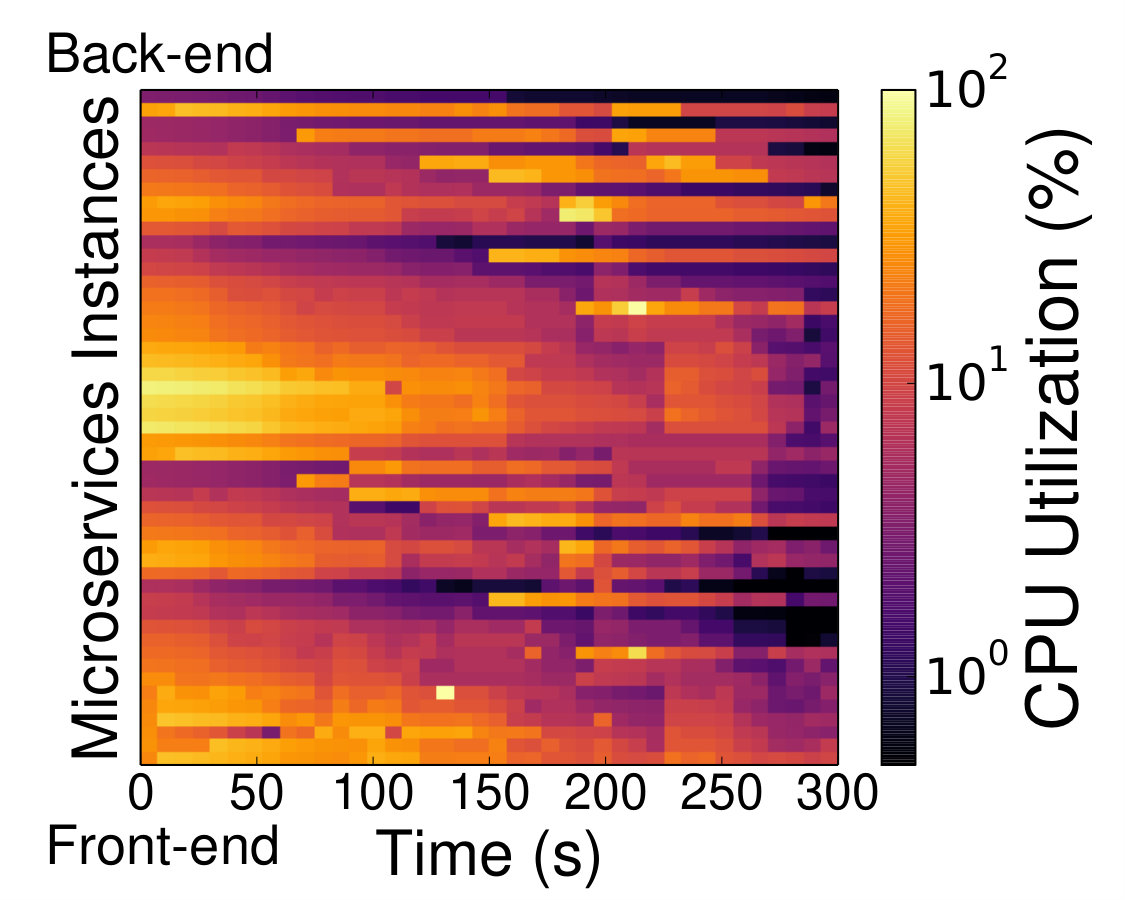 Figure 3
 Figure 4
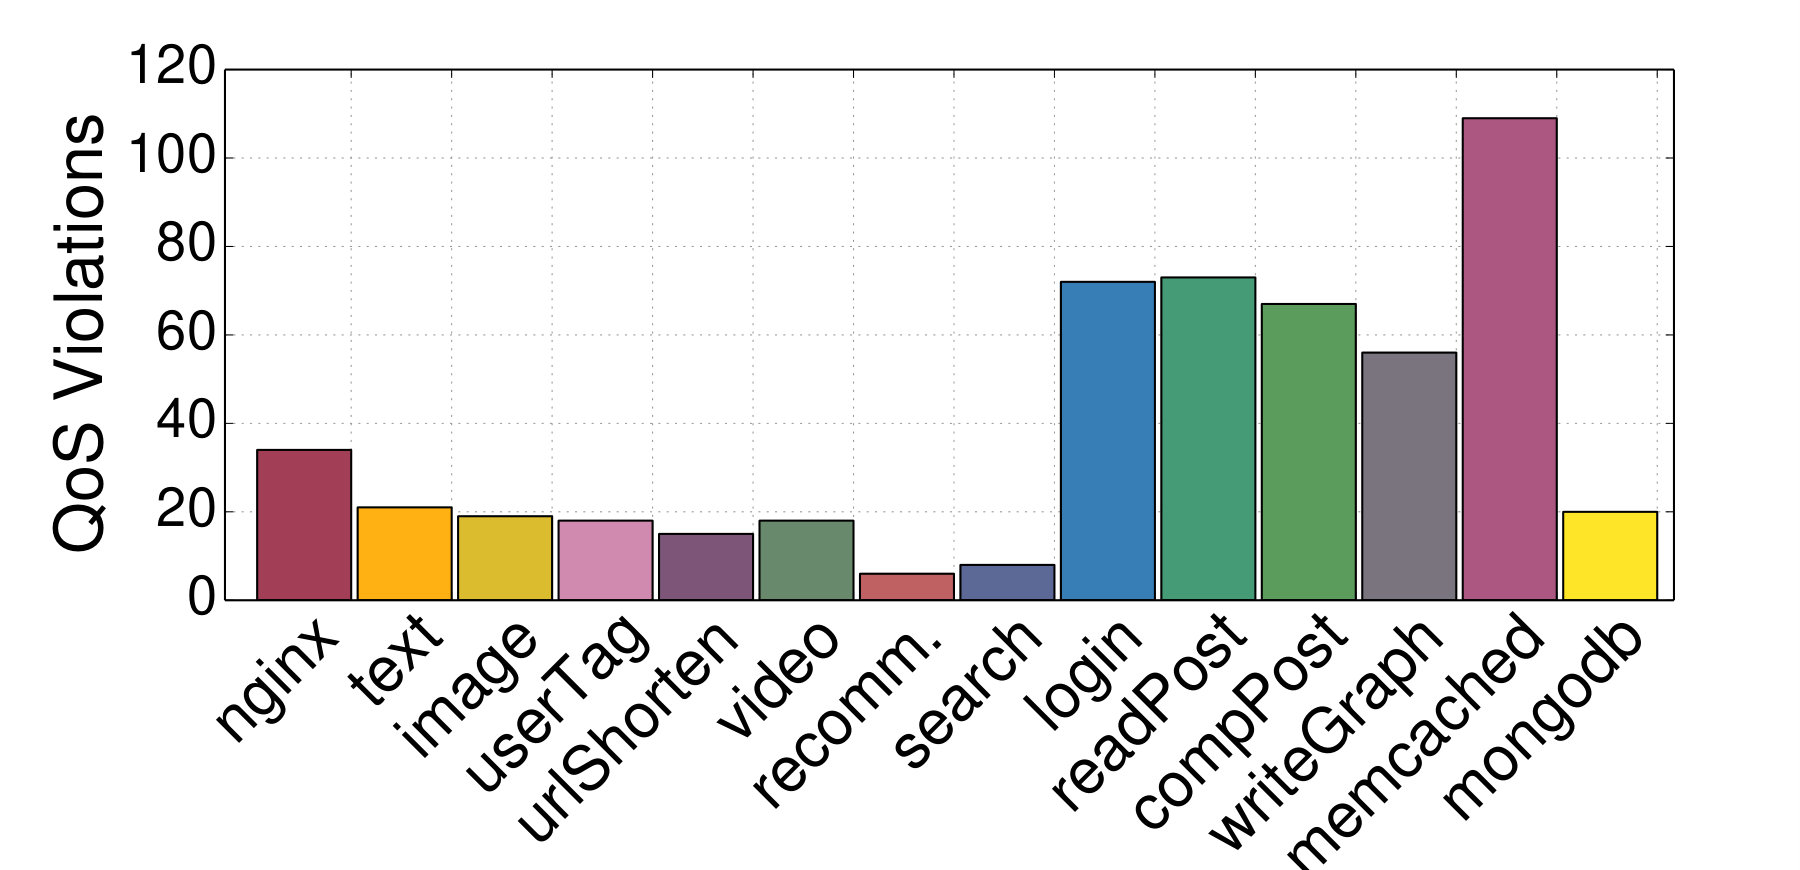 Figure 5
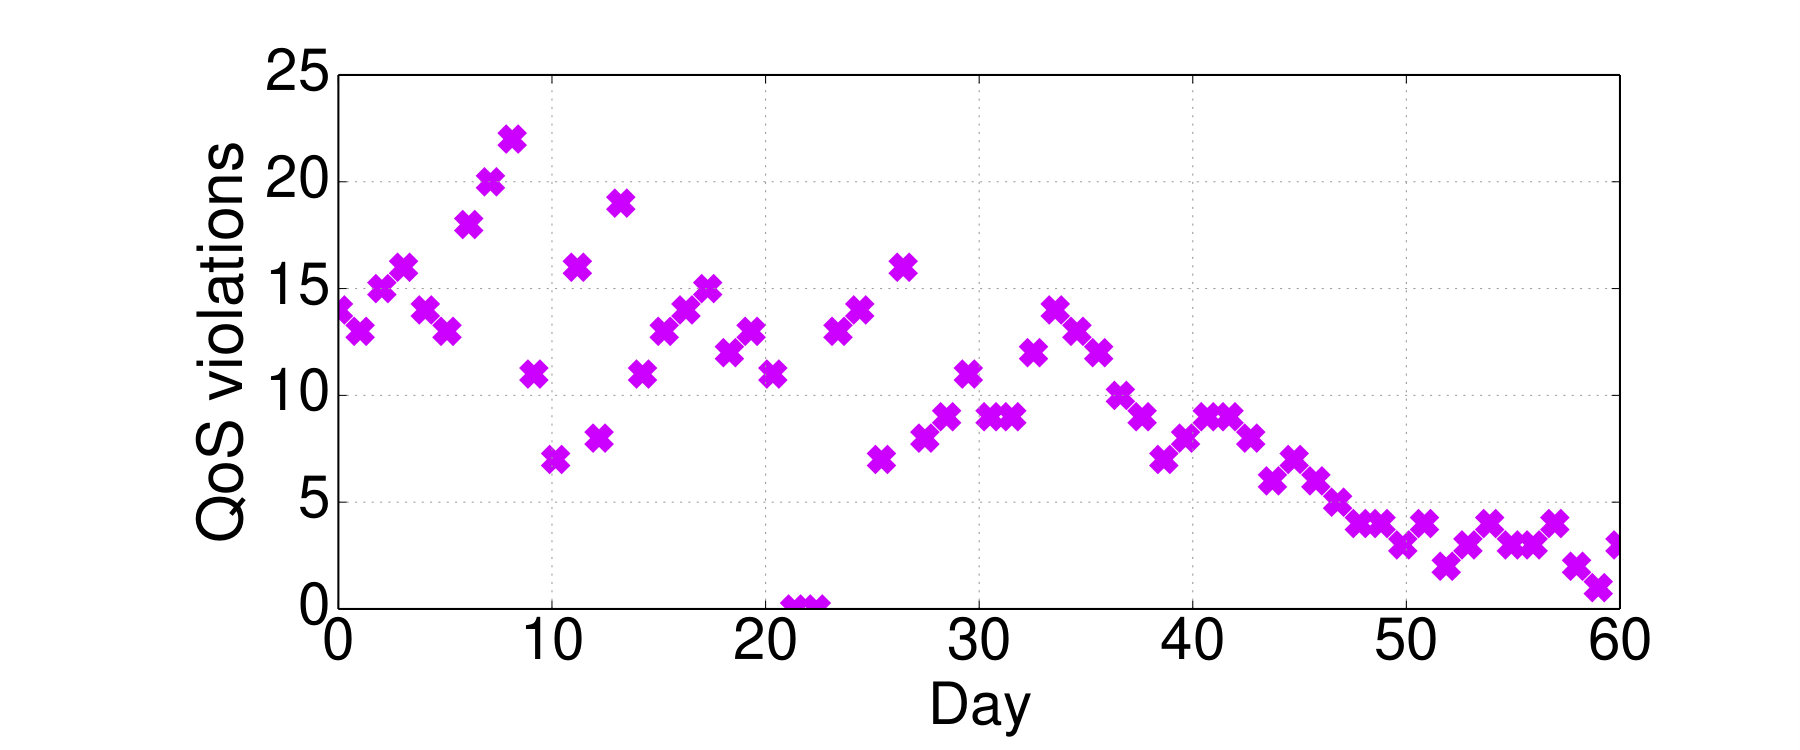 Figure 6
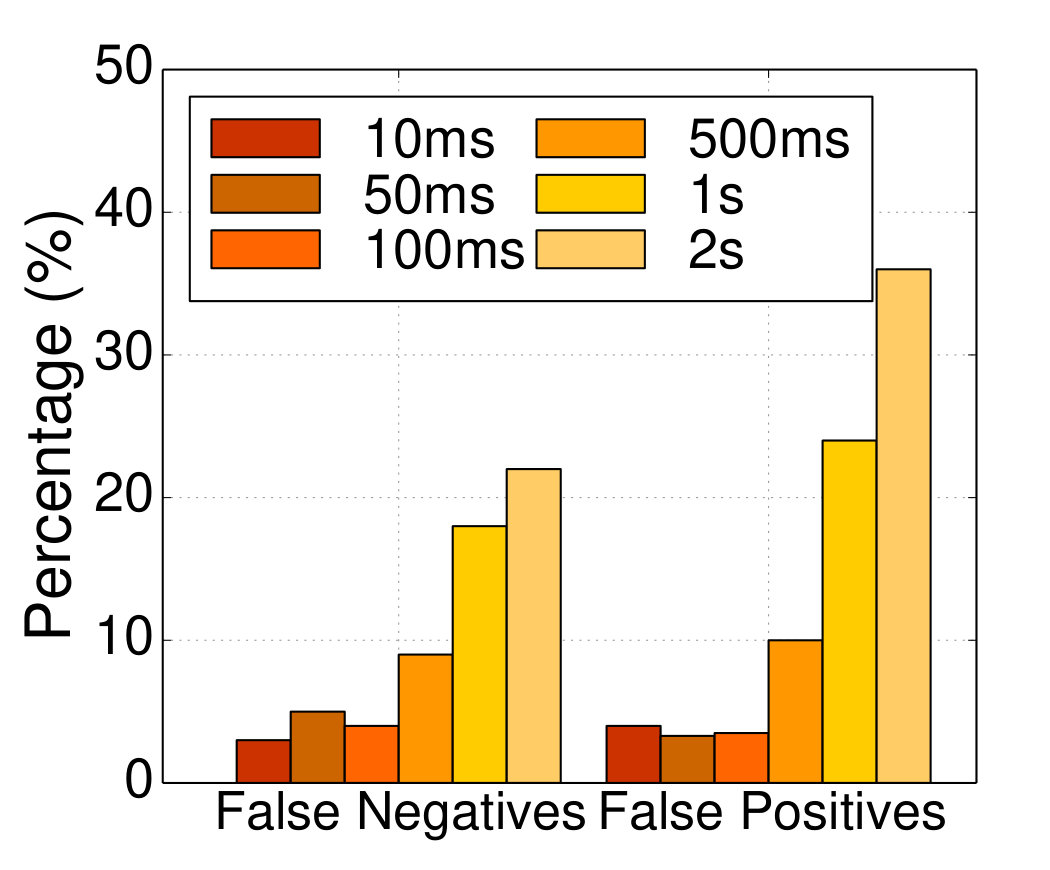 Figure 7
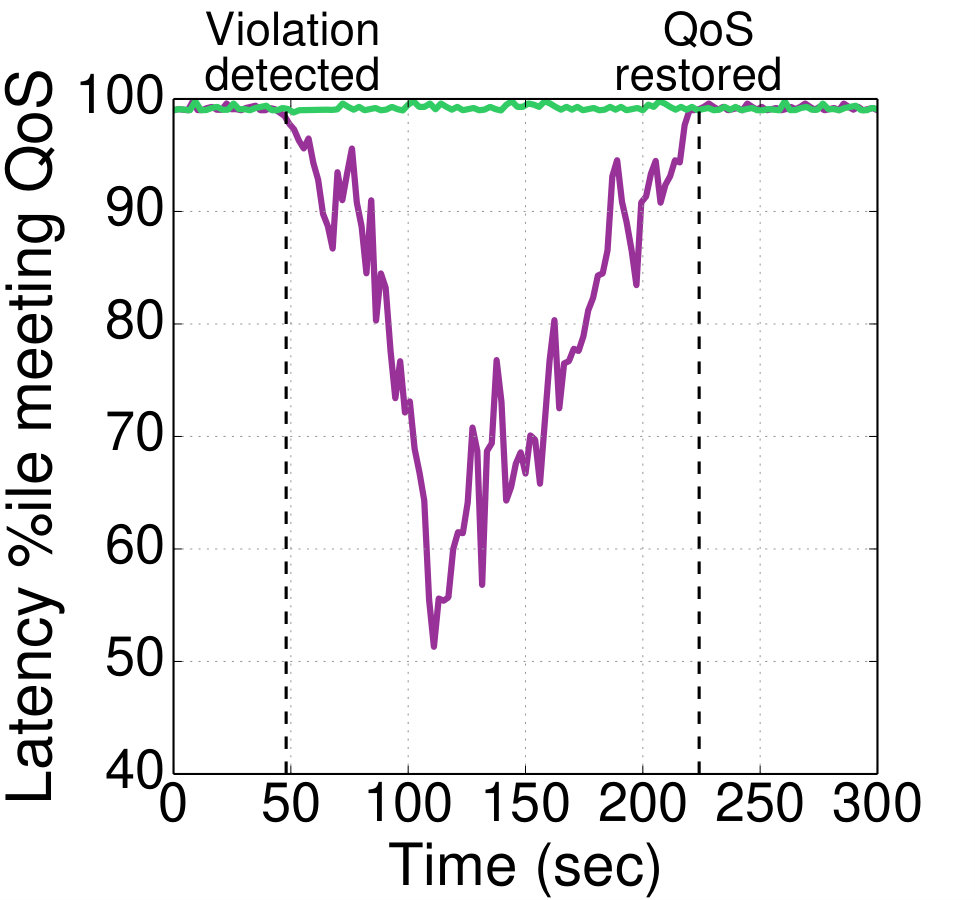 Figure 8
 Figure 9
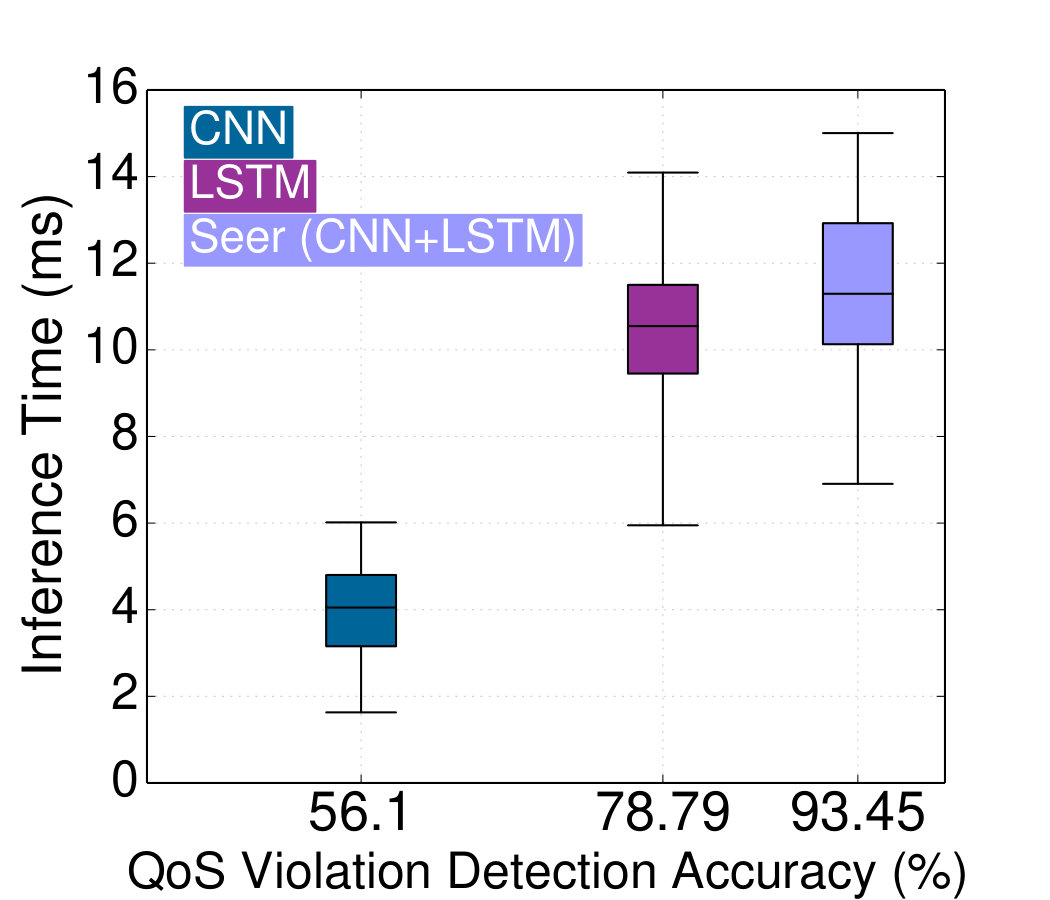 Figure 10
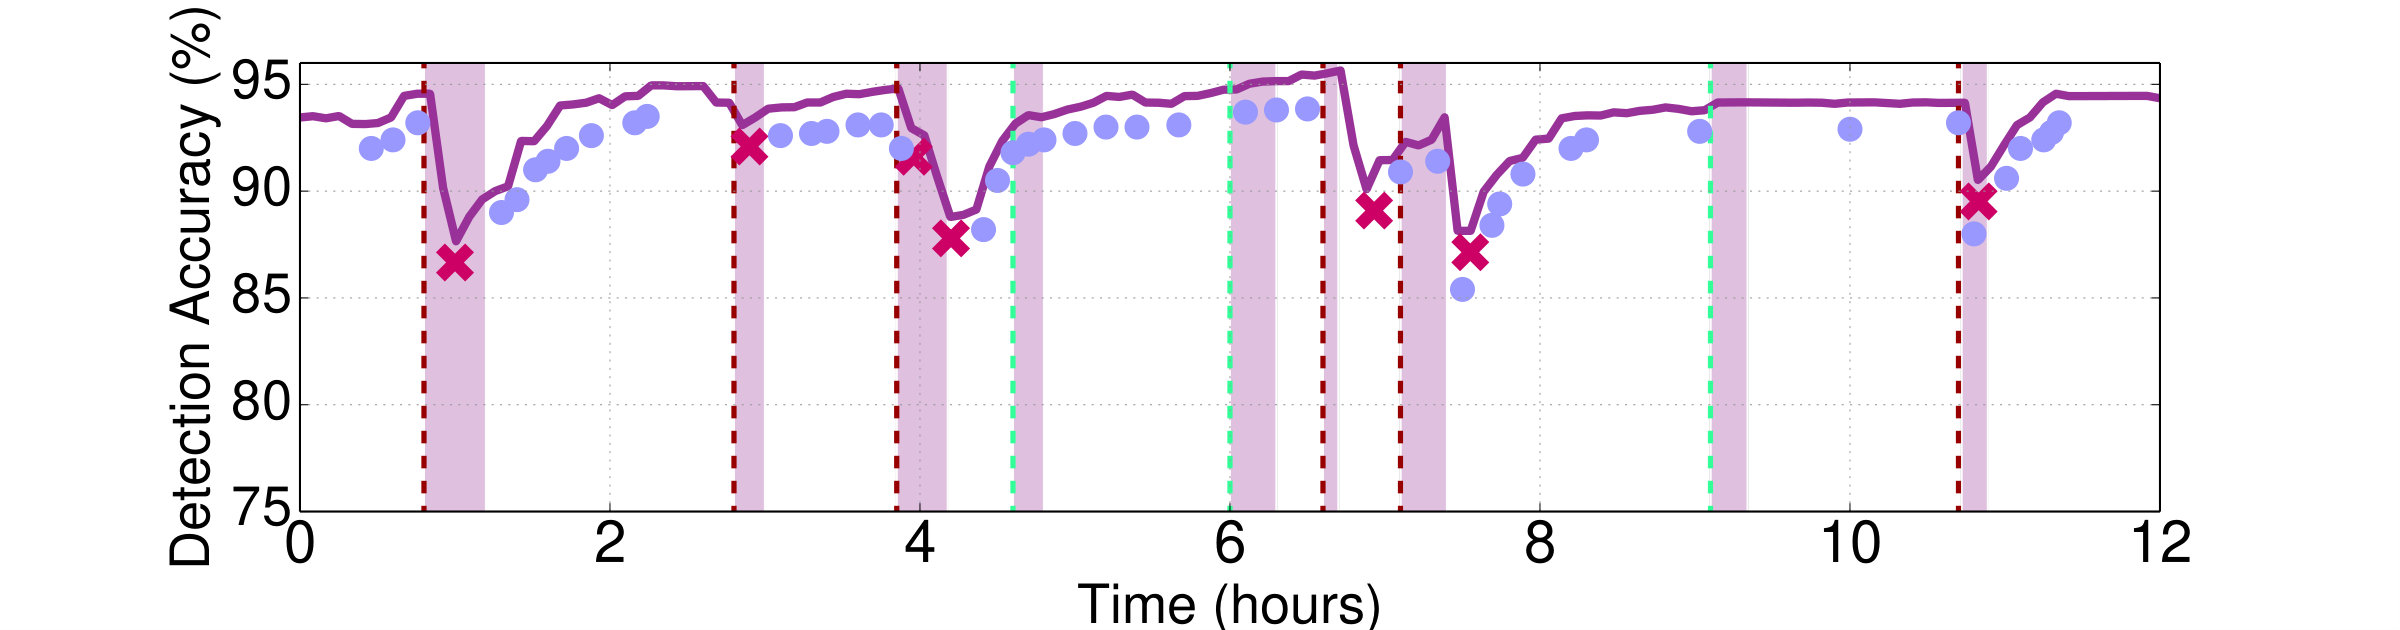 Figure 11
 Figure 12
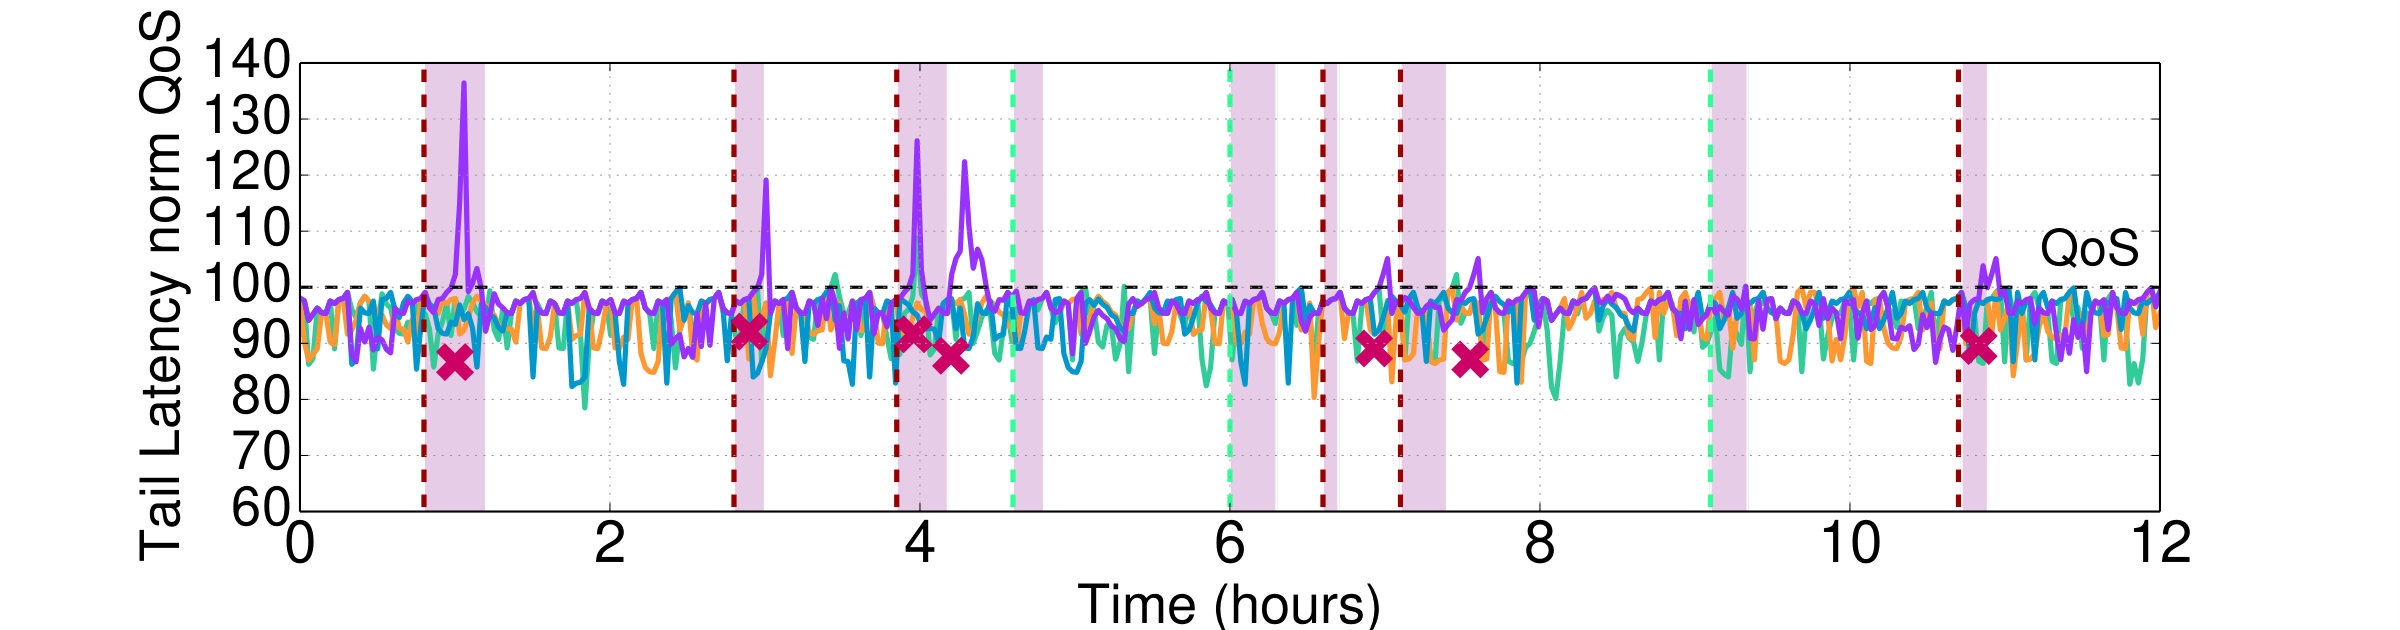 Figure 13
 Figure 14
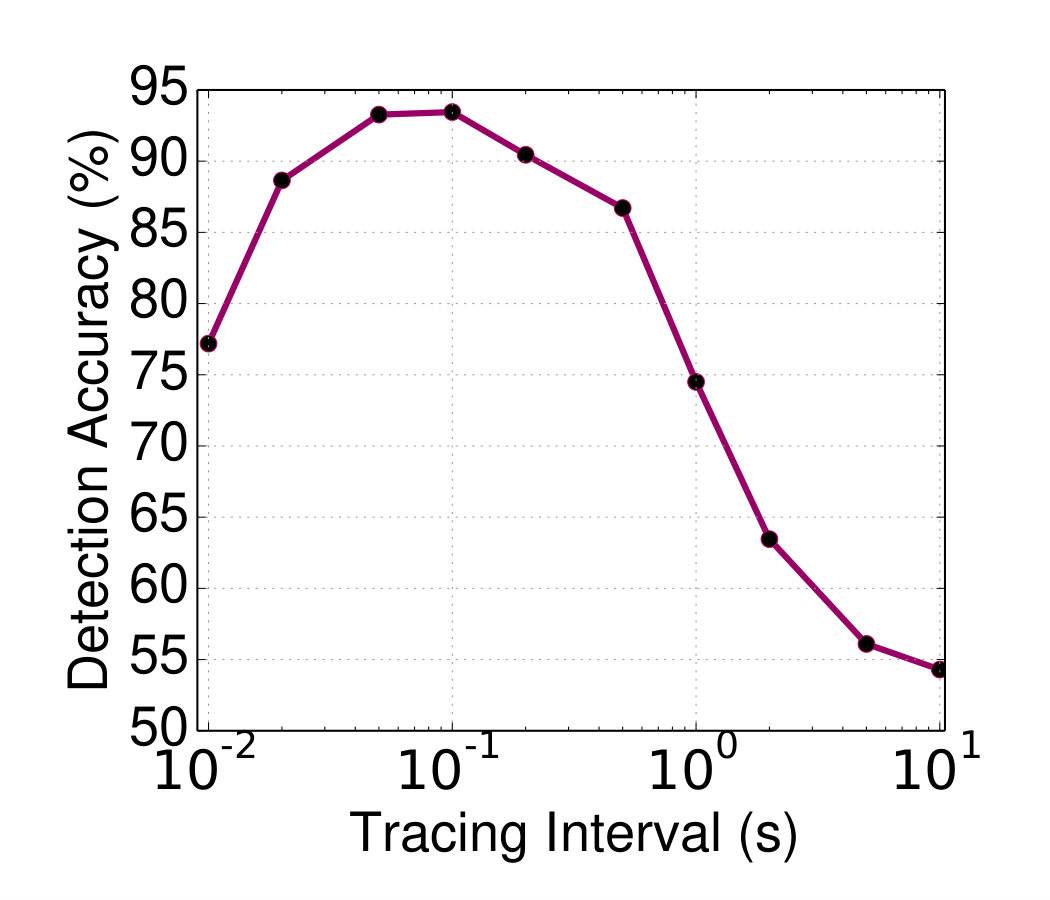 Figure 15
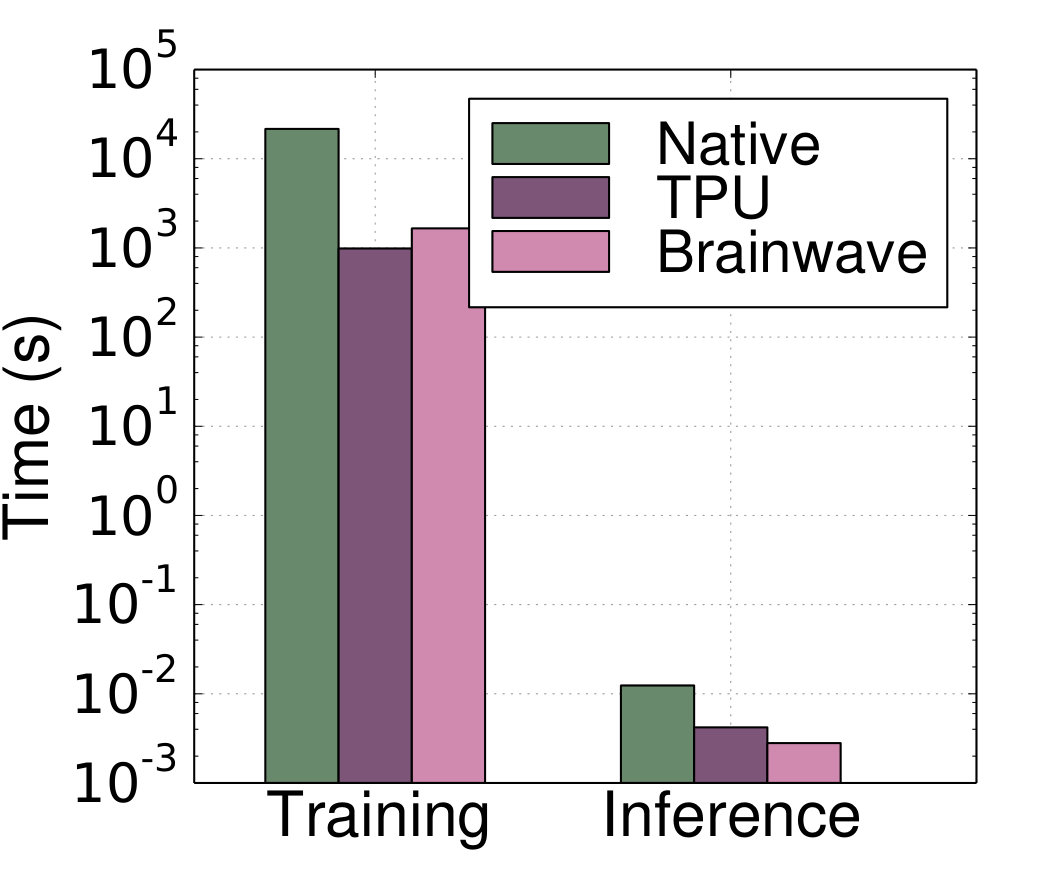 Figure 16
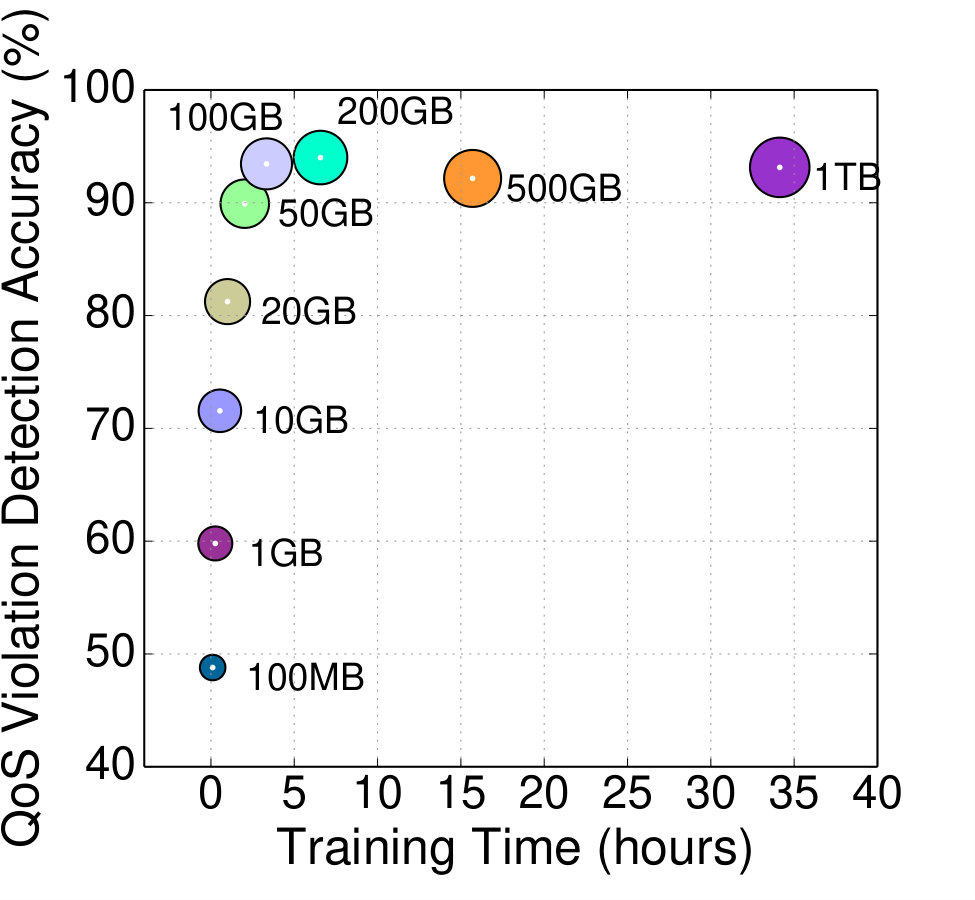 Figure 17
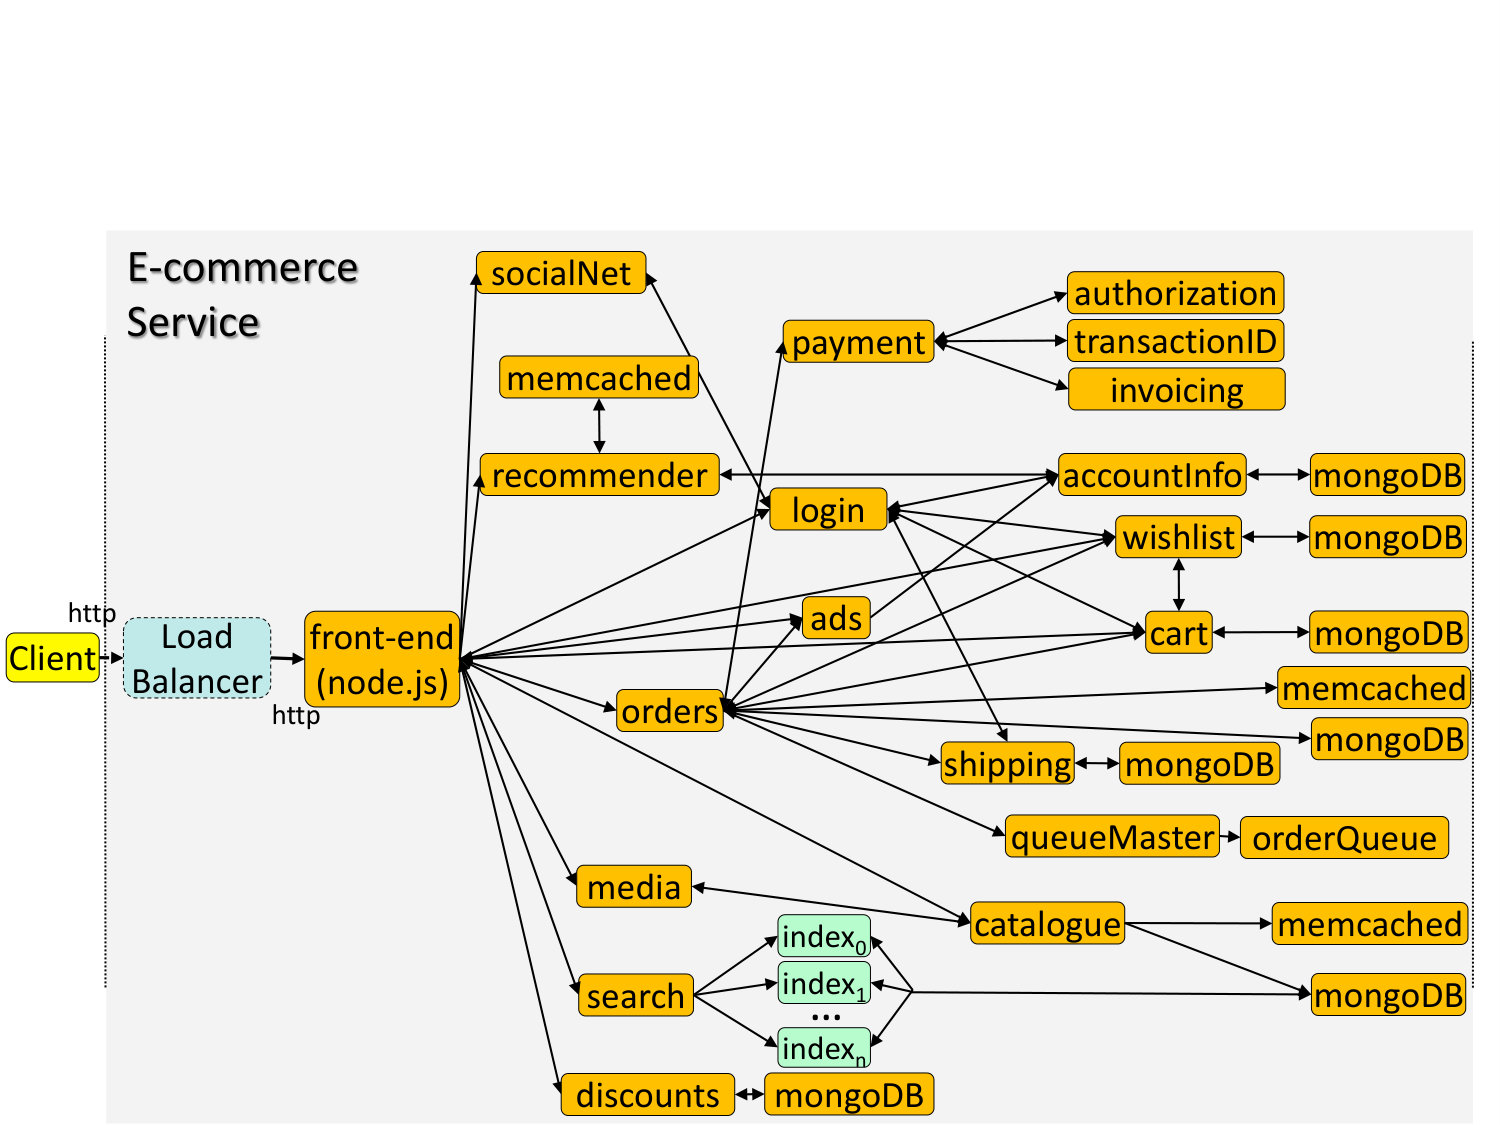 Figure 18
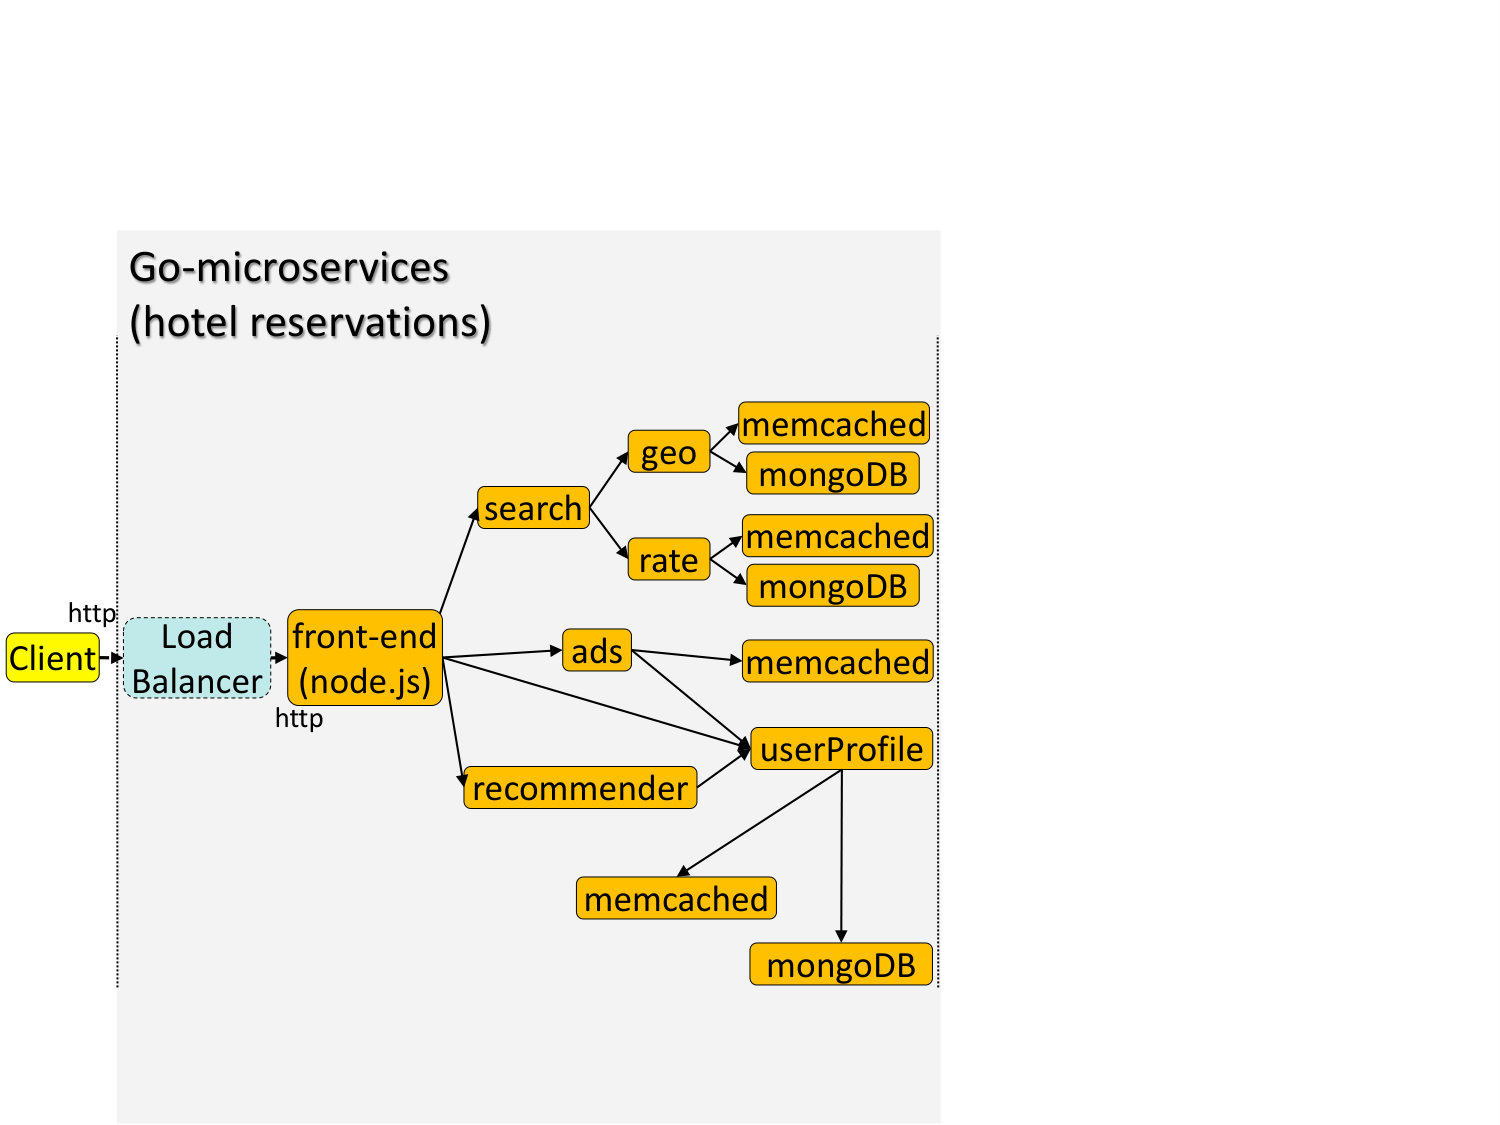 Figure 19
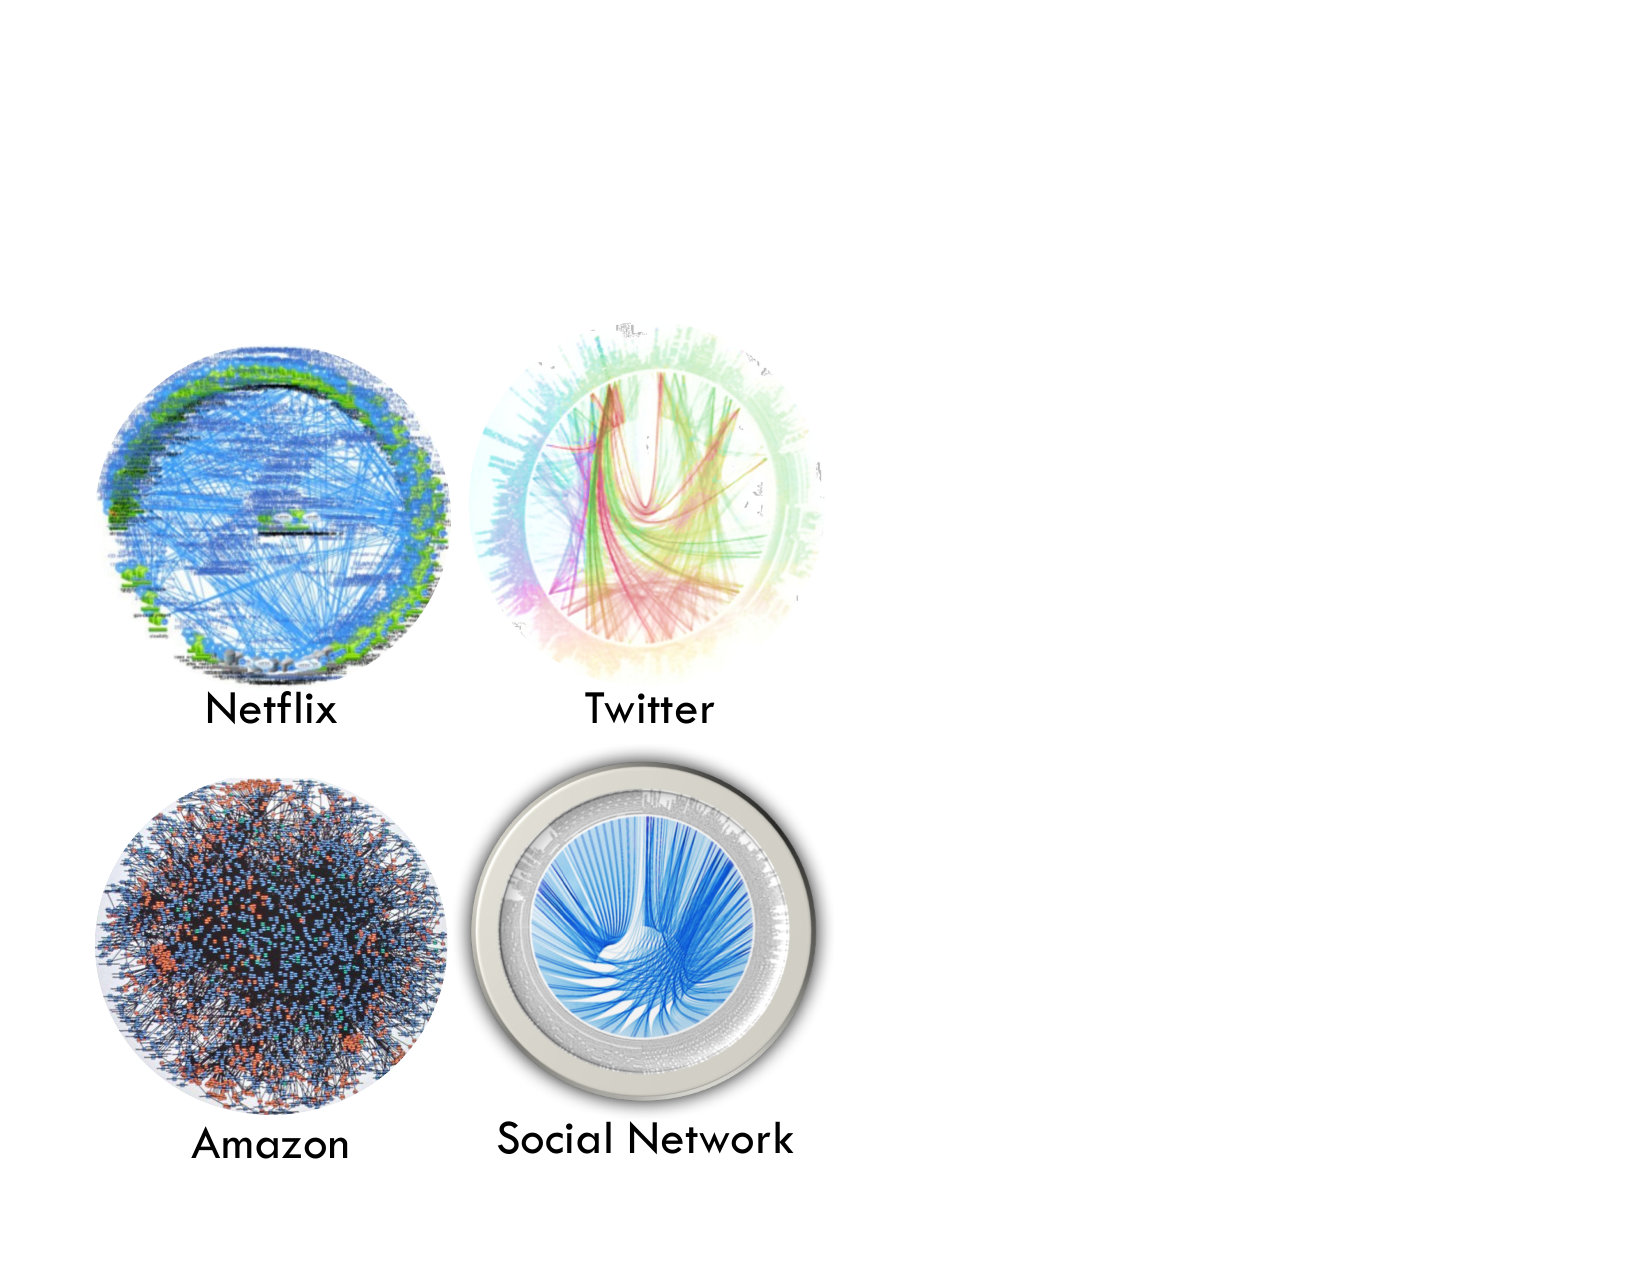 Figure 20
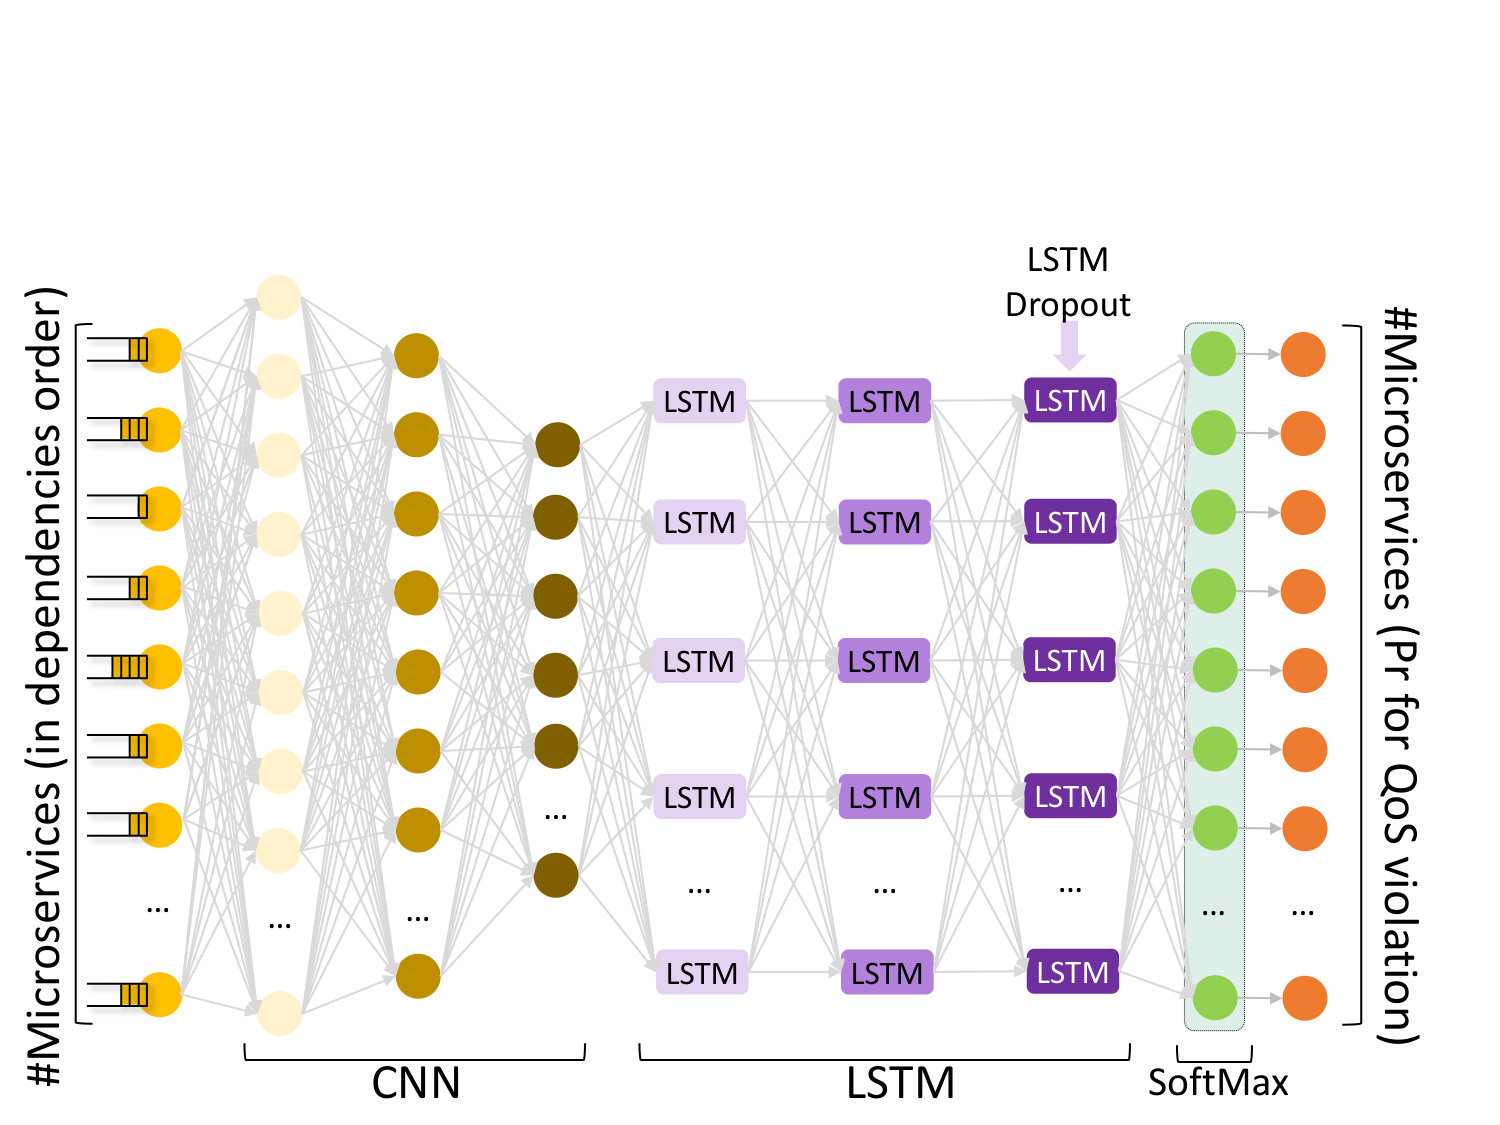 Figure 21
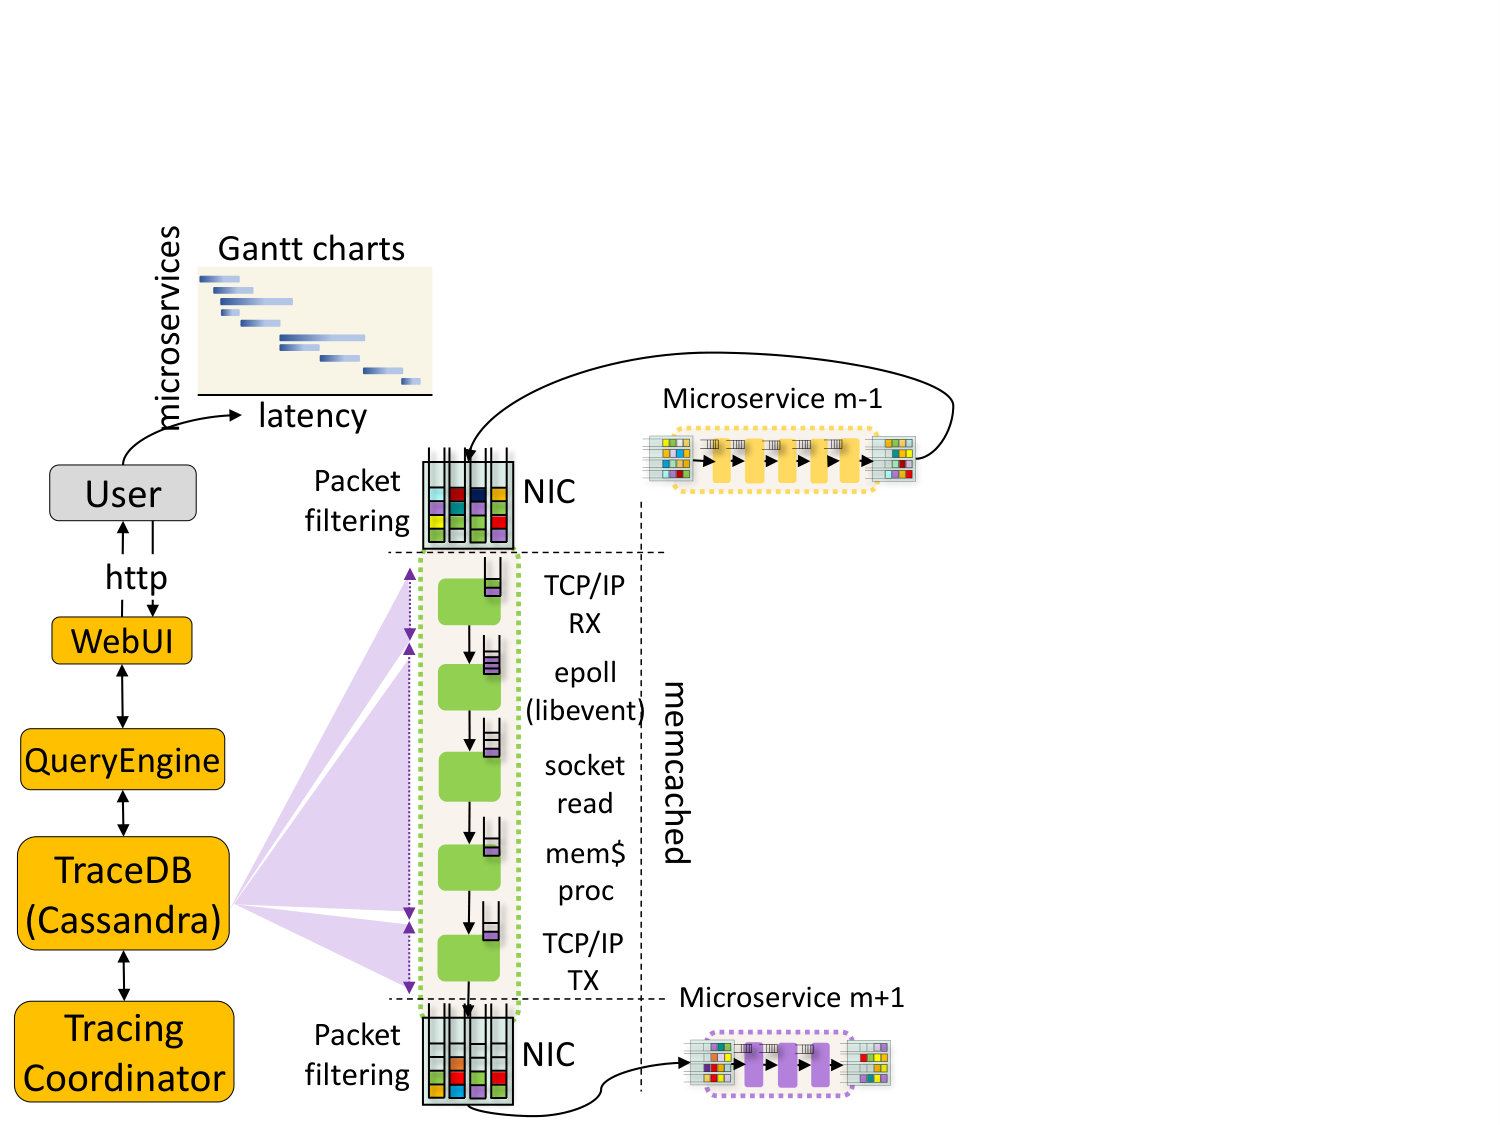 Figure 22
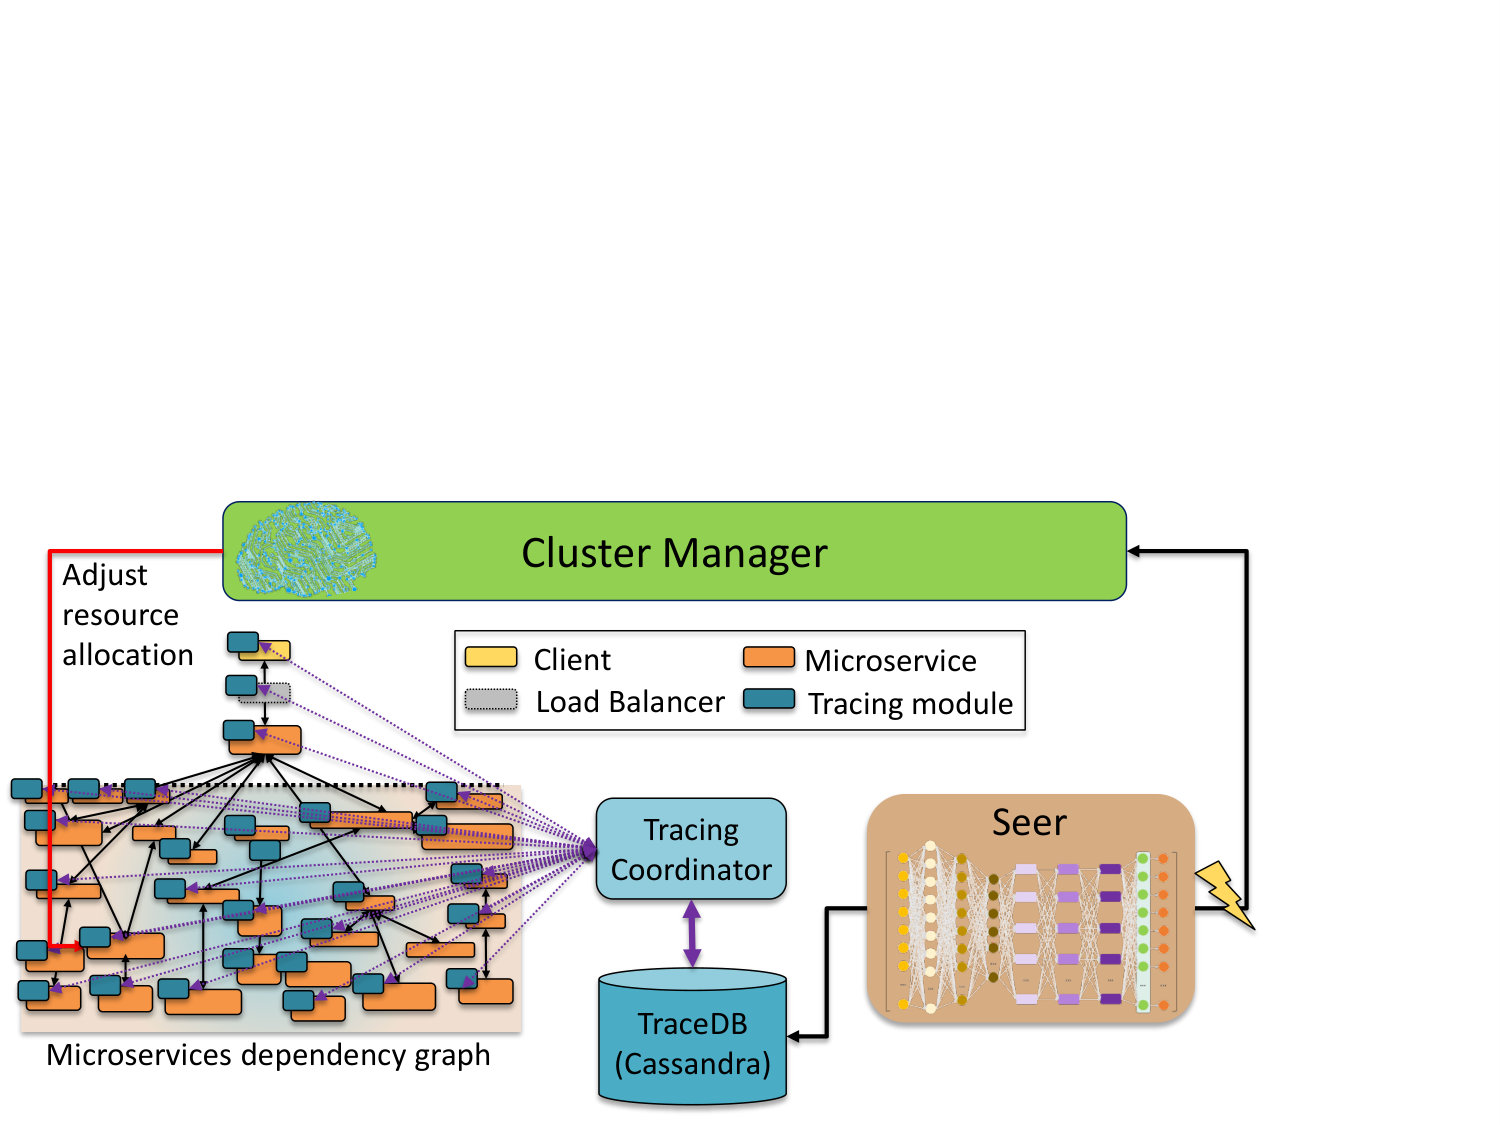 Figure 23
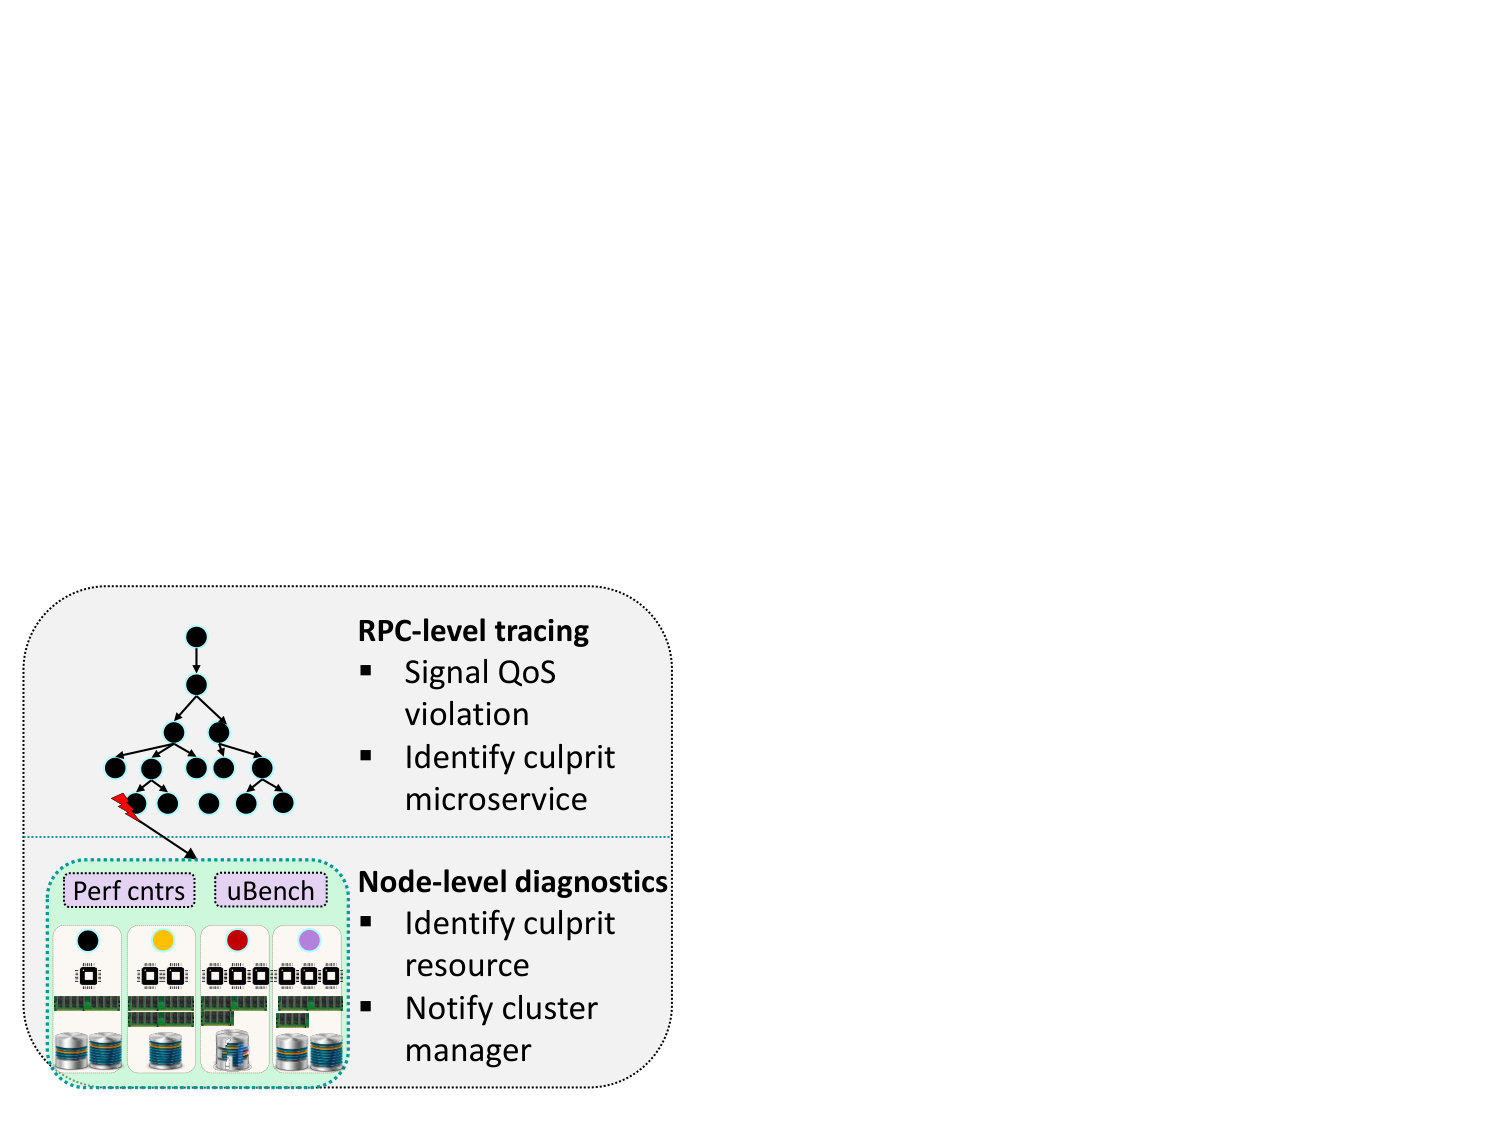 Figure 24
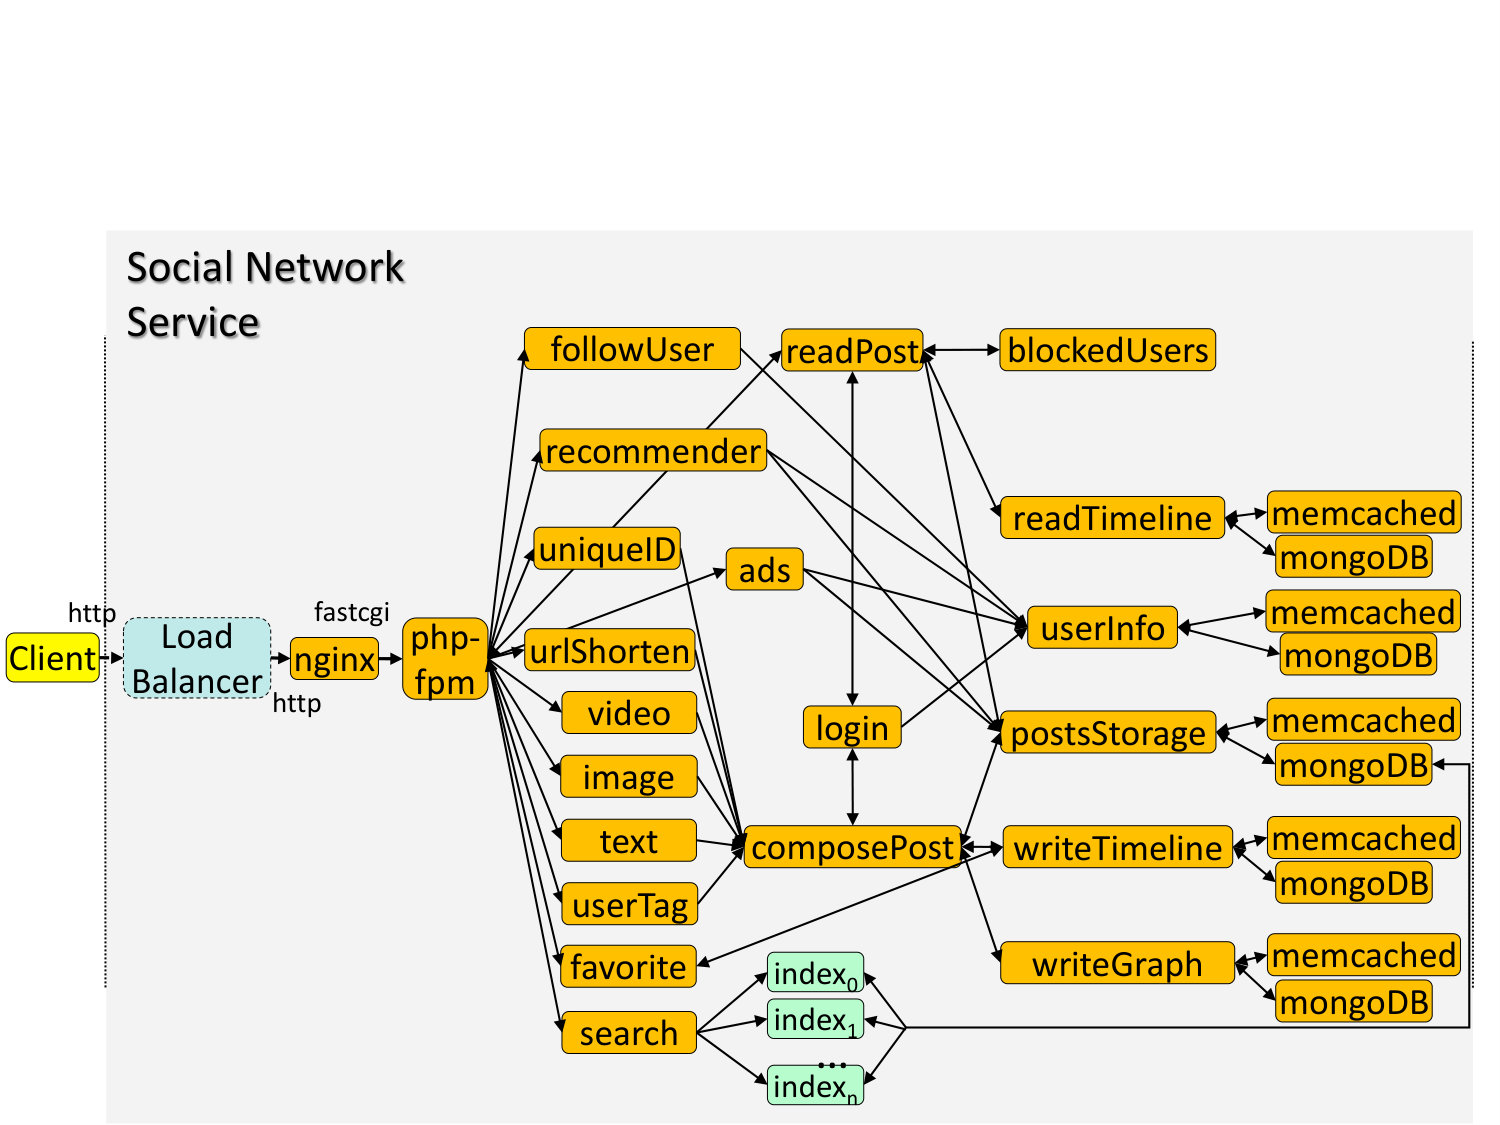 Figure 25
| Service | Communication | Unique | Per-language LoC breakdown |
|---|---|---|---|
| Protocol | Microservices | (end-to-end service) | |
| Social Network | RPC | 36 | 34% C, 23% C++, 18% Java, 7% node, 6% Python, 5% Scala, 3% PHP, 2% JS, 2% Go |
| \hdashline[0.5pt/2.5pt] Media Service | RPC | 38 | 30% C, 21% C++, 20% Java, 10% PHP, 8% Scala, 5% node, 3% Python, 3% JS |
| \hdashline[0.5pt/2.5pt] E-commerce Site | REST | 41 | 21% Java, 16% C++, 15% C, 14% Go, 10% JS, 7% node, 5% Scala, 4% HTML, 3% Ruby |
| \hdashline[0.5pt/2.5pt] Banking System | RPC | 28 | 29% C, 25% Javascript, 16% Java, 16% node.js, 11% C++, 3% Python |
| \hdashline[0.5pt/2.5pt] Hotel Reservations (gom, [n. d.]) | RPC | 15 | 89% Go, 7% HTML, 4% Python |
| Name | LoC | Layers | Nonlinear | Weights | Batch | |||
|---|---|---|---|---|---|---|---|---|
| FC | Conv | Vect | Total | Function | Size | |||
| CNN | 1456 | 8 | 8 | ReLU | 30K | 4 | ||
| \hdashline[0.5pt/2.5pt] LSTM | 944 | 12 | 6 | 18 | sigmoid,tanh | 52K | 32 | |
| \hdashline[0.5pt/2.5pt] Seer | 2882 | 10 | 7 | 5 | 22 | ReLU | 80K | 32 |
| sigmoid,tanh | ||||||||
Peer Reviews
No public reviews on file for this paper yet. If you reviewed it on a platform where reviews are public (OpenReview, ICLR, NeurIPS, ICML), you can paste yours below so the community can read it here.
Videos
No videos yet. Explain this paper in a talk, walkthrough, or lecture? Add one.
Taxonomy
TopicsCloud Computing and Resource Management · Software System Performance and Reliability · IoT and Edge/Fog Computing
Leveraging Deep Learning to Improve the Performance Predictability of Cloud Microservices
Yu Gan
Cornell University
,
Yanqi Zhang
Cornell University
,
Kelvin Hu
Cornell University
,
Dailun Cheng
Cornell University
,
Yuan He
Cornell University
,
Meghna Pancholi
Cornell University
and
Christina Delimitrou
Cornell University
Abstract.
Performance unpredictability is a major roadblock towards cloud adoption, and has performance, cost, and revenue ramifications. Predictable performance is even more critical as cloud services transition from monolithic designs to microservices. Detecting QoS violations after they occur in systems with microservices results in long recovery times, as hotspots propagate and amplify across dependent services.
We present Seer, an online cloud performance debugging system that leverages deep learning and the massive amount of tracing data cloud systems collect to learn spatial and temporal patterns that translate to QoS violations. Seer combines lightweight distributed RPC-level tracing, with detailed low-level hardware monitoring to signal an upcoming QoS violation, and diagnose the source of unpredictable performance. Once an imminent QoS violation is detected, Seer notifies the cluster manager to take action to avoid performance degradation altogether. We evaluate Seer both in local clusters, and in large-scale deployments of end-to-end applications built with microservices with hundreds of users. We show that Seer correctly anticipates QoS violations 91% of the time, and avoids the QoS violation to begin with in 84% of cases. Finally, we show that Seer can identify application-level design bugs, and provide insights on how to better architect microservices to achieve predictable performance.
1. Introduction
Cloud computing services are governed by strict quality of service (QoS) constraints in terms of throughput, and more critically tail latency (Barroso and Hoelzle, 2009; Dean and Barroso, [n. d.]; Delimitrou and Kozyrakis, [n. d.]b, [n. d.]e). Violating these requirements worsens the end user experience, leads to loss of availability and reliability, and has severe revenue implications (Barroso and Hoelzle, 2009; Barroso, [n. d.]; Dean and Barroso, [n. d.]; Delimitrou and Kozyrakis, 2016, 2017, [n. d.]c). In an effort to meet these performance constraints and facilitate frequent application updates, cloud services have recently undergone a major shift from complex monolithic designs, which encompass the entire functionality in a single binary, to graphs of hundreds of loosely-coupled, single-concerned microservices (Coc, 2016; Gan et al., 2019). Microservices are appealing for several reasons, including accelerating development and deployment, simplifying correctness debugging, as errors can be isolated in specific tiers, and enabling a rich software ecosystem, as each microservice is written in the language or programming framework that best suits its needs.
At the same time microservices signal a fundamental departure from the way traditional cloud applications were designed, and bring with them several system challenges. Specifically, even though the quality-of-service (QoS) requirements of the end-to-end application are similar for microservices and monoliths, the tail latency required for each individual microservice is much stricter than for traditional cloud applications (Meisner et al., 2011; Lo et al., [n. d.]a, [n. d.]b; Delimitrou and Kozyrakis, [n. d.]e; Reiss et al., [n. d.]; Nguyen et al., [n. d.]; Mars and Tang, [n. d.]; Gan and Delimitrou, 2018; Gan et al., 2018; Gan et al., 2019). This puts increased pressure on delivering predictable performance, as dependencies between microservices mean that a single misbehaving microservice can cause cascading QoS violations across the system.
Fig. 1 shows three instances of real large-scale production deployments of microservices (Adrian Cockroft, [n. d.]; Coc, 2016; twi, [n. d.]). The perimeter of the circle (or sphere surface) shows the different microservices, and edges show dependencies between them. We also show these dependencies for Social Network, one of the large-scale services used in the evaluation of this work (see Sec. 3). Unfortunately the complexity of modern cloud services means that manually determining the impact of each pair-wide dependency on end-to-end QoS, or relying on the user to provide this information is impractical.
Apart from software heterogeneity, datacenter hardware is also becoming increasingly heterogeneous as special-purpose architectures (Jouppi et al., 2017; Chen et al., 2014a; Du et al., 2015; Chen et al., 2016; Chen et al., 2014b) and FPGAs are used to accelerate critical operations (Putnam et al., 2014; Caulfield et al., 2016; Chung et al., 2018; Firestone et al., 2018). This adds to the existing server heterogeneity in the cloud where servers are progressively replaced and upgraded over the datacenter’s provisioned lifetime (Yang et al., [n. d.]; Mars et al., 2011; Delimitrou and Kozyrakis, [n. d.]b, [n. d.]d; Nathuji et al., [n. d.]a), and further complicates the effort to guarantee predictable performance.
The need for performance predictability has prompted a long line of work on performance tracing, monitoring, and debugging systems (Sigelman et al., 2010; Ren et al., 2010; Chow et al., 2014; Fonseca et al., 2007; Yu et al., 2016; Xu et al., 2016; Geng et al., [n. d.]). Systems like Dapper and GWP, for example, rely on distributed tracing (often at RPC level) and low-level hardware event monitoring respectively to detect performance abnormalities, while the Mystery Machine (Chow et al., 2014) leverages the large amount of logged data to extract the causal relationships between requests.
Even though such tracing systems help cloud providers detect QoS violations and apply corrective actions to restore performance, until those actions take effect, performance suffers. For monolithic services this primarily affects the service experiencing the QoS violation itself, and potentially services it is sharing physical resources with. With microservices, however, a posteriori QoS violation detection is more impactful, as hotspots propagate and amplify across dependent services, forcing the system to operate in a degraded state for longer, until all oversubscribed tiers have been relieved, and all accumulated queues have drained. Fig. 2a shows the impact of reacting to a QoS violation after it occurs for the Social Network application with several hundred users running on 20 two-socket, high-end servers. Even though the scheduler scales out all oversubscribed tiers once the violation occurs, it takes several seconds for the service to return to nominal operation. There are two reasons for this; first, by the time one tier has been upsized, its neighboring tiers have built up request backlogs, which cause them to saturate in turn. Second, utilization is not always a good proxy for tail latency and/or QoS violations (Lo et al., [n. d.]a, [n. d.]b; Barroso and Hoelzle, 2009; Dean and Barroso, [n. d.]; Ousterhout et al., [n. d.]). Fig. 2b shows the utilization of all microservices ordered from the back-end to the front-end over time, and Fig. 2c shows their corresponding 99th percentile latencies normalized to nominal operation. Although there are cases where high utilization and high latency match, the effect of hotspots propagating through the service is much more pronounced when looking at latencies, with the back-end tiers progressively saturating the service’s logic and front-end microservices. In contrast, there are highly-utilized microservices that do not experience increases in their tail latency. A common way to address such QoS violations is rate limiting (Suresh et al., [n. d.]), which constrains the incoming load, until hotspots dissipate. This restores performance, but degrades the end user’s experience, as a fraction of input requests is dropped.
We present Seer, a proactive cloud performance debugging system that leverages practical deep learning techniques to diagnose upcoming QoS violations in a scalable and online manner. First, Seer is proactive to avoid the long recovery periods of a posteriori QoS violation detection. Second, it uses the massive amount of tracing data cloud systems collect over time to learn spatial and temporal patterns that lead to QoS violations early enough to avoid them altogether. Seer includes a lightweight, distributed RPC-level tracing system, based on Apache Thrift’s timing interface (thr, [n. d.]), to collect end-to-end traces of request execution, and track per-microservice outstanding requests. Seer uses these traces to train a deep neural network to recognize imminent QoS violations, and identify the microservice(s) that initiated the performance degradation. Once Seer identifies the culprit of a QoS violation that will occur over the next few 100s of milliseconds, it uses detailed per-node hardware monitoring to determine the reason behind the degraded performance, and provide the cluster scheduler with recommendations on actions required to avoid it.
We evaluate Seer both in our local cluster of 20 two-socket servers, and on large-scale clusters on Google Compute Engine (GCE) with a set of end-to-end interactive applications built with microservices, including the Social Network above. In our local cluster, Seer correctly identifies upcoming QoS violations in 93% of cases, and correctly pinpoints the microservice initiating the violation 89% of the time. To combat long inference times as clusters scale, we offload the DNN training and inference to Google’s Tensor Processing Units (TPUs) when running on GCE (Jouppi et al., 2017). We additionally experiment with using FPGAs in Seer via Project Brainwave (Chung et al., 2018) when running on Windows Azure, and show that both types of acceleration speed up Seer by 200-235x, with the TPU helping the most during training, and vice versa for inference. Accuracy is consistent with the small cluster results.
Finally, we deploy Seer in a large-scale installation of the Social Network service with several hundred users, and show that it not only correctly identifies 90.6% of upcoming QoS violations and avoids 84% of them, but that detecting patterns that create hotspots helps the application’s developers improve the service design, resulting in a decreasing number of QoS violations over time. As cloud application and hardware complexity continues to grow, data-driven systems like Seer can offer practical solutions for systems whose scale make empirical approaches intractable.
2. Related Work
Performance unpredictability is a well-studied problem in public clouds that stems from platform heterogeneity, resource interference, software bugs and load variation (Cherkasova et al., 2007; Mangot, [n. d.]; Schad et al., 2010; Delimitrou and Kozyrakis, [n. d.]e, [n. d.]c, 2016; Ostermann et al., [n. d.]; Iosup et al., [n. d.]; Delimitrou et al., 2015; Schad et al., 2010; Rehman and Sakr, [n. d.]; Khamra et al., [n. d.]; Lo et al., [n. d.]a, [n. d.]b). We now review related work on reducing performance unpredictability in cloud systems, including through scheduling and cluster management, or through online tracing systems.
**Cloud management: **The prevalence of cloud computing has motivated several cluster management designs. Systems like Mesos (Hindman et al., [n. d.]), Torque (torque, [n. d.]), Tarcil (Delimitrou et al., 2015), and Omega (Schwarzkopf et al., [n. d.]) all target the problem of resource allocation in large, multi-tenant clusters. Mesos is a two-level scheduler. It has a central coordinator that makes resource offers to application frameworks, and each framework has an individual scheduler that handles its assigned resources. Omega on the other hand, follows a shared-state approach, where multiple concurrent schedulers can view the whole cluster state, with conflicts being resolved through a transactional mechanism (Schwarzkopf et al., [n. d.]). Tarcil leverages information on the type of resources applications need to employ a sampling-base distributed scheduler that returns high quality resources within a few milliseconds (Delimitrou et al., 2015). Dejavu identifies a few workload classes and reuses previous allocations for each class, to minimize reallocation overheads (Vasić et al., [n. d.]). CloudScale (Shen et al., [n. d.]), PRESS (Gong et al., [n. d.]), AGILE (Nguyen et al., [n. d.]) and the work by Gmach et al. (Gmach et al., [n. d.]) predict future resource needs online, often without a priori knowledge. Finally, auto-scaling systems, such as Rightscale (rightscale, [n. d.]), automatically scale the number of physical or virtual instances used by webserving workloads, to accommodate changes in user load.
A second line of work tries to identify resources that will allow a new, potentially-unknown application to meet its performance (throughput or tail latency) requirements (Delimitrou and Kozyrakis, [n. d.]b, [n. d.]c; Delimitrou et al., [n. d.]; Delimitrou and Kozyrakis, [n. d.]e; Mars et al., [n. d.]; Nathuji et al., [n. d.]a; Yang et al., [n. d.]). Paragon uses classification to determine the impact of platform heterogeneity and workload interference on an unknown, incoming workload (Delimitrou and Kozyrakis, [n. d.]b, [n. d.]a). It then uses this information to achieve predictable performance, and high cluster utilization. Paragon, assumes that the cluster manager has full control over all resources, which is often not the case in public clouds. Quasar extends the use of data mining in cluster management by additionally determining the appropriate amount of resources for a new application. Nathuji et al. developed a feedback-based scheme that tunes resource assignments to mitigate memory interference (Nathuji et al., [n. d.]b). Yang et al. developed an online scheme that detects memory pressure and finds colocations that avoid interference on latency-sensitive workloads (Yang et al., [n. d.]). Similarly, DeepDive detects and manages interference between co-scheduled workloads in a VM environment (Novakovic et al., [n. d.]).
Finally, CPI2 (Zhang and Reiter, [n. d.]) throttles low-priority workloads that introduce destructive interference to important, latency-critical services, using low-level metrics of performance collected through Google-Wide Profiling (GWP). In terms of managing platform heterogeneity, Nathuji et al. (Nathuji et al., [n. d.]a) and Mars et al. (Mars and Tang, [n. d.]) quantified its impact on conventional benchmarks and Google services, and designed schemes to predict the most appropriate servers for a workload.
**Cloud tracing & diagnostics: ** There is extensive related work on monitoring systems that has shown that execution traces can help diagnose performance, efficiency, and even security problems in large-scale systems (Fonseca et al., 2007; Chow et al., 2014; Yu et al., 2016; Xu et al., 2016; Sigelman et al., 2010; Reiss et al., [n. d.]; Baek et al., [n. d.]; Da Cunha Rodrigues et al., 2016; Jayathilaka et al., 2017). For example, X-Trace is a tracing framework that provides a comprehensive view of the behavior of services running on large-scale, potentially shared clusters. X-Trace supports several protocols and software systems, and has been deployed in several real-world scenarios, including DNS resolution, and a photo-hosting site (Fonseca et al., 2007). The Mystery Machine, on the other hand, leverages the massive amount of monitoring data cloud systems collect to determine the causal relationship between different requests (Chow et al., 2014). Cloudseer serves a similar purpose, building an automaton for the workflow of each task based on normal execution, and then compares against this automaton at runtime to determine if the workflow has diverged from its expected behavior (Yu et al., 2016). Finally, there are several production systems, including Dapper (Sigelman et al., 2010), GWP (Ren et al., 2010), and Zipkin (zip, [n. d.]) which provide the tracing infrastructure for large-scale productions services at Google and Twitter, respectively. Dapper and Zipkin trace distributed user requests at RPC granularity, while GWP focuses on low-level hardware monitoring diagnostics.
Root cause analysis of performance abnormalities in the cloud has also gained increased attention over the past few years, as the number of interactive, latency-critical services hosted in cloud systems has increased. Jayathilaka et al. (Jayathilaka et al., 2017), for example, developed Roots, a system that automatically identifies the root cause of performance anomalies in web applications deployed in Platform-as-a-Service (PaaS) clouds. Roots tracks events within the PaaS cloud using a combination of metadata injection and platform-level instrumentation. Weng et al. (Weng et al., [n. d.]) similarly explore the cloud provider’s ability to diagnose the root cause of performance abnormalities in multi-tier applications. Finally, Ouyang et al. (Ouyang et al., [n. d.]) focus on the root cause analysis of straggler tasks in distributed programming frameworks, like MapReduce and Spark.
Even though this work does not specifically target interactive, latency-critical microservices, or applications of similar granularity, such examples provide promising evidence that data-driven performance diagnostics can improve a large-scale system’s ability to identify performance anomalies, and address them to meet its performance guarantees.
3. End-to-End Applications with Microservices
We motivate and evaluate Seer with a set of new end-to-end, interactive services built with microservices. Even though there are open-source microservices that can serve as components of a larger application, such as nginx (ngi, [n. d.]), memcached (Fitzpatrick, [n. d.]), MongoDB (mon, [n. d.]), Xapian (Kasture and Sanchez, 2016), and RabbitMQ (rab, [n. d.]), there are currently no publicly-available end-to-end microservices applications, with the exception of a few simple architectures, like Go-microservices (gom, [n. d.]), and Sockshop (soc, [n. d.]). We design four end-to-end services implementing a Social Network, a Media Service, an E-commerce Site, and a Banking System. Starting from the Go-microservices architecture (gom, [n. d.]), we also develop an end-to-end Hotel Reservation system. Services are designed to be representative of frameworks used in production systems, modular, and easily reconfigurable. The end-to-end applications and tracing infrastructure are described in more detail and open-sourced in (Gan et al., 2019).
Table 1 briefly shows the characteristics of each end-to-end application, including its communication protocol, the number of unique microservices it includes, and its breakdown by programming language and framework. Unless otherwise noted, all microservices are deployed in Docker containers. Below, we briefly describe the scope and functionality of each service.
3.1. Social Network
**Scope: ** The end-to-end service implements a broadcast-style social network with uni-directional follow relationships.
**Functionality: **Fig. 4 shows the architecture of the end-to-end service. Users (client) send requests over http, which first reach a load balancer, implemented with nginx, which selects a specific webserver is selected, also in nginx. Users can create posts embedded with text, media, links, and tags to other users, which are then broadcasted to all their followers. Users can also read, favorite, and repost posts, as well as reply publicly, or send a direct message to another user. The application also includes machine learning plugins, such as ads and user recommender engines (Bottou, [n. d.]; Bell et al., 2007; Witten et al., [n. d.]; Kiwiel, [n. d.]), a search service using Xapian (Kasture and Sanchez, 2016), and microservices that allow users to follow, unfollow, or block other accounts. Inter-microservice messages use Apache Thrift RPCs (thr, [n. d.]). The service’s backend uses memcached for caching, and MongoDB for persistently storing posts, user profiles, media, and user recommendations. This service is broadly deployed at Cornell and elsewhere, and currently has several hundred users. We use this installation to test the effectiveness and scalability of Seer in Section 6.
3.2. Media Service
**Scope: ** The application implements an end-to-end service for browsing movie information, as well as reviewing, rating, renting, and streaming movies (Adrian Cockroft, [n. d.]; Coc, 2016).
**Functionality: ** As with the social network, a client request hits the load balancer which distributes requests among multiple nginx webservers. The front-end is similar to Social Network, and users can search and browse information about movies, including the plot, photos, videos, and review information, as well as insert a review for a specific movie by logging in to their account. Users can also select to rent a movie, which involves a payment authentication module to verify the user has enough funds, and a video streaming module using nginx-hls, a production nginx module for HTTP live streaming. Movie files are stored in NFS, to avoid the latency and complexity of accessing chunked records from non-relational databases, while reviews are held in memcached and MongoDB instances. Movie information is maintained in a sharded and replicated MySQL DB. We are similarly deploying Media Service as a hosting site for project demos at Cornell, which students can browse and review.
3.3. E-Commerce Service
**Scope: **The service implements an e-commerce site for clothing. The design draws inspiration, and uses several components of the open-source Sockshop application (soc, [n. d.]).
**Functionality: **The application front-end here is a node.js service. Clients can use the service to browse the inventory using catalogue, a Go microservice that mines the back-end memcached and MongoDB instances holding information about products. Users can also place orders (Go) by adding items to their cart (Java). After they log in (Go) to their account, they can select shipping options (Java), process their payment (Go), and obtain an invoice (Java) for their order. Orders are serialized and committed using QueueMaster (Go). Finally, the service includes a recommender engine (C++), and microservices for creating wishlists (Java).
3.4. Banking System
**Scope: **The service implements a secure banking system, supporting payments, loans, and credit card management.
**Functionality: **Users interface with a node.js front-end, similar to E-commerce, to login to their account, search information about the bank, or contact a representative. Once logged in, a user can process a payment from their account, pay their credit card or request a new one, request a loan, and obtain information about wealth management options. Most microservices are written in Java and Javascript. The back-end databases are memcached and MongoDB instances. The service also has a relational database (BankInfoDB) that includes information about the bank, its services, and representatives.
3.5. Hotel Reservation Site
**Scope: **The service is an online hotel reservation site for browsing information about hotels, and making reservations.
**Functionality: **The service is based on the Go-microservices open-source project (gom, [n. d.]), augmented with backend databases, and machine learning widgets for advertisement and hotel recommendations. A client request is first directed to one of the front-end webservers in node.js by a load balancer. The front-end then interfaces with the search engine, which allows users to explore hotel availability in a given region, and place a reservation. The service back-end consists of memcached and MongoDB instances.
4. Seer Design
4.1. Overview
Fig. 6 shows the high-level architecture of the system. Seer is an online performance debugging system for cloud systems hosting interactive, latency-critical services. Even though we are focusing our analysis on microservices, where the impact of QoS violations is more severe, Seer is also applicable to general cloud services, and traditional multi-tier or Service-Oriented Architecture (SOA) workloads. Seer uses two levels of tracing, shown in Fig. 7.
First, it uses a lightweight, distributed RPC-level tracing system, described in Sec. 4.2, which collects end-to-end execution traces for each user request, including per-tier latency and outstanding requests, associates RPCs belonging to the same end-to-end request, and aggregates them to a centralized Cassandra database (TraceDB). From there traces are used to train Seer to recognize patterns in space (between microservices) and time that lead to QoS violations. At runtime, Seer consumes real-time streaming traces to infer whether there is an imminent QoS violation.
When a QoS violation is expected to occur and a culprit microservice has been located, Seer uses its lower tracing level, which consists of detailed per-node, low-level hardware monitoring primitives, such as performance counters, to identify the reason behind the QoS violation. It also uses this information to provide the cluster manager with recommendations on how to avoid the performance degradation altogether. When Seer runs on a public cloud where performance counters are disabled, it uses a set of tunable microbenchmarks to determine the source of unpredictable performance (see Sec. 4.4). Using two specialized tracing levels instead of collecting detailed low-level traces for all active microservices ensures that the distributed tracing is lightweight enough to track all active requests and services in the system, and that detailed low-level hardware tracing is only used on-demand, for microservices likely to cause performance disruptions. In the following sections we describe the design of the tracing system, the learning techniques in Seer and its low-level diagnostic framework, and the system insights we can draw from Seer’s decisions to improve cloud application design.
4.2. Distributed Tracing
A major challenge with microservices is that one cannot simply rely on the client to report performance, as with traditional client-server applications. We have developed a distributed tracing system for Seer, similar in design to Dapper (Sigelman et al., 2010) and Zipkin (zip, [n. d.]) that records per-microservice latencies, using the Thrift timing interface, as shown in Fig. 8. We additionally track the number of requests queued in each microservice (outstanding requests), since queue lengths are highly correlated with performance and QoS violations (Kasture and Sanchez, 2014; Gross et al., [n. d.]; Geng et al., [n. d.]; Yu et al., [n. d.]). In all cases, the overhead from tracing without request sampling is negligible, less than on end-to-end latency, and less than on throughput (QPS), which is tolerable for such systems (Sigelman et al., 2010; Chow et al., 2014; Ren et al., 2010). Traces from all microservices are aggregated in a centralized database (Cassandra, [n. d.]).
**Instrumentation: **The tracing system requires two types of application instrumentation. First, to distinguish between the time spent processing network requests, and the time that goes towards application computation, we instrument the application to report the time it sees a new request (post-RPC processing). We similarly instrument the transmit side of the application. Second, systems have multiple sources of queueing in both hardware and software. To obtain accurate measurements of queue lengths per microservice, we need to account for these different queues. Fig. 8 shows an example of Seer’s instrumentation for memcached. Memcached includes five main stages (Leverich and Kozyrakis, [n. d.]), TCP/IP receive, epoll/libevent, reading the request from the socket, processing the request, and responding over TCP/IP, either with the <k,v> pair for a read, or with an ack for a write. Each of these stages includes a hardware (NIC) or software (epoll,socket read,memcached proc) queue. For the NIC queues, Seer filters packets based on the destination microservice, but accounts for the aggregate queue length if hardware queues are shared, since that will impact how fast a microservice’s packets get processed. For the software queues, Seer inserts probes in the application to read the number of queued requests in each case.
**Limited instrumentation: **As seen above, accounting for all sources of queueing in a complex system requires non-trivial instrumentation. This can become cumbersome if users leverage third-party applications in their services, or in the case of public cloud providers which do not have access to the source code of externally-submitted applications for instrumentation. In these cases Seer relies on the requests queued exclusively in the NIC to signal upcoming QoS violations. In Section 5 we compare the accuracy of the full versus limited instrumentation, and see that using network queue depths alone is enough to signal a large fraction of QoS violations, although smaller than when the full instrumentation is available. Exclusively polling NIC queues identifies hotspots caused by routing, incast, failures, and resource saturation, but misses QoS violations that are caused by performance and efficiency bugs in the application implementation, such as blocking behavior between microservices. Signaling such bugs helps developers better understand the microservices model, and results in better application design.
**Inferring queue lengths: ** Additionally, there has been recent work on using deep learning to reverse engineer the number of queued requests in switches across a large network topology (Geng et al., [n. d.]), when tracing information is incomplete. Such techniques are also applicable and beneficial for Seer when the default level of instrumentation is not available.
4.3. Deep Learning in Performance Debugging
A popular way to model performance in cloud systems, especially when there are dependencies between tasks, are queueing networks (Gross et al., [n. d.]). Although queueing networks are a valuable tool to model how bottlenecks propagate through the system, they require in-depth knowledge of application semantics and structure, and can become overly complex as applications and systems scale. They additionally cannot easily capture all sources of contention, such as the OS and network stack.
Instead in Seer, we take a data-driven, application-agnostic approach that assumes no information about the structure and bottlenecks of a service, making it robust to unknown and changing applications, and relying instead on practical learning techniques to infer patterns that lead to QoS violations. This includes both spatial patterns, such as dependencies between microservices, and temporal patterns, such as input load, and resource contention. The key idea in Seer is that conditions that led to QoS violations in the past can be used to anticipate unpredictable performance in the near future. Seer uses execution traces annotated with QoS violations and collected over time to train a deep neural network to signal upcoming QoS violations. Below we describe the structure of the neural network, why deep learning is well-suited for this problem, and how Seer adapts to changes in application structure online.
**Using deep learning: **Although deep learning is not the only approach that can be used for proactive QoS violation detection, there are several reasons why it is preferable in this case. First, the problem Seer must solve is a pattern matching problem of recognizing conditions that result in QoS violations, where the patterns are not always known in advance or easy to annotate. This is a more complicated task than simply signaling a microservice with many enqueued requests, for which simpler classification, regression, or sequence labeling techniques would suffice (Bell et al., 2007; Bottou, [n. d.]; Witten et al., [n. d.]). Second, the DNN in Seer assumes no a priori knowledge about dependencies between individual microservices, making it applicable to frequently-updated services, where describing changes is cumbersome or even difficult for the user to know. Third, deep learning has been shown to be especially effective in pattern recognition problems with massive datasets, e.g., in image or text recognition (Abadi et al., [n. d.]). Finally, as we show in the validation section (Sec. 5), deep learning allows Seer to recognize QoS violations with high accuracy in practice, and within the opportunity window the cluster manager has to apply corrective actions.
**Configuring the DNN: **The input used in the network is essential for its accuracy. We have experimented with resource utilization, latency, and queue depths as input metrics. Consistent with prior work, utilization is not a good proxy for performance (Lo et al., [n. d.]a; Kasture and Sanchez, 2014; Delimitrou and Kozyrakis, [n. d.]b, 2016). Latency similarly leads to many false positives, or to incorrectly pinpointing computationally-intensive microservices as QoS violation culprits. Again consistent with queueing theory (Gross et al., [n. d.]) and prior work (Geng et al., [n. d.]; Kasture and Sanchez, 2014; Delimitrou et al., 2015; Delimitrou and Kozyrakis, [n. d.]e, 2018), per-microservice queue depths accurately capture performance bottlenecks and pinpoint the microservices causing them. We compare against utilization-based approaches in Section 5. The number of input and output neurons is equal to the number of active microservices in the cluster, with the input value corresponding to queue depths, and the output value to the probability for a given microservice to initiate a QoS violation. Input neurons are ordered according to the topological application structure, with dependent microservices corresponding to consecutive neurons to capture hotspot patterns in space. Input traces are annotated with the microservices that caused QoS violations in the past.
The choice of DNN architecture is also instrumental to its accuracy. There are three main DNN designs that are popular today: fully connected networks (FC), convolutional neural networks (CNN), and recurrent neural networks (RNN), especially their Long Short-Term Memory (LSTM) class. For Seer to be effective in improving performance predictability, inference needs to occur with enough slack for the cluster manager’s action to take effect. Hence, we focus on the more computationally-efficient CNN and LSTM networks. CNNs are especially effective at reducing the dimensionality of large datasets, and finding patterns in space, e.g., in image recognition. LSTMs, on the other hand, are particularly effective at finding patterns in time, e.g., predicting tomorrow’s weather based on today’s measurements. Signaling QoS violations in a large cluster requires both spatial recognition, namely identifying problematic clusters of microservices whose dependencies cause QoS violations and discarding noisy but non-critical microservices, and temporal recognition, namely using past QoS violations to anticipate future ones. We compare three network designs, a CNN, a LSTM, and a hybrid network that combines the two, using the CNN first to reduce the dimensionality and filter out microservices that do not affect end-to-end performance, and then an LSTM with a SoftMax final layer to infer the probability for each microservice to initiate a QoS violation. The architecture of the hybrid network is shown in Fig. 9. Each network is configured using hyperparameter tuning to avoid overfitting, and the final parameters are shown in Table 2.
We train each network on a week’s worth of trace data collected on a 20-server cluster running all end-to-end services (for methodology details see Sec. 5) and test it on traces collected on a different week, after the servers had been patched, and the OS had been upgraded.
The quantitative comparison of the three networks is shown in Fig. 10. The CNN is by far the fastest, but also the worst performing, since it is not designed to recognize patterns in time that lead to QoS violations. The LSTM on the other hand is especially effective at capturing load patterns over time, but is less effective at reducing the dimensionality of the original dataset, which makes it prone to false positives due to microservices with many outstanding requests, which are off the critical path. It also incurs higher overheads for inference than the CNN. Finally, Seer correctly anticipates 93.45% of violations, outperforming both networks, for a small increase in inference time compared to LSTM. Given that most resource partitioning decisions take effect after a few 100ms, the inference time for Seer is within the window of opportunity the cluster manager has to take action. More importantly it attributes the QoS violation to the correct microservice, simplifying the cluster manager’s task. QoS violations missed by Seer included four random load spikes, and a network switch failure which caused high packet drops.
Out of the five end-to-end services, the one most prone to QoS violations initially was Social Network, first, because it has stricter QoS constraints than e.g., E-commerce, and second, due to a synchronous and cyclic communication between three neighboring services that caused them to enter a positive feedback loop until saturation. We reimplemented the communication protocol between them post-detection. On the other hand, the service for which QoS violations were hardest to detect was Media Service, because of a faulty memory bandwidth partitioning mechanism in one of our servers, which resulted in widely inconsistent memory bandwidth allocations during movie streaming. Since the QoS violation only occurred when the specific streaming microservice was scheduled on the faulty node, it was hard for Seer to collect enough datapoints to signal the violation.
**Retraining Seer: **By default training happens once, and can be time consuming, taking several hours up to a day for week-long traces collected on our 20-server cluster (Sec. 5 includes a detailed sensitivity study for training time). However, one of the main advantages of microservices is that they simplify frequent application updates, with old microservices often swapped out and replaced by newer modules, or large services progressively broken down to microservices. If the application (or underlying hardware) change significantly, Seer’s detection accuracy can be impacted. To adjust to changes in the execution environment, Seer retrains incrementally in the background, using the transfer learning-based approach in (Sarwar et al., [n. d.]). Weights from previous training rounds are stored in disk, allowing the model to continue training from where it last left off when new data arrive, reducing the training time by 2-3 orders of magnitude. Even though this approach allows Seer to handle application changes almost in real-time, it is not a long-term solution, since new weights are still polluted by the previous application architecture. When the application changes in a major way, e.g., microservices on the critical path change, Seer also retrains from scratch in the background. While the new network trains, QoS violation detection happens with the incrementally-trained interim model. In Section 5, we evaluate Seer’s ability to adjust its estimations to application changes.
4.4. Hardware Monitoring
Once a QoS violation is signaled and a culprit microservice is pinpointed, Seer uses low-level monitoring to identify the reason behind the QoS violation. The exact process depends on whether Seer has access to performance counters.
**Private cluster: **When Seer has access to hardware events, such as performance counters, it uses them to determine the utilization of different shared resources. Note that even though utilization is a problematic metric for anticipating QoS violations in a large-scale service, once a culprit microservice has been identified, examining the utilization of different resources can provide useful hints to the cluster manager on suitable decisions to avoid degraded performance. Seer specifically examines CPU, memory capacity and bandwidth, network bandwidth, cache contention, and storage I/O bandwidth when prioritizing a resource to adjust. Once the saturated resource is identified, Seer notifies the cluster manager to take action.
**Public cluster: **When Seer does not have access to performance counters, it instead uses a set of 10 tunable contentious microbenchmarks, each of them targeting a different shared resource (Delimitrou and Kozyrakis, [n. d.]a) to determine resource saturation. For example, if Seer injects the memory bandwidth microbenchmark in the system, and tunes up its intensity without an impact on the co-scheduled microservice’s performance, memory bandwidth is most likely not the resource that needs to be adjusted. Seer starts from microbenchmarks corresponding to core resources, and progressively moves to resources further away from the core, until it sees a substantial change in performance when running the microbenchmark. Each microbenchmark takes approximately 10ms to complete, avoiding prolonged degraded performance.
Upon identifying the problematic resource(s), Seer notifies the cluster manager, which takes one of several resource allocation actions, resizing the Docker container, or using mechanisms like Intel’s Cache Allocation Technology (CAT) for last level cache (LLC) partitioning, and the Linux traffic control’s hierarchical token bucket (HTB) queueing discipline in qdisc (Brown, [n. d.]; Lo et al., [n. d.]b) for network bandwidth partitioning.
4.5. System Insights from Seer
Using learning-based, data-driven approaches in systems is most useful when these techniques are used to gain insight into system problems, instead of treating them as black boxes. Section 5 includes an analysis of the causes behind QoS violations signaled by Seer, including application bugs, poor resource provisioning decisions, and hardware failures. Furthermore, we have deployed Seer in a large installation of the Social Network service over the past few months, and its output has been instrumental not only in guaranteeing QoS, but in understanding sources of unpredictable performance, and improving the application design. This has resulted both in progressively fewer QoS violations over time, and a better understanding of the design challenges of microservices.
4.6. Implementation
Seer is implemented in 12KLOC of C,C++, and Python. It runs on Linux and OSX and supports applications in various languages, including all frameworks the end-to-end services are designed in. Furthermore, we provide automated patches for the instrumentation probes for many popular microservices, including NGINX, memcached, MongoDB, Xapian, and all Sockshop and Go-microservices applications to minimize the development effort from the user’s perspective.
Seer is a centralized system; we use master-slave mirroring to improve fault tolerance, with two hot stand-by masters that can take over if the primary system fails. Similarly, the trace database is also replicated in the background.
**Security concerns: **Trace data is stored and processed unencrypted in Cassandra. Previous work has shown that the sensitivity applications have to different resources can leak information about their nature and characteristics, making them vulnerable to malicious security attacks (Delimitrou and Kozyrakis, 2017; Zhao and Suh, [n. d.]; Huang et al., [n. d.]; Xu et al., [n. d.]; Gupta and Kumar, [n. d.]; Darwish et al., [n. d.]; Varadarajan et al., [n. d.]a, [n. d.]b; Shue et al., [n. d.]). Similar attacks are possible using the data and techniques in Seer, and are deferred to future work.
5. Seer Analysis and Validation
5.1. Methodology
**Server clusters: **First, we use a dedicated local cluster with 20, 2-socket 40-core servers with 128GB of RAM each. Each server is connected to a 40Gbps ToR switch over 10Gbe NICs. Second, we deploy the Social Network service to Google Compute Engine (GCE) and Windows Azure clusters with hundreds of servers to study the scalability of Seer.
**Applications: **We use all five end-to-end services of Table 1. Services for now are driven by open-loop workload generators, and the input load varies from constant, to diurnal, to load with spikes in user demand. In Section 6 we study Seer in a real large-scale deployment of the Social Network; in that case the input load is driven by real user traffic.
5.2. Evaluation
**Sensitivity to training data: **Fig. 11a shows the detection accuracy and training time for Seer as we increase the size of the training dataset. The size of the dots is a function of the dataset size. Training data is collected from the 20-server cluster described above, across different load levels, placement strategies, time intervals, and request types. The smallest training set size (100MB) is collected over ten minutes of the cluster operating at high utilization, while the largest dataset (1TB) is collected over almost two months of continuous deployment. As datasets grow Seer’s accuracy increases, leveling off at 100-200GB. Beyond that point accuracy does not further increase, while the time needed for training grows significantly. Unless otherwise specified, we use the 100GB training dataset.
**Sensitivity to tracing frequency: **By default the distributed tracing system instantaneously collects the latency of every single user request. Collecting queue depth statistics, on the other hand, is a per-microservice iterative process. Fig. 11b shows how Seer’s accuracy changes as we vary the frequency with which we collect queue depth statistics. Waiting for a long time before sampling queues, e.g., , can result in undetected QoS violations before Seer gets a chance to process the incoming traces. In contrast, sampling queues very frequently results in unnecessarily many inferences, and runs the risk of increasing the tracing overhead. For the remainder of this work, we use as the interval for measuring queue depths across microservices.
**False negatives & false positives: **Fig. 12a shows the percentage of false negatives and false positives as we vary the prediction window. When Seer tries to anticipate QoS violations that will occur in the next 10-100ms both false positives and false negatives are low, since Seer uses a very recent snapshot of the cluster state to anticipate performance unpredictability. If inference was instantaneous, very short prediction windows would always be better. However, given that inference takes several milliseconds and more importantly, applying corrective actions to avoid QoS violations takes 10-100s of milliseconds to take effect, such short windows defy the point of proactive QoS violation detection. At the other end, predicting far into the future results in significant false negatives, and especially false positives. This is because many QoS violations are caused by very short, bursty events that do not have an impact on queue lengths until a few milliseconds before the violation occurs. Therefore requiring Seer to predict one or more seconds into the future means that normal queue depths are annotated as QoS violations, resulting in many false positives. Unless otherwise specified we use a 100ms prediction window.
**Comparison of debugging systems: **Fig. 12b compares Seer with a utilization-based performance debugging system that uses resource saturation as the trigger to signal a QoS violation, and two systems that only use a fraction of Seer’s instrumentation. App-only exclusively uses queues measured via application instrumentation (not network queues), while Network-only uses queues in the NIC, and ignores application-level queueing. We also show the ground truth for the total number of upcoming QoS violations (96 over a two-week period), and break it down by the reason that led to unpredictable performance.
A large fraction of QoS violations are due to application-level inefficiencies, including correctness bugs, unnecessary synchronization and/or blocking behavior between microservices (including two cases of deadlocks), and misconfigured iptables rules, which caused packet drops. An equally large fraction of QoS violations are due to compute contention, followed by contention in the network, cache and memory contention, and finally disk. Since the only persistent microservices are the back-end databases, it is reasonable that disk accounts for a small fraction of overall QoS violations.
Seer accurately follows this breakdown for the most part, only missing a few QoS violations due to random load spikes, including one caused by a switch failure. The App-only system correctly identifies application-level sources of unpredictable performance, but misses the majority of system-related issues, especially in uncore resources. On the other hand, Network-only correctly identifies the vast majority of network-related issues, as well as most of the core- and uncore-driven QoS violations, but misses several application-level issues. The difference between Network-only and Seer is small, suggesting that one could omit the application-level instrumentation in favor of a simpler design. While this system is still effective in capturing QoS violations, it is less useful in providing feedback to application developers on how to improve their design to avoid QoS violations in the future. Finally, the utilization-based system behaves the worst, missing most violations not caused by CPU saturation.
Out of the 89 QoS violations Seer detects, it notifies the cluster manager early enough to avoid 84 of them. The QoS violations that were not avoided correspond to application-level bugs, which cannot be easily corrected online. Since this is a private cluster, Seer uses utilization metrics and performance counters to identify problematic resources.
**Retraining: **Fig. 13 shows the detection accuracy for Seer, and the tail latency for each end-to-end service, over a period of time during which Social Network is getting frequently and substantially updated. This includes new microservices being added to the service, such as the ability to place an order from an ad using the orders microservice of E-commerce, or the back-end of the service changing from MongoDB to Cassandra, and the front-end switching from nginx to the node.js front-end of E-commerce. These are changes that fundamentally affect the application’s behavior, throughput, latency, and bottlenecks. The other services remain unchanged during this period (Banking was not active during this time, and is omitted from the graph). Blue dots denote correctly-signaled upcoming QoS violations, and red denote QoS violations that were not detected by Seer. All unidentified QoS violations coincide with the application being updated. Shortly after the update Seer incrementally retrains in the background, and starts recovering its accuracy until another major update occurs. Some of the updates have no impact on either performance or Seer’s accuracy, either because they involve microservices off the critical path, or because they are insensitive to resource contention.
The bottom figure shows that unidentified QoS violations indeed result in performance degradation for Social Network, and in some cases for the other end-to-end services, if they are sharing physical resources with Social Network, on an oversubscribed server. Once retraining completes the performance of the service(s) recovers. The longer Seer trains on an evolving application, the more likely it is to correctly anticipate its future QoS violations.
6. Large-Scale Cloud Study
6.1. Seer Scalability
We now deploy our Social Network service on a 100-server dedicated cluster on Google Compute Engine (GCE), and use it to service real user traffic. The application has 582 registered users, with 165 daily active users, and has been deployed for a two-month period. The cluster on average hosts 386 single-concerned containers (one microservice per container), subject to some resource scaling actions by the cluster manager, based on Seer’s feedback.
Accuracy remains high for Seer, consistent with the small-scale experiments. Inference time, however, increases substantially from 11.4ms for the 20-server cluster to 54ms for the 100-server GCE setting. Even though this is still sufficient for many resource allocation decisions, as the application scales further, Seer’s ability to anticipate a QoS violation within the cluster manager’s window of opportunity diminishes.
Over the past year multiple public cloud providers have exposed hardware acceleration offerings for DNN training and inference, either using a special-purpose design like the Tensor Processing Unit (TPU) from Google (Jouppi et al., 2017), or using reconfigurable FPGAs, like Project Brainwave from Microsoft (Chung et al., 2018). We offload Seer’s DNN logic to both systems, and quantify the impact on training and inference time, and detection accuracy 111Before running on TPUs, we reimplemented our DNN in Tensorflow. We similarly adjust the DNN to the currently-supported designs in Brainwave. . Fig. 14 shows this comparison for a 200GB training dataset. Both the TPU and Project Brainwave dramatically outperform our local implementation, by up to two orders of magnitude. Between the two accelerators, the TPU is more effective in training, consistent with its design objective (Jouppi et al., 2017), while Project Brainwave achieves faster inference. For the remainder of the paper, we run Seer on TPUs, and host the Social Network service on GCE.
6.2. Source of QoS Violations
We now examine which microservice is the most common culprit for a QoS violation. Fig. 15 shows the number of QoS violations caused by each service over the two-month period. The most frequent culprits by far are the in-memory caching tiers in memcached, and Thrift services with high request fanout, such as composePost, readPost, and login. memcached is a justified source of QoS violations, since it is on the critical path for almost all query types, and it is additionally very sensitive to resource contention in compute and to a lesser degree cache and memory. Microservices with high fanout are also expected to initiate QoS violations, as they have to synchronize multiple inbound requests before proceeding. If processing for any incoming requests is delayed, end-to-end performance is likely to suffer. Among these QoS violations, most of memcached’s violations were caused by resource contention, while violations in Thrift services were caused by long synchronization times.
6.3. Seer’s Long-Term Impact on Application Design
Seer has now been deployed in the Social Network cluster for over two months, and in this time it has detected 536 upcoming QoS violations (90.6% accuracy) and avoided 495 (84%) of them. Furthermore, by detecting recurring patterns that lead to QoS violations, Seer has helped the application developers better understand bugs and design decisions that lead to hotspots, such as microservices with a lot of back-and-forth communication between them, or microservices forming cyclic dependencies, or using blocking primitives. This has led to a decreasing number of QoS violations over the two month period (seen in Fig. 16), as the application progressively improves. In days 22 and 23 there was a cluster outage, which is why the reported violations are zero. Systems like Seer can be used not only to improve performance predictability in complex cloud systems, but to help users better understand the design challenges of microservices, as more services transition to this application model.
7. Conclusions
Cloud services increasingly move away from complex monolithic designs, and adopt the model of specialized, loosely-coupled microservices. We presented Seer, a data-driven cloud performance debugging system that leverages practical learning techniques, and the massive amount of tracing data cloud systems collect to proactively detect and avoid QoS violations. We have validated Seer’s accuracy in controlled environments, and evaluated its scalability on large-scale clusters on public clouds. We have also deployed the system in a cluster hosting a social network with hundreds of users. In all scenarios, Seer accurately detects upcoming QoS violations, improving responsiveness and performance predictability. As more services transition to the microservices model, systems like Seer provide practical solutions that can navigate the increasing complexity of the cloud.
The reference list from the paper itself. Each links out to its DOI / PubMed record.
- 1(1)
- 2thr ([n. d.]) [n. d.]. Apache Thrift. https://thrift.apache.org .
- 3twi ([n. d.]) [n. d.]. Decomposing Twitter: Adventures in Service-Oriented Architecture. https://www.slideshare.net/Info Q/decomposing-twitter-adventures-in-serviceoriented-architecture .
- 4gom ([n. d.]) [n. d.]. Golang Microservices Example. https://github.com/harlow/go-micro-services .
- 5rab ([n. d.]) [n. d.]. Messaging that just works. https://www.rabbitmq.com/ .
- 6mon ([n. d.]) [n. d.]. Mongo DB. https://www.mongodb.com .
- 7ngi ([n. d.]) [n. d.]. NGINX. https://nginx.org/en .
- 8soc ([n. d.]) [n. d.]. Sock Shop: A Microservices Demo Application. https://www.weave.works/blog/sock-shop-microservices-demo-application .