TL;DR
This paper demonstrates that incorporating depth maps into visual relation detection significantly enhances performance, especially for under-represented relations, by introducing a new dataset and a novel evaluation metric.
Contribution
It introduces VG-Depth, a synthetic depth map dataset, and a new Macro Recall@K metric, showing depth maps improve relation detection accuracy.
Findings
Depth maps improve relation detection accuracy by up to 8%.
The new Macro Recall@K metric better evaluates under-represented relations.
Depth information helps detect both spatial and non-spatial relations.
Abstract
Visual relation detection methods rely on object information extracted from RGB images such as 2D bounding boxes, feature maps, and predicted class probabilities. We argue that depth maps can additionally provide valuable information on object relations, e.g. helping to detect not only spatial relations, such as standing behind, but also non-spatial relations, such as holding. In this work, we study the effect of using different object features with a focus on depth maps. To enable this study, we release a new synthetic dataset of depth maps, VG-Depth, as an extension to Visual Genome (VG). We also note that given the highly imbalanced distribution of relations in VG, typical evaluation metrics for visual relation detection cannot reveal improvements of under-represented relations. To address this problem, we propose using an additional metric, calling it Macro Recall@K, and demonstrate…
Click any figure to enlarge with its caption.
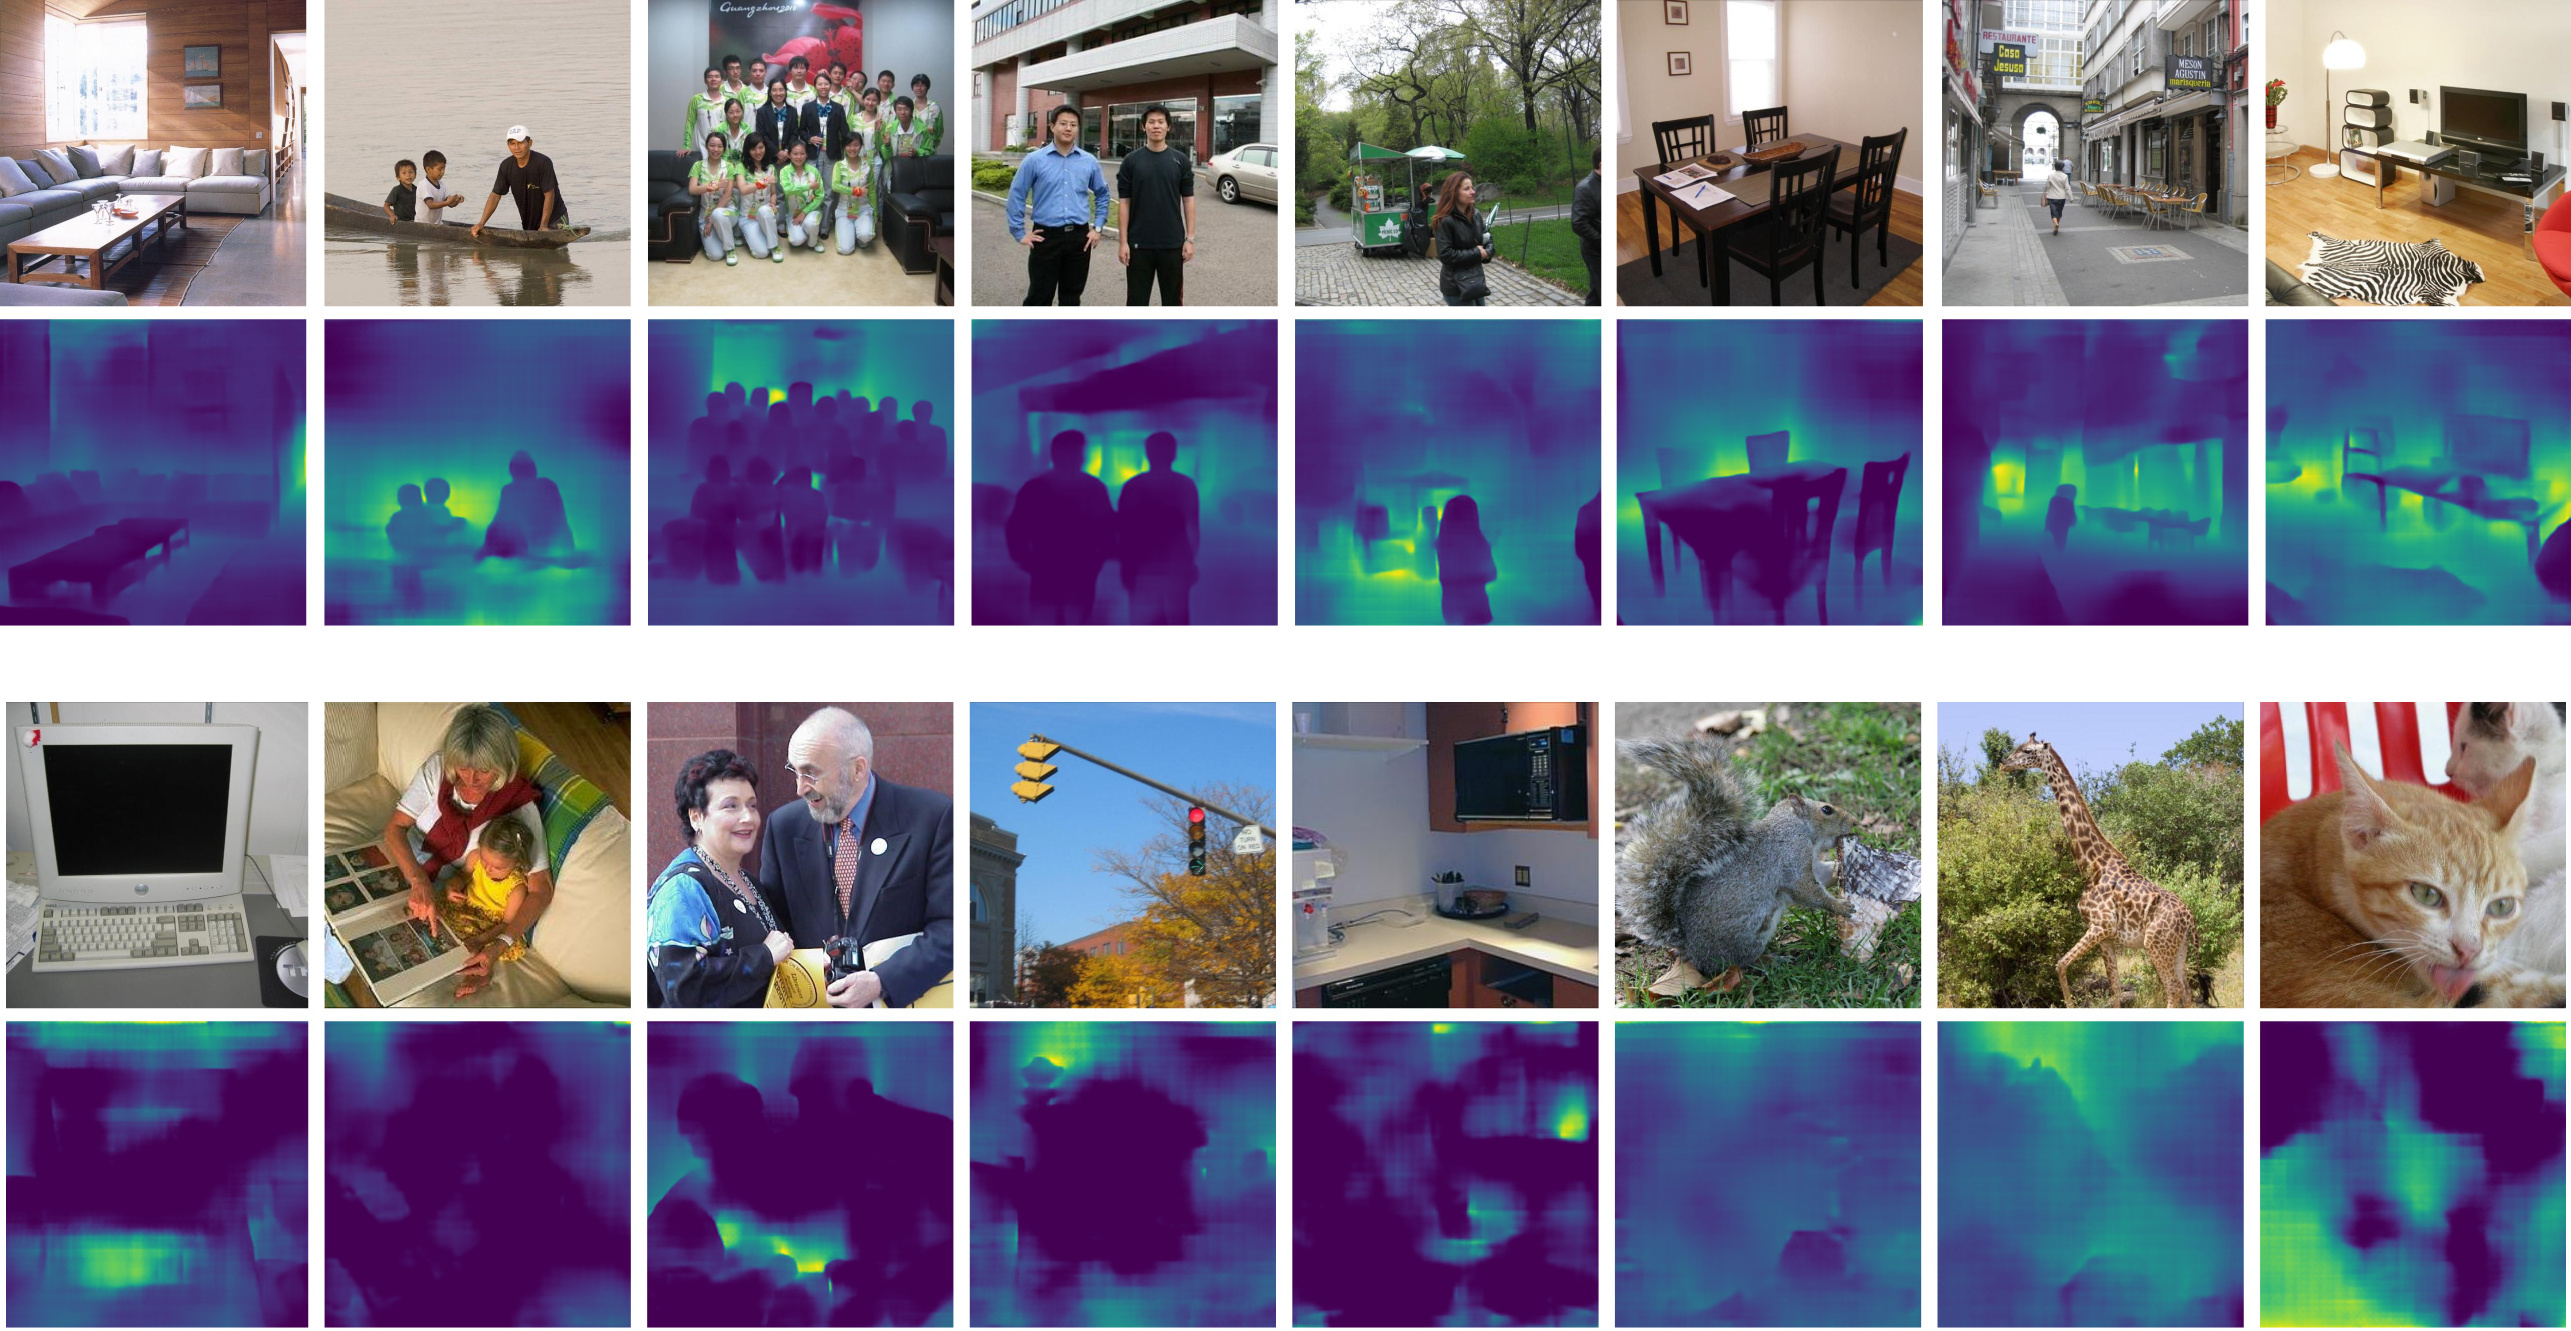 Figure 1
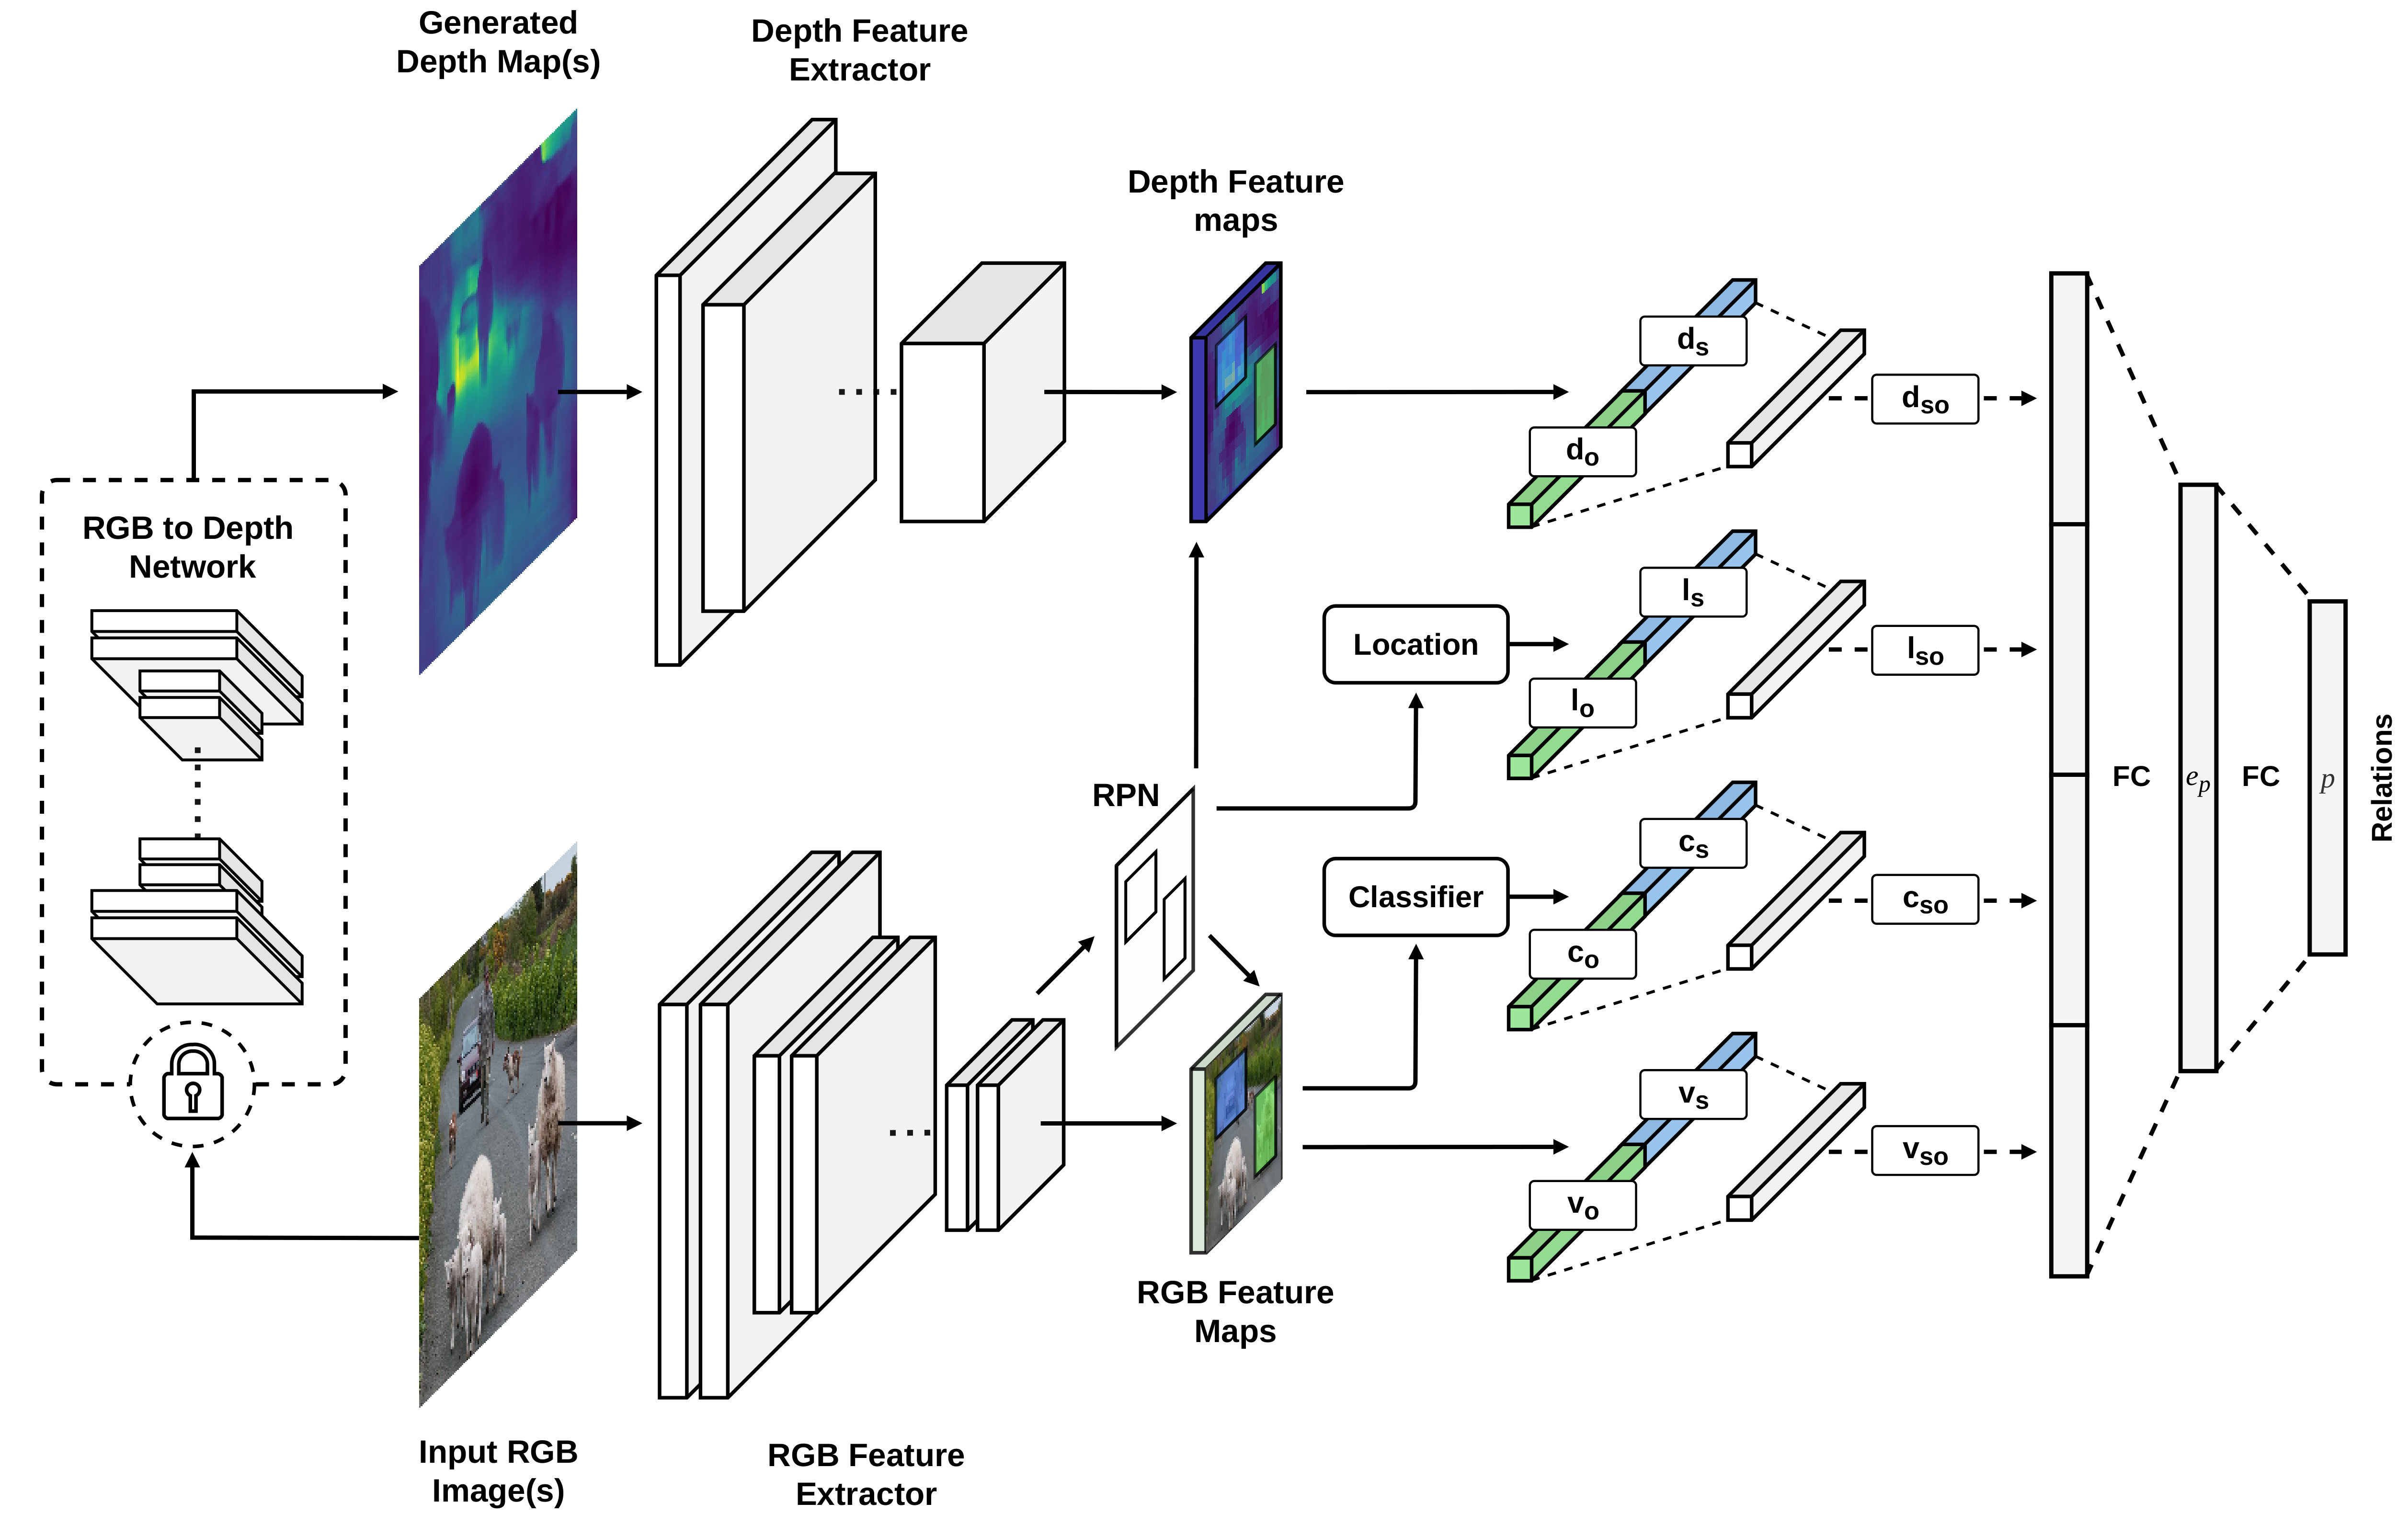 Figure 2
 Figure 3
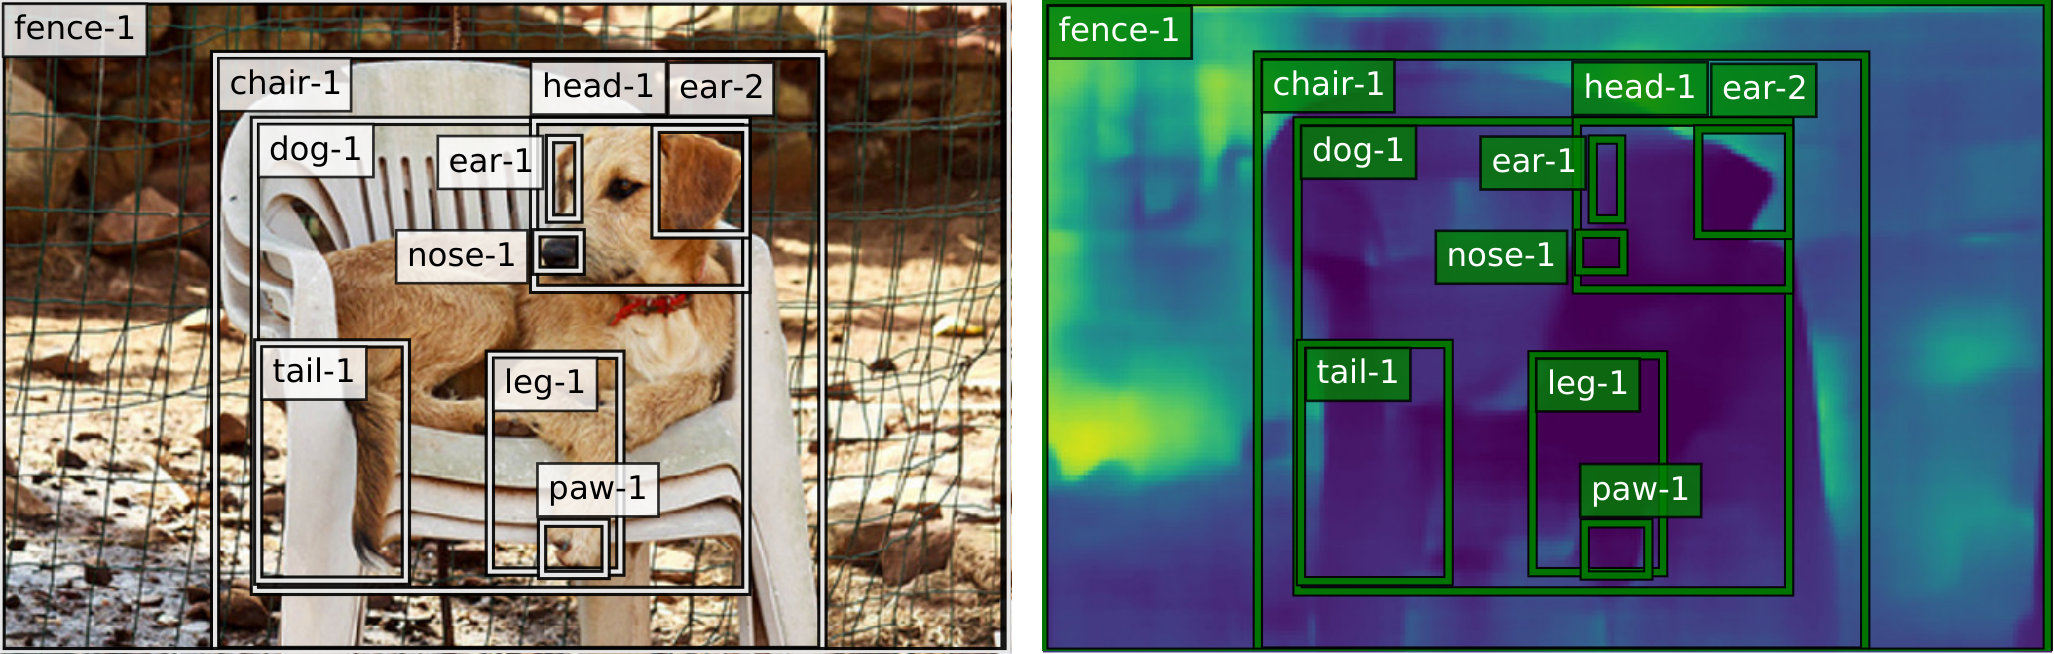 Figure 4
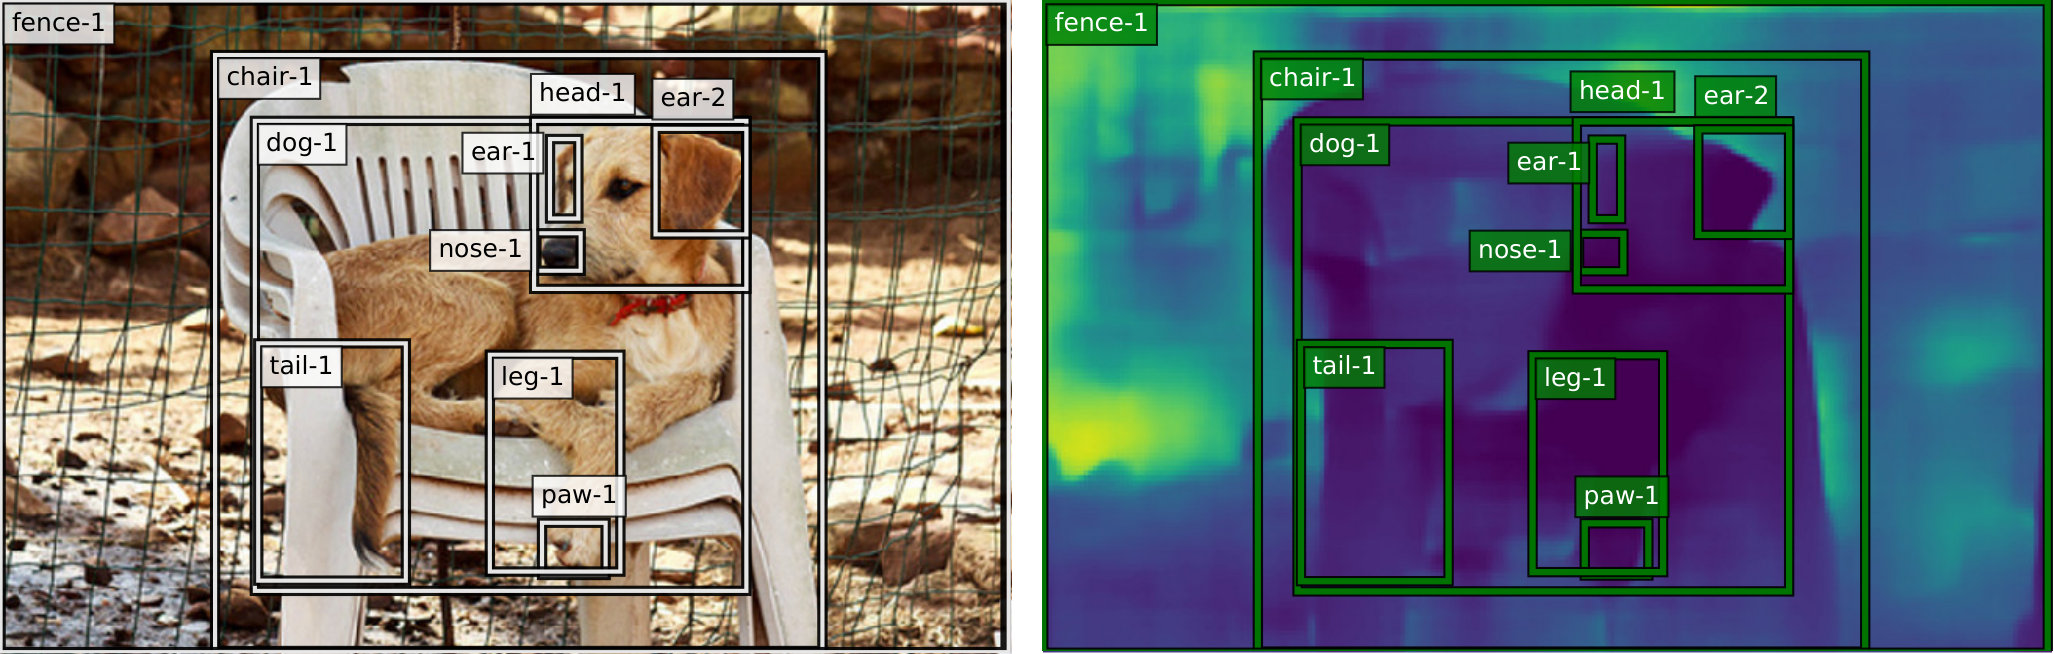 Figure 5
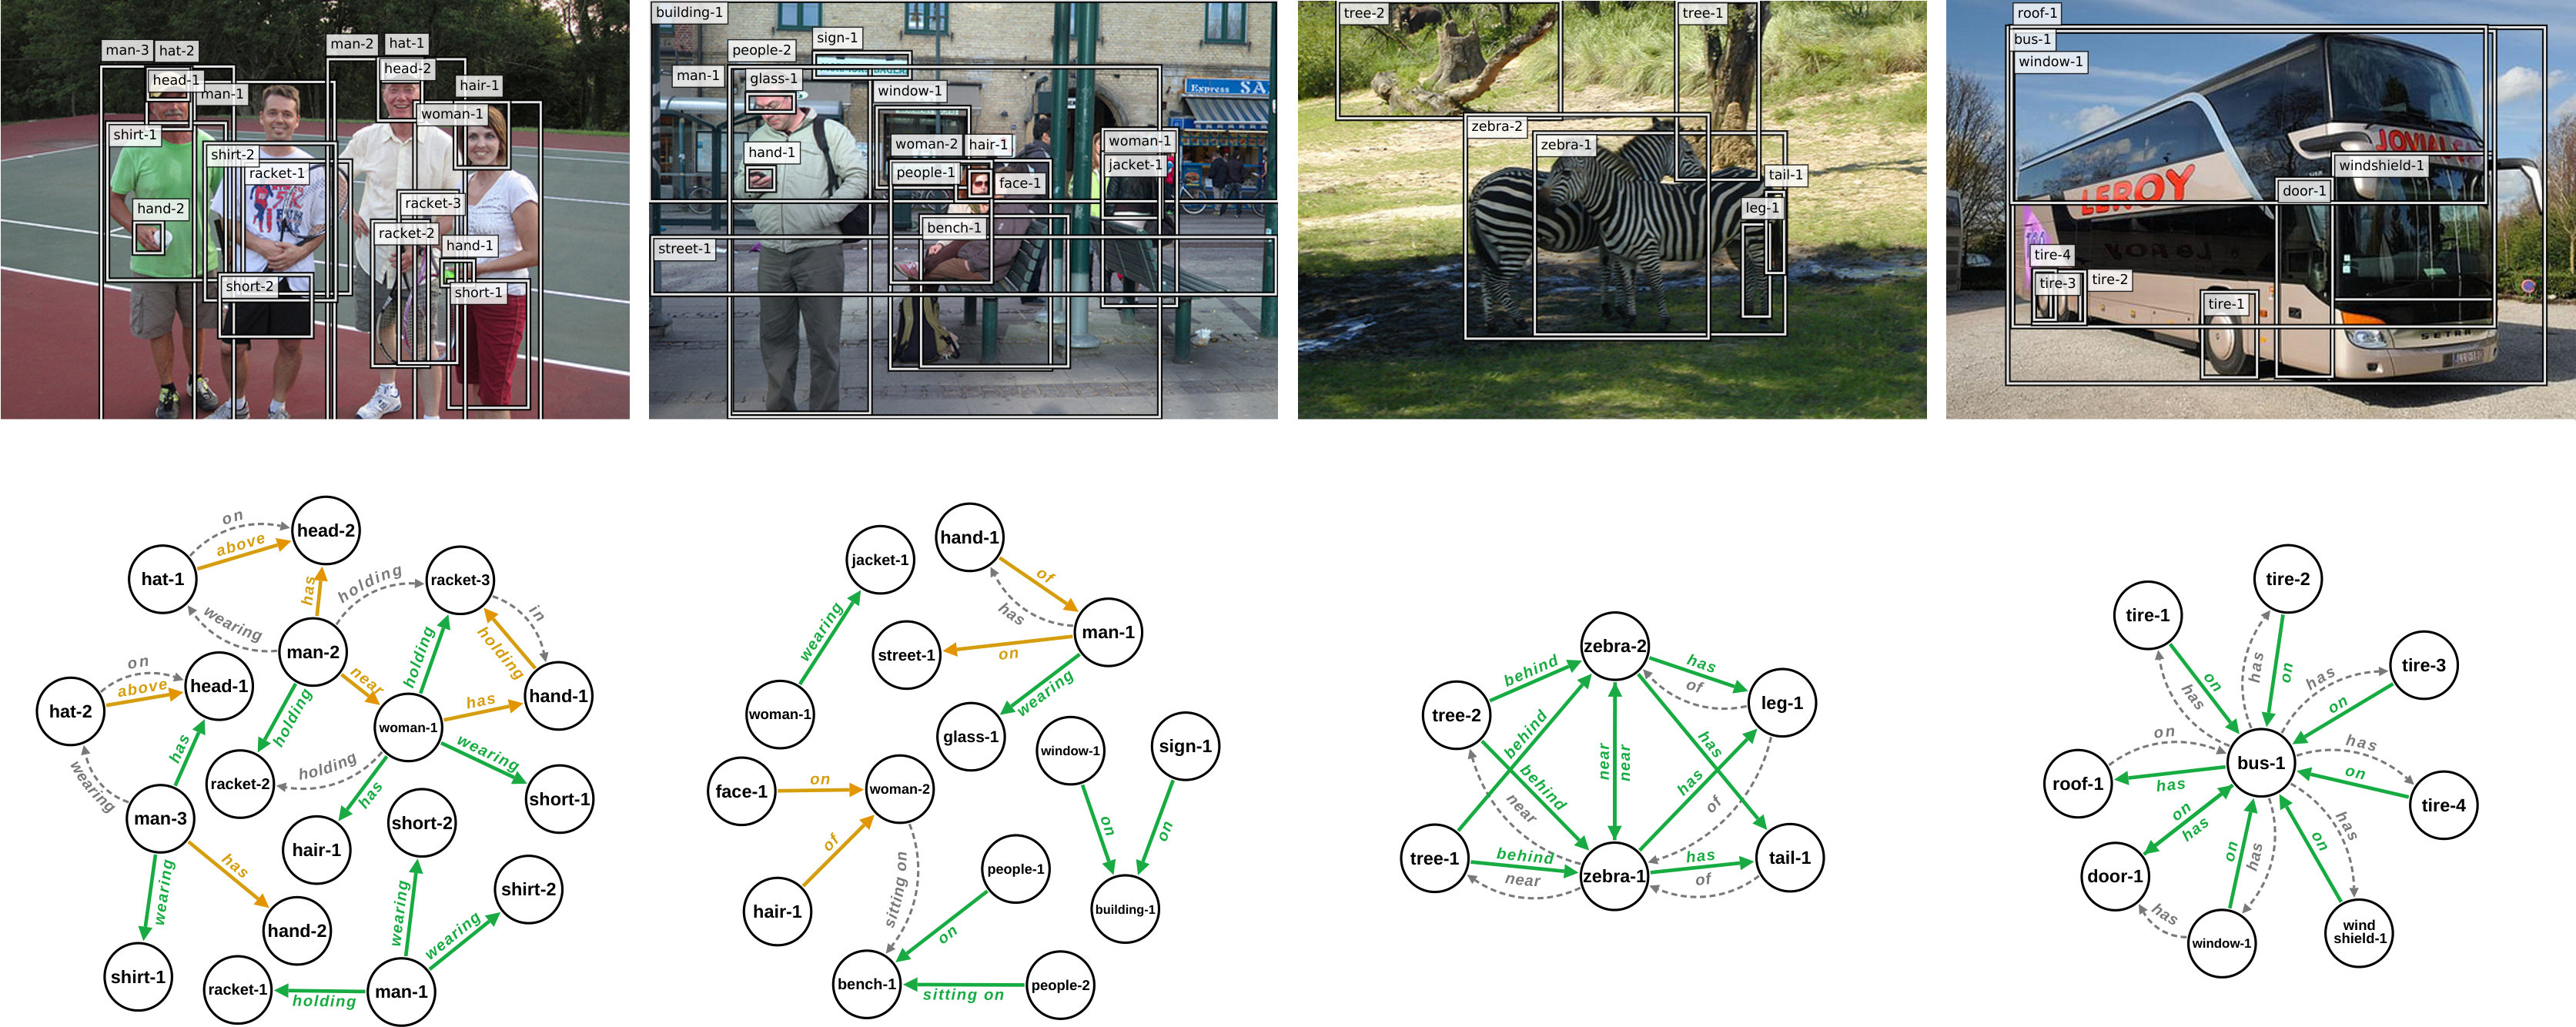 Figure 6
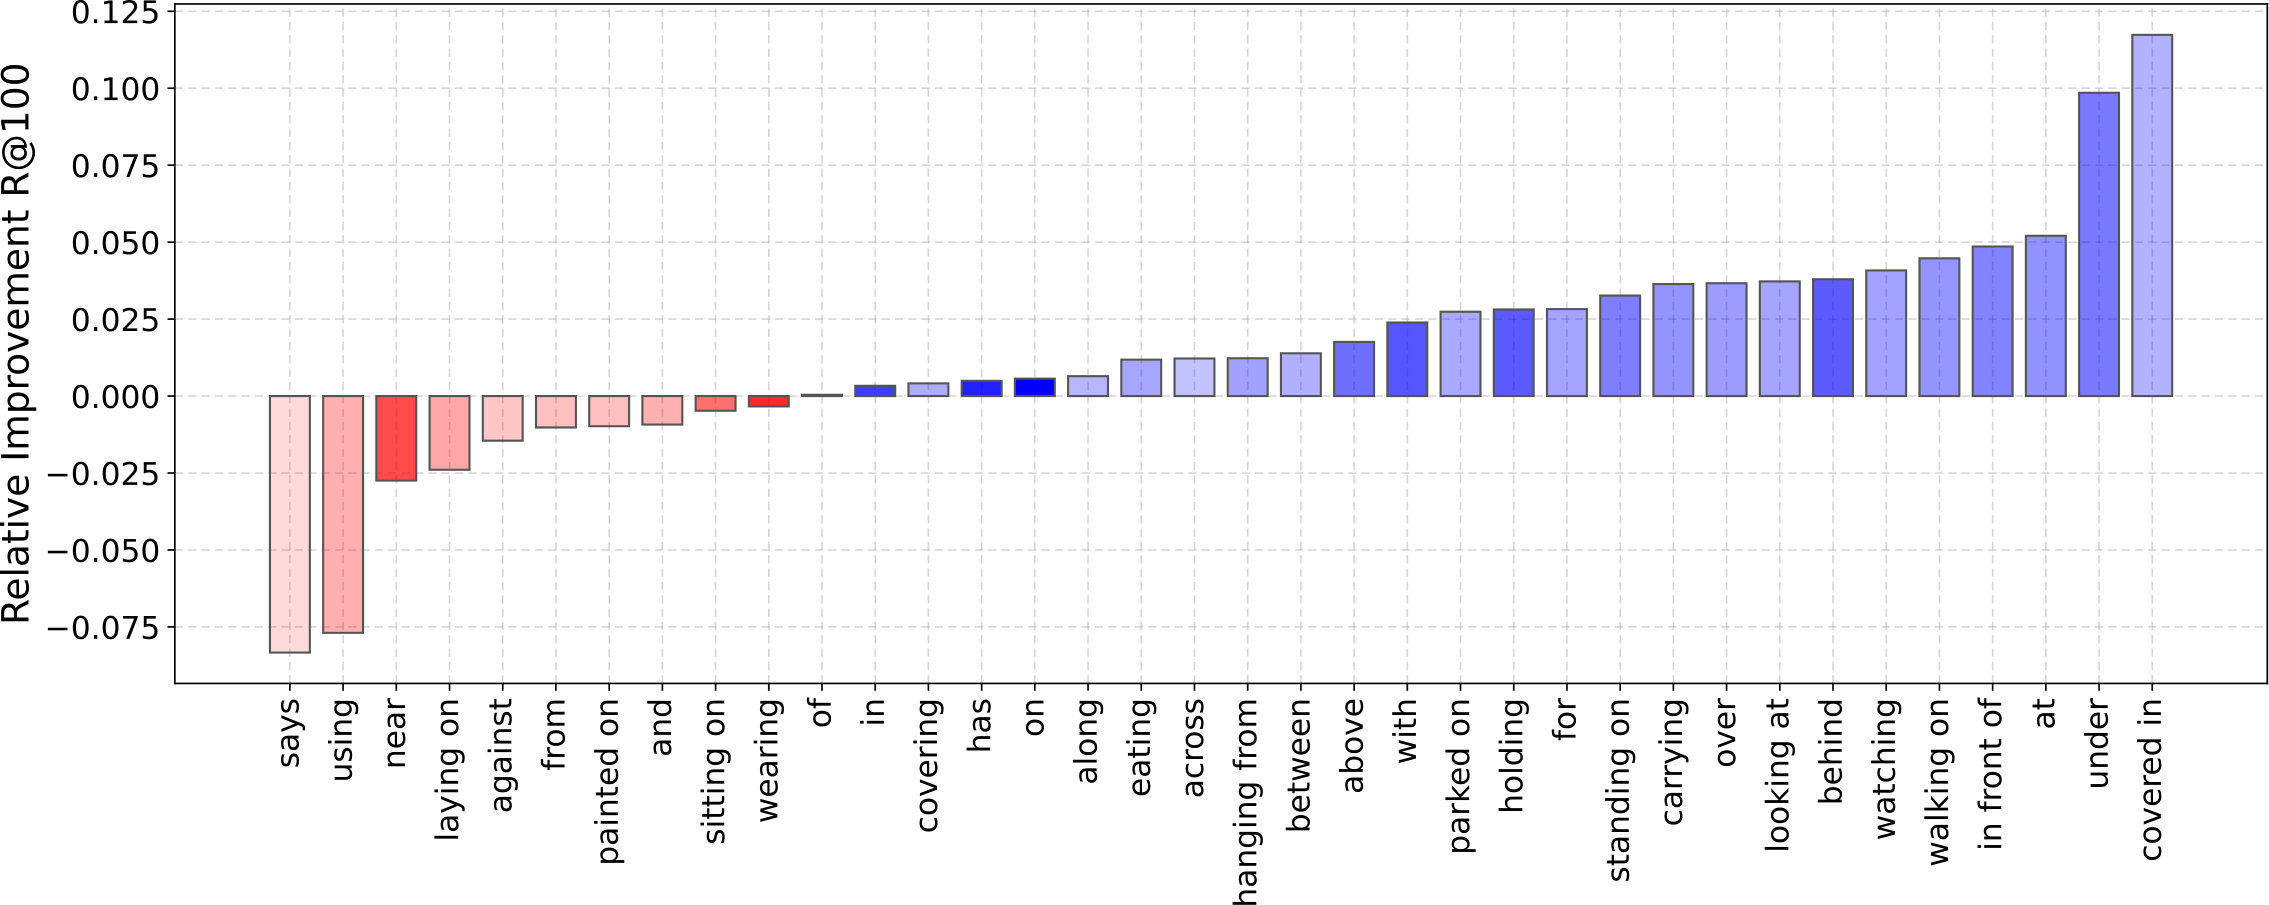 Figure 7
| Strategy | Macro | Micro | |||||
|---|---|---|---|---|---|---|---|
| Task | Predicate Pred. | Predicate Pred. | |||||
| Metric | R@100 | R@50 | R@20 | R@100 | R@50 | R@20 | |
| models | VTransE [27] | - | - | - | 62.87 | 62.63 | - |
| Yu’s-S [15] | - | - | - | 49.88 | - | - | |
| Yu’s-S+T [15] | - | - | - | 55.89 | - | - | |
| IMP [16] | - | - | - | 53.00 | 44.80 | - | |
| Graph R-CNN [18] | - | - | - | 59.10 | 54.20 | - | |
| NM [17] | 14.39 | 13.20 | 10.25 | 67.10 | 65.20 | 58.50 | |
| \hdashline ablations | Ours - | 09.51 | 08.46 | 06.35 | 54.72 | 51.90 | 43.86 |
| Ours - | 15.65 | 13.09 | 08.56 | 64.82 | 60.54 | 49.89 | |
| Ours - | 13.88 | 12.24 | 08.99 | 61.72 | 58.50 | 50.41 | |
| Ours - | 05.19 | 04.66 | 03.57 | 49.07 | 46.13 | 37.48 | |
| Ours - | 15.47 | 14.04 | 10.83 | 62.88 | 60.52 | 53.07 | |
| Ours - | 15.76 | 14.40 | 11.07 | 63.06 | 60.83 | 53.55 | |
| Ours - | 21.67 | 19.56 | 15.12 | 67.97 | 66.09 | 59.13 | |
| Ours - | 19.16 | 17.72 | 13.93 | 67.94 | 66.06 | 59.14 | |
| Ours - | 22.72 | 20.74 | 16.40 | 68.00 | 66.18 | 59.44 | |
Peer Reviews
No public reviews on file for this paper yet. If you reviewed it on a platform where reviews are public (OpenReview, ICLR, NeurIPS, ICML), you can paste yours below so the community can read it here.
Code & Models
Videos
No videos yet. Explain this paper in a talk, walkthrough, or lecture? Add one.
Improving Visual Relation Detection
using Depth Maps
Sahand Sharifzadeh
*Ludwig Maximilian University of Munich
Sina Moayed Baharlou
*Sapienza University of Rome
Max Berrendorf
{@IEEEauthorhalign} Rajat Koner
*Ludwig Maximilian University of Munich
*Ludwig Maximilian University of Munich
Volker Tresp
Ludwig Maximilian University of Munich
*& Siemens AG
Abstract
Visual relation detection methods rely on object information extracted from RGB images such as 2D bounding boxes, feature maps, and predicted class probabilities. We argue that depth maps can additionally provide valuable information on object relations, e.g. helping to detect not only spatial relations, such as standing behind, but also non-spatial relations, such as holding. In this work, we study the effect of using different object features with a focus on depth maps. To enable this study, we release a new synthetic dataset of depth maps, VG-Depth, as an extension to Visual Genome (VG). We also note that given the highly imbalanced distribution of relations in VG, typical evaluation metrics for visual relation detection cannot reveal improvements of under-represented relations. To address this problem, we propose using an additional metric, calling it Macro Recall@K, and demonstrate its remarkable performance on VG. Finally, our experiments confirm that by effective utilization of depth maps within a simple, yet competitive framework, the performance of visual relation detection can be improved by a margin of up to .
Index Terms:
scene graph, visual relation detection, depth maps
I Introduction
Scene Graph Generation, i.e. detecting objects and their relations in images in form of (subject, predicate, object), is a fundamental task in scene understanding and can play an important role in recommender systems, visual question answering, decision making, etc. For example, detecting whether a man is on a bike or next to a bike is a crucial challenge in autonomous driving. Most works in this area rely on image-based object information such as class labels, bounding boxes and RGB features. We argue that depth maps can additionally provide valuable information about an object’s relations as they provide the objects’ distance from the camera. This information can help to distinguish between many relations such as behind, in front of and even improve detection in situations where the objects are nearby such as covered in. Figure 1 shows a successfully detected example of the relation (fence, behind, dog) after employing its depth map, and using our model. The goal of this work is to study the effect of using different object features on visual relation detection, with a focus on depth maps.
Unfortunately, most available image datasets, specifically the ones with relational annotations such as Visual Relation Detection (VRD) [1] and Visual Genome (VG) [2], do not provide depth maps, because the acquisition of depth maps is a cumbersome task requiring specialized hardware. We tackle this issue by synthetically generating the corresponding pseudo depth maps from 2D images of Visual Genome. This is possible thanks to the large corpora of available RGB-D pairs, i.e. NYU-Depth-v2 [3] dataset. Using RGB-D pairs in NYU-Depth-v2 and a fully convolutional neural network, allow us to learn the mapping function of RGB images to their corresponding depth maps. We can then apply this network to the images from VG, generating their corresponding depth maps. We release the depth maps that are generated from VG, as an extention to it, calling it VG-Depth111The dataset and our framework are publicly available at https://github.com/Sina-Baharlou/Depth-VRD.. The object information extracted from depth maps and RGB images, i.e. class labels, location vectors, RGB and depth features, are the basis for relation detection in our simple yet effected framework.
Additionally, we note that the typically employed Recall@K metric (Micro Recall@K), cannot properly reveal the improvements of under-represented relations in highly imbalanced datasets such as VG. This might be an issue in applications such as autonomous driving where it is important to ensure that the model is capable of predicting also important but less represented predicates such as walking on (648 in VG test set) and not just wearing (20,148 in VG test set). We address this issue by proposing to employ Macro Recall@K, where we compute the mean over Micro Recall@K per predicate, thereby eliminating the effect that over-represented classes have in Micro Recall@K setting.
In summary, our contributions are as follows:
We perform an extensive study on the effect of using different sources of object information in visual relation detection. We show in our empirical evaluations using the VG dataset, that our model can outperform competing methods by a margin of up to points, even those using external language sources or contextualization. 2. 2.
We release a new synthetic dataset VG-Depth, to compensate for the lack of depth maps in Visual Genome. 3. 3.
We propose Macro Recall@K as a competitive metric for evaluating the visual relation detection performance in highly imbalanced datasets such as Visual Genome.
II Related Works
Knowledge Graph (KG) Modeling
In Knowledge Graph modeling, the aim is typically to find embeddings or latent representations for entities and predicates, which then can serve to predict the probability of unseen triples. These methods mostly differ in how they model relations. In RESCAL [4] each relation is defined as a transformation in the embedding space of entities, producing a triple probability. TransE [5] employs a similar idea but limits each relation to a translation. In comparison to RESCAL, it has fewer parameters; as a disadvantage, it cannot model symmetric relations. DistMult [6] considers each relation as a vector, similar to TransE, but minimizes the trilinear dot product of subject, predicate and object vector. DistMult can be understood as a form of RESCAL, where the transformation matrix is diagonal. ComplEx [7] extends DistMult to complex-valued vectors of embeddings. A multilayer perceptron (MLP) architecture [8] extends these methods to non-linear transformations and has shown to be competitive to the other discussed approaches on most benchmarks [9, 10]. For an extensive review and study on different KG models refer to [9, 11, 12].
Scene Graph (SG) Generation
SG Generation started with the release of Visual Relation Detection (VRD) [1] and the VG [2]. In VRD, Word2Vec representations of the subject, object, and the predicate were used to train a model jointly with the corresponding image region that describes the predicate. In particular, they consider the joint bounding box of subject and object as the image representation for the predicate. Follow-up work achieved improved performance by incorporating a knowledge graph, constructed from the image annotations [13]. Later, VTransE employed TransE [14] to model visual relations. More recently, Yu et al. [15] proposed a teacher-student model to distill external language knowledge to improve visual relation detection. Iterative Message Passing [16], Neural Motifs [17] (NM) and Graph R-CNN [18] incorporate context within each prediction using RNNs and graph convolutions respectively. For an extensive discussion on the connection between scene graphs and knowledge graphs refer to [19, 20].
Depth Maps
While several works have leveraged depth maps to improve object detection [21, 22, 23], the idea of using depth maps in the relation detection task has only been explored recently: Yang et al. [24] employ a basic framework for visual relation detection, with handcrafted depth map features, i.e. the mean and mode over pixel values of each depth map. They have a limited experimental setting, where they consider only human-centered relations. In this work, we explore the usability of depth maps in a larger domain and using a convolutional neural network for feature extraction. Furthermore, we provide a more extensive study, release a relevant dataset, and propose a more suitable metric.
III Framework
In this section, we introduce the framework that we employed for this study. Let be the set of all entities, including subjects () and objects (), and the set of all predicates. Each entity can appear in images within a bounding box , from an image , where are the coordinates of the bounding box and are its width and height. In this work we apply Faster R-CNN [25], on each image to extract a feature map , together with object proposals as a set of bounding boxes and class probability distributions . For each RGB image, we generate a depth map where the same bounding box areas encompass the entities’ distance from the camera. In the next section, we first describe the synthetic generation of s and then the feature extraction from generated depth maps. In the end, we describe the relation detection module, where the pairwise features are fused and then employed for relation detection.
III-A Depth Maps for Relation Detection
III-A1 Generation
We incorporate an RGB-to-Depth model within our visual relation detection framework. As shown in Figure 2, this is a fully convolutional neural network (CNN) that takes an RGB image as input and generates its predicted depth map. This model can be pre-trained on any datasets containing pairs of RGB and depth maps regardless of having the class annotations for objects or predicates. This enables us to work with the already available visual relation detection datasets without requiring to collect additional data, and also mitigates the need for specialized hardware in real-world applications. The architectural details are explained in Section IV and the generated depth maps from VG are separately released as a dataset called VG-Depth.
III-A2 Feature Extraction
Depth maps have been employed in tasks such as object detection and segmentation [22, 26]. In these works, it is common to simply render a depth map as an RGB image, and extract depth features using a CNN, that has been pre-trained with RGB images (for object detection). They argue that the edges in depth maps might yield better object contours than the edges in cluttered RGB images and that one may combine edges from both RGB and depth to obtain more information [26]. Therefore, they aim to get similar, complementary features from both modalities. However, the practice of employing a model pre-trained on a particular source modality, e.g. RGB, and applying it on a different target modality, e.g. depth map, is sub-optimal in many applications (one should also keep in mind that even fine-tuning some layers of a network does not change the very early convolutional filters). Hence, unlike other works, we train a feature extractor CNN directly on depth maps and specifically for the task of relation detection. Given a depth map , this network generates a feature map . The architectural details of this network is presented in Section IV.
III-B Relation Model
In the previous section, we described methods for the extraction of , , and . Here, we outline the model that infers relations using pairwise combinations of these features. For each pair of detected objects within an image, we create a scale-invariant location feature with: and similarly . We then pool the corresponding features and from and create a visual feature vector . Similarly, we create a depth feature vector , by pooling features from , within and . Additionally, we create and . Each of these vectors are fed into separate fully connected layers, followed by ReLUs, yielding , , and before being fed to the relation head which projects them to the relation space such that:
[TABLE]
Here, describes a linear transformation and is a non-linear function. We realize them as a fully connected layer in a neural network with ReLU activations and dropout. is an embedding vector of pairwise features. This simple relation prediction model is inspired by the work of [8] to predict links in knowledge graphs. Therefore, we call it ERMLP-E, short for ERMLP-Extended. The input of their proposed model is a triple and the output is a single Bernoulli variable, whereas in our work the inputs are subject and object and we have a Bernoulli variable for each predicate class in the output. This gives us fewer parameters compared to that model, and simplifies training by imposing an implicit negative sampling through the cross-entropy loss.
As shown in earlier works, using more sophisticated models for context propagation between objects with RNNs or graph convolutions, can further improve the prediction accuracy. However, the aim here is to study the effect of including depth maps as additional object features in visual relation detection and as will be shown later, even with this simple model, utilizing depth maps can be more effective than e.g. propagating context. Clearly, those other models can also further enrich their understanding of object relations by employing depth maps.
To learn the parameters, we consider each relation (subject, predicate, object) with an associated Bernoulli variable that takes if the triple is observed and [math] otherwise, following a locally closed world assumption [9]. Given the set of observed triples , the loss function is the categorical cross entropy between the one-hot targets and the distribution obtained by softmax over the network’s output defined as:
[TABLE]
where is the weight vector corresponding to in the last layer (linear classification layer).
IV Evaluation
In our study, we are interested to answer the following questions:
If we are given only depth maps of some objects in a scene (and not even object labels), how accurately can we infer the distribution of possible pairwise relations? How do other sources of object information compare to it? 2. 2.
Current visual relation detection frameworks commonly rely on extensive object information such as class labels, bounding boxes, RGB features, contextual information, etc. Do depth representations bring any additional information or would they only contribute redundant scene knowledge?
Additionally, we study whether Recall@K can sufficiently reflect the improvements of under-represented relations within a highly imbalanced dataset such as VG.
In what follows, we introduce the dataset, metrics, architectural details and experiments to answer these questions.
IV-A Dataset
We test our approach on the Visual Genome [2] dataset. We use the more commonly used subset of VG dataset proposed by [16] which contains 150 object classes and 50 relations.
IV-B Metrics
Micro Recall@K
This metric is defined as the mean prediction accuracy in each image given the top predictions and is typically called Recall@K. We assigned the Micro prefix to its name to distinguish this metric with Macro Recall@K. Recall@K is a popular choice in most of the visual relation detection studies. The main reason is the incompleteness of visual relation detection datasets, i.e. some relations might not be annotated in the test set, while due to the model’s generalization, they might get higher prediction values than the annotated ones. This sensitivity is handled by the parameter in Recall@K.
Macro Recall@K
We define this metric as:
[TABLE]
where is set of all relations with predicate , and is computed on . The motivation behind this metric is the highly imbalanced distribution of classes in some datasets such as VG. In these datasets Micro Recall@K score gets dominated by frequently labeled relations and might not reflect the improvements in some important but under-represented classes. However, in Macro R@K, the prediction accuracy of under-represented classes can have a stronger effect on the output. This metric is inspired from the Macro F1 measure [28].
IV-C Architectures
RGB-to-Depth Network
We employ the RGB-to-Depth architecture that has been introduced in [29]. The model is a fully convolutional neural network built on ResNet-50 [30], and trained in an end-to-end fashion on data from NYU Depth Dataset v2 [3]. In our experiments, we also trained the model from the outdoor images of Make3D dataset [31]. However, the model that was trained on this dataset, did not show promising results for relation detection. This observation is not surprising because unlike Visual Genome, Make3D images contain mostly outdoor scenes with very few objects.
RGB Feature Extraction
To extract embeddings and class probabilities of RGB images, we use the VGG-16 architecture [32] pre-trained on ImageNet [33] and fine-tuned on VG by Zellers et al. [17].
Depth Map Feature Extraction
For depth map extraction we use ResNet-18 proposed in [30]. We trained this model from scratch following the earlier discussions in Subsection III-A2. This network was trained separate from other inputs and on a pure depth-based, relation detection task using Adam [34], with a learning rate of and batch size of 32 for 30 epochs.
Relation Detection Network
In relation detection head, each extracted feature pair goes to a separate, fully connected hidden layer of 64 neurons (12K learnable weights) for class probabilities, 512 for RGB feature maps (4M learnable weights), 4096 for depth feature maps (4M learnable weights) and 20 for location features (160 learnable weights). Each of them with a dropout rate of 0.1, 0.8, 0.6 and 0.1. The concatenated outputs are then connected to a fully connected hidden layer of 4096 neurons with 0.1 dropout and then to the classification layer. We trained this network by Adam [34], with a learning rate of . We used a batch size of 16 and 30 epochs of training. All of the layers were initialized with Xavier weights [35].
IV-D Comparing Methods
We compare our results with VTransE [27] that takes visual embeddings and projects them to relation space using TransE. We also compare to the student network of [15] (Yu’s-S), and their full model (Yu’s-S+T) that employs external language data from Wikipedia. From the context propagating methods, we report Neural Motifs [17], Graph R-CNN [18] and IMP [16]. In an ablation study, we report our relation prediction results under several settings in which different combinations of object information are employed for prediction.
IV-E Experiments
As our main goal is to investigate the role of depth maps and other features in relation detection, we report predicate prediction results. In this setting, the relation detection performance is analyzed by isolating it from the object detector’s error. Therefore, the goal is to evaluate the relation detection accuracy given the objects in an image. We carried on our experiments by training each model 8 times with different random seeds. The maximum variance of the results was no more than 0.01. The results are shown in Table I. In what follows, we provide a discussion over the quantitative and qualitative results.
The upper part of the table demonstrates the results directly reported from other works while the lower part presents the results from the ablation study on our model. For NM, we have computed the Macro R@K results using their publicly available code. We can see that our full model with depth maps, achieves the highest accuracy in comparison to the others in all settings. It is also interesting to note that when using only depth maps we can already achieve a significant accuracy in predicate prediction, emphasizing the value of relational information that are stored within the depth maps alone. By comparing Ours- to Ours-, we can observe the improvements that depth maps bring. Also comparing Ours- to Ours- is specially informative from two aspects: (1) It shows that while some results are almost equal in Micro settings, one can observe a significant difference in the Macro setting, demonstrating the effectiveness of this metric in presenting the improvements of under-represented classes. (2) We observe that alone has a higher R@K than alone. However, when we add them separately to we can see that has more to offer. In other words, brings more redundant information to compared to . To get a better intuition of the improvements that we gain after including depth maps (Ours- compared to Ours-), we plotted the changes in prediction accuracy for each predicate in Figure 4. We used darker shades for over-represented classes and lighter shades for under-represented ones. This helps to also gain a better intuition of improvement versus frequency of data. For example we can see that in general the accuracy of relations including the predicates such as under, in front of and behind has been improved. These predicates appear much less often in the dataset than on or has, having less effect in the computed Micro accuracy. Figure 5 presents some samples of synthetically generated depth maps in VG-Depth dataset including both high quality and faulty ones. Additionally, we present some of the predicted relations by our model in Figure 3.
V Conclusion
We employed an RGB-to-Depth network, trained on a large corpus of data, to generate depth maps for Visual Genome dataset, releasing a new extension called VG-Depth. We provided a metric, Macro R@K for better evaluation of relation detection in Visual Genome and other highly imbalanced datasets. In extensive empirical evaluations, we demonstrated the effect of different object features in visual relation detection and showed that by using depth information, we achieve significantly better performance compared to other state-of-the-art methods.
VI Acknowledgements
We thank Evgeniy Faerman, Vaheh Hatami, Alireza Ghazaei and the anonymous reviewers for their fruitful comments. This work was supported by the BMBF as part of the project MLWin (01IS18050).
The reference list from the paper itself. Each links out to its DOI / PubMed record.
- 1[1] C. Lu, R. Krishna, M. Bernstein, and L. Fei-Fei, “Visual relationship detection with language priors,” in European Conference on Computer Vision . Springer, 2016, pp. 852–869.
- 2[2] R. Krishna, Y. Zhu, O. Groth, J. Johnson, K. Hata, J. Kravitz, S. Chen, Y. Kalantidis, L.-J. Li, D. A. Shamma et al. , “Visual genome: Connecting language and vision using crowdsourced dense image annotations,” International Journal of Computer Vision , vol. 123, no. 1, pp. 32–73, 2017.
- 3[3] P. K. Nathan Silberman, Derek Hoiem and R. Fergus, “Indoor segmentation and support inference from rgbd images,” in ECCV , 2012.
- 4[4] M. Nickel, V. Tresp, and H.-P. Kriegel, “A three-way model for collective learning on multi-relational data.” in ICML , vol. 11, 2011, pp. 809–816.
- 5[5] A. Bordes, N. Usunier, A. Garcia-Duran, J. Weston, and O. Yakhnenko, “Translating embeddings for modeling multi-relational data,” in Advances in Neural Information Processing Systems 26 , C. J. C. Burges, L. Bottou, M. Welling, Z. Ghahramani, and K. Q. Weinberger, Eds. Curran Associates, Inc., 2013, pp. 2787–2795. [Online]. Available: http://papers.nips.cc/paper/5071-translating-embeddings-for-modeling-multi-relational-data.pdf
- 6[6] B. Yang, W.-t. Yih, X. He, J. Gao, and L. Deng, “Embedding entities and relations for learning and inference in knowledge bases,” ar Xiv preprint ar Xiv:1412.6575 , 2014.
- 7[7] T. Trouillon, J. Welbl, S. Riedel, É. Gaussier, and G. Bouchard, “Complex embeddings for simple link prediction,” in International Conference on Machine Learning , 2016, pp. 2071–2080.
- 8[8] X. Dong, E. Gabrilovich, G. Heitz, W. Horn, N. Lao, K. Murphy, T. Strohmann, S. Sun, and W. Zhang, “Knowledge vault: A web-scale approach to probabilistic knowledge fusion,” in Proceedings of the 20th ACM SIGKDD international conference on Knowledge discovery and data mining . ACM, 2014, pp. 601–610.
