ASKAP Commissioning Observations of the GAMA 23 Field
Denis A. Leahy, A.M. Hopkins, R. P. Norris, J. Marvil, J.D. Collier,, E.N. Taylor, J.R. Allison, C. Anderson, M. Bell, M. Bilicki, J., Bland-Hawthorn, S. Brough, M.J.I. Brown, S. Driver, G. Gurkan, L., Harvey-Smith, I. Heywood, B.W. Holwerda, J. Liske, A. R. Lopez-Sanchez, D.

TL;DR
This paper reports on ASKAP's commissioning observations of the GAMA 23 field, validating telescope performance and analyzing galaxy populations, including AGN identification through multi-wavelength data, with results consistent with expectations.
Contribution
First detailed radio survey of the GAMA 23 field during ASKAP commissioning, combining radio, optical, and IR data to study galaxy and AGN properties.
Findings
ASKAP detected radio sources match expected properties.
Radio galaxies tend to have higher stellar mass and luminosity.
Optical and IR AGN diagnostics disagree for about 30% of galaxies.
Abstract
We have observed the G23 field of the Galaxy And Mass Assembly (GAMA) survey using the Australian Square Kilometre Array Pathfinder (ASKAP) in its commissioning phase, to validate the performance of the telescope and to characterize the detected galaxy populations. This observation covers 48 deg with synthesized beam of 32.7 by 17.8 at 936 MHz, and 39 deg with synthesized beam of 15.8 by 12.0 at 1320 MHz. At both frequencies, the r.m.s. (root-mean-square) noise is 0.1 mJy/beam. We combine these radio observations with the GAMA galaxy data, which includes spectroscopy of galaxies that are i-band selected with a magnitude limit of 19.2. Wide-field Infrared Survey Explorer (WISE) infrared (IR) photometry is used to determine which galaxies host an active galactic nucleus (AGN). In properties…
Click any figure to enlarge with its caption.
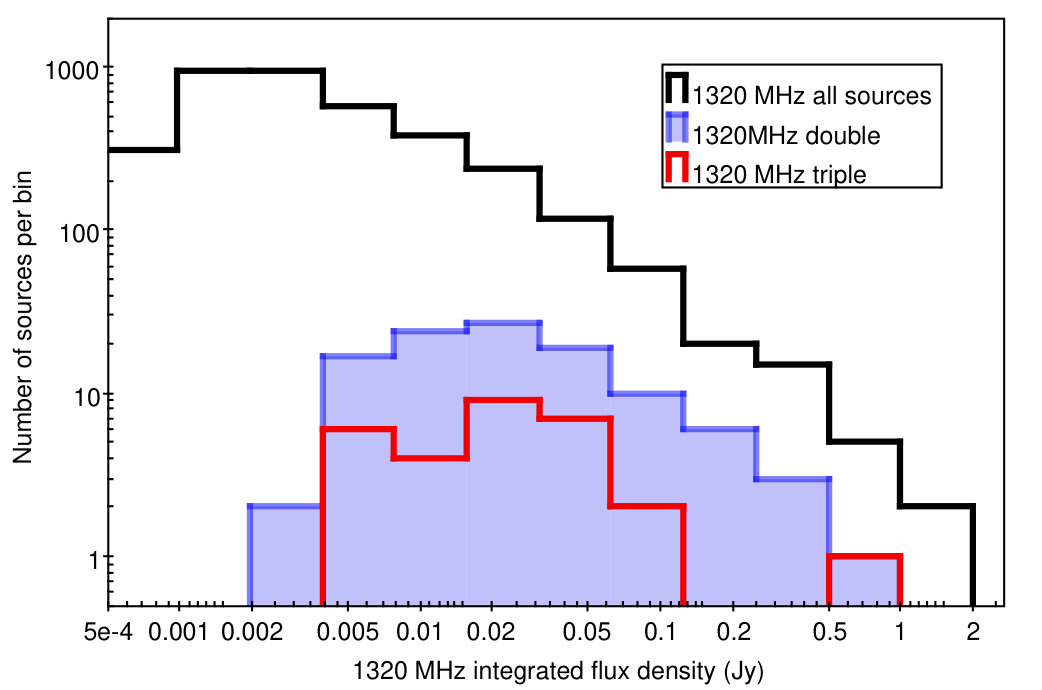 Figure 1
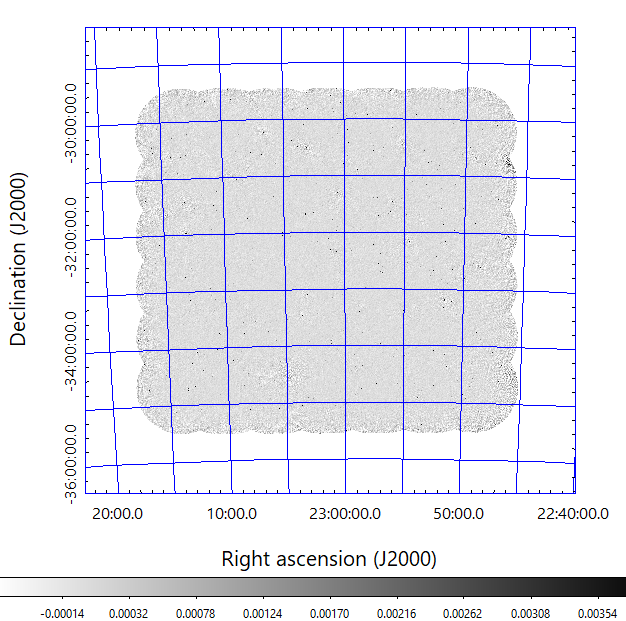 Figure 2
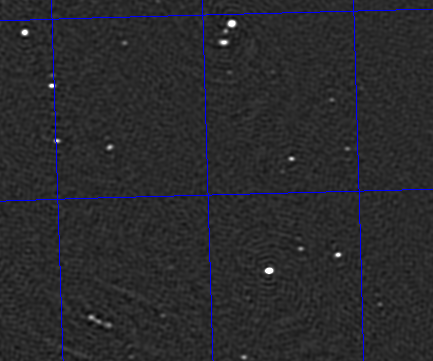 Figure 3
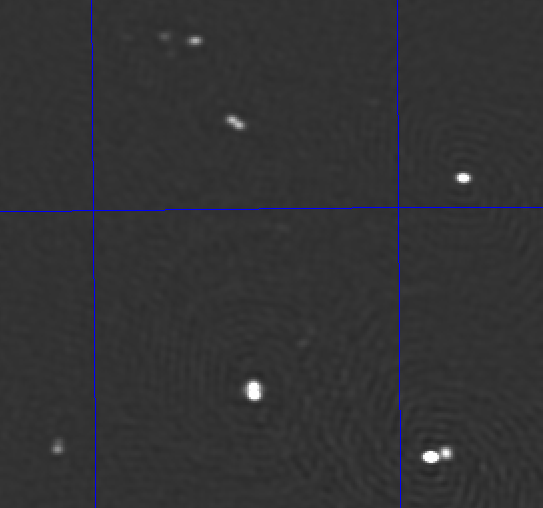 Figure 4
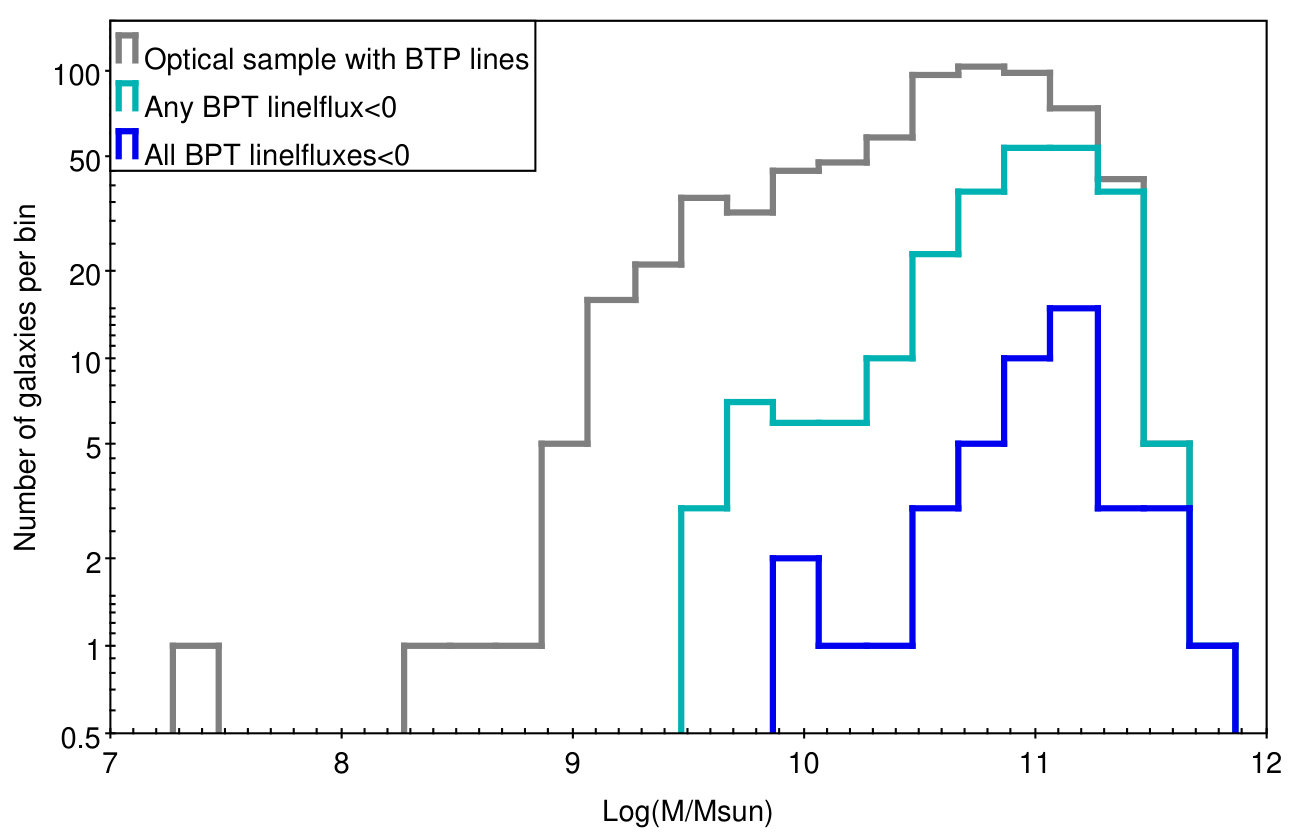 Figure 5
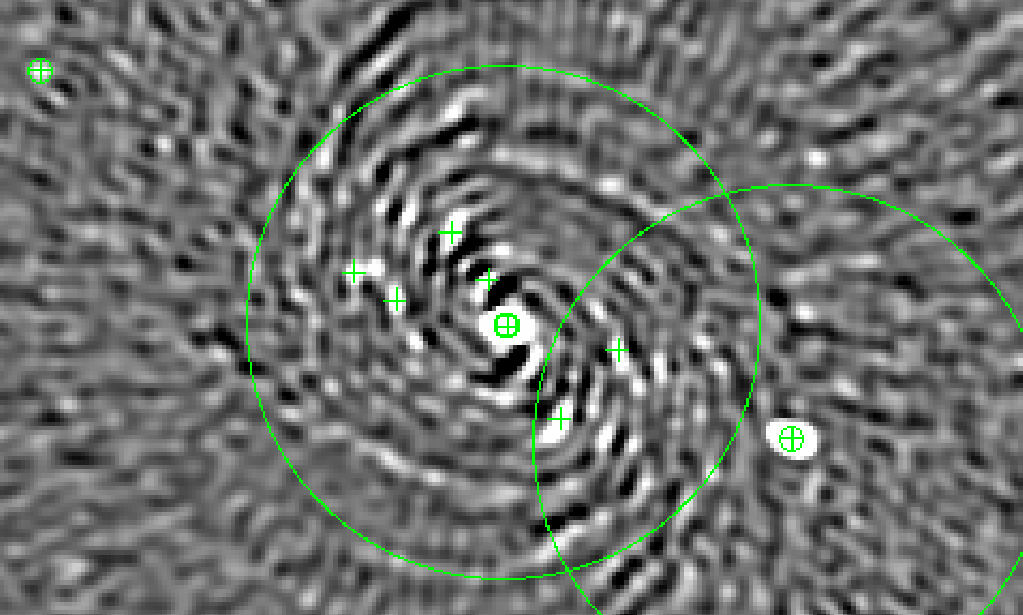 Figure 6
 Figure 7
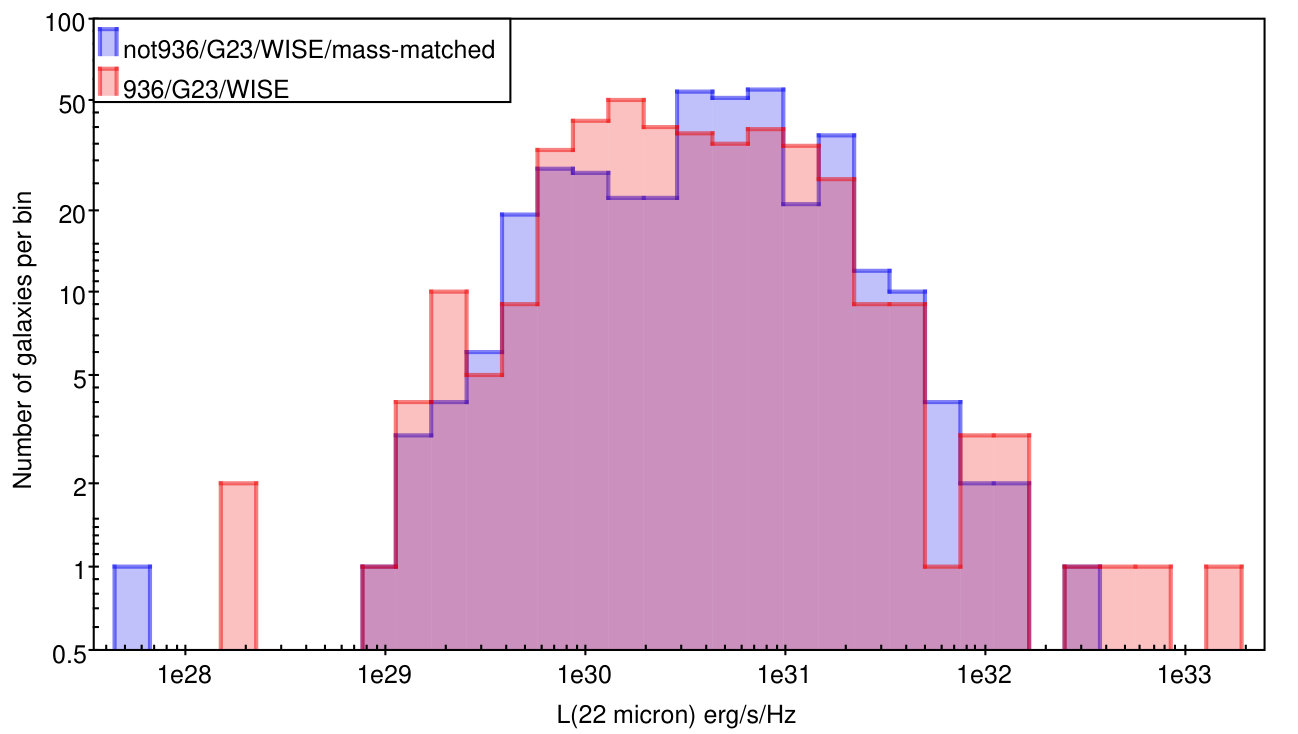 Figure 8
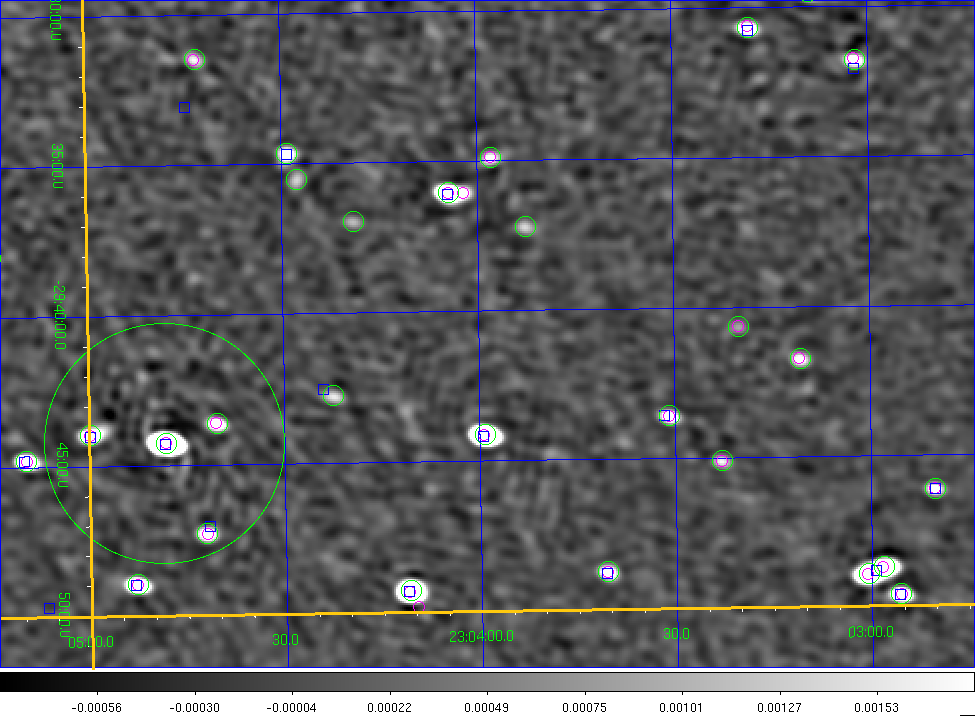 Figure 9
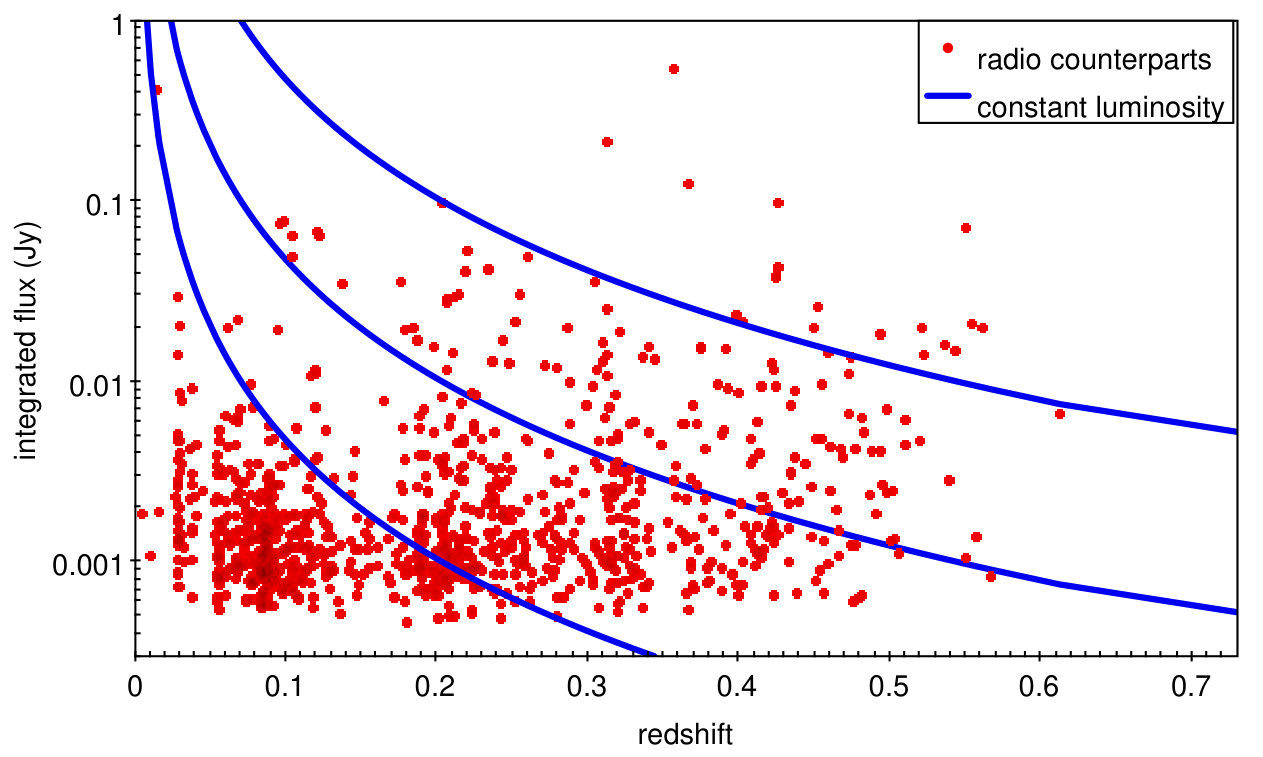 Figure 10
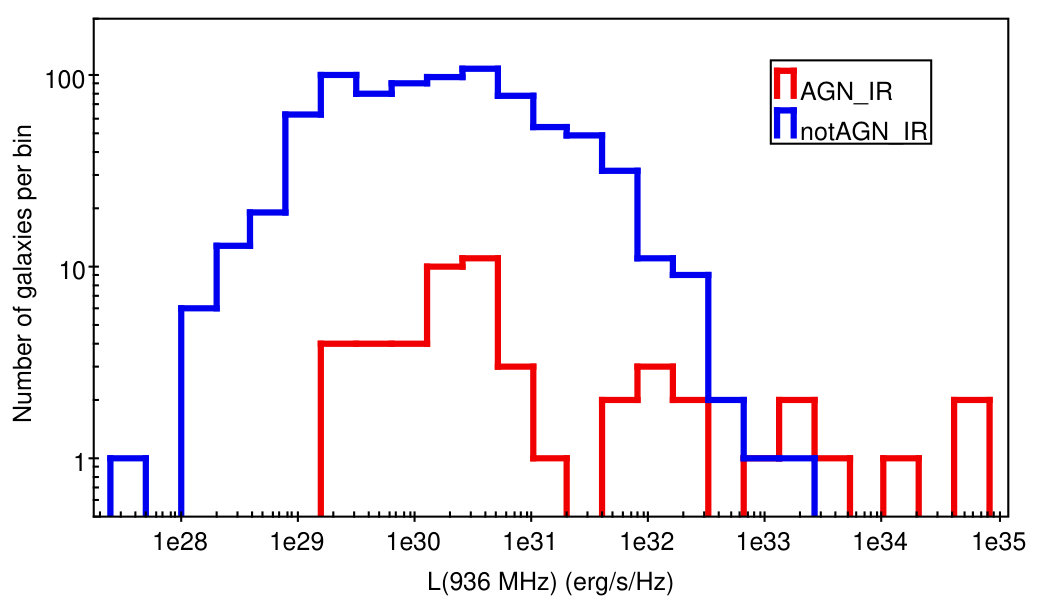 Figure 11
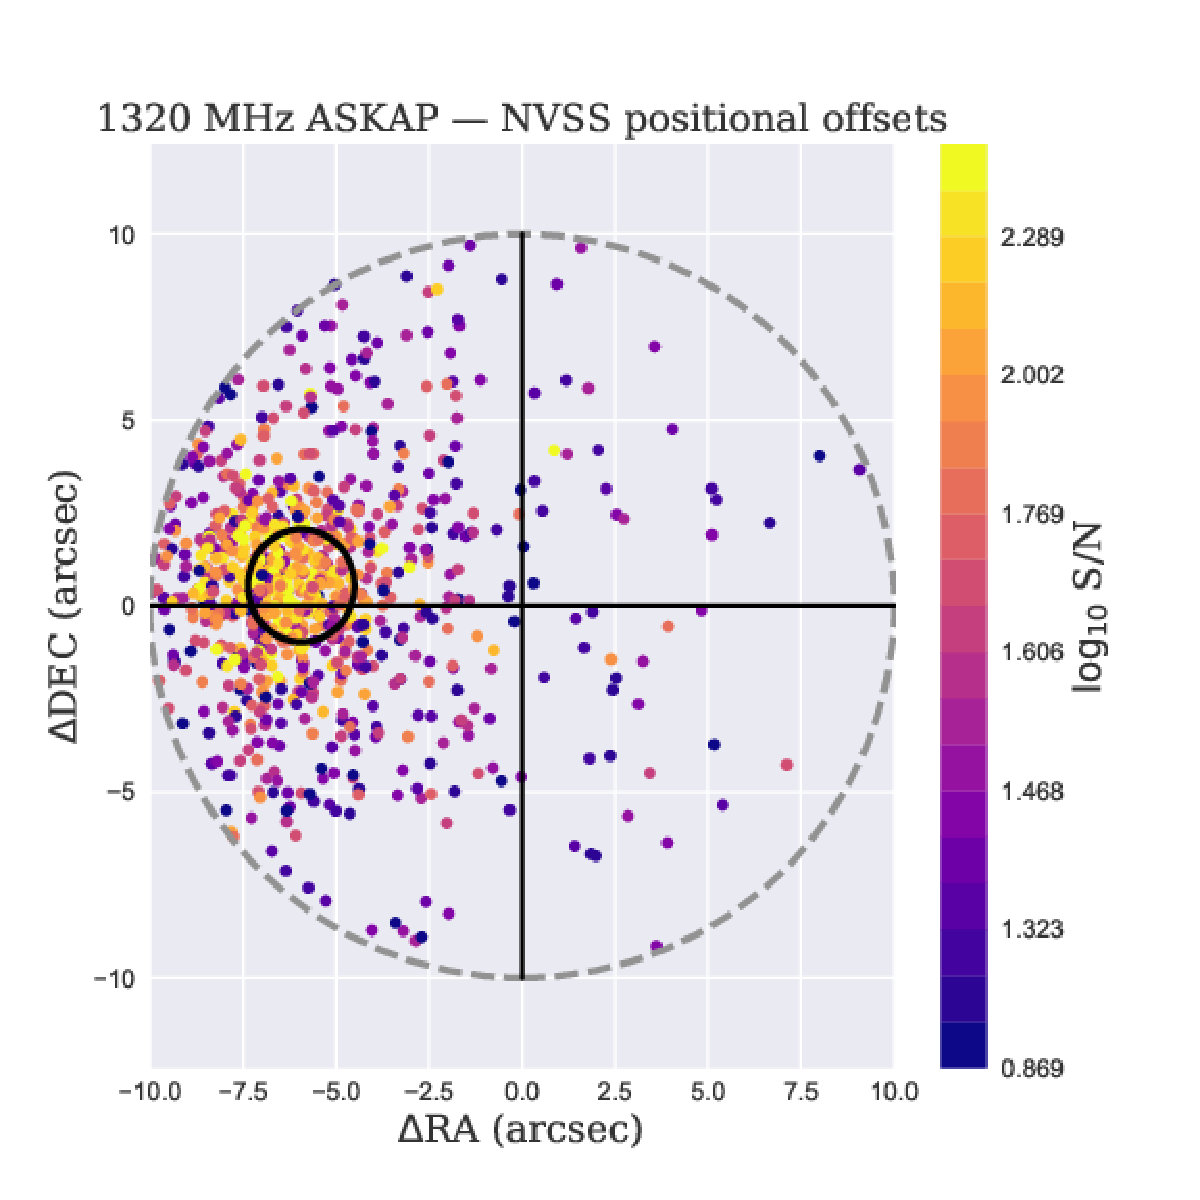 Figure 12
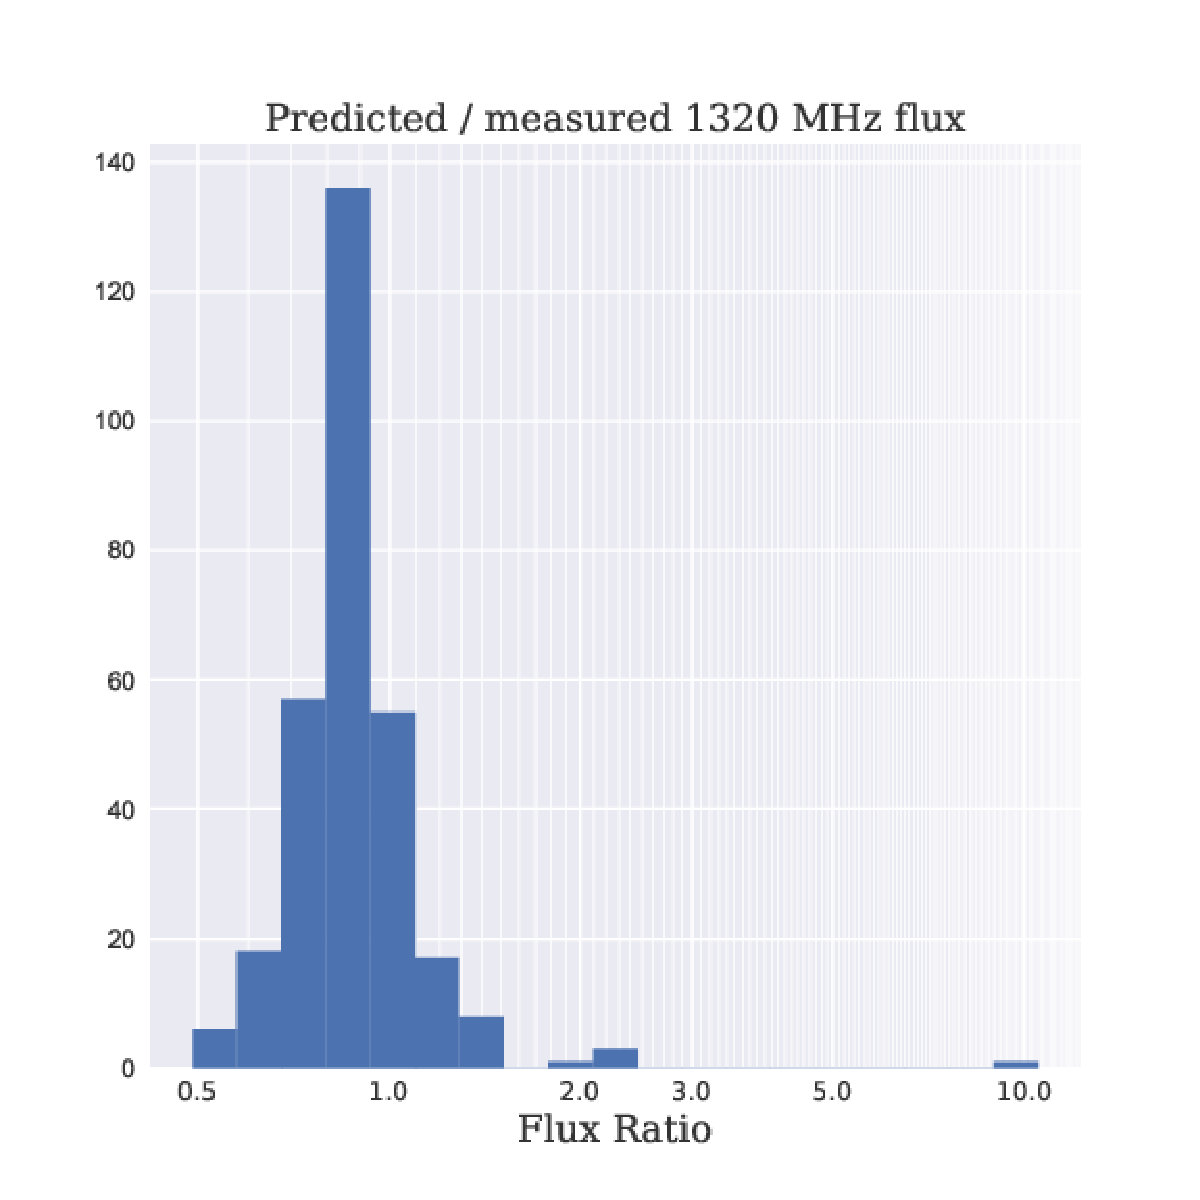 Figure 13
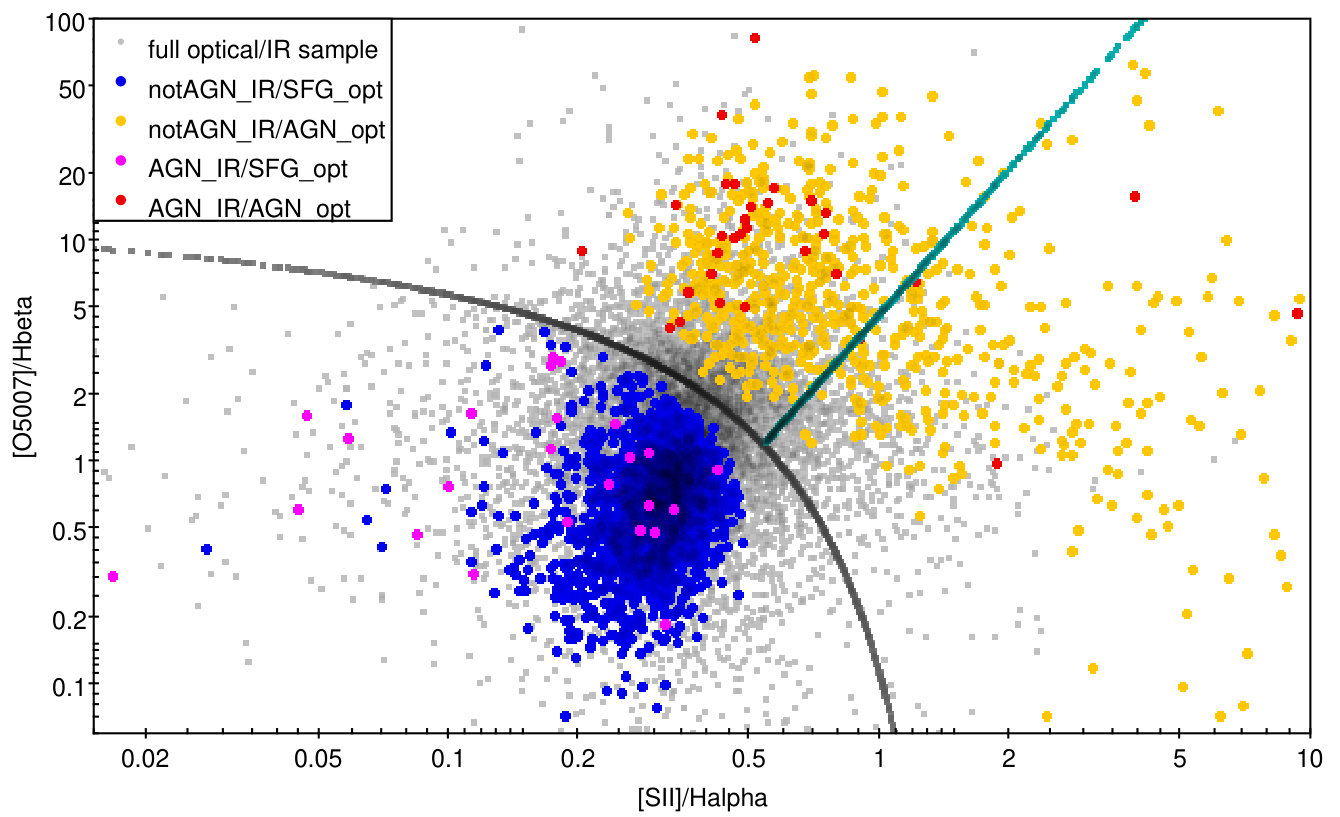 Figure 14
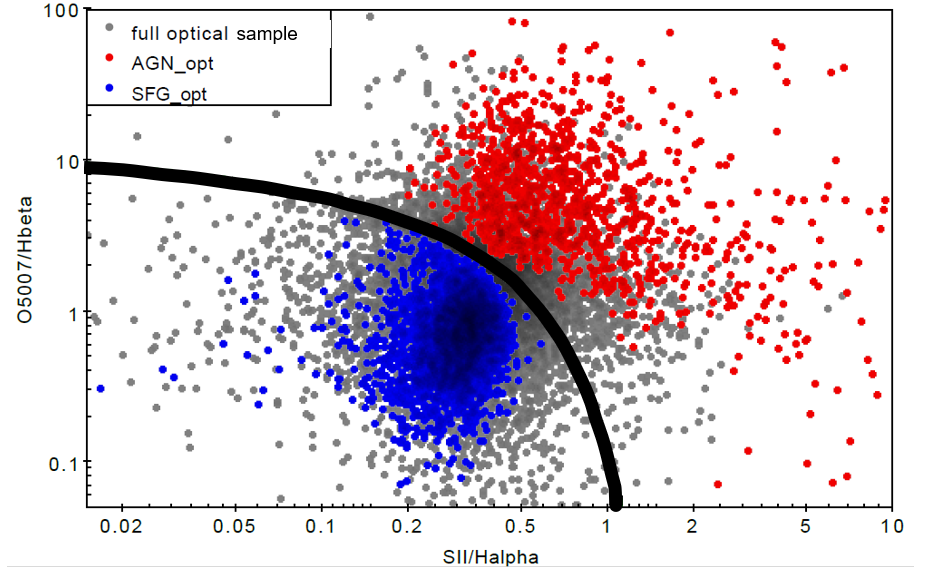 Figure 15
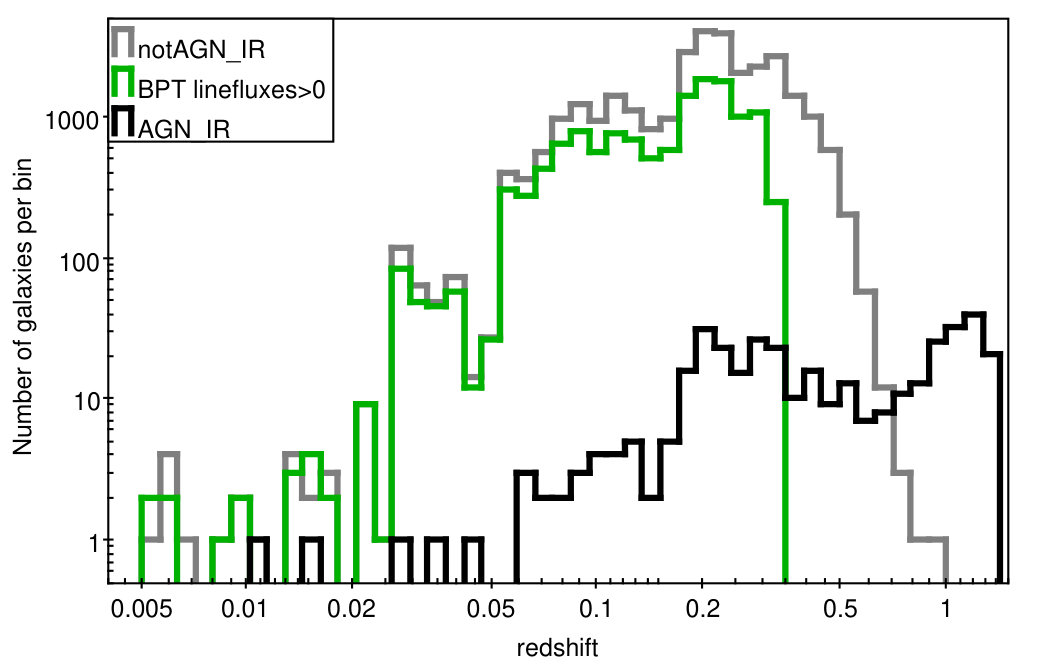 Figure 12
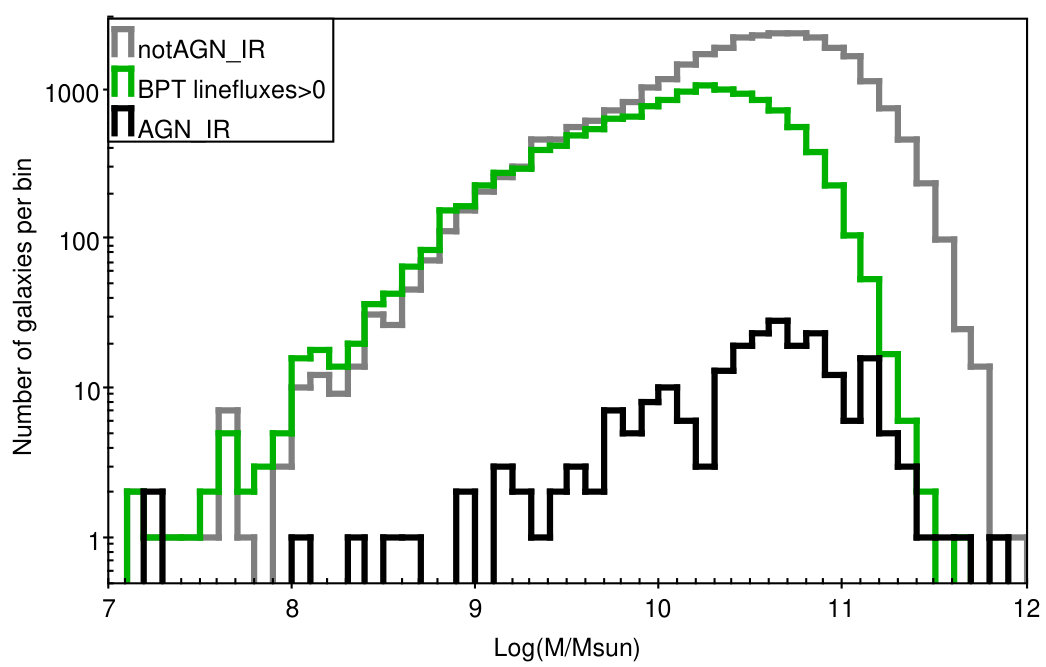 Figure 12
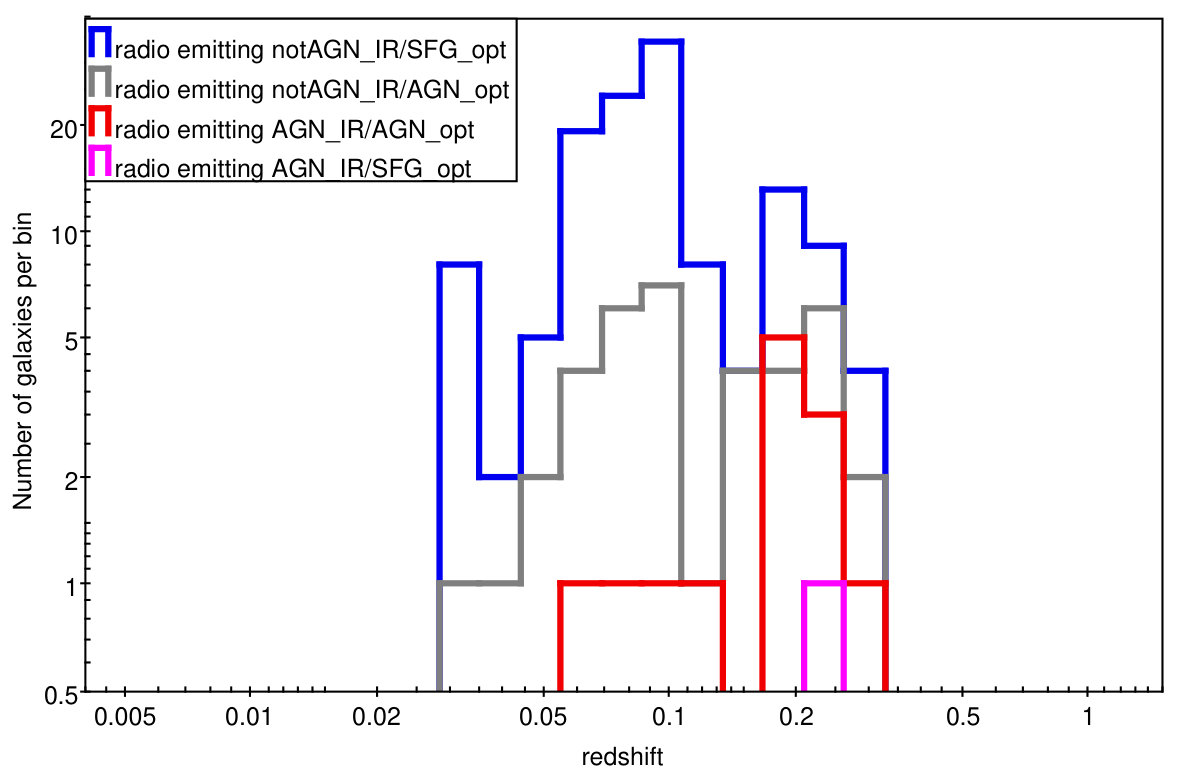 Figure 19
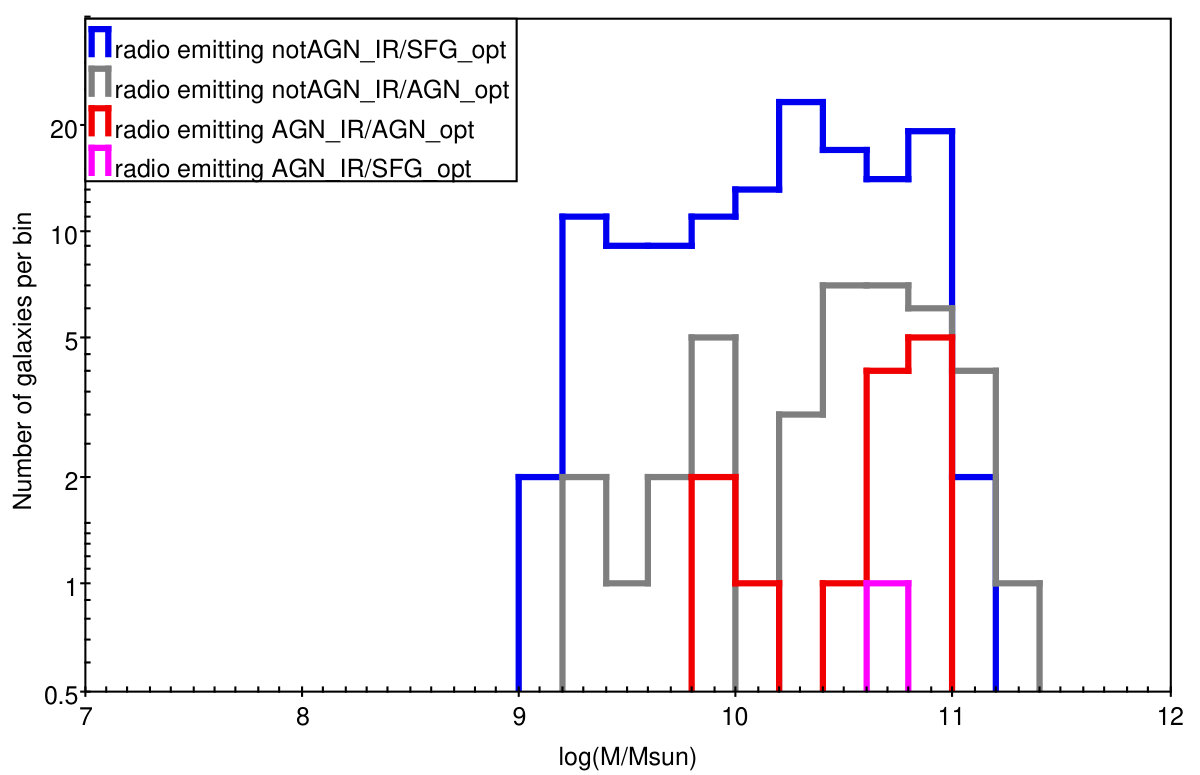 Figure 19
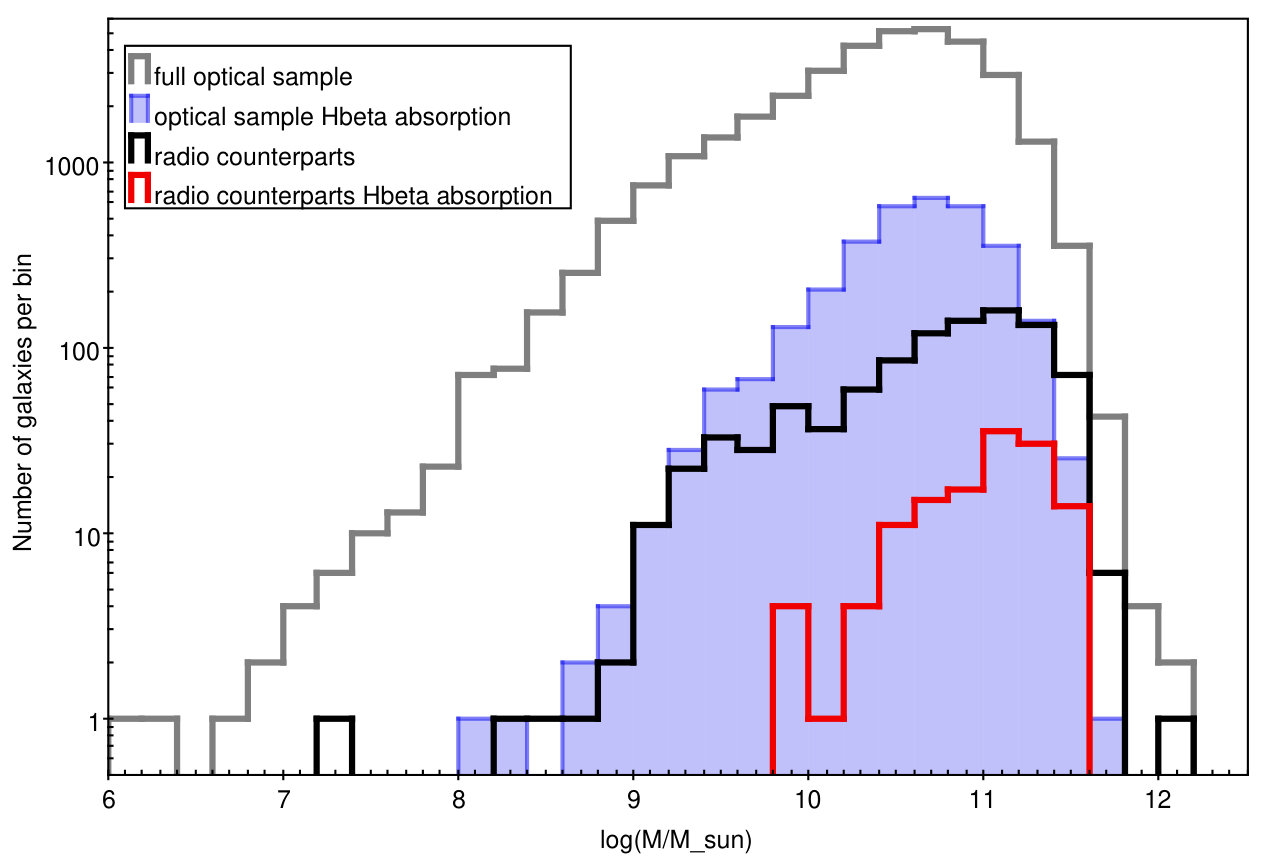 Figure 20
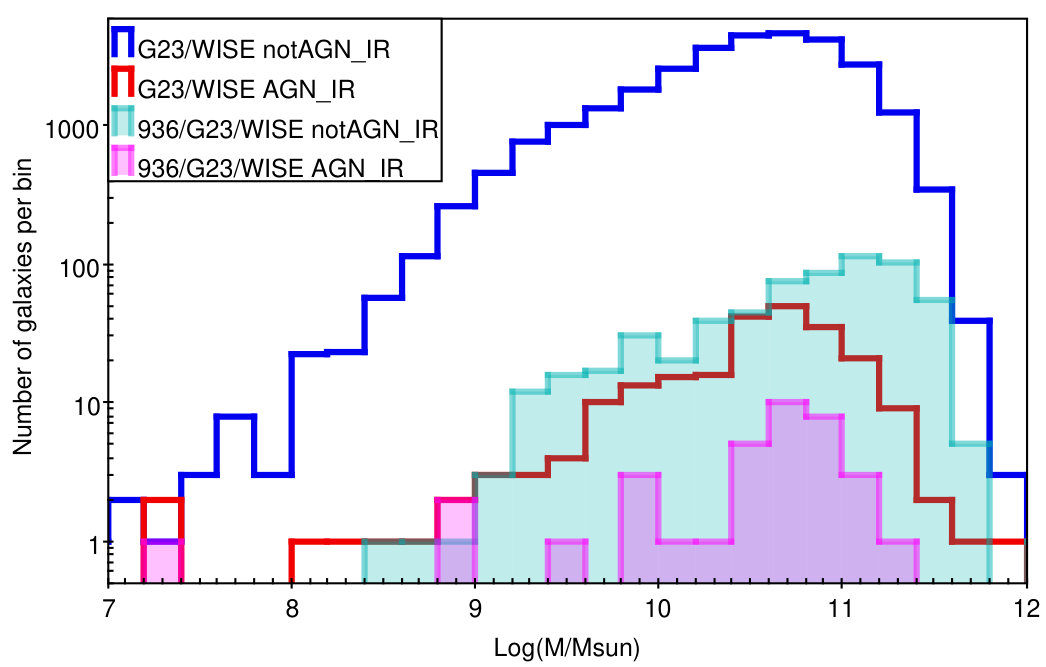 Figure 21
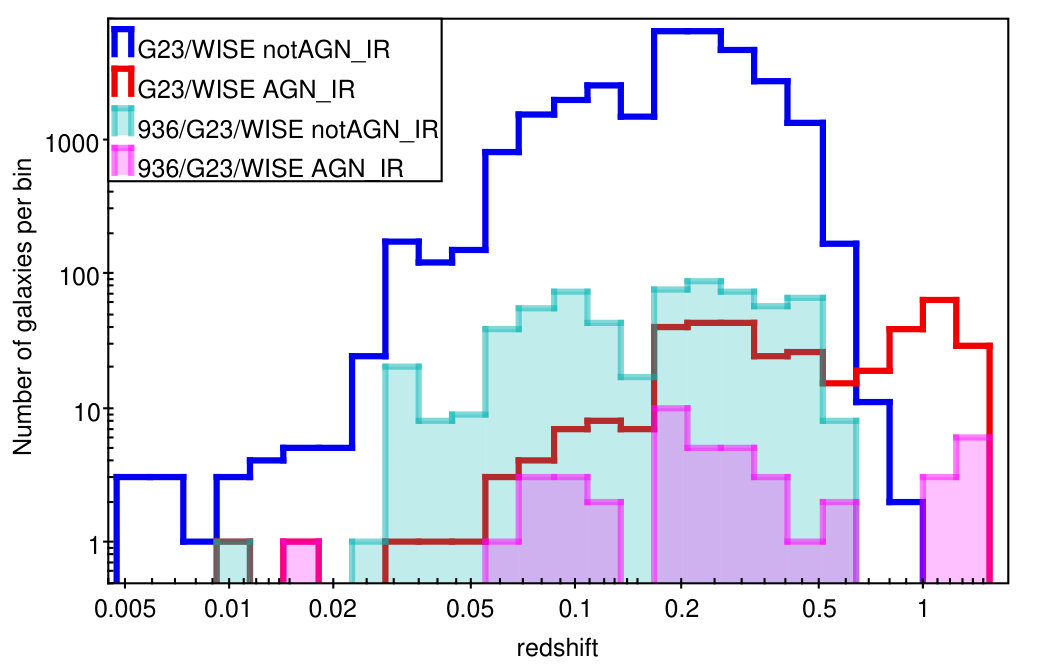 Figure 22
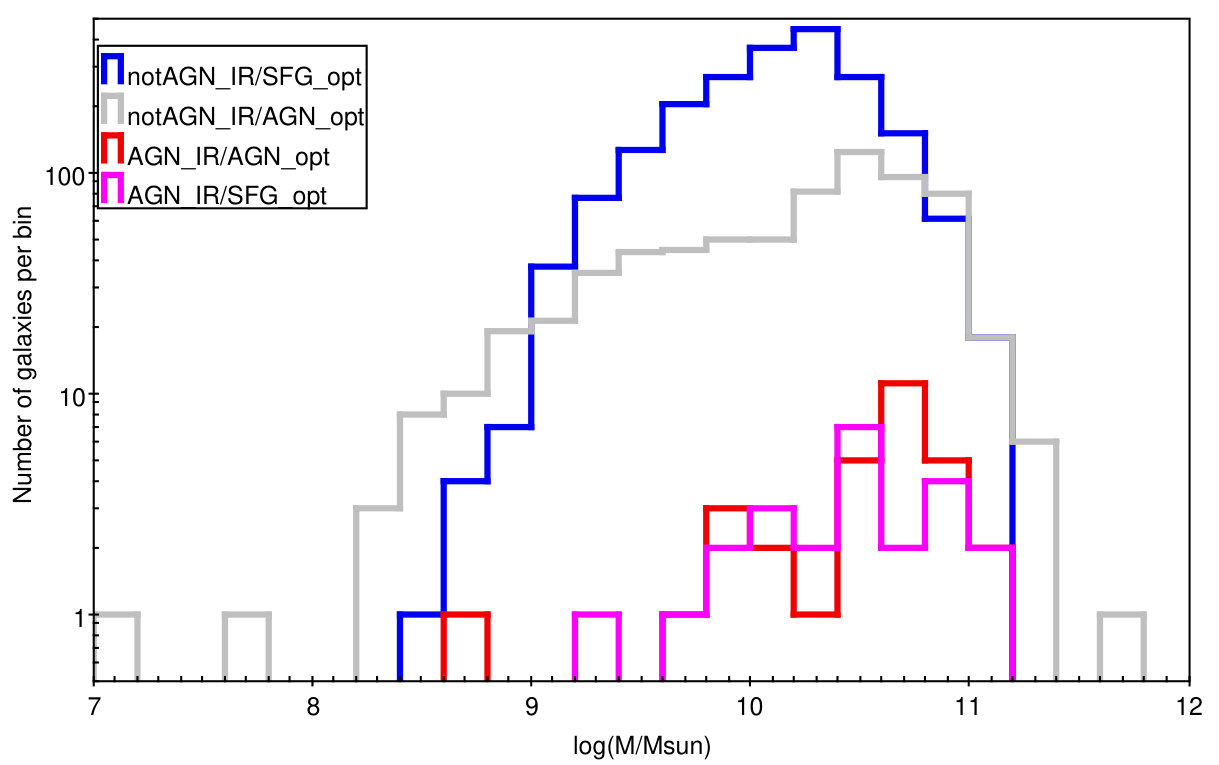 Figure 23
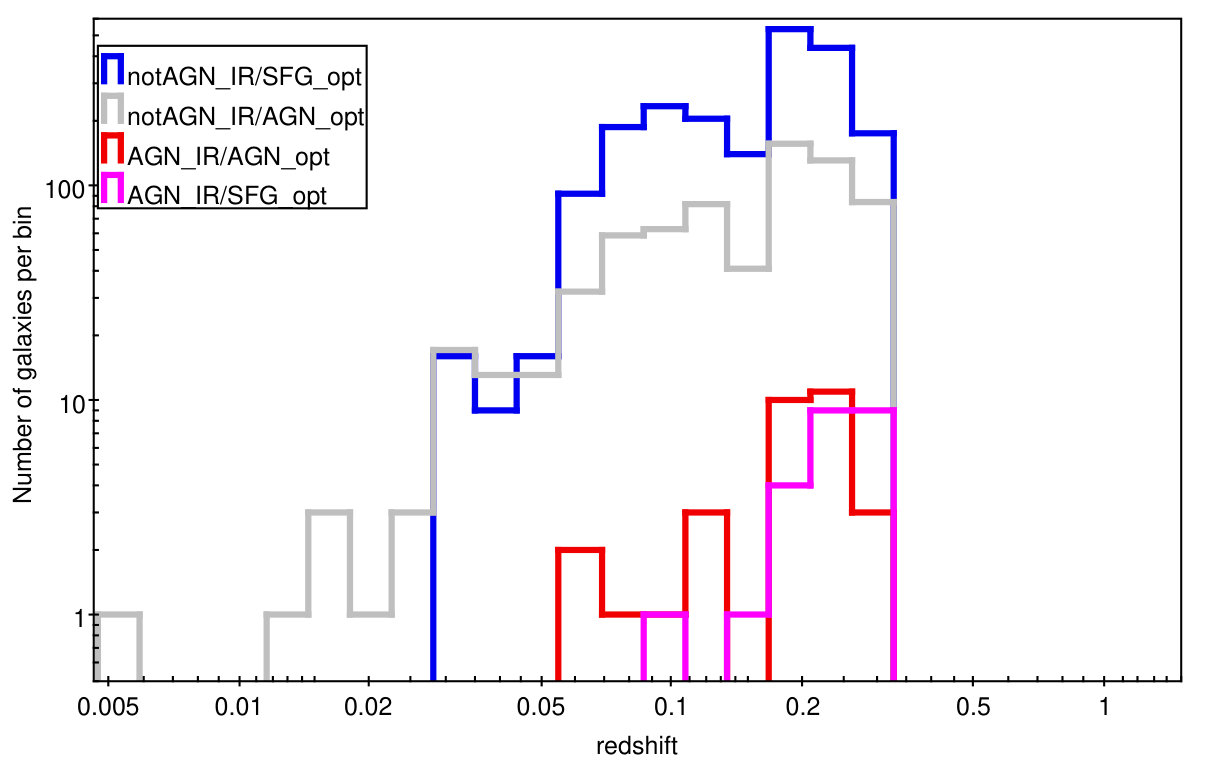 Figure 24
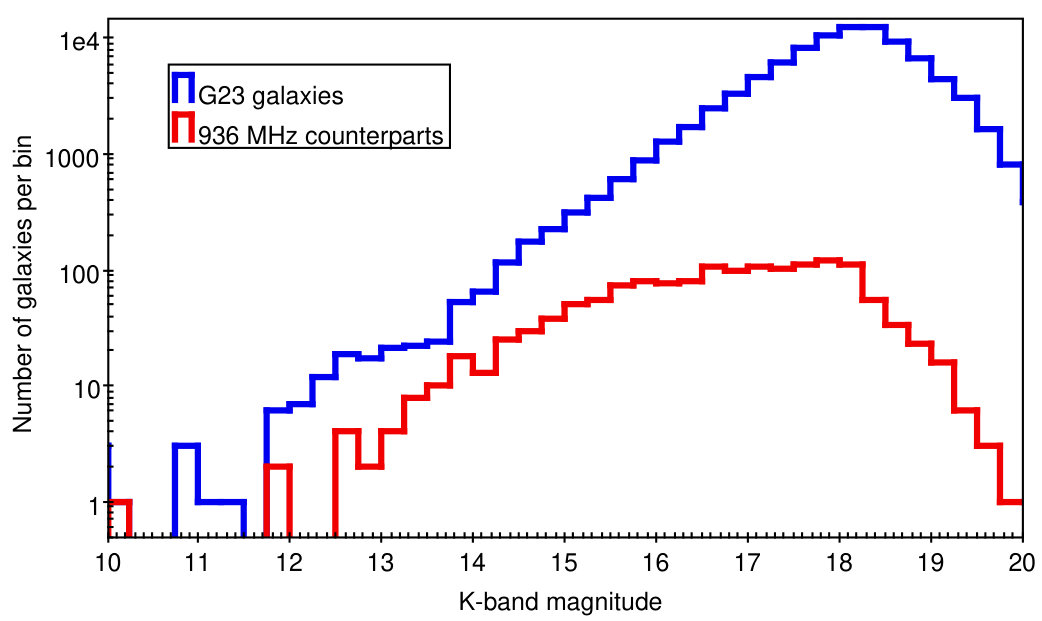 Figure 25
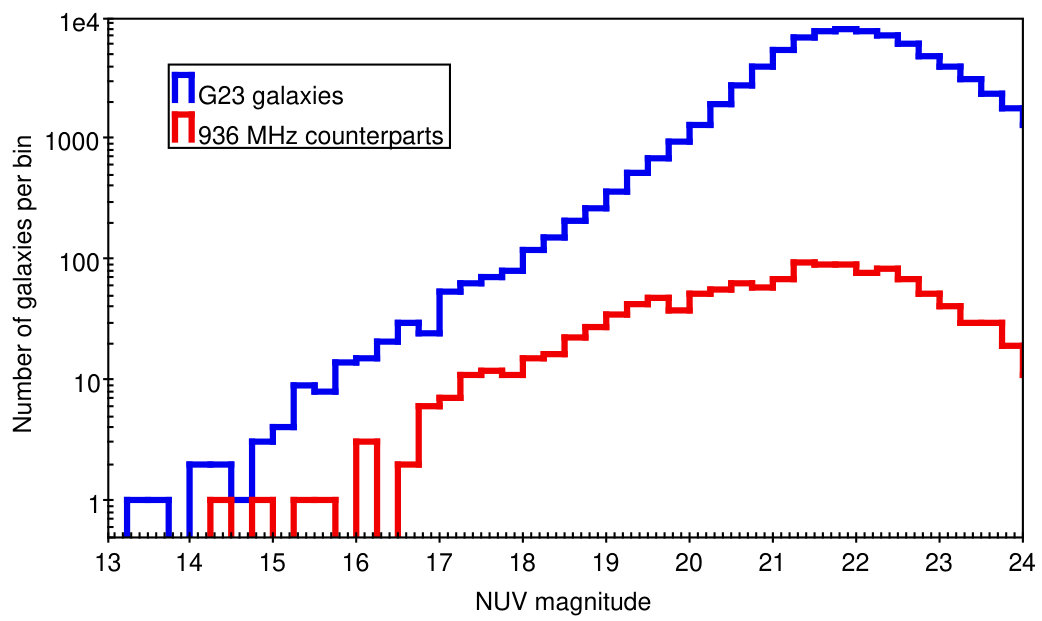 Figure 26
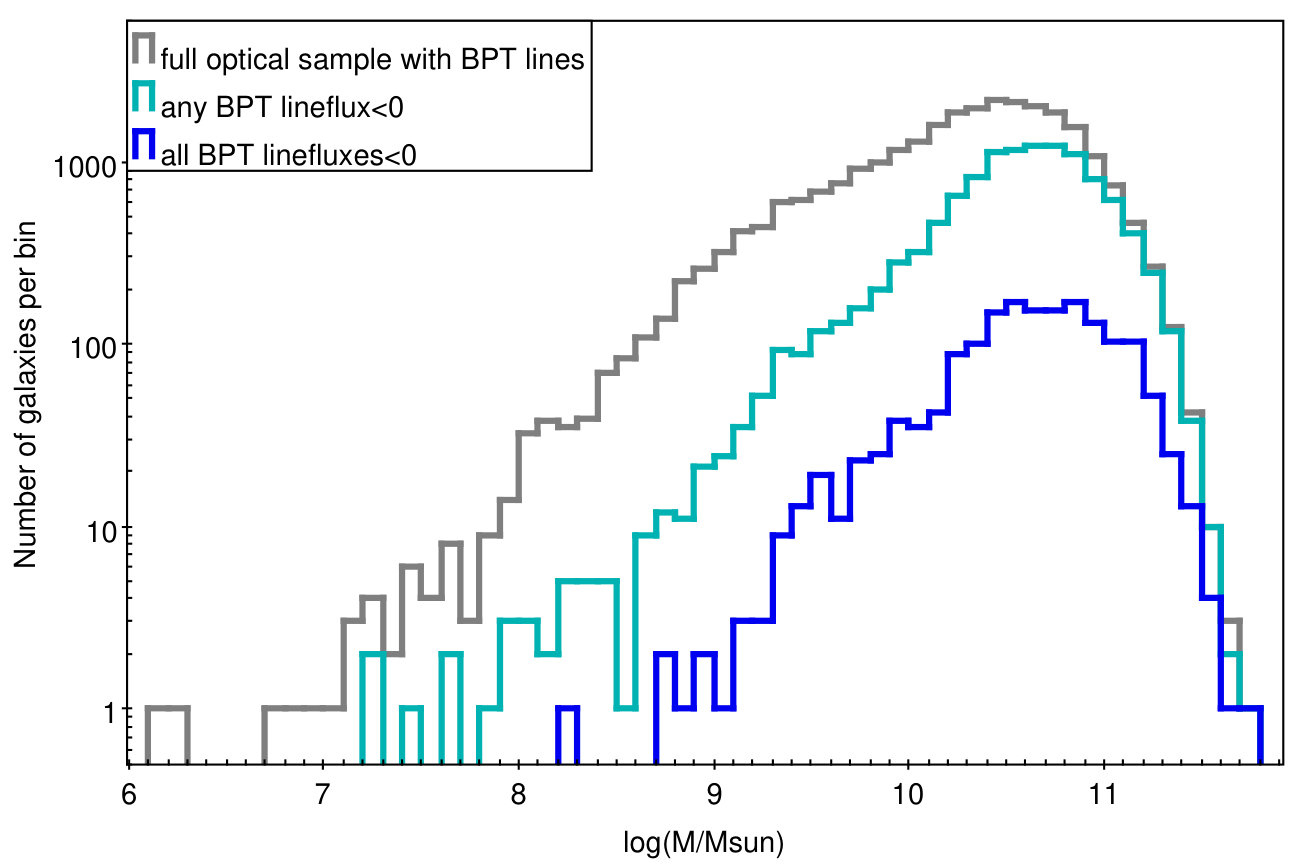 Figure 27
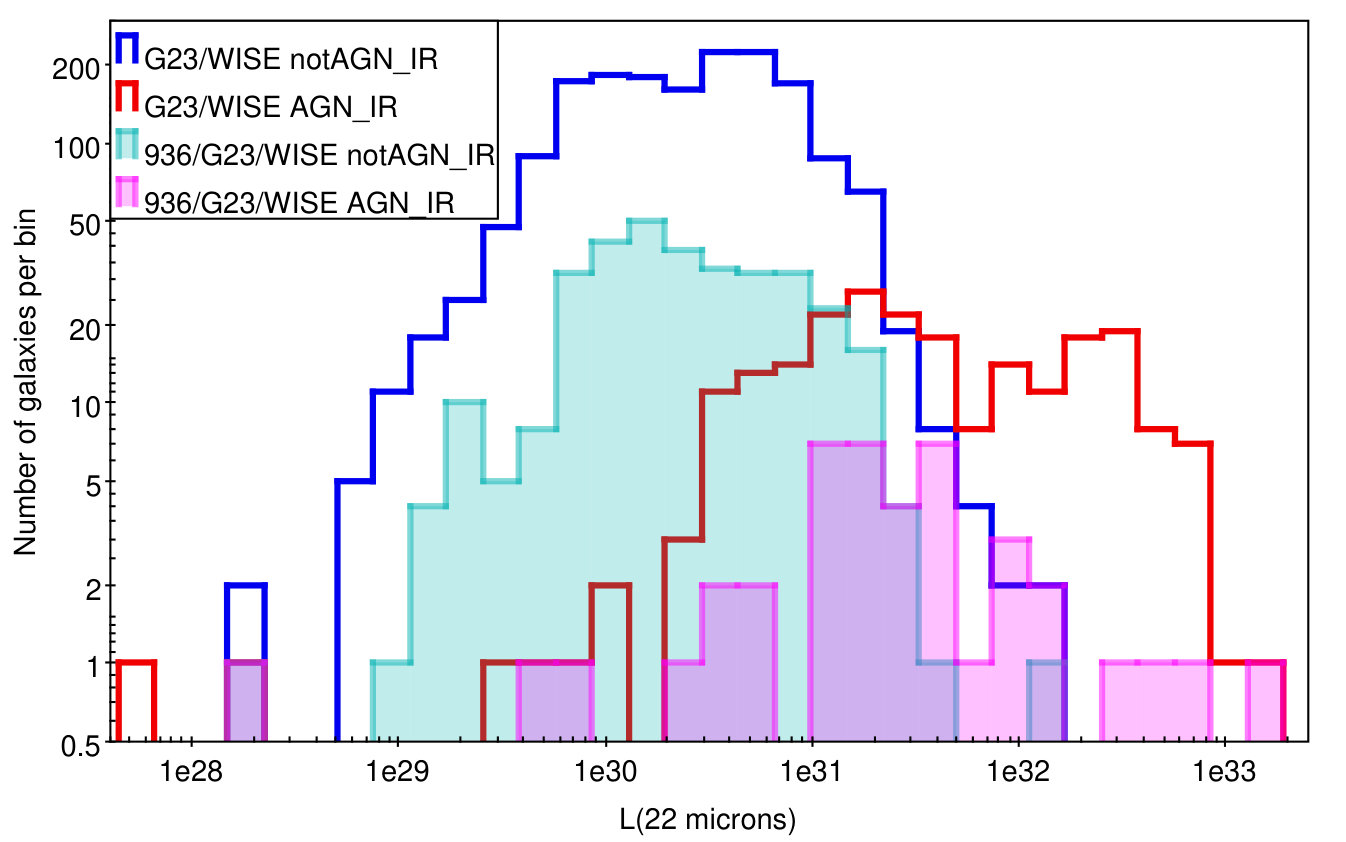 Figure 28
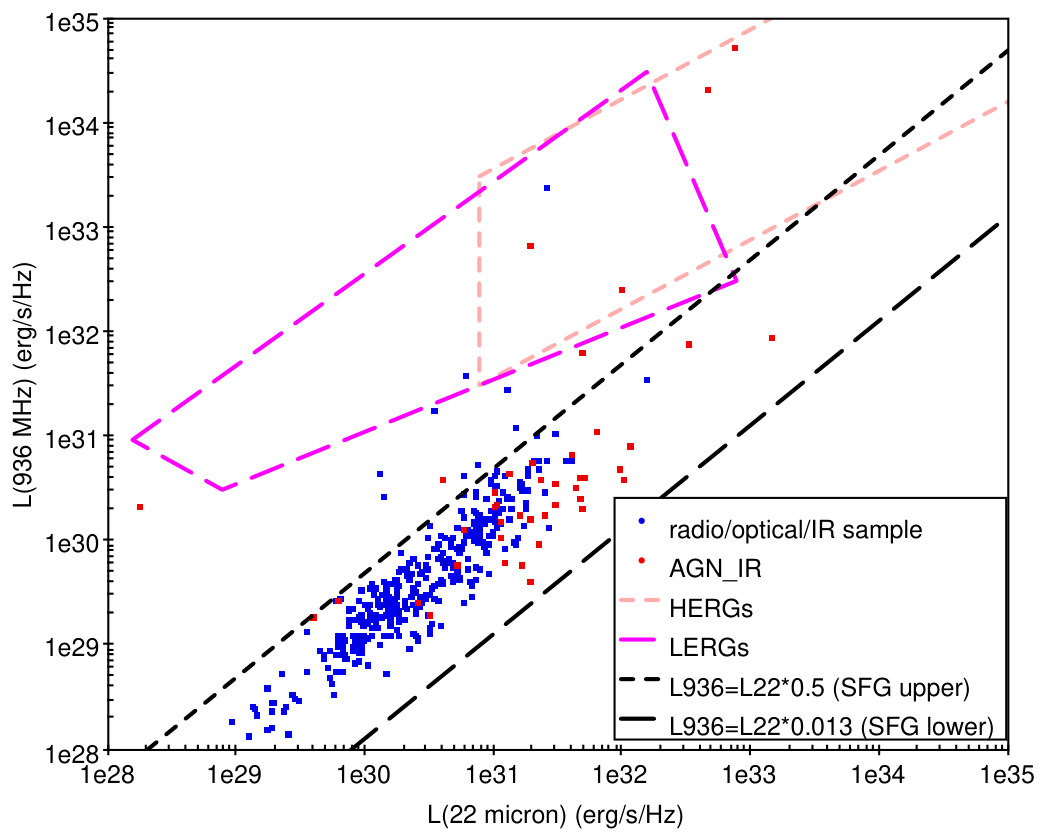 Figure 29
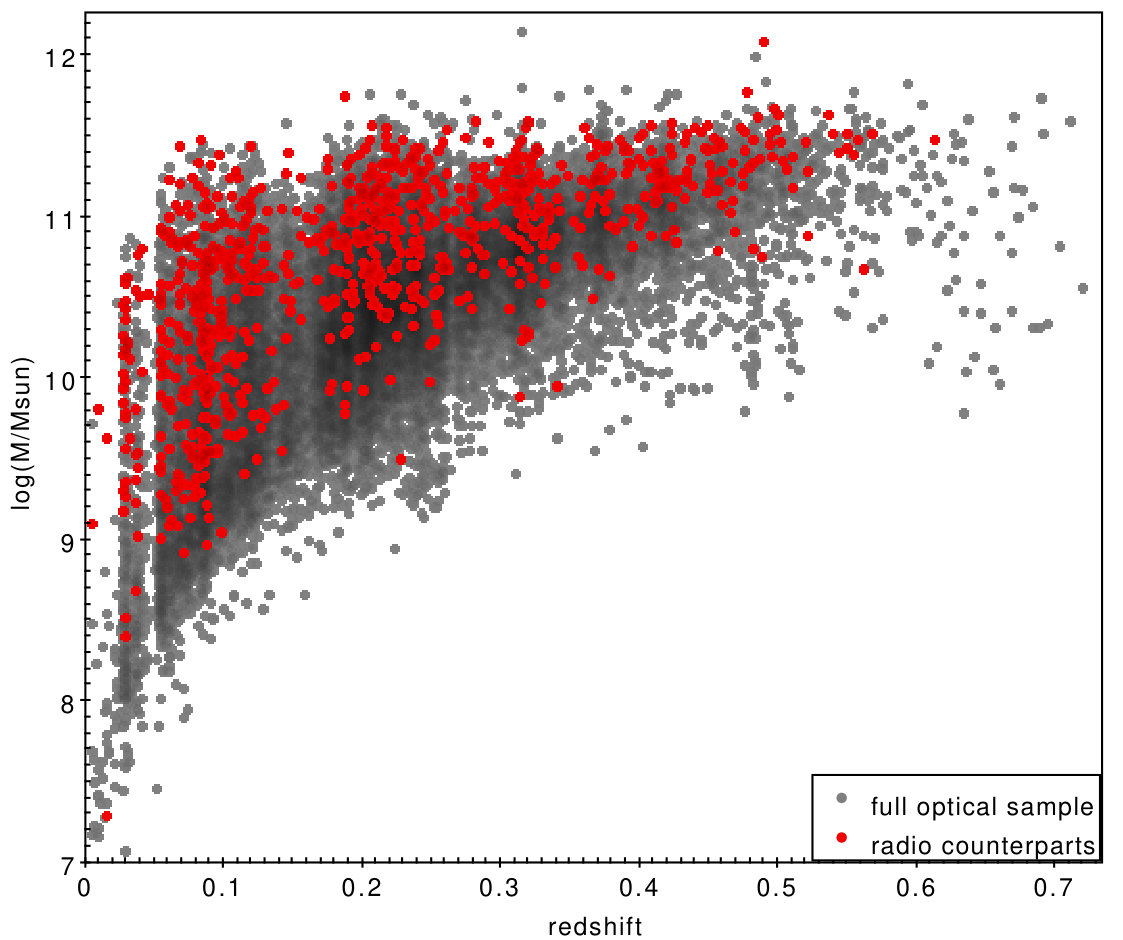 Figure 30
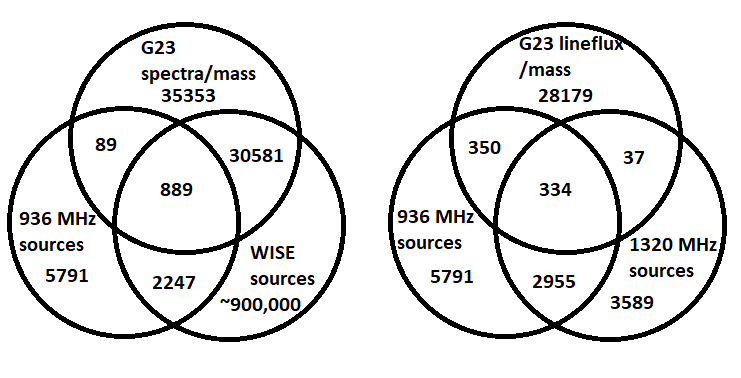 Figure 31
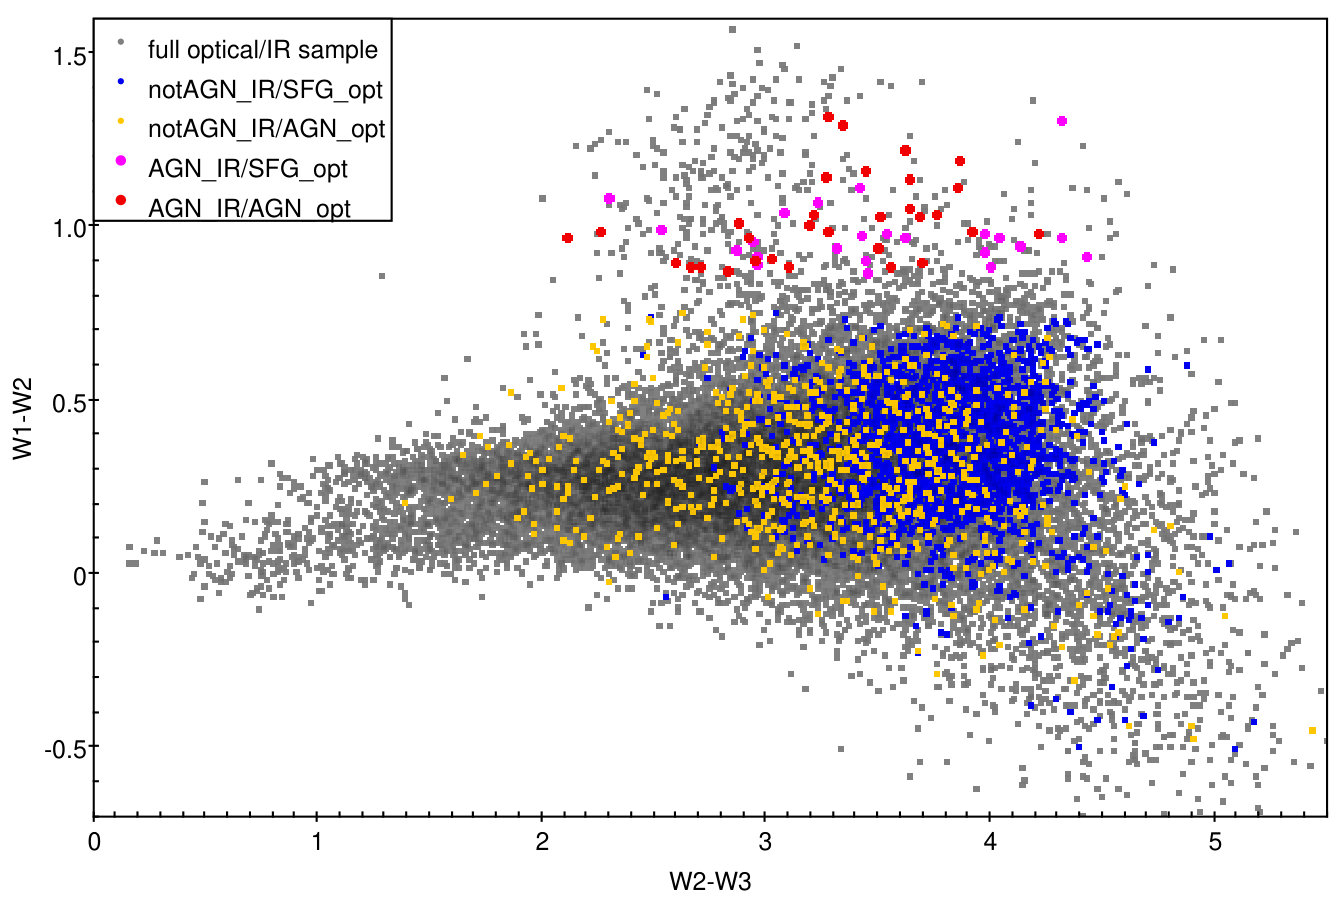 Figure 32
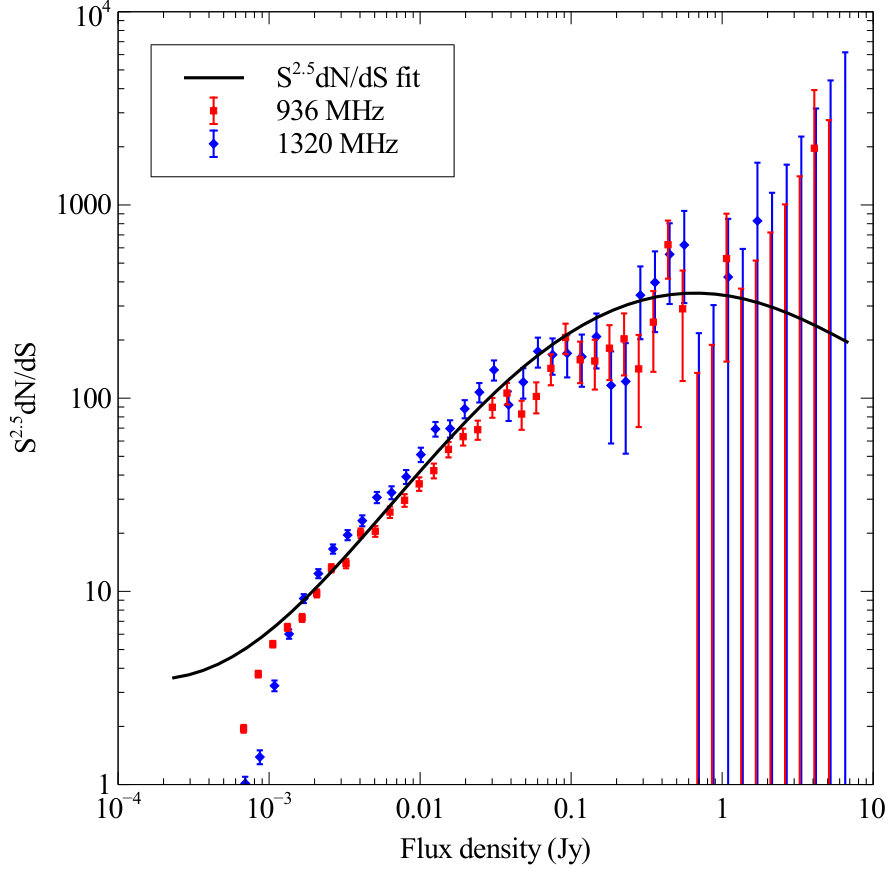 Figure 33
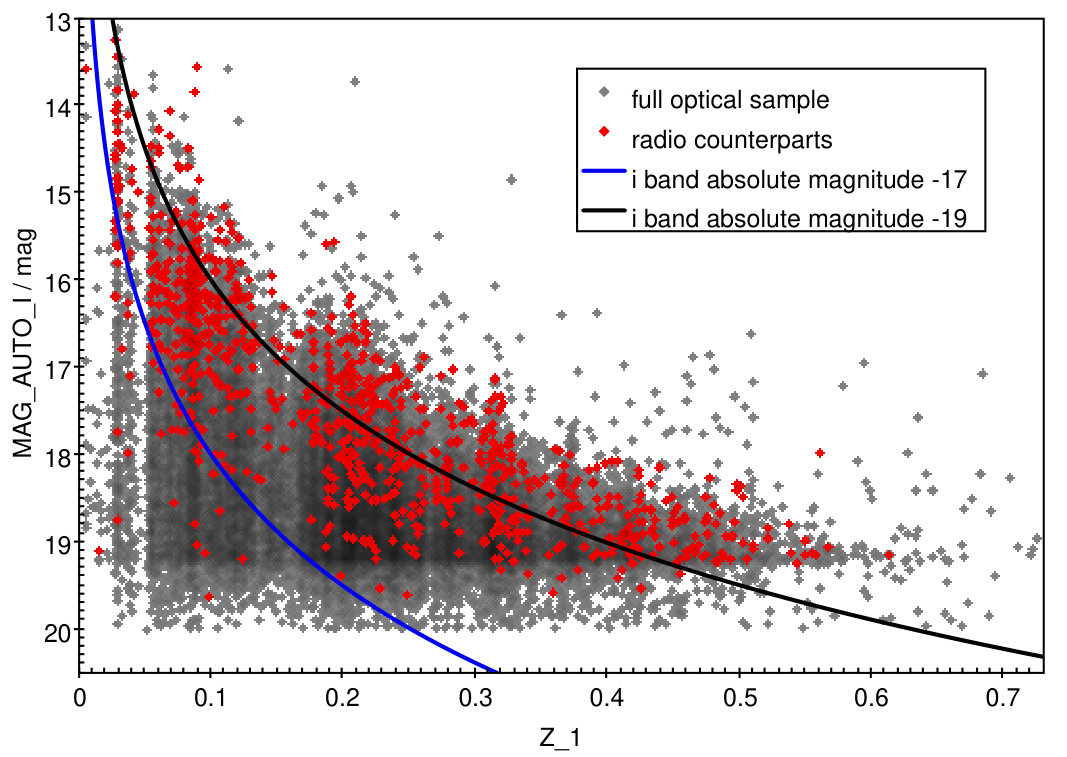 Figure 34
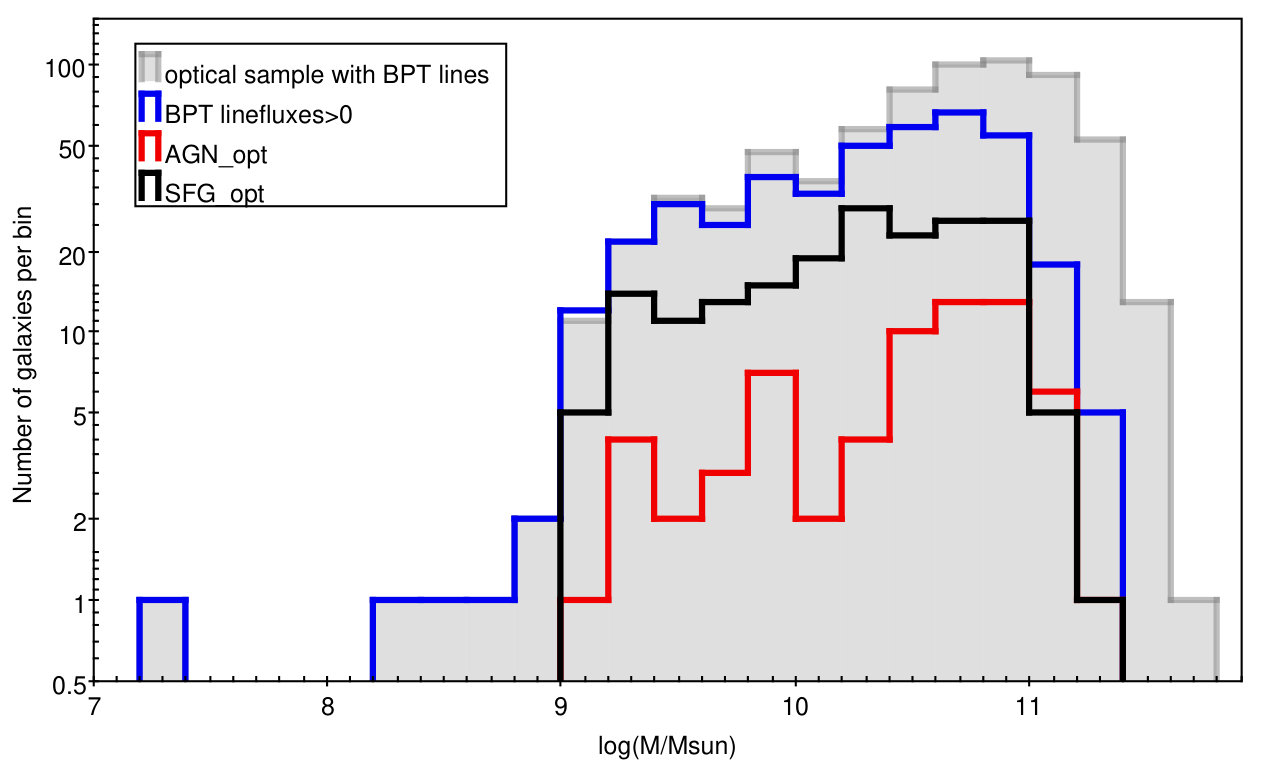 Figure 35
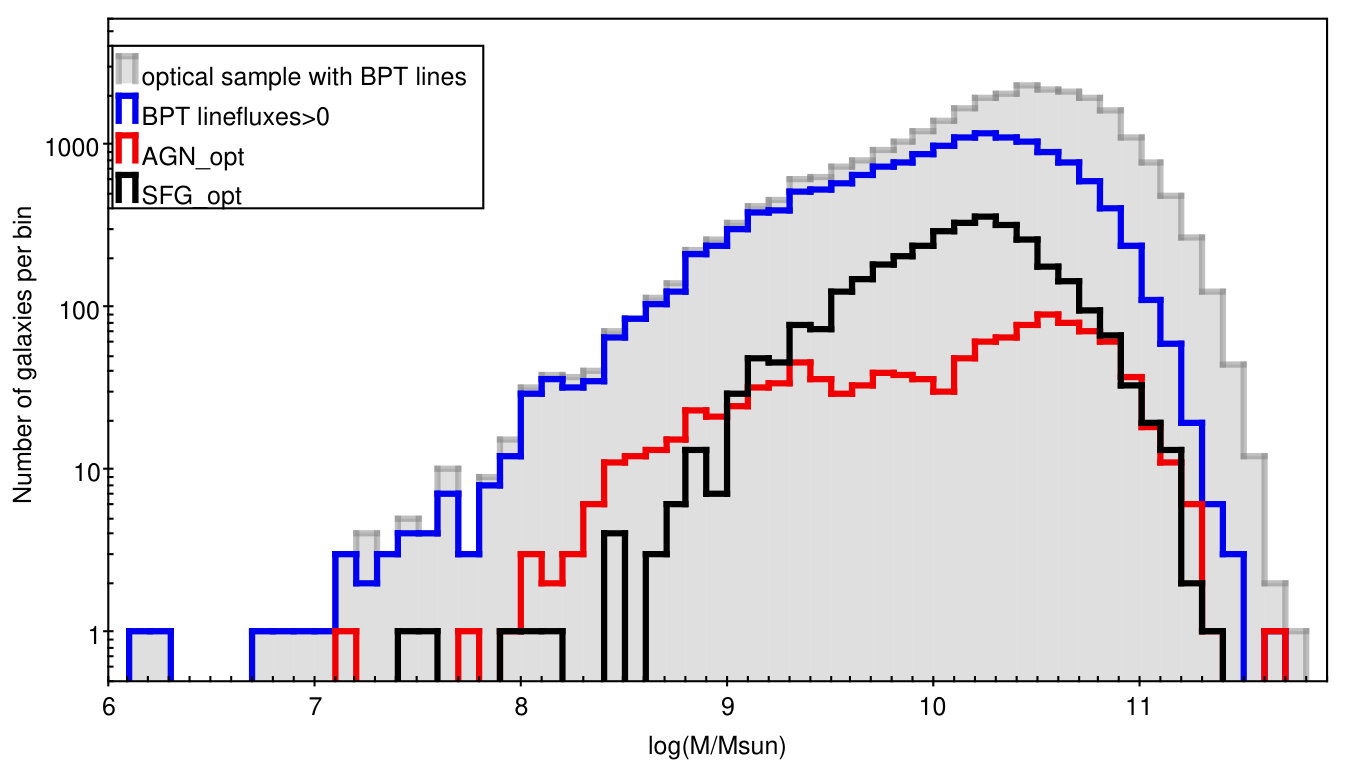 Figure 36
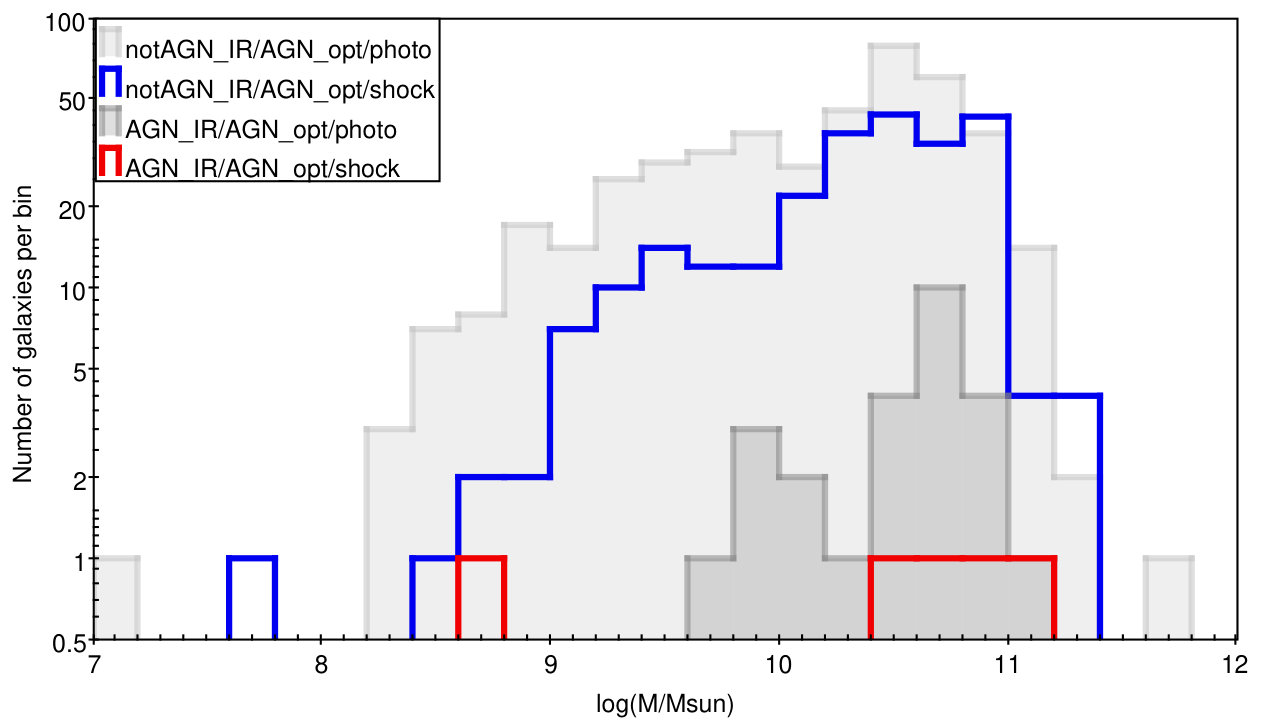 Figure 37
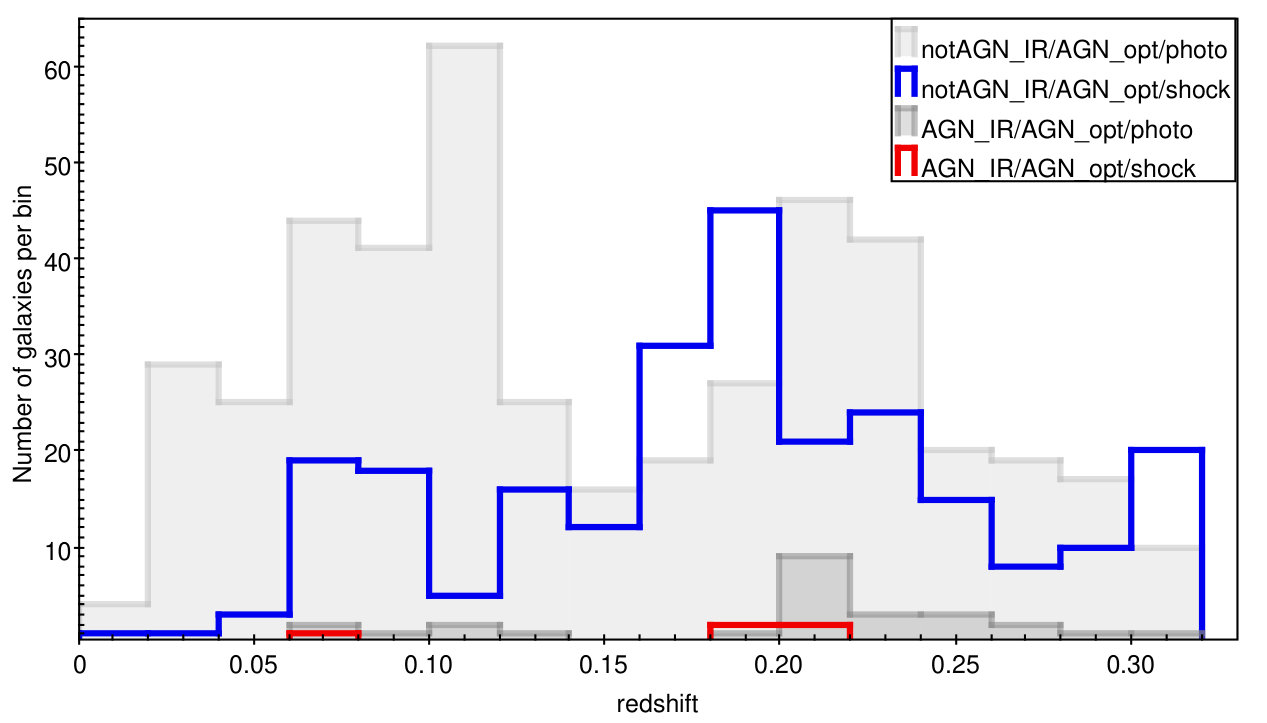 Figure 38
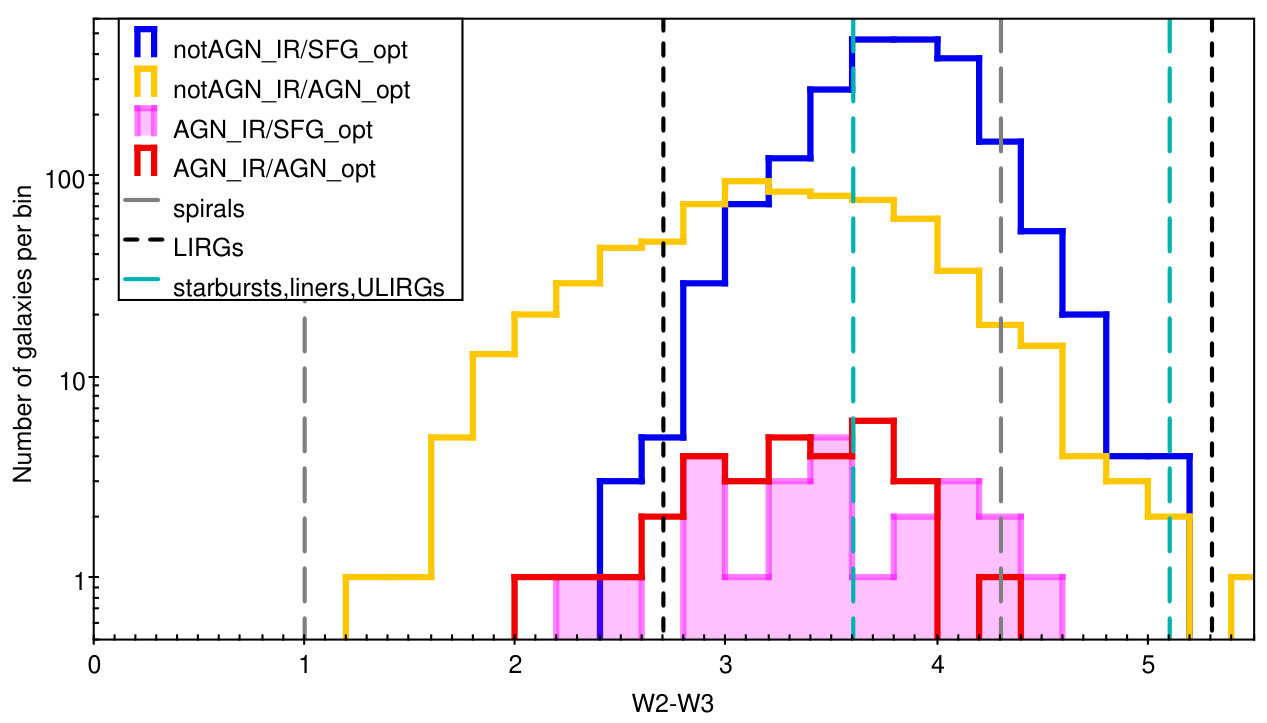 Figure 39
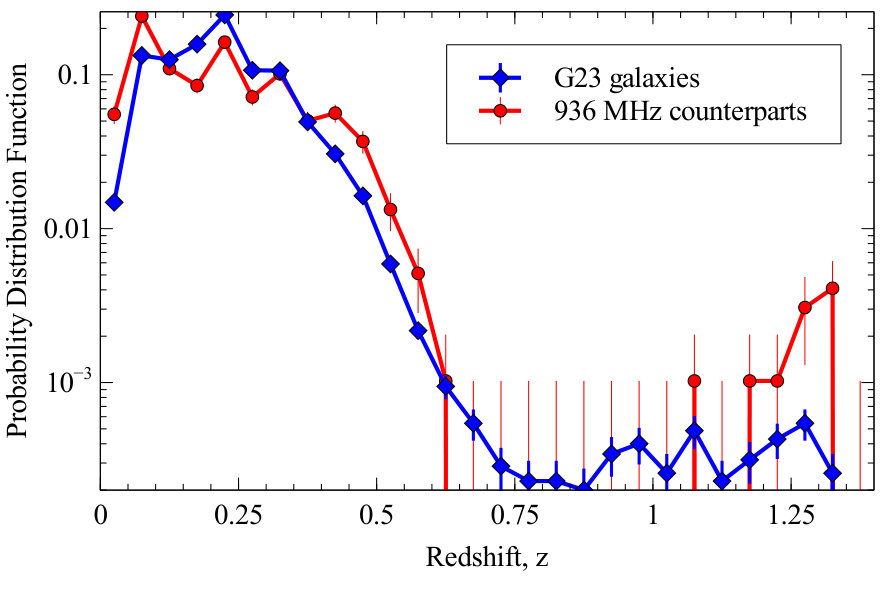 Figure 40
| Scheduling | Frequency | Bandwidth | Date | Observing |
|---|---|---|---|---|
| Block ID | (MHz) | (MHz) | time (hrs) | |
| 2827 | 1320 | 144 | 03-Dec-2016 | 5 |
| 2831 | 1320 | 144 | 04-Dec-2016 | 5 |
| 2949 | 936 | 192 | 16-Dec-2016 | 4 |
| 2955 | 936 | 192 | 17-Dec-2016 | 4 |
| 2961 | 936 | 192 | 18-Dec-2016 | 4 |
| Frequency | total | single | double | triple |
|---|---|---|---|---|
| (2 lobes) | (core+2 lobes) | |||
| 936 MHz | 5791 | 5710 | 56 | 25 |
| 1320 MHz | 3589 | 3451 | 109 | 29 |
| Category | No. | Redshift | W1 mag | 936 MHz f.d.(Jy) | |
|---|---|---|---|---|---|
| mean(SD) | mean(SD) | mean(SD) | mean(SD) | ||
| 936 MHz | 5791 | n/a | n/a | n/a | 0.0095(0.0413) |
| 1320 MHz | 3589 | n/a | n/a | n/a | n/a |
| 936/1320 MHz | 3289 | n/a | n/a | n/a | 0.0124(0.0506) |
| G23 spectra/mass | 35353 | 0.220(0.118) | 10.37(0.62) | n/a | n/a |
| G23 mass/lineflux | 28179 | 0.181(0.073) | 10.24(0.60) | n/a | n/a |
| G23 mass/4lineflux | 15165 | 0.171(0.075) | 9.99(0.60) | n/a | n/a |
| G23 mass/lineflux | 13014 | 0.194(0.069) | 10.52(0.46) | n/a | n/a |
| G23 mass/4lineflux | 1785 | 0.186(0.072) | 10.61(0.44) | n/a | n/a |
| 936/G23 spectra/mass | 978 | 0.221(0.169) | 10.70(0.62) | n/a | 0.0064(0.0322) |
| 936/G23 mass/lineflux | 684 | 0.148(0.083) | 10.51(0.61) | n/a | 0.0043(0.0192) |
| 936/G23 mass/4lineflux | 410 | 0.127(0.075) | 10.25(0.59) | n/a | 0.0037(0.0233) |
| 936/G23 mass/lineflux | 274 | 0.181(0.084) | 10.90(0.41) | n/a | 0.0051(0.0102) |
| 936/G23 mass/4lineflux | 45 | 0.184(0.068) | 10.98(0.39) | n/a | 0.0096(0.0160) |
| G23/WISE spectra/mass | 31470 | 0.223(0.118) | 10.41(0.59) | 15.39(0.81) | n/a |
| G23/WISE mass/lineflux | 25234 | 0.184(0.072) | 10.28(0.57) | 15.42(0.84) | n/a |
| G23/WISE mass/4lineflux | 13149 | 0.174(0.074) | 10.05(0.57) | 15.69(0.80) | n/a |
| G23/WISE mass/lineflux | 11985 | 0.194(0.068) | 10.54(0.45) | 15.13(0.79) | n/a |
| G23/WISE mass/4lineflux | 837 | 0.186(0.075) | 10.64(0.43) | 14.85(0.93) | n/a |
| 936/G23/WISE spectra/mass | 889 | 0.228(0.170) | 10.74(0.59) | 14.24(0.88) | 0.0067(0.0336) |
| 936/G23/WISE mass/lineflux | 610 | 0.152(0.082) | 10.56(0.59) | 14.01(0.92) | 0.0043(0.0199) |
| 936/G23/WISE mass/4lineflux | 352 | 0.133(0.075) | 10.30(0.57) | 14.04(0.88) | 0.0036(0.0246) |
| 936/G23/WISE mass/lineflux | 258 | 0.179(0.084) | 10.92(0.40) | 13.97(0.98) | 0.0053(0.0104) |
| 936/G23/WISE mass/4lineflux | 23 | 0.177(0.078) | 11.03(0.37) | 13.89(0.94) | 0.0130(0.0181) |
| Category | No. | Redshift | W1 mag | 936 MHz f.d.(Jy) | (erg/s/Hz) | |
|---|---|---|---|---|---|---|
| mean(SD) | mean(SD) | mean(SD) | mean(SD) | mean(SD) | ||
| G23 | ||||||
| SFGopt | 3310 | 0.176(0.070) | 10.12(0.44) | n/a | n/a | n/a |
| AGNopt | 1112 | 0.158(0.080) | 10.04(0.72) | n/a | n/a | n/a |
| 936/G23 | ||||||
| SFGopt | 187 | 0.119(0.067) | 10.24(0.53) | n/a | 0.0024(0.0059) | n/a |
| AGNopt | 66 | 0.139(0.076) | 10.44(0.55) | n/a | 0.0022(0.0028) | n/a |
| G23/WISE | ||||||
| notAGNIR | 29983 | 0.220(0.102) | 10.44(0.57) | 15.35(0.76) | n/a | n/a |
| AGNIR | 374 | 0.591(0.411) | 10.47(0.65) | 14.87(0.99) | n/a | n/a |
| SFGopt | 2202 | 0.173(0.070) | 10.12(0.42) | 15.43(0.84) | n/a | n/a |
| AGNopt | 765 | 0.165(0.078) | 10.16(0.67) | 15.28(0.89) | n/a | n/a |
| 936/G23/WISE | ||||||
| notAGNIR | 813 | 0.216(0.132) | 10.77(0.58) | 14.22(0.86) | 0.0049(0.0212) | n/a |
| AGNIR | 51 | 0.432(0.426) | 10.46(0.71) | 14.34(1.06) | 0.037(0.108) | n/a |
| SFGopt | 140 | 0.115(0.065) | 10.25(0.52) | 13.86(0.76) | 0.0018(0.0031) | n/a |
| AGNopt | 56 | 0.151(0.076) | 10.51(0.47) | 13.95(0.86) | 0.0022(0.0030) | n/a |
| G23/WISE | ||||||
| w4snr3 | ||||||
| notAGNIR | 1718 | 0.158(0.095) | 10.37(0.48) | 14.50(0.83) | n/a | 4.75e30(8.29e30) |
| AGNIR | 224 | 0.492(0.370) | 10.60(0.60) | 14.43(0.91) | n/a | 1.17e32(1.92e32) |
| AGNIR/AGNopt | 27 | 0.202(0.061) | 10.61(0.31) | 14.27(0.77) | n/a | 1.47e31(1.14e31) |
| AGNIR/SFGopt | 17 | 0.224(0.052) | 10.48(0.45) | 14.45(1.17) | n/a | 2.10e31(3.03e31) |
| AGNIR/lineflux0 | 19 | 0.173(0.085) | 10.26(0.93) | 13.87(1.38) | n/a | 1.31e31(1.77e31) |
| 936/G23/WISE | ||||||
| w4snr3 | ||||||
| notAGNIR | 333 | 0.128(0.088) | 10.36(0.54) | 13.78(0.84) | 0.0034(0.0295) | 4.90e30(9.81e30) |
| AGNIR | 43 | 0.318(0.313) | 10.47(0.71) | 14.18(1.06) | 0.0318(0.0099) | 9.83e31(2.48e32) |
| AGNIR/AGNopt | 13 | 0.178(0.064) | 10.59(0.36) | 14.07(0.65) | 0.0018(0.0007) | 1.64e31(1.39e31) |
| AGNIR/SFGopt | 1 | 0.236(n/a) | 10.69(n/a) | 14.64(n/a) | 0.0023(n/a) | 1.33e31(n/a) |
| AGNIR/lineflux0 | 3 | 0.129(0.061) | 10.68(0.51) | 11.66(0.66) | 0.0026(0.0010) | 1.49e31(1.76e30) |
| Classa: | notAGNIR | AGNIR | SFGopt | AGNopt | Emission-line |
| No./% | No./% | No./% | No./% | No./% | |
| Sample | |||||
| G23/WISE | 29983/95.3% | 374/1.2% | 2202/7.0% | 765/2.4% | 13149/41.8% |
| subgroups | |||||
| notAGNIR | 29983/100% | 0/0% | 2041/6.8% | 695/2.3% | 12121/40.4% |
| AGNIR | 0/0% | 374/100% | 24/6.4% | 31/8.2% | 108/28.9% |
| SFGopt | 2014/92.7% | 24/1.1% | 2202/100% | 0/0% | 2202/100% |
| AGNopt | 695/90.8% | 31/4.1% | 0/0% | 765/100% | 765/100% |
| 936/G23/WISE | 813/91.5% | 51/5.7% | 140/15.7% | 56/6.3% | 352/39.6% |
| subgroups | |||||
| notAGNIR | 813/100% | 0/0% | 130/16.0% | 38/4.7% | 308/37.9% |
| AGNIR | 0/0% | 51/100% | 1/2.0% | 13/25.4% | 26/51.0% |
| SFGopt | 130/92.9% | 1/0.7% | 140/100% | 0/0% | 140/100% |
| AGNopt | 38/67.8% | 13/23.2% | 0/0% | 56/100% | 56/100% |
| Classb: | AGNIR/photo | notAGNIR/photo | AGNIR/shock | notAGNIR/shock | |
| No. | No. | No. | No. | ||
| G23/WISE AGNopt | 26 | 446 | 5 | 249 |
| Sample | band | sample sizea | mean (SD) |
|---|---|---|---|
| (magnitude) | |||
| G23phb | K | 92838 | 18.00(0.95) |
| NUV | 81981 | 21.99(1.17) | |
| G23ph/936c | K | 1467 | 16.74(1.33) |
| NUV | 1296 | 21.18(1.65) | |
| G23ph/spd | K | 35236 | 17.42(0.88) |
| NUV | 32523 | 21.64(1.23) | |
| G23ph/sp/936c | K | 930 | 16.33(1.12) |
| NUV | 856 | 20.94(1.62) |
Peer Reviews
No public reviews on file for this paper yet. If you reviewed it on a platform where reviews are public (OpenReview, ICLR, NeurIPS, ICML), you can paste yours below so the community can read it here.
Videos
No videos yet. Explain this paper in a talk, walkthrough, or lecture? Add one.
\jid
PASA
\jyear2024
ASKAP Commissioning Observations of the GAMA 23 Field
Denis A. Leahy1 E-mail: [email protected]
A.M. Hopkins2
R. P. Norris3,4
J. Marvil4,5
J.D. Collier3,4,26
E.N. Taylor6
J.R. Allison7
C. Anderson4
M. Bell8
M. Bilicki9,10
J. Bland-Hawthorn11
S. Brough12
M.J.I. Brown13
S. Driver14
G. Gurkan15
L. Harvey-Smith4,3
I. Heywood16,17
B.W. Holwerda18
J. Liske19
A. R. Lopez-Sanchez2
D. McConnell4
A. Moffett20
M.S. Owers21
K.A. Pimbblet22
W. Raja4
N. Seymour23
M.A. Voronkov4
and L. Wang24,25
1Department of Physics and Astronomy, University of Calgary, Calgary, Alberta, T2N 1N4, Canada
2Australian Astronomical Optics, Macquarie University,105 Delhi Rd, North Ryde, NSW 2113, Australia
3Western Sydney University, Locked Bag 1797, Penrith, NSW, 2751, Australia
4CSIRO Astronomy and Space Science, Australia Telescope National Facility, PO Box 76, Epping, NSW 1710, Australia
5National Radio Astronomical Observatory, P.O. Box O, 1003 Lopezville Road, Socorro, NM 87801-0387, USA
6Centre for Astrophysics and Supercomputing, Swinburne University of Technology, Hawthorn, Vic 3122, Australia
7Sub-Dept. of Astrophysics, Department of Physics, University of Oxford, Denys Wilkinson Building, Keble Rd., Oxford, OX1 3RH, UK
8University of Technology Sydney, 15 Broadway, Ultimo NSW 2007, Australia
9Leiden Observatory, Leiden University, P.O. Box 9513, NL-2300 RA Leiden, The Netherlands
10National Centre for Nuclear Research, Astrophysics Division, P.O. Box 447, PL-90-950 Łódź, Poland
11Sydney Institute for Astronomy, School of Physics A28, University of Sydney, NSW 2006, Australia
12School of Physics, University of New South Wales, NSW 2052, Australia
13School of Physics and Astronomy, Monash University, Clayton, VIC 3800, Australia
14International Centre for Radio Astronomy Research (ICRAR), University of Western Australia, Stirling Highway, Perth, Western Australia
15CSIRO Astronomy and Space Science, PO Box 1130, Bentley WA 6102, Australia
16Astrophysics, Department of Physics, University of Oxford, Keble Road, Oxford OX1 3RH, UK
17Department of Physics and Electronics, Rhodes University, PO Box 94, Grahamstown, 6140, South Africa
18Department of Physics and Astronomy, 102 Natural Science Building, University of Louisville, Louisville KY 40292, USA
19Hamburger Sternwarte, Universitat Hamburg, Gojenbergsweg 112, 21029 Hamburg, Germany
20Department of Physics and Astronomy, Vanderbilt University, USA
21Department of Physics and Astronomy, Macquarie University, NSW 2109, Australia
22E.A.Milne Centre for Astrophysics, University of Hull, Cottingham Road, Kingston-upon-Hull, HU6 7RX, UK
23International Centre for Radio Astronomy Research, Curtin University, Bentley WA 6102, Australia
24SRON Netherlands Institute for Space Research, Landleven 12, 9747 AD, Groningen, The Netherlands
25Kapteyn Astronomical Institute, University of Groningen, Postbus 800, 9700 AV, Groningen, The Netherlands
26 The Inter-University Institute for Data Intensive Astronomy (IDIA), Department of Astronomy, University of Cape Town, Rondebosch, 7701, South Africa
Abstract
We have observed the G23 field of the Galaxy And Mass Assembly (GAMA) survey using the Australian Square Kilometre Array Pathfinder (ASKAP) in its commissioning phase, to validate the performance of the telescope and to characterize the detected galaxy populations. This observation covers 48 deg2 with synthesized beam of 32.7*′′* by 17.8*′′* at 936 MHz, and 39 deg2 with synthesized beam of 15.8*′′* by 12.0*′′* at 1320 MHz. At both frequencies, the r.m.s. (root-mean-square) noise is 0.1 mJy/beam. We combine these radio observations with the GAMA galaxy data, which includes spectroscopy of galaxies that are i-band selected with a magnitude limit of 19.2. Wide-field Infrared Survey Explorer (WISE) infrared (IR) photometry is used to determine which galaxies host an active galactic nucleus (AGN). In properties including source counts, mass distributions, and IR vs. radio luminosity relation, the ASKAP detected radio sources behave as expected. Radio galaxies have higher stellar mass and luminosity in IR, optical and UV than other galaxies. We apply optical and IR AGN diagnostics and find that they disagree for 30% of the galaxies in our sample. We suggest possible causes for the disagreement. Some cases can be explained by optical extinction of the AGN, but for more than half of the cases we do not find a clear explanation. Radio sources are more likely (6%) to have an AGN than radio quiet galaxies (1%), but the majority of AGN are not detected in radio at this sensitivity.
doi:
10.1017/pas.2024.xxx
keywords:
radio continuum: galaxies – surveys – infrared: galaxies – galaxies: active – galaxies: statistics
1 Introduction
The moderate redshift Universe (0.1) has in the past decade become accessible for large surveys of galaxies at optical and IR wavelengths. However, most radio surveys have sampled different populations from these, mainly because most bright radio sources represent the synchrotron emission from active galactic nuclei (AGN) (e.g. Heckman & Best 2014), which are relatively uncommon in optical and IR surveys. This is now changing, as the largest area radio surveys are now reaching the sensitivity where they are dominated by low-redshift star forming galaxies (SFG) (e.g. Norris 2017), in which the radio emission is powered by star formation processes. Thus, it is an opportune time to compare radio and galaxy surveys to find the same objects emitting in radio and optical/IR bands.
The Evolutionary Map of the Universe (EMU) (Norris et al., 2011) is a wide-field radio continuum survey planned for the new Australian Square Kilometre Array Pathfinder (ASKAP) telescope (Johnston et al., 2008). The primary goal of EMU is to make a deep (r.m.s. 10Jy/beam) radio continuum survey of the entire Southern sky at 1.3 GHz, extending as far North as +30 declination, with a resolution of 10 arcsec. EMU is expected to detect and catalogue about 70 million galaxies, including typical SFG up to z1, powerful starbursts to even greater redshifts, and AGN to the edge of the visible Universe. Here we report early EMU observations, taken during the commissioning phase of ASKAP, with the goal of characterizing the galaxy and radio galaxy samples.
Radio galaxies can be divided into two classes: SFG and AGN. The radio emission from SFG is synchrotron emission of cosmic-ray electrons accelerated by shocks from supernovae, and so the radio emission is confined to the inner few kpc of a galaxy, and is seen in the radio image as a single unresolved component. The radio emission is relatively weak, is strongly correlated with the far-IR flux, and is typically detected from galaxies in the nearby Universe, with a median redshift . In AGN, the radio emission is synchrotron emission emitted by the jets and lobes of relativistic electrons accelerated from the environs of a supermassive black hole, and may appear as a single, double, or triple component, or sometimes as a complex structure with visible jets. The radio emission can be very strong, and easily detectable up to very high redshifts.
Although these two types of radio source are powered by very different physical mechanisms, it is notoriously hard to distinguish between them from the radio data alone (Norris et al., 2013). While multiple-component sources and strong high-redshift sources are probably AGN, a single component source at low redshift, or with no measured redshift, may be either AGN or SFG.
Optical line ratios have been used as a diagnostic to classify galaxies as SFG or AGN since it was proposed by Baldwin et al. (1981). We use this Baldwin-Phillips-Terlevich (BPT) diagnostic in the form developed by Kewley et al. (2001), which uses the line ratios [OIII]5007/ and [SII]6717,6731/ (e.g., Hopkins et al., 2013). The line ratios are sensitive to the spectral hardness of the radiation which ionizes the gas, and can be used to determine when the radiation is too spectrally hard to originate from star formation, i.e., the ionizing radiation can only be produced by an AGN. We refer to the ([OIII]5007/) vs ([SII]6717,6731/) diagnostic as the BPT diagram and refer to this set of lines as the BPT lines.
AGN generate thermal radiation in the accretion disk surrounding a supermassive black hole. Much of this is reradiated in IR by dust with a wide range of temperatures, resulting in characteristic red mid-IR colours which can be distinguished from the mid-IR colours resulting from stars. The WISE mid-IR colour criterion W1-W2>0.8 was introduced by Jarrett et al. (2011), and is used here to aid in distinguishing AGN from other galaxies.
In this paper we present radio data obtained with ASKAP during its commissioning phase. One main emphasis is to verify that the radio observations are detecting real radio sources rather than imaging artifacts. The second is to use the radio data, in conjunction with optical and IR data, to study galaxy populations.
The optical data used here is from the GAMA survey (Driver et al., 2011), and the IR data from the WISE all-sky survey (Wright et al., 2010). GAMA is a spectroscopic survey of galaxies at low to moderate redshift (). The GAMA regions of the sky are accessible to EMU, thus GAMA is ideal for providing optical data on the galaxies observed by EMU. With the combined radio, optical and IR data of the galaxy surveys, we investigate their masses, redshifts, and states of activity (SFG vs AGN). Our goal is to measure properties which distinguish different galactic populations, using the unique combination of depth and sky coverage of ASKAP.
This paper is organized as follows. The ASKAP radio data analysis, GAMA optical data and WISE IR data are described in Section 2. In Section 3, we identify optical and IR counterparts to the radio sources and describe the statistical properties of the various sets, including redshifts and stellar masses derived from the optical data. In Section 3.3, we apply optical and IR AGN diagnostics to classify galaxies and radio sources and compare redshift, mass and luminosity distributions of the different subsets. The properties of the radio sources and of the differences in AGN classification using optical and IR methods are discussed in Section 4. A summary of the main results is given in Section 5.
We calculated luminosity distance from redshift, using standard cosmological parameters: flat universe with =70 km/s/Mpc, =0.27, =0.73. Stellar masses were determined using a Chabrier (2003) stellar initial mass function.
2 Observations and Data Analysis
2.1 Radio data
The Australian Square Kilometre Array Pathfinder (ASKAP; Johnston et al., 2008) is a new radio telescope approaching completion in Western Australia. It has a maximum baseline of 6 km, and operates with a bandwidth of 300 MHz over the frequency range 700 to 1800 MHz. Each of the 36 antennas is equipped with a Phased Array Feed (PAF; Schinckel et al., 2012) giving it a field of view of 35 deg2, resulting in a high survey speed. ASKAP’s continuum survey is the Evolutionary Map of the Universe (EMU Norris et al., 2011), which is expected to generate a catalogue of about 70 million galaxies at 1100 MHz.
At the time of the observations described here, the telescope was in a commissioning phase (McConnell et al., 2016). Only 12 of the antennas were used, with a maximum baseline of 2 km. An observation of PKS was performed immediately adjacent in time to each observation of the target field for purposes of instrumental calibration. Each calibration observation contained one calibrator scan of duration 5 minutes at the center of each of the 36 PAF beams. Using these data, the ASKAPsoft task “cbpcalibrator” was run to solve for the instrumental bandpass of each beam and to set the initial flux density scale based on the model of Reynolds (1994). As is customary with ASKAP, a phase reference calibrator was not included in the schedule due to the large overhead that would be incurred by observing it at the center of each beam. Instead, initial phases were transferred from the observation of the bandpass calibrator and further refined using self-calibration of the target field, and the astrometry was adjusted to match an external reference catalogue.
The observing parameters are listed in Table 1. The PAF beam configuration was 36 beams in a 66 square, with two observations A and B offset by half a beam width, at a position angle of 45∘. The 936 MHz map covers a larger region (7.3∘ by 6.8∘) than the 1320 MHz image (6.6∘ by 6.1∘) because of the larger primary beam size at 936 MHz. The data were reduced in ASKAPsoft using W-snapshots (Cornwell et al., 2012), which is a hybrid wide-field algorithm combining W-projection and warped snapshot imaging. The image was cleaned (deconvolved) using the Cotton-Schwab algorithm and a single (delta function) spatial scale.
The resulting synthesized beam was 32.7*′′* by 17.8*′′* at 936 MHz and 15.8*′′* by 12.0*′′* at 1320 MHz. The synthesized beam of the higher frequency observations is more circular than the beam at lower frequency because of differences in the U-V coverage, which is due primarily to differences in hour angle coverage and different amounts of antenna-based flagging. In both cases, the output images consisted of 7784 7387 pixel images, where each pixel is a 4-arcsec square.
Because these data were taken at an early stage of ASKAP commissioning, our flux density and astrometry calibration were still in a preliminary state, and so these had to be corrected after processing. This was done by comparing the ASKAP images with the NVSS (Condon et al., 1998) and SUMSS (Bock et al., 1999) catalogues. We used only non-blended, unresolved sources detected at signal-to-noise (hereafter SN) above 5 in ASKAP, NVSS and SUMSS, and which were not flagged as problematic.
The offsets of the raw 1320 MHz ASKAP positions from the NVSS positions are shown in the top panel of Figure 1. The scatter plot for 936 MHz is similar. The medians of the 1320-NVSS and 936-NVSS position offsets were used as the position corrections for the 1320 MHz and 936 MHz images, respectively. The 1 astrometric accuracy was estimated by using the median absolute deviation, converted to 1. At 936 MHz the resulting 1 accuracy is 3.00*′′* in R.A. and 3.40*′′* in Dec. and at 1320 MHz the resulting 1 accuracy is 2.37*′′* in R.A. and 2.64*′′* in Dec.
The flux density scale was calibrated by using sources that were in both NVSS and SUMSS. We interpolated between SUMSS (843 MHz) and NVSS (1420 MHz) flux densities for each source assuming a power-law spectrum. We tabulated the ratios of the calculated 936 MHz and 1320 MHz NVSS-SUMSS flux densities to the raw 936 MHz and 1320 MHz ASKAP flux densities, respectively. The histogram of these ratios for 1320 MHz is shown in the bottom panel of Figure 1. The median calculated to raw 936 MHz flux density ratio was 0.8810 and the median for 1320 MHz was 0.8830. These median ratios were used as flux density correction factors for the ASKAP 936 MHz and 1320 MHz images, respectively.
The resulting images are shown in Figures 2 and 3. The root-mean-square (r.m.s.) noise of source free regions in both 936 MHz and 1320 MHz images is 0.1 mJy/beam. To illustrate the image quality obtained with ASKAP in its commissioning phase, we show images on spatial scales of tens of arcminutes. Figure 4 and Figure 5 show regions with typical r.m.s. noise level in the maps (0.1 mJy). The first illustrates some double radio sources. The latter shows one triple source (central source plus two lobes) at the top centre of the image and a fainter triple source at the lower left.
2.1.1 Source extraction
We make the distinction between components, which are individual point-like detections in a radio image, and sources, which can be either a single component or composed of multiple components, such as a double-lobed radio galaxy. The Aegean software (Hancock et al., 2012) was used for component extraction. We used a threshold, resulting in a list of 6053 components at 936 MHz, and 3827 at 1320 MHz.
Small but significant residuals, of order 1% of the peak flux density, are found around bright components. The residuals occur in a spiral pattern which extends out to a radius of about 6*′* (10 times the synthesized beam). Figure 6 shows a bright component exhibiting such residuals, the resulting false components, and our correction for them. The flux densities of the false components were all less than 1.25% of the integrated flux density of the bright central component at 936 MHz, and less than 1.6% at 1320 MHz. We started with the brightest component in the map and labelled it as the “source”. All components within 6*′* radius of the “source” which were fainter than 1.25% (at 936 MHz) or 1.6% (at 1320 MHz) of the “source" were added to a list of possible false components. This was repeated for the second brightest component in the map, and so on, until a complete list of possible false components was created. The false components were removed from the original component list except for those few not consistent with the spiral beam residual pattern. After artifact removal, the catalogue contained 5968 components at 936 MHz, and 3757 at 1320 MHz.
2.1.2 Source counts
The source counts normalized by the Euclidean slope ( vs. flux density), are shown in Figure 7 for 936 MHz and 1320 MHz. The smooth line is a fit to the compilation of published source count data from Hopkins et al. (2003). The flux densities for 936 MHz sources and 1320 MHz sources were adjusted to 1.4 GHz flux densities using a spectral index of .
The data for both frequencies match well the fit line between mJy and Jy. Above 0.2 Jy, the counts are dominated by small number statistics, reflected in the large error bars. Below mJy, the observations fall below the expected source counts, indicating that they are incomplete at this level, particularly at 1320 MHz. The map r.m.s. is 0.1 mJy excluding the edges. The r.m.s. rises nearly linearly from to 0.1 mJy at 0.5∘ from the edges to 0.5 mJy at the edges. It also rises from 0.1 mJy at 0.25∘ away from 0.5 Jy sources to 1 mJy at 0.05∘ away. The fraction of the map area with r.m.s above 0.1 mJy is 0.2. Thus a significant fraction of sources below 1 mJy are not detected at the level.
2.1.3 Identifying complex radio sources
About 95% of radio sources at the mJy level, which we term “simple”, consist of a single component which is coincident with the optical host galaxy (e.g., Norris et al., 2006). The remaining 5% are complex sources, such as double-lobed radio galaxies which appear on the radio image as two isolated components typically separated by tens of arc seconds, with the optical host galaxy located roughly halfway between them. Cross-matching simple sources with optical/IR data is straightforward, and can be achieved using any of several algorithms and tools such as those available within TopCat (Taylor, 2011).
To identify the complex sources, we compiled one list of candidate complex sources from the list of “islands” generated by Aegean, and a second list of candidates by using TopCat to identify pairs and groups of more than two sources within a radius of 6 arcmin. There was a significant overlap () between these two lists of candidates. The difference between the two lists illustrates the difficulty of using a single algorithm to identify complex sources. The visual inspection of Aegean islands and TopCat groups resulted in a revised list of singles, doubles and triples. The singles include those components that were put in islands or groups by the software, but had no visual evidence of association. All islands and groups of 4 or more were found to consist of a double or triple plus unrelated singles.
We tested the doubles against the Magliocchetti criterion (Magliocchetti et al., 1998), for which the flux density ratio of the two lobes is required to be between 1/4 and 4, and the separation is required to be 100*′′* . We used a flux density ratio between 1/3 and 3, to err on the side of rejecting sources, but only found one source with flux density ratio between 1/4 and 1/3 (or 3 and 4) that also passed the separation test. Sources that failed this test were split into components and added back to the singles list.
We scanned the full ASKAP radio images for radio doubles or triples not identified by either Aegean or TopCat algorithms, and found several more radio doubles and triples, typically those with large angular separation. The resulting numbers of single, double and triple radio sources are shown in Table 2.
To estimate host galaxy positions and integrated flux densities for the double sources, we calculated the flux density-weighted centroid and the total integrated flux density. For the triples, we assumed the host position to be that of the component closest to the centre. The distribution of 1320 MHz integrated flux densities for the double sources, triple source and full set of singles, doubles and triples is show in Fig. 8.
2.2 Comparison with NVSS and SUMSS surveys
We compared our 936-MHz and 1320-MHz images and components with the 1420 MHz NVSS and SUMSS 843 MHz catalogues to verify the ASKAP imaging and source detection algorithms.
Figure 9 shows a region from the 936-MHz map comparing the 936-MHz detected components with components from the NVSS and SUMSS catalogues. In the full area covered by the 936-MHz image, there are 5897 936-MHz components, 2718 NVSS components and 1152 SUMSS components. There are 2209 936-MHz - NVSS cross-matches within 20*′′, 879 936-MHz - SUMSS matches and 943 NVSS - SUMSS matches. In the full area covered by the 1320-MHz image, there are 3756 1320-MHz components, 1724 NVSS components and 735 SUMSS components. There are 1532 1320-MHz - NVSS cross-matches within 20′′*, 702 1320-MHz - SUMSS matches and 701 NVSS - SUMSS matches.
All bright components ( mJy) are detected in all 3 data sets, ASKAP, SUMSS and NVSS. The number of faint matches is consistent with expectations for detections of real components with noise, given the different sensitivities of the data.
2.3 Optical Data
The GAMA G23 imaging and i-band photometric data is from the VST Kilo-Degree Survey (KiDS, de Jong et al. 2013), and ZYJHKs-bands data is from the VISTA Kilo-degree Infrared Galaxy survey (VIKING, Edge et al. 2013). The GAMA photometry is described in Driver et al. (2016) and was obtained from the GAMA Data Management Unit (DMU) “G23InputCatv6”. All magnitudes are in the AB system. The G23 spectroscopic sample was VST KiDS i-band selected with a magnitude limit of 19.2. The GAMA spectral catalogue is described in Hopkins et al. (2013). The data reduction, spectral analysis and redshift completeness are described in Liske et al. (2015). The spectral line information is from the GAMA DMU “SpecLineSFRv5”. There are 37359 galaxies with spectra and redshifts for the area overlapping the 936 MHz field.
Because full SED-derived stellar mass estimates were not yet available for G23, we obtained stellar mass estimates for G23 galaxies by matching each G23 galaxy to galaxies with similar redshift and iZYJHKs photometry in the GAMA equatorial catalogues, and assuming they had a similar mass. We use a Gaussian weighting kernel, with size of 0.005 in the redshift dimension and sizes of the photometric 1 errors in the photometric dimensions, to find the average mass-to-light ratio of the ‘similar’ reference galaxies, and assigned that mass to the G23 galaxy. This idea is similar in spirit to kernal-density estimation (KDE) photometric redshift estimation of Wolf et al. (2017). We have validated this approach by testing our ability to recover the SED-fit mass estimates for half of the equatorial catalogue, using the other half of the catalogue as a reference sample. We find that the global random error in the mass estimates derived in this way is of the order of 0.15 dex, compared to a median formal uncertainty of 0.12 dex for the SED-fit mass estimates described in Taylor et al. (2011). This yields 35353 galaxies with mass determinations.
2.4 IR data
The IR data were taken from the ALLWISE catalogue of the WISE satellite (Wright et al., 2010). A detailed description of the WISE mission and catalogue is on-line at the Infrared Science Archive (IRSA) at NASA/IPAC (http://irsa.ipac.caltech.edu). The catalogue (hereafter referred to as WISE) contains Vega magnitudes and errors for wavebands at 3.4, 4.6, 12, and 22 micron wavelengths (bands W1, W2, W3, W4). The angular resolution is 6.1*′′, 6.4′′, 6.5′′, and 12.0′′* in the four bands, respectively. The w1mpro, w2mpro, w3mpro, w4mpro magnitudes and errors were used in the current analysis. The appendix of Cluver et al. (2014) discusses the effect for resolved (nearby) sources on the WISE mpro magnitudes. The w1mpro and w2mpro magnitudes are fainter than isophotal magnitudes by . Here we are using W1-W2 colour which is much less affected for resolved sources.
3 Multi-wavelength analysis of the ASKAP radio sources and G23 galaxies
3.1 Source cross-matching
We cross-matched the 936 MHz and 1320 MHz catalogues of radio sources to the G23 galaxies by matching positions within a specified radius using TopCat. For each cross-match, we first plotted the separation distribution for the real catalogues and for the case where one of the catalogues had the positions randomized. Then we compared the separation distributions to determine an optimum radius for separating real from random matches. The 936 MHz and 1320 MHz catalogues were matched using a radius of . The 1320 MHz catalogue was matched with G23 using radius . The 936 MHz catalogue was matched with G23 using radius . Because the 1320 MHz sources were essentially a subset of the 936 MHz sources, we mainly report results for the larger set of 936 MHz cross-matches.
We cross-matched the 936 MHz and 1320 MHz catalogues and the matched 936 MHz/1320 MHz catalogue with WISE using a radius of . This is smaller than for the cross-match of radio catalogues with G23 because of the much higher source density on the sky for WISE than G23.
G23 was cross-matched with WISE using radius of . This gives low contamination (0.84%), and yields a large fraction of cross-matches (87.6%). For the GAMA G12 and G15 fields, Cluver et al. (2014) found similar results: 77% (for G12) and 88% (for G15) of the galaxies had WISE W1 and W2 detections at .
We compared the cross-match of the 936 MHz/WISE catalogue to G23 with the cross-match of the 936 MHz catalogue with the G23/WISE catalogue. The latter yields better results: the number cross-matches is somewhat reduced, but there is much lower contamination with random cross-matches. The reason for this is the superior spatial resolution of both G23 positions (sub-arcsec) and WISE positions ( ) compared to the uncertainties of the radio positions ( ). 111 The WISE catalogue contains sources detected at 5, thus does not contain all galaxies with emission in the WISE bands. Forced photometry at the positions of the G23 galaxies would likely have found many WISE sources associated with the galaxies, although that is beyond the scope of the current work.
From these different catalogues, we then extracted the following subsets:
all galaxies with spectra and masses; 2. 2.
all galaxies with spectra, masses and BPT line flux measurements; 3. 3.
all galaxies with spectra, masses and all BPT lines in emission; 4. 4.
all galaxies with spectra, masses and at least one BPT line in absorption; 5. 5.
all galaxies with spectra, masses and all BPT lines in absorption.
Summaries of the numbers of sources in the different subsets are given in Table 3 and, in part, in Figure 10. All galaxies with spectra have redshifts.
3.2 Properties of cross-matched sources
A mass-redshift diagram for G23 galaxies and their 936 MHz radio counterparts is given in the top panel of Figure 11. At all redshifts, the radio sources occur in the high-mass end of the galaxy mass distribution. The radio source mean masses (‘936/G23 spectra/mass’ and ‘936/G23/WISE spectra/mass’) are significantly higher than for the full galaxy population (‘G23 spectra/mass’), by factors of 2.14 and 2.34, respectively. The 936 MHz and 1320 MHz mass distributions are not significantly different.
The middle panel of Figure 11 shows i-band magnitude vs redshift for the G23 galaxies and for radio counterparts compared to lines of constant i-band absolute magnitude and . The radio sources are associated with the optically most luminous galaxies, consistent with them having higher than average stellar masses. The fact that the radio counterparts extend down to the detection limit of the G23 region (a horizontal line at i band magnitude of 19.2) implies that the radio observations are fairly complete for redshifts .
The bottom panel of Figure 11 shows integrated radio flux density vs redshift for the 936 MHz radio counterparts. Lines of constant radio luminosity are shown. Cosmological volume increases rapidly with redshift so the number of luminous radio sources (e.g. within a band between a pair of blue lines) should increase rapidly. This illustrates increasing incompleteness with redshift of radio counterparts and of galaxies.
There are two reasons why we do not observe more radio counterparts:
- •
Radio counterparts are not detected below the lower edge of the observed distribution because of the limited sensitivity of the radio observations.
- •
Radio counterparts are not observed at high redshift () because of the lack of such galaxies in G23. The gradual decrease in radio counterparts between redshift 0.1 and 0.6 is consistent with the decrease in the number (i.e. completeness) of optically measured galaxies with redshift, as seen in the top and middle panels.
Both factors contribute to lack of observed radio counterparts. The number of observed radio sources (5791 at 936 MHz) is much larger than the number with optical counterparts (978). Those without optical galaxy counterparts may lie either at with their optical counterpart fainter than the G23 magnitude limit, or at . The relatively high radio flux density limit of these observations suggests that most are likely to be high radio luminosity AGNs at high redshifts (e.g., Seymour et al., 2008) or, possibly, dust obscured galaxies at lower redshifts ().
Radio sources, such as broad-line AGN and star forming galaxies, typically have bluer near-ultraviolet (NUV) colours than the overall galaxy population (Heckman & Best, 2014). We used NUV magnitudes from the G23 input catalogue derived from GALEX observations (Liske et al., 2015). The mean NUV magnitude is 21.11 for galaxies detected at 936 MHz compared to 21.94 for all galaxies. For NUV magnitudes brighter than 19, the probability of a galaxy to have radio emission is higher by a factor of . For SFG, brighter UV magnitudes imply higher star formation rates (Brown et al., 2017). The UV could be from accretion disks of AGN, however recent measurements of the AGN UV luminosity function (Ricci et al., 2017)222 Ricci et al. (2017) also noted that the SF in AGN contributed a significant fraction of the total UV emitted by AGN. imply that the UV input to the universe from SFG is significantly larger than from AGN. Thus the brighter UV from radio-detected galaxies in most cases is dominated by star formation.
The brightest emission line galaxies in either H or H are mostly detected as 936 MHz sources: 8 out of the 10 brightest H emitters and 7 out of the 10 brightest H emitters are 936 MHz sources whereas only 1 in 25 galaxies with H and H emission lines is a 936 MHz source. Thus, radio sources are highly over-represented in the population of brightest H and H galaxies.
Compared to the full optical sample, the fraction of strong H absorption line systems is larger by a factor of for the radio counterparts. The mass distributions are shown in the top panel of Figure 12. The mean log(M/) is 10.37 for the whole galaxy sample, 10.68 for the optical galaxy H-absorption-line sample, and 11.00 for the 936 MHz detected H-absorption-line sample. The stronger H absorption line strengths for 936 MHz galaxies are related to the higher masses for 936 MHz H absorption line systems. This is similar to the result from Best et al. (2005) that the fraction of galaxies that host a radio AGN rises strongly with host stellar mass. While the radio flux density limit of the current data is significantly lower than in that work, and the current set of radio sources includes a larger fraction of SFG, it is clear that the highest mass systems include those with old stellar populations, and their radio emission is likely driven by an AGN.
Radio sources have much stronger mid-IR emission than non-radio galaxies in general (see Table 3). The 936/G23/WISE sources have a mass about a factor of higher than the G23/WISE galaxy population. We created a sample of not936/G23/WISE galaxies by excluding the radio-emitters. Then we selected a mass-matched set of non-radio galaxies by choosing the best match by mass from the not936/G23/WISE set for each radio galaxy in the 936/G23/WISE set. We verified that the mass distribution of the not936/G23/WISE/mass-matched set is essentially identical to that of the 936/G23/WISE set. The resulting luminosity distributions of the radio and non-radio emitters is shown in the bottom panel of Figure 12. There is no difference, except for the 3 radio sources with highest luminosity, so we can conclude that the higher mid-IR emission of radio sources is consistent with being associated with increased mass of the galaxy.
Both and 1.4 GHz luminosities are star formation rate indicators for SFG (e.g. Kennicutt et al. 2009, Rieke et al. 2009, Brown et al. 2017, Cluver et al. 2017). For AGN, they are indicators of AGN activity (Gürkan et al., 2014). We show the tight correlation between 22 and 936 MHz luminosities (, units erg/s/Hz) for the 936/G23/WISE galaxies in the top panel of Figure 13.333The conversion from W4 magnitude to flux density in Jy is given in the WISE explanatory supplement on the NASA/IPAC/IRSA website. The effective wavelength of the W4 filter has been recalibrated to (Brown et al., 2014a). No K-corrections were applied to obtain luminosities in this study. We also show the range of ratio 936 MHz to luminosity found by Rieke et al. (2009) for SFG by the two black dashed lines. 68% (95%) of the data falls within 0.3 dex (0.6 dex) of a 936 MHz to luminosity ratio of 0.13. Consistent with our results, Brown et al. (2017) finds that 150MHz, 1.4GHz and luminosities as a function of H luminosity have scatter of 0.2 dex. Thus it is seen that the majority of our radio/optical/IR galaxies are consistent with their radio and emission powered by star formation.
3.3 AGN and SFG diagnostics
3.3.1 IR AGN diagnostic
The WISE mid-IR colour criterion W1-W2>0.8 was introduced by Jarrett et al. (2011) to distinguish AGN from other galaxies. Stern et al. (2012) found that AGN can be identified, with 95 reliability and 78 completeness, using this criterion. Sources with W1-W20.8 () are labelled AGNIR and those with W1-W20.8 () are labelled notAGNIR. The W1-W2 test gives an AGNIR classification for 374 sources and a notAGNIR classification for 29983 sources.
The AGNIR and notAGNIR galaxies have strikingly different properties. Figure 13 (top panel) shows the AGNIR constitute 1/2 of the outliers from the radio vs. relation, whereas they are only a small fraction (0.08) of the radio and emitting galaxies. The bottom panel of Figure 13 shows the radio luminosity distributions of AGNIR and notAGNIR. The AGNIR are more luminous on average by a factor of 156 at 936 MHz.
Figure 14 shows the redshift, mass and luminosity distributions for G23/WISE and 936/G23/WISE samples. The mean redshift of AGNIR is much higher than for notAGNIR (see Table 4). The mean mass of G23/WISE AGNIR is nearly the same as for notAGNIR, and the mass distributions are nearly the same (Figure 14 middle panel). The mean luminosity of AGNIR is higher by a factor than for notAGNIR (for the G23/WISE w4snr3 sample).
For the 936 MHz detected G23/WISE galaxies (whole and w4snr3 subsample, see Table 4), the AGNIR redshifts and 936 MHz radio flux densities are higher (by factor for redshift and for flux density) than for notAGNIR. There is an even more extreme difference considering luminosities: the luminosities are higher by a factor of 20 than for notAGNIR (for the w4snr3 subsample). The AGNIR mean masses are similar for the whole 936/G23/WISE sample and the subsample with w4snr3. However the notAGNIR mean mass is higher (by a factor of 2.0) for the whole 936/G23/WISE sample compared to the subsample with w4snr3.
The fact that such strong differences in redshift and luminosity are seen between the AGNIR and notAGNIR categories indicates that the contamination of AGNIR by notAGN galaxies and of notAGNIR by AGN is not a large fraction of either category. Contamination of notAGNIR by low luminosity AGN would not strongly affect the redshift and radio luminosity difference we see between the AGNIR and notAGNIR sets.
3.3.2 Optical AGN/SFG diagnostic
As a complement to the W1-W2 colour criterion, we use the BPT diagnostic to distinguish AGN from SFG. Requiring observed BPT line fluxes rejects all galaxies which have because the [SII]6717,6731 lines are redshifted out of the observed spectra. This has the side effect of rejecting high mass galaxies (1/3 to 2/3 of those above ).
To classify a galaxy as AGNopt or SFGopt, we required the entire error box in the BPT diagram to lie on the AGNopt or SFGopt side of the diagnostic BPT line. Figure 15 shows the BPT diagram. Galaxies which have an ambiguous classification because of line flux uncertainties are shown by the grey points.
For the G23 sample, about half (Table 3) of the galaxies with measured line fluxes have one or more of the BPT lines in absorption, and of the 15,000 with emission lines, 4400 had high enough SN to be classified by the BPT diagnostic. Table 4 gives the numbers of AGN and SFG for different subsets.
The mass distributions for the different categories are shown in the top and bottom panels of Figure 16. In order, from highest mean mass to lowest mean mass, the categories are: galaxies with all BPT lines in absorption; galaxies with at least one BPT line in absorption; SFGopt; AGNopt; and galaxies with all BPT lines in emission. The AGNopt-classified galaxies have the broadest mass distribution, inconsistent with single-peaked distribution and characteristic of a bimodal mass distribution. A fit to the distribution shows it requires two components: a high mass component peaking at , and a low mass component peaking at .
To compare the BPT criterion with the W1-W2 criterion, we use the G23/WISE sample. The requirement of a WISE detection in effect rejects low mass galaxies (see Table 3): it results in rejection of 1/6 or more of the galaxies below . Table 4 shows that the increase in mean mass for G23/WISE compared to G23 depends on the AGN classification: G23/WISE AGNopt has mean mass higher than G23 AGNopt by factor 2.24; and G23/WISE SFGopt has mean mass higher than G23 SFGopt by factor 1.35.
Next, the BPT diagnostic was applied to the radio detected 936/G23 sample. Figure 17 shows the mass distributions for the 936/G23 galaxies and their five sub-categories. Comparison of the mass distributions in Figure 17 with those in Figure 16 shows that masses for galaxies with 936 MHz emission are higher compared to galaxies without radio emission: AGNopt with 936 MHz emission has mean mass higher by factor 2.5 than the whole AGNopt set; and SFGopt with 936 MHz emission has mean mass higher by factor 1.3 than the whole SFGopt set. Similar results to that for 936/G23 are obtained when we apply the BPT diagnostic to 936/G23/WISE sample.
3.3.3 Comparison of optical-classified and IR-classified samples
The G23/WISE galaxies were separated into four categories: notAGNIR/SFGopt; notAGNIR/AGNopt; AGNIR/SFGopt; and AGNIR/AGNopt. These are shown on a BPT diagram in the top panel of Figure 18. The AGNIR and notAGNIR galaxies are scattered on both sides of the line which forms the BPT criterion demonstrating that there is no clear correlation seen between the BPT and W1-W2 diagnostics.
The middle panel of Figure 18 shows the various classes of galaxies placed in the WISE colour-colour diagram. Wright et al. (2010) and Jarrett et al. (2011) showed that the notAGNIR types include: ellipticals with W2-W3 of ; spirals with W2-W3 of ; luminous IR galaxies (LIRGs) with W2-W3 of ; and starbursts, liners and ultraluminous IR galaxies (ULIRGs) with W2-W3 of . The colour limits for these groups are shown in the bottom panel of Figure 18 overlaid on the distribution of W2-W3 colors. The notAGNIR/SFGopt have a W2-W3 colour range consistent with that for LIRGs or a mixture of LIRGS and starbursts/liners/ULIRGs. The notAGNIR/AGNopt have a wide W2-W3 colour range, consistent with a mixture of spirals and one or both of the other groups of galaxies (LIRGs and starbursts/liners/ULIRGs).
Table 5 shows that there is little quantitative correlation between the W1-W2 criterion and BPT criterion. Generally, the BPT classes of W1-W2 classified sources show poor correlation, e.g. for the G23/WISE sample, AGNIR are 6.4% classified as SFGopt and 8.2% classified as AGNopt. The W1-W2 classes of both SFGopt and AGNopt show most to be classified as notAGNIR.
The redshift distributions for the various categories of G23/WISE galaxies are shown in the left panels of Figure 19. The Kolmogorov-Smirnov test was applied and showed that the notAGNIR/AGNopt subset has a different redshift distribution (lower redshifts) than the AGNIR/SFGopt subset at >99.9% confidence. The notAGNIR/AGNopt have lower redshifts than notAGNIR/SFGopt at the 99% confidence level, and the AGNIR/AGNopt have lower redshifts than AGNIR/SFGopt at only the 97.5% confidence level. The mass distributions for the various categories of G23/WISE galaxies are shown in the right panels of Figure 19.
We further split the G23/WISE AGNopt galaxies into subsets based on the dominant mechanism of ionization (Sharp & Bland-Hawthorn, 2010): gas dominated by photo-ionization is left of the line (cyan line in the top panel of Figure 18) and shock-ionized gas is right of the line. Essentially the same line in the BPT diagram (Kewley et al., 2006) separates Seyferts (left of the line) from LINERs (right of the line). 64% of the AGNopt galaxies are photo-ionized/Seyferts and 36% are shock-ionized/LINERs.
The redshift and mass distributions of the photo-ionized and shock-ionized subsets of AGNopt galaxies are shown in Fig. 20. The AGNIR subsets are small in number with 26 in the photo-ionized subset and 5 in the shock-ionized subset. Thus the redshift distributions cannot be distinguished. The AGNIR/photo subset has a higher mean mass than the AGNIR/shock subset, by a factor of .
Comparison of the notAGNIR/photo subset with the notAGNIR/shock subset, shows that the shock-ionized fraction increases with redshift: from near 0 at to 50% for . The notAGNIR/shock subset has a narrower mass distribution than the photo-ionized subset and higher mean mass, by a factor of . For the notAGNIR, the shock-ionized subsets are shifted to higher redshift and to higher mass compared to the photo-ionized subsets. Because of the correlation of mass with redshift (see Fig. 11), which is a selection effect of the galaxy survey, these are not independent effects.
3.3.4 Comparison of optically-classified and IR-classified samples for the radio sources
Table 4 lists basic properties of the our different samples of G23 galaxies, with additional selections based on detection by WISE, by 936 MHz emission or by WISE W4 ( band). The goal here is to determine how the radio emitters differ from their parent samples. The SFG radio emitters (936/G23/SFGopt) have lower mean redshift but similar mean mass, than the parent galaxy sample (G23/SFGopt). The AGN radio emitters (936/G23/AGNopt) have lower mean redshift but higher mean mass, by factor 2.5, than the parent galaxy sample (G23/AGNopt). The lower redshift can be understood as a selection effect, but the higher mass should be intrinsic.
The WISE selected radio and non-radio emitting samples, 936/G23/WISE and G23/WISE, are compared. SFGopt and AGNopt have lower redshift for the radio emitters, but the mean masses of 936/G23/WISE SFGopt and AGNopt are essentially the same as for G23/WISE. With WISE selection, there are additional AGNIR and notAGNIR categories. The radio emitters have lower redshift for AGNIR and notAGNIR than for the G23/WISE sample. The mean masses of radio emitting AGNIR and the G23/WISE/AGNIR are the same, but the radio emitting notAGNIR have higher mean mass than G23/WISE/notAGNIR, by factor 2.1. The W1 magnitudes, related to the mass of the galaxy, of the radio emitters (936/G23/WISE) are brighter by 1 magnitude for all 4 subsets than for G23/WISE.
The radio (936 MHz) emitting subsets of AGNIR, notAGNIR, SFGopt and AGNopt sets are next compared. Table 4 lists some properties of these subsets, with the 936 label. First we consider the 936/G23/WISE sets. The highest redshift set is the AGNIR subset. The notAGNIR has highest mean mass (by a factor of over the other subsets). AGNopt and AGNIR are of similar mean masses and SFGopt are of lowest mean mass. The mean 936 MHz radio flux density of AGNIR is much higher than any of the other subsets (by a factor of above the overall mean for 936/G23/WISE galaxies). notAGNIR have the second highest radio flux density, higher than either AGNopt or SFGopt, by a factor of .
396 of the 936/G23/WISE sources have W4 luminosity with SN3 (labelled 936/G23/WISE w4snr3). The subsets’ sample sizes are small except for notAGNIR. The AGNIR are the most luminous subset at 936 MHz and at . The sub-categories, AGNIR/AGNopt, AGNIR/SFGopt and AGNIR/lineflux, are consistent with the same luminosity in the band, and the same flux density at 936 MHz.
Table 5 shows the breakdown of G23/WISE and 936/G23/WISE samples into IR AGN categories, BPT categories and the emission line galaxies category. The G23/WISE sample has a small fraction (1.2%) classified as AGNIR compared to notAGNIR. It has several percent classified as SFGopt or AGNopt. For the radio emitting sample, 936/G23/WISE, the fraction of AGNIR is 5.7%, larger by factor . The fraction of SFGopt or AGNopt for 936/G23/WISE is larger by a factor of 2-2.5 compared to G23/WISE. The rest of Table 5 is discussed in Section 4 below.
4 Discussion
4.1 Radio Source Distribution
We compared flux density distributions of the single, double, and triple sources (Fig. 8), and found that the peak for doubles and triples occured at 20 mJy compared to 1 mJy for the singles. All of the doubles and triples (except one) are AGNIR. The single notAGNIR triple does not have a G23 optical galaxy counterpart or redshift. In contrast, the singles are dominated by the lower radio luminosity SFG (813 notAGNIR vs 51 AGNIR).
The redshift distributions of the G23 galaxies and those with 936 MHz emission are shown in Figure 21. The radio emitters have similar redshifts to G23 galaxies, but they have real () excesses at redshifts of 0.0-0.10 and 0.35-0.60 and a deficit at redshifts of 0.10-0.30. There is a weak () excess for 1.2. This may be a result from having multiple types of radio sources (SFG and AGN), each with a different spatial distribution. We find that the median redshifts for doubles and triples (which are all AGN) are 0.39 and 0.37 whilst the median redshift for single sources (which includes AGN and SFG) is 0.21.
Figures 11 and 12 illustrated that galaxies that are radio sources are more massive than average. The mean mass is higher by a factor of and the peak mass of the distribution is shifted higher by a factor of .
We found K band and NUV magnitudes for G23 galaxies and radio counterparts by obtaining photometry from the G23 input catalogue. First we selected the set of G23 galaxies with photometry for the same sky area as the 936 MHz map. We also selected the subset with photometry and spectra, to check for selection effects of requiring spectra. We then cross-matched the 936 MHz sources to the G23 set and G23 subset with spectra to obtain photometry for the radio counterparts. Table 6 shows the means and standard deviations (SD) for the K band and NUV magnitudes of the galaxies and the radio counterparts. The mean K band flux for the radio-emitting galaxies is higher by a factor of , consistent with the mass excess. The mean NUV band flux for the radio emitters is higher by a factor of . The main effect of the additional requirement of having spectra (sp in Table 6) is the removal of the faint end of the magnitude distribution, hence reduction in the mean magnitudes by a small amount.
Figure 22 shows the distributions of K-band magnitudes and NUV magnitudes for the G23 galaxies with photometry and for the radio emitting subset. The radio emitters have much flatter distribution to low (brighter) magnitudes for both K and NUV. Radio-emission is detected much more frequently at high mass () (Fig. 12), at bright K magnitude () and at bright NUV magnitude (), by factors which range from . Mass and K magnitude are expected to behave similarly because the mass is dominated by K and M stars (main-sequence and giant), and the optical light is dominated by K and M giants. The excess UV magnitude can come from active star formation or from the accretion disk associated with an AGN.
The fraction of galaxies that host a radio-loud AGN is known to rise strongly with stellar mass (Best et al., 2005), from nearly zero below stellar mass of to for mass . For massive early-type galaxies, a strong correlation of radio power with K-band absolute magnitude has been demonstrated (e.g., Sadler et al., 1989; Fabbiano et al., 1989; Brown et al., 2011). For our full optical sample of galaxies (Figure 12), we find that there are no radio emitters below (with one exception). For the absorption line galaxies, which should be mostly massive early type galaxies, there are no radio emitters below . This is consistent with the results of Brown et al. (2011) and Best et al. (2005), despite the difference in galaxy samples.
4.2 AGN-SFG discrimination
In Section 3.3.2, we used two tests to distinguish SFG from AGN: W1-W2 and BPT. Both tests have weaknesses. Two main types of AGN (for a review, see Best & Heckman 2012) are High Excitation Radio Galaxies (HERGs) and Low Excitation Radio Galaxies (LERGs). The W1-W2 AGN diagnostic accepts some galaxies that are not AGN and misses AGN with weak mid-IR emission, such as LERGs. The BPT test can miss AGN with optically obscured nuclei and cannot be applied to the large fraction of galaxies that only present absorption lines.
Stern et al. (2012) showed that W1-W2 has high reliability using empirical AGN spectra and the galaxy spectral templates of Assef et al. (2010). However, that study did not consider all galaxy types. Some AGNIR are not true AGN: Brown et al. (2014b) used observed spectra of nearby galaxies to show that observed spectral energy distributions of low metallicity blue compact dwarfs and extremely dusty lumininous IR galaxies (LIRGS) give W1-W2 colours like AGN. LIRGs are found predominantly in older, massive galaxies with strong stellar absorption lines, thus would be found among the 13000 optical galaxies with absorption lines and not classified by the BPT criterion.
The WISE colors of LERGs and HERGs were investigated by Gürkan et al. (2014). They show that LERGs are found in the WISE color-colour diagram with W1-W20.8 and W2-W3 in a broad range of 2-6. The LERGs stand out most clearly from the other classes of AGN in the WISE vs radio 151 MHz luminosity diagram (their Fig.8). We converted the boundaries of the regions containing HERGs and LERGs to 936 MHz luminosity using a spectral index of and plotted those boundaries on Figure 13. The HERG and LERG regions are distinct from the region occupied by SFGs. Most galaxies in our sample of radio emitting galaxies are located in a region consistent with SFGs, and few are consistent with HERGs or LERGs.
The vs radio luminosity diagram was made for the subcategories of notAGNIR/SFGopt, notAGNIR/AGNopt, AGNIR/AGNopt and AGNIR/ SFGopt. We find notAGNIR/AGNopt and notAGNIR/ SFGopt are not distinguishable in vs radio luminosity. The AGNIR/AGNopt and AGNIR/SFGopt are at higher and radio luminosity than the two notAGNIR sets. However all 4 sets lie in the region of the blue points in the top panel of Figure 13444The requirement of optical classification (redshift 0.32) removes all of the high luminosity AGN in both and 926 MHz bands. Fig. 13 does not include the optical (redshift) selection, so includes those high luminosity AGN., and are in the region of SFGs rather than the regions of HERGs or LERGs.
The optical and IR classifications as AGN do not agree for a significant number of galaxies (see Table 5). 24 of the SFGopt are AGNIR (vs 2014 notAGNIR) and AGNopt are mostly notAGNIR (695) with few AGNIR (31). What causes the difference between BPT and W1-W2 classifications?
The W1-W2 classification is based on the slope of the 3.4 to 4.6 IR spectrum. This is on the long-wavelength Rayleigh-Jeans side of the stellar continuum peak for all stars, whether they are hot, massive and young, or old and cool. The presence of a strong AGN implies a significant contribution to the IR continuum by dust which is reradiating the AGN continuum. This results in a mid IR spectrum flatter than that seen in typical starbursts.
An AGN can have high extinction from the surrounding interstellar medium of the galaxy preventing the optical BPT lines from the AGN from being seen, while emission from star formation in the regions of the galaxy outside the high-extinction region may be detected. In this scenario the result is that such a galaxy will be classified as SFGopt, despite the presence of an AGN. Thus the SFGopt/ AGNIR galaxies can be explained as high-extinction AGN, accounting for one of the two conflicting classification pairs.
The extinction of galaxies is too small in the 3.4 to 4.6 range to affect the spectral slope, so the W1-W2 diagnostic can distinguish strong AGN from SFG. Faint AGN where the stellar continuum has a significant contribution (50%) in the 3.4 to 4.6 range have W1-W2<0.8 (Figure 2 of Stern et al. 2012), which results in faint AGN being classified as notAGNIR/SFGopt galaxies.
Wright et al. (2010) (their Figure 10) shows the WISE colour-colour diagram with different classes of galaxies in partially overlapping regions. The WISE colour-colour diagram for our sample (middle panel of Figure 18) shows that notAGNIR/AGNopt galaxies are at smaller W2-W3 than notAGNIR/SFGopt galaxies. Both of our sets overlap the spiral, LIRG and starburst regions. From the lower 2 panels of Fig. 18, we find that notAGNIR galaxies with optical emission dominated by star formation (SFGopt, blue histogram) are most consistent with W2-W3 colors of LIRGs. The notAGNIR/AGNopt (yellow histogram) have W2-W3 colors consistent with mixture of spirals and LIRGs and possibly starbursts. The two AGNIR categories (SFGopt and AGNopt) have few objects but spread across the LIRG, Seyfert, starburst, QSO and ULIRG regions of Figure 10 of Wright et al. (2010).
The notAGNIR/AGNopt galaxies have optical lines showing AGN-like ionization, but their mid IR is powered mainly by stellar emission. The W1-W20.8 notAGNIR criterion corresponds to the AGN contributing 62% of the mid IR emission (Stern et al., 2012) for redshift z<0.32 (the upper limit of galaxies classified by BPT). The left panel of Fig.2 of Stern et al. (2012) shows that almost the same limit (58%) applies for E(B-V)=1 and the doesn’t change much for higher extinction if z<0.32. Thus the AGN can contribute up to 60% to the mid IR emission, yet a galaxy will be classified as notAGNIR. We refer to this case as a weak AGN.
The notAGNIR/AGNopt could be weak AGN where the stellar mid IR dominates over the AGN mid IR, but the AGN optical emission would have to dominate over the stellar optical emission to give the AGNopt classification. Using the Kewley et al. (2006) criterion, we find 64% of AGNopt are Seyferts and 36% are LINERs. Because the vast majority of both sets are notAGNIR, this implies both Seyferts and LINERs, with few exceptions, are not classified as AGN using IR colors.
Some fraction of AGN should be in the phase where the AGN has shut off but the AGN photo-ionization remains. Such AGN would be seen as AGNopt/notAGNIR/photo, whereas active AGN would be seen as AGNopt/AGNIR/photo. Table 5 gives the observed number of seen as these two types (446 and 26, respectively). The ratio of these two types of in the current sample would imply the timescale for AGN photo-ionization to linger is greater than the AGN active phase by a factor of . The estimated timescale for lingering photo-ionization in AGN is to yr (Schawinski et al., 2015), and the AGN active timescale is estimated at yr. Thus the expected ratio of AGNopt/notAGNIR/photo to AGNopt/AGNIR/photo should be to 1, rather than . So, either: a) only 3 to 30 of the 446 AGNopt/notAGNIR/photo can be explained by lingering photo-ionization; or b) the AGN on and off timescales are inaccurate by 1 to 2 orders of magnitude. In the first case, there must be another explanation for most of the AGNopt/notAGNIR/photo.
In summary, there is the explanation of extinction for the apparent conflicting classification AGNIR/SFGopt, but no single convincing explanation for notAGNIR/AGNopt.
5 Summary and Conclusion
We have processed ASKAP commissioning observations of the GAMA G23 field in two frequency bands centred at 936 MHz and 1320 MHz, and have demonstrated that ASKAP produces excellent image quality, allowing identification of radio sources down to 1 mJy with positions accurate to . We extracted the radio components and identified multiple component radio sources to produce 936 MHz and 1320 MHz radio source catalogues.
The radio sources were position matched to GAMA G23 galaxies, to WISE IR sources and to G23 galaxies with WISE IR counterparts. The masses for the G23 galaxies were based on masses of photometry-matched galaxies from the GAMA equatorial fields. A summary of our analysis of the multi-wavelength data set is as follows.
- •
Of the 5800 radio sources, 1000 have counterparts amongst the G23 galaxies, 3000 have WISE IR counterparts and 900 have both G23 galaxy and WISE counterparts. Some fraction of the radio sources without WISE counterparts will be AGN too faint to be detected by WISE (IR-faint radio sources; e.g. Collier et al., 2014). The G23 galaxy radio sources tend to be those at the high-mass end (M*⊙*) of the galaxy distribution (top panel of Figure 11).
- •
Galaxies that are detected in radio are observed to be more massive, and brighter at K-band and UV, than those without radio sources. Radio emission from AGN is expected to be brighter for more massive galaxies, which are brighter in K band. Similarly, radio emission from star formation and UV emission are stronger for galaxies with active star formation.
- •
The majority of the ASKAP radio sources show the well-known correlation (Rieke et al., 2009) for SFG between the radio and mid-IR luminosities (Figure 13). A few tens of sources have excess radio emission, and are likely to host AGN, although not all are classified as AGN by their IR colour.
- •
The G23 galaxies were classified as AGNIR or notAGNIR, based on the W1-W2 indicator. 380 galaxies are classified as AGNIR, compared to 30,000 classified as notAGNIR. AGNIR have higher redshifts than notAGNIR (factor ) but similar masses. AGNIR have much higher luminosities (factor ). Only 50 of these AGNIR are radio sources.
- •
Using the BPT diagnostic, galaxies were classified as AGNopt or SFGopt. 770 galaxies are classified as AGNopt and 2200 classified as SFGopt. AGNopt have similar redshifts to SFGopt but a broader mass distribution.
- •
We find disagreement between these two AGN indicators. 24 of 55 AGNIR are classified as SFGopt and 700 of 2800 notAGNIR are classified as AGNopt (Table 5). The AGNIR/SFGopt galaxies can be explained in terms of obscured AGNIR. The reasons why AGNopt are classified as notAGNIR are not clearly understood yet.
- •
The radio sources were separated into AGNIR, notAGNIR, AGNopt and SFGopt subsets. These radio subsets are smaller by 1 order of magnitude than the galaxy subsets. Each of the 4 radio subsets has indistinguishable redshift distribution from that of the corresponding parent galaxy subset (Figure 19, left panels). We find that the level of disagreement between optical and IR AGN diagnostics is similar for the radio emitting subsets as for the corresponding parent galaxy subset (Table 5).
The results presented in this paper are a first step towards combining large deep radio survey data with large well-studied samples of galaxies in the nearby Universe with extensive multi-wavelength data. The EMU survey will be almost an order of magnitude more sensitive than the observations presented here, and this, combined with even deeper optical and IR observations, will provide even greater overlap between the radio, optical, and IR samples of galaxies, enabling radio observations to become another tool that will be used routinely to characterise and understand galaxies in the local Universe.
Acknowledgements
The Australian SKA Pathfinder is part of the Australia Telescope National Facility which is managed by CSIRO. Operation of ASKAP is funded by the Australian Government with support from the National Collaborative Research Infrastructure Strategy. ASKAP uses the resources of the Pawsey Supercomputing Centre. Establishment of ASKAP, the Murchison Radio-astronomy Observatory and the Pawsey Supercomputing Centre are initiatives of the Australian Government, with support from the Government of Western Australia and the Science and Industry Endowment Fund. We acknowledge the Wajarri Yamatji people as the traditional owners of the Observatory site. GAMA is a joint European-Australasian project based around a spectroscopic campaign using the Anglo-Australian Telescope. The GAMA input catalogue is based on data taken from the Sloan Digital Sky Survey and the UKIRT Infrared Deep Sky Survey. Complementary imaging of the GAMA regions is being obtained by a number of independent survey programmes including GALEX MIS, VST KiDS, VISTA VIKING, WISE, Herschel-ATLAS, GMRT and ASKAP providing UV to radio coverage. GAMA is funded by the STFC (UK), the ARC (Australia), the AAO, and the participating institutions. The GAMA website is http://www.gama-survey.org/ . This publication makes use of data products from the Wide-field Infrared Survey Explorer, which is a joint project of the University of California, Los Angeles, and the Jet Propulsion Laboratory/California Institute of Technology, funded by the National Aeronautics and Space Administration. DL is supported by a grant from the Natural Sciences and Engineering Research Council of Canada. The referee is acknowledged for a number of suggestions that led to improvements in this paper.
The reference list from the paper itself. Each links out to its DOI / PubMed record.
- 1Assef et al. (2010) Assef R. J., et al., 2010, Ap J , 713, 970 · doi ↗
- 2Baldwin et al. (1981) Baldwin J. A., Phillips M. M., Terlevich R., 1981, PASP , 93, 5 · doi ↗
- 3Best & Heckman (2012) Best P. N., Heckman T. M., 2012, MNRAS , 421, 1569 · doi ↗
- 4Best et al. (2005) Best P. N., Kauffmann G., Heckman T. M., Brinchmann J., Charlot S., Ivezić Ž., White S. D. M., 2005, MNRAS , 362, 25 · doi ↗
- 5Bock et al. (1999) Bock D. C.-J., Large M. I., Sadler E. M., 1999, AJ , 117, 1578 · doi ↗
- 6Brown et al. (2011) Brown M. J. I., Jannuzi B. T., Floyd D. J. E., Mould J. R., 2011, Ap J , 731, L 41 · doi ↗
- 7Brown et al. (2014 a) Brown M. J. I., Jarrett T. H., Cluver M. E., 2014 a, PASA , 31, HASH · doi ↗
- 8Brown et al. (2014 b) Brown M. J. I., et al., 2014 b, Ap JS , 212, 18 · doi ↗