Influence of galactic arm scale dynamics on the molecular composition of the cold and dense ISM II. Molecular oxygen abundance
V. Wakelam, M. Ruaud, P. Gratier, I. A. Bonnell

TL;DR
This study combines hydrodynamic simulations with chemical modeling to predict the low abundance of molecular oxygen in cold, dense interstellar regions, aligning with observational non-detections.
Contribution
It integrates physical evolution from diffuse to dense regions with detailed gas-grain chemistry to accurately predict O2 abundance in cold cores.
Findings
Predicted O2 abundances are below 1e-8 relative to proton density.
Column densities in cold cores are at most a few 1e14 cm-2.
Oxygen depletion onto grain surfaces explains low O2 abundance.
Abstract
Molecular oxygen has been the subject of many observational searches as chemical models predicted it to be a reservoir of oxygen. Although it has been detected in two regions of the interstellar medium, its rarity is a challenge for astrochemical models. In this paper, we have combined the physical conditions computed with smoothed particle hydrodynamics (SPH) simulations with our full gas-grain chemical model Nautilus, to study the predicted O2 abundance in interstellar material forming cold cores. We thus follow the chemical evolution of gas and ices in parcels of material from the diffuse interstellar conditions to the cold dense cores. Most of our predicted O2 abundances are below 1e-8 (with respect to the total proton density) and the predicted column densities in simulated cold cores is at maximum a few 1e14 cm-2, in agreement with the non detection limits. This low O2 abundance…
Click any figure to enlarge with its caption.
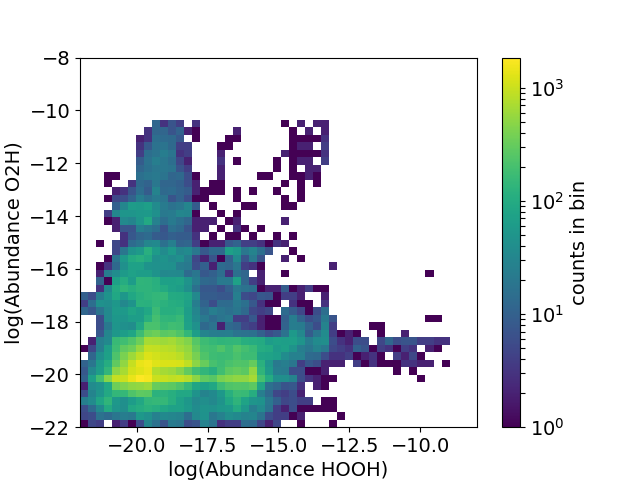 Figure 1
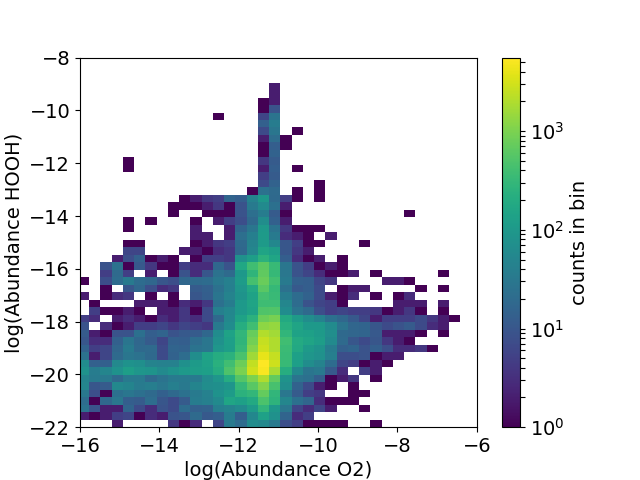 Figure 2
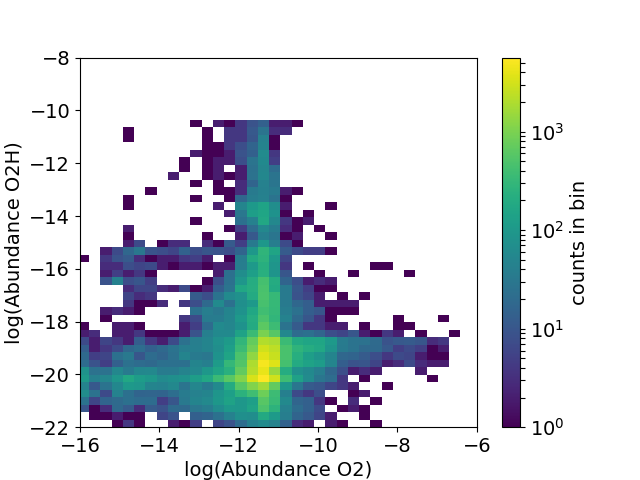 Figure 3
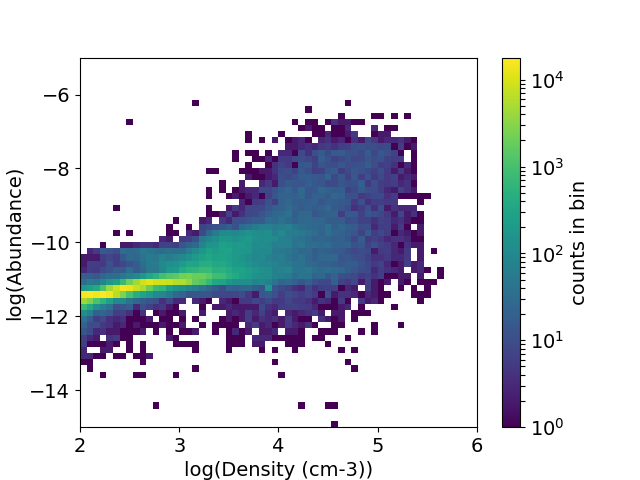 Figure 4
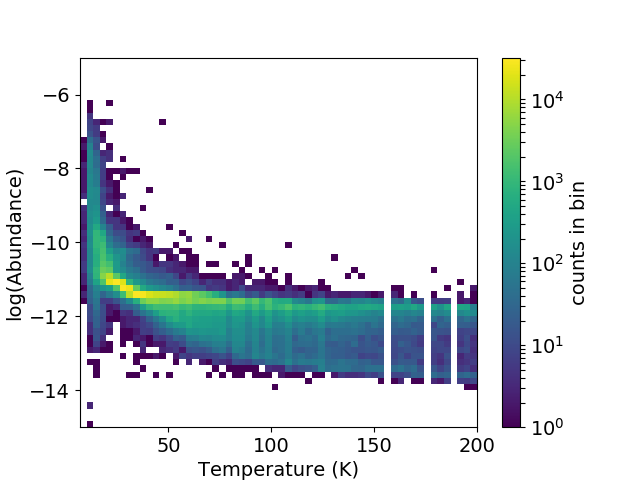 Figure 5
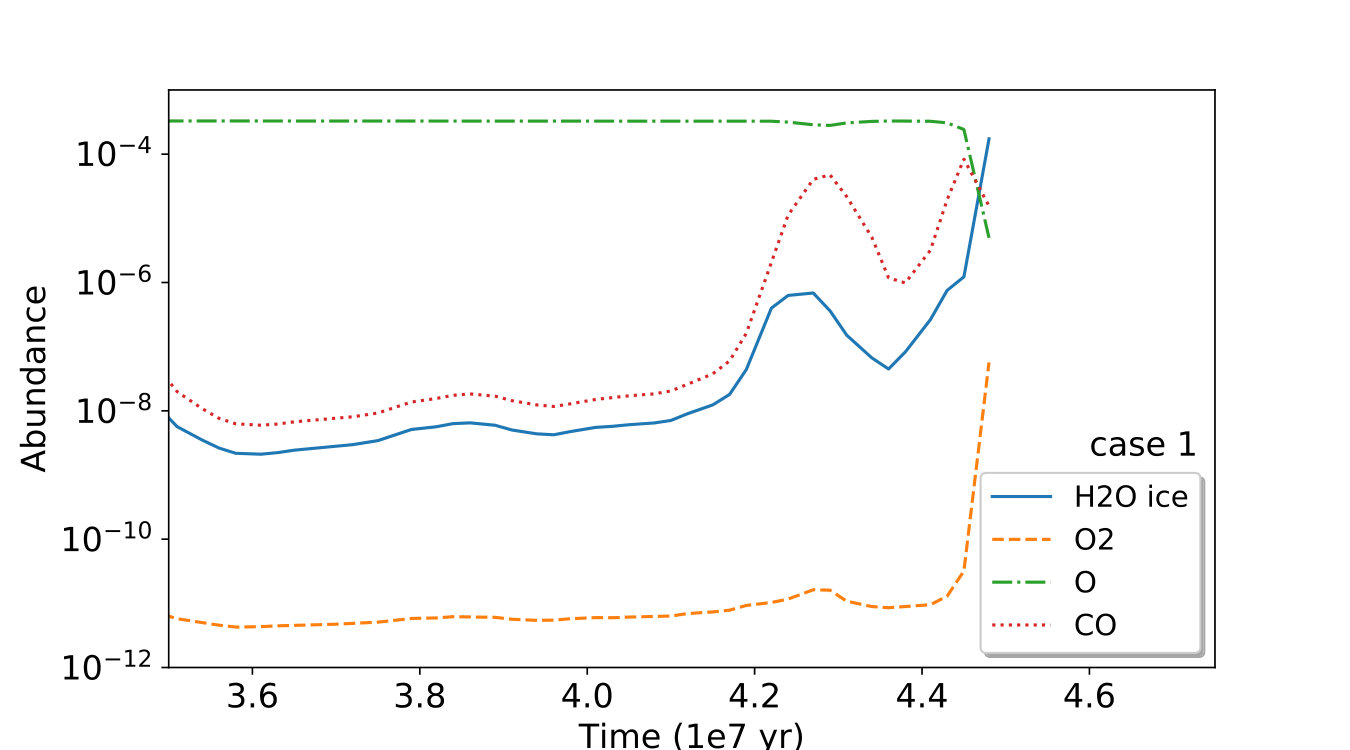 Figure 6
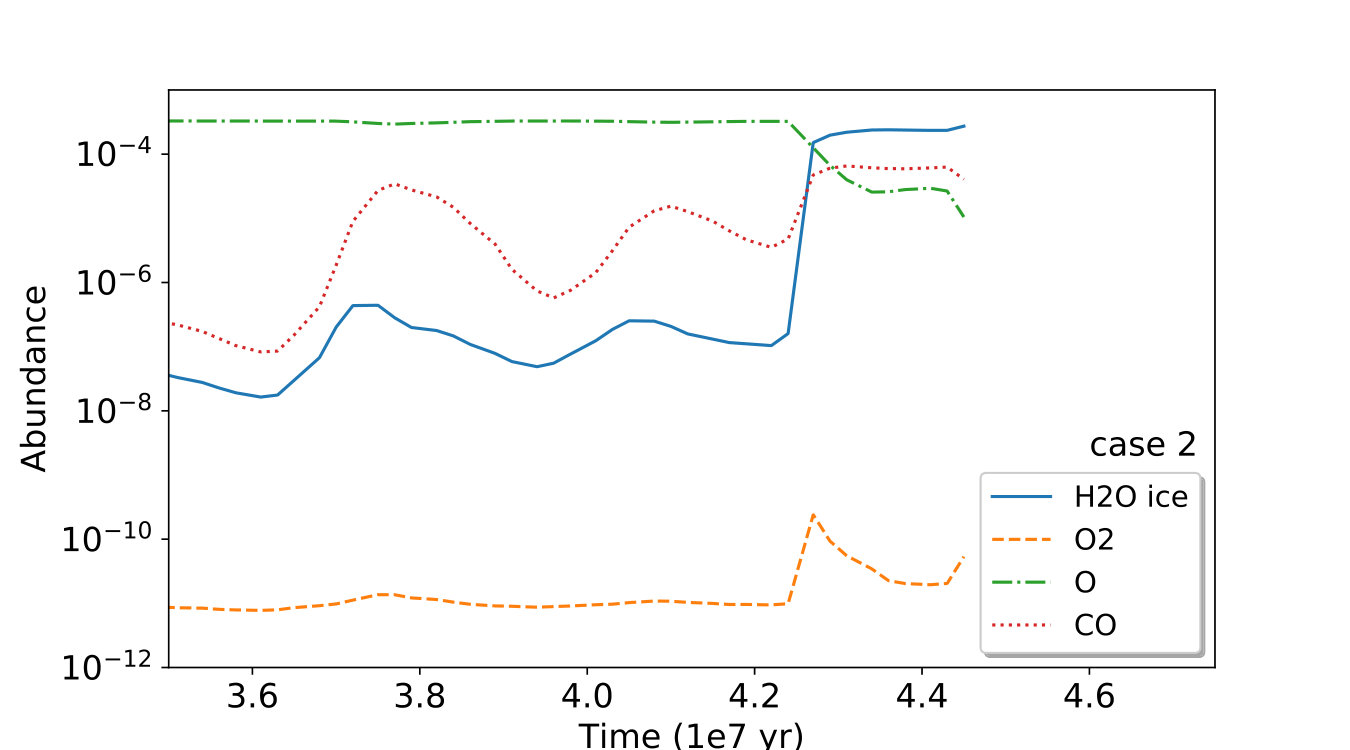 Figure 7
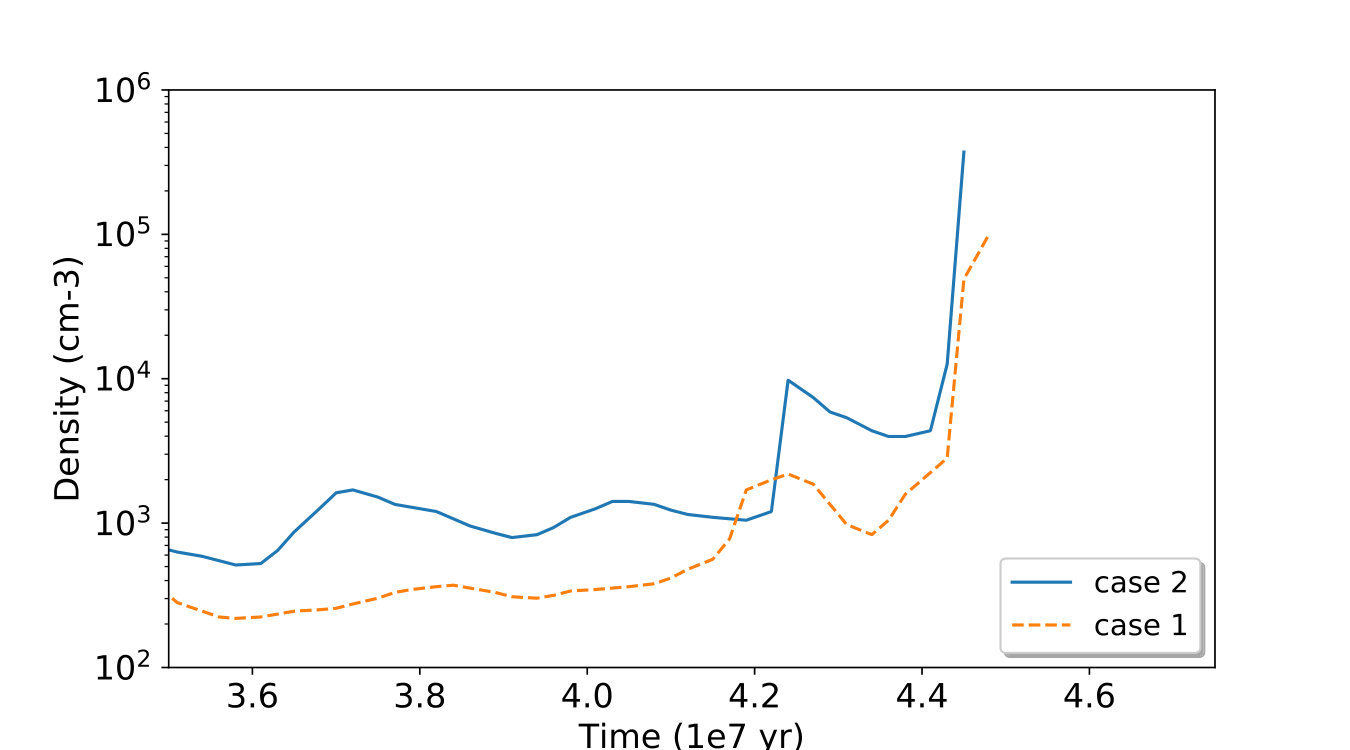 Figure 8
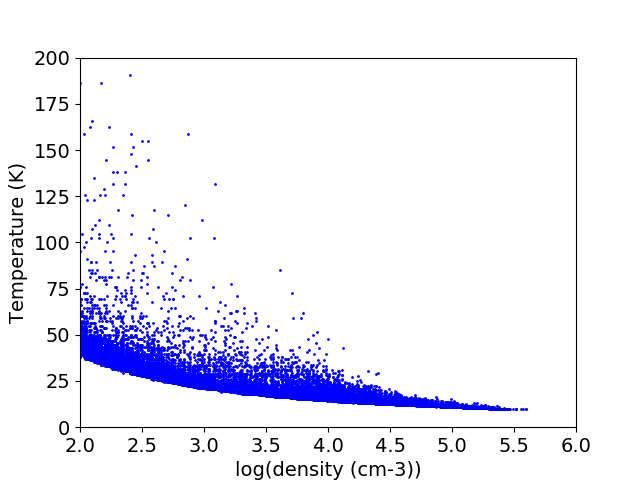 Figure 18
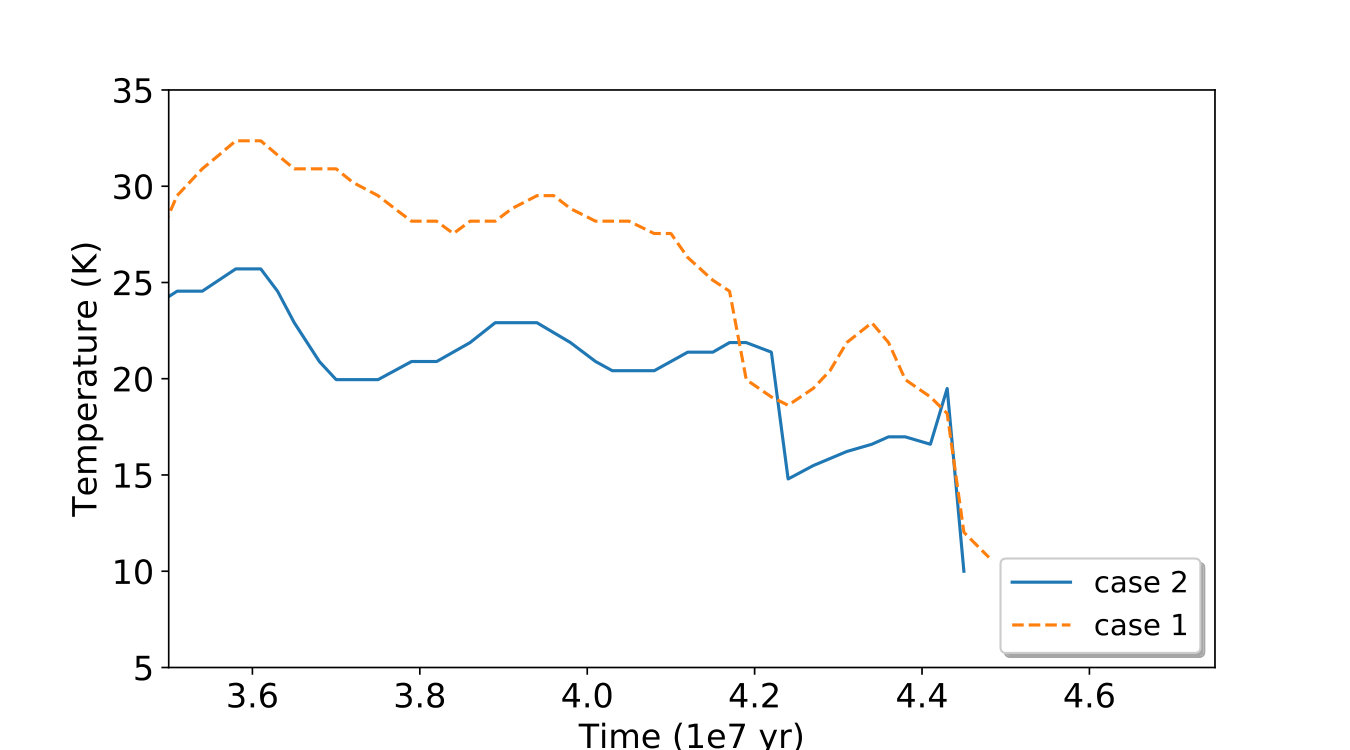 Figure 19
| Source | Column density (cm-3) | Abundance (with respect to H2) | Reference |
|---|---|---|---|
| TMC1 - NH3 | Pagani et al. (2003) | ||
| L134N - NH3 | Pagani et al. (2003) | ||
| L429 | Wirström et al. (2016) | ||
| Oph D | Wirström et al. (2016) | ||
| L1544 | Wirström et al. (2016) | ||
| L694-2 | Wirström et al. (2016) | ||
| Sgr A | Sandqvist et al. (2015) | ||
| IRAS4 (protostar) | Yıldız et al. (2013) | ||
| IRAS4 (cloud) | * | * | Yıldız et al. (2013) |
| Orion bar | - | Melnick et al. (2012) | |
| IRAS16293-2422 | Pagani et al. (2003) | ||
| IRAS16293-2422 | - | Taquet et al. (2018) | |
| Oph A | Pagani et al. (2003) | ||
| Oph A | Larsson et al. (2007) | ||
| Oph A | Liseau et al. (2012) | ||
| Orion | Goldsmith et al. (2011) | ||
| Orion A | Pagani et al. (2003) | ||
| NGC2071 | Pagani et al. (2003) | ||
| NGC6334I | Pagani et al. (2003) | ||
| (G0.26 - 0.01) | Pagani et al. (2003) | ||
| M17SW | Pagani et al. (2003) | ||
| S68FIRS1 | Pagani et al. (2003) | ||
| G34.3 + 0.2 | Pagani et al. (2003) | ||
| * claimed to be a tentative detection by the authors. |
Peer Reviews
No public reviews on file for this paper yet. If you reviewed it on a platform where reviews are public (OpenReview, ICLR, NeurIPS, ICML), you can paste yours below so the community can read it here.
Videos
No videos yet. Explain this paper in a talk, walkthrough, or lecture? Add one.
Influence of galactic arm scale dynamics on the molecular composition of the cold and dense ISM II. Molecular oxygen abundance
V. Wakelam1, M. Ruaud2, P. Gratier1, I. Bonnell3
1Laboratoire d’astrophysique de Bordeaux, Univ. Bordeaux, CNRS, B18N, allée Geoffroy Saint-Hilaire, 33615 Pessac, France
2 NASA Ames Research Center, Moffett Field, CA, USA
3 Scottish Universities Physics Alliance (SUPA), School of Physics and Astronomy, University of St. Andrews, North Haugh, St Andrews, Fife KY16 9SS, UK E-mail: [email protected]
(Accepted XXX. Received YYY; in original form ZZZ)
Abstract
Molecular oxygen has been the subject of many observational searches as chemical models predicted it to be a reservoir of oxygen. Although it has been detected in two regions of the interstellar medium, its rarity is a challenge for astrochemical models. In this paper, we have combined the physical conditions computed with smoothed particle hydrodynamics (SPH) simulations with our full gas-grain chemical model Nautilus, to study the predicted O2 abundance in interstellar material forming cold cores. We thus follow the chemical evolution of gas and ices in parcels of material from the diffuse interstellar conditions to the cold dense cores. Most of our predicted O2 abundances are below (with respect to the total proton density) and the predicted column densities in simulated cold cores is at maximum a few cm*-2*, in agreement with the non detection limits. This low O2 abundance can be explained by the fact that, in a large fraction of the interstellar material, the atomic oxygen is depleted onto the grain surface (and hydrogenated to form H2O) before O2 can be formed in the gas-phase and protected from UV photo-dissociations. We could achieve this result only because we took into account the full history of the evolution of the physical conditions from the diffuse medium to the cold cores.
keywords:
Astrochemistry, ISM: molecules, ISM: abundances, ISM: evolution, ISM: clouds
††pubyear: 2019
1 Introduction
Oxygen and carbon are the two most abundant elements (after hydrogen and helium) in the universe and they are basic material for the organic matter. Astrochemical models predict that, in the cold molecular gas of the interstellar medium, carbon monoxyde (CO) constitutes the reservoir of volatile carbon while water (frozen on interstellar dust) is the reservoir of oxygen. These two species are indeed observed to contain large fractions of elemental oxygen and carbon. The third reservoir of oxygen is predicted to be molecular oxygen (O2). Pure gas-phase models predict an abundance of a few (using the kida.uva.2014 public network, Wakelam et al., 2015) under typical cold core conditions. Such models even predict O2 to be more abundant than H2O as they do not include any formation of water on interstellar dust (a very efficient process). Chemical models including grain surface processes (and gas-grain interactions) predict gas-phase abundances of O2 much smaller as part of the oxygen can be depleted onto the grain surfaces and be hydrogenated (forming H2O). The peak abundance of gaseous O2 however usually reaches for a cloud age between and yr (see for instance Hincelin et al., 2011).
Based on these model predictions, molecular oxygen has been intensively searched in the interstellar medium, first with ground based observations of the isotopic form 16O18O (see Pagani et al., 2003, and references therein) and then with the SWAS satellite (Goldsmith et al., 2000). All these studies reported a non detection of the molecule and upper limits on the abundance smaller and smaller with time. Later, with the Odin and then Herschel space telescopes, detections have been reported but they have shown the very small abundance of O2 and a scarcity of detections. Molecular oxygen has been detected only in two sources: Orion (Goldsmith et al., 2011) and Oph A (Larsson et al., 2007; Liseau et al., 2012) with an abundance between two and three orders of magnitude smaller than what is predicted by astrochemical models. Since these detections, O2 has been searched for in many objects: CO-depleted cold cores (Wirström et al., 2016), Sgr A foreground absorption (Sandqvist et al., 2015), low mass protostars (Yıldız et al., 2013; Taquet et al., 2018), the Orion bar (Melnick et al., 2012) without success. More over, additional observations of the Orion region seem to indicate that the O2 detection there (Goldsmith et al., 2011) is associated to a shock region rather than a cold core (Chen et al., 2014). Interestingly, the other region where O2 has been detected, Oph A, is also the only region where both O2H and HOOH have been detected (Bergman et al., 2011; Parise et al., 2012). A list of observed column densities and abundances as well as upper limits are given in Table 1. This list is not meant to be exhaustive but gives an overview of the most recent observations in a variety of sources.
Many theoretical studies have tried to explain this result exploring a decrease of the elemental abundance of oxygen (Hincelin et al., 2011), the presence of bistabilities in the model results (Viti et al., 2001), and the impact of the value of the rate coefficient for the main reaction forming O2 (O + OH O2 + H, Marechal et al., 1997; Quan et al., 2008).
All chemical models presented in the literature and focusing on O2 formation assume very simple physical models (mostly static). In this paper, we will show the impact of the cloud formation history on the predicted O2 abundances. The model presented here have already been used in Ruaud et al. (2018) to show that considering the full history of the physical conditions during the formation of cold cores from the diffuse medium has a strong impact on the cloud composition changing the gas-phase C/O global elemental ratio and the electron fraction.
2 Models description
To simulate the chemistry during the formation of cold cores, we used the same methodology as Ruaud et al. (2018) with an up-to-date version of the chemical model Nautilus (Ruaud et al., 2016). The chemical evolution was computed for parcels of material evolving in a Galatic arm, which physical conditions (gas temperature, density, and visual extinction) were computed with the 3D SPH model from Bonnell et al. (2013). The parcels of material were selected as follows. At the end of the simulations, maximum density peaks were identified (with a density larger than cm*-3*). Then, SPH particles in a sphere of 0.5 pc in radius around this peak were identified and the past and future history of the physical conditions of these identified particles were extracted. The number of particle per cloud is not constant but ranges between 150 and 350. In total, we have about 2918 trajectories for nine clouds. These time dependent physical conditions were then used as inputs to the Nautilus gas-grain model. There is no feedback of the chemistry computed with Nautilus on the physical model. The dust temperature is computed following Hollenbach et al. (1991). More details on the method can be found in Ruaud et al. (2018). As the physical model does not include self-gravity, the clouds do not undergo collapse but break after the peak density. For the present study, we have used the data up to the density peak and ignored the dispersion of the cloud after it.
The Nautilus gas-grain model is used in its 3-phase version, meaning that the chemistry is computed in the gas-phase and on the surface of the interstellar grains but making a distinction between the most external 2 monolayers of molecules (called surface) and the rest on the ice below (called bulk). Species from the gas-phase are physisorbed on the surfaces upon collision with grains. In addition to the surface and bulk reactions, the model computes desorption: thermal desorption, cosmic-ray induced desorption (using the formalism of Hasegawa & Herbst, 1993), chemical desorption (using the formalism of Garrod et al., 2007), and photodesorption with a yield of for all desorptions (see Ruaud et al., 2016, for discussions). All the details of the equations and values of surface parameters can be found in a dedicated paper on Nauitlus: Ruaud et al. (2016).
With respect to Ruaud et al. (2018), the chemical networks have been updated based on the reactions proposed in Loison et al. (2017) and the binding energies proposed in Wakelam et al. (2017). The initial abundances are the same as in Ruaud et al. (2018) (see their Table 1).
3 Predicted O2 gas-phase abundance
In Fig. 1, we plot the O2 gas-phase abundance (with respect to H) predicted by our model as a function of the density and the temperature for all selected trajectories, whatever the time of the simulation (up to the density peak). The simulations include smaller densities and higher temperatures but we have zoomed to the highest densities where molecules form. For the same physical conditions, the O2 gas-phase abundances spread over a large range of values covering several orders of magnitude. The maximum abundance is below with the majority of the points laying below .
To understand this result, we have selected two trajectories producing either a "large" peak abundance (of a few - case 1) or a small peak abundance (of a few - case 2) at the maximum peak density (of cm*-3* in both cases). Fig. 2 shows the time dependent abundances of gas-phase O2, O and CO, and H2O ice for these two trajectories. In all our cases, molecular oxygen is formed in the gas-phase by the neutral-neutral reaction O + OH O2 + H while OH is formed by the dissociative recombination of protonated water. Over the majority of the simulation, the low density allows for the photo-dissociation of O2 by UV photons. Fig. 2 also shows the gas temperature and density as a function of time for these two trajectories. In case 2, the material undergo a first phase of large density of about cm*-3* approximately yr before the density peak. During this transition, a large fraction of the oxygen is depleted onto the grains and hydrogenated to form H2O. The abundance of H2O ice in case 2 is about at yr of the simulation while it reaches this value in case 1 only at the peak density (at yr). As a consequence, the fraction of oxygen available for the gas-phase chemistry at the density peak is much smaller than in case 1. In case 1, the O2 ice abundance is about while it is negligible in case 2 at the density peak. The overall small abundance of gas-phase O2 in Fig. 1 can then be explained by the fact that the depletion of the oxygen (followed by hydrogenation) is faster in many trajectories (because of the time scale of evolution of the physical conditions) than the formation of O2 in the gas-phase. In the case with a larger O2 gas-phase abundance, the density conditions do not allow for an efficient oxygen depletion before the density peak.
Considering the fact that, one of the only two regions where O2 has been detected is also the only region where HOOH and O2H have been detected, we have looked at the model prediction for these two species. Fig. 3 shows the 2D histograms of these species abundances (O2 versus O2H, O2 versus HOOH, and HOOH versus O2H). In these simulations, they do not seem to be correlated. Both O2H and HOOH are predicted by the model to form on the grains by hydrogenation of O2. Molecular oxygen first has to be formed in the gas-phase and accrete on the grains. Then, successive hydrogenation of O2 produces partial evaporation of first O2H and then HOOH through chemical desorption. This time dependent sequence can explain why there are some points associated with larger O2H and lower O2 (O2 has to deplete for O2H to form) and some points with large HOOH and lower O2H (O2H is transformed into HOOH). From a general point of view, O2 gas-phase abundance larger than are associated with negligible abundances of O2H and HOOH. In Oph, the observed abundances of O2 is estimated to be (with respect to H2, see Table 1) and the HOOH and O2H abundances to be (Bergman et al., 2011; Parise et al., 2012). The observed HOOH and O2H cannot be reproduced by our models contrary to Du et al. (2012), who predicted a similar gas-phase abundance for both O2H and HOOH. Du et al. (2012) however have used dense conditions (density of cm*-3*) with warm gas-phase temperature (21 K) based on observations. These conditions are never reached in our simulations (dense is always cold in our model, see Fig. 4). We tested a simple run with our chemical model, using the observed physical conditions (fixed with time) and were able to produce similar abundances for O2H and HOOH, and similar to the observations and the predictions by Du et al. (2012). For these conditions at yr, we have an abundance of for O2H, for HOOH, and for O2.
4 Predicted column densities
To make a more reliable comparison between our predictions and the observations, we have created column density maps for our simulated clouds. For this, we have used the SPLASH visualisation tool (http://users.monash.edu.au/$\sim$dprice/splash/) (Price, 2007). Fig. 5 shows the predicted column density maps of gas-phase O2 in nine clouds. Color coding shows the log10 of the column density of O2 while the white contours shows the contour levels of the log10 of the total proton density every 0.5 dex and starting at 17.5. Extension of the emission, as well as the distribution of O2 within each cloud varies with the cloud. In all of them, the maximum column density is of a few cm*-3*, in agreement with all the non detection limits listed in Table 1. This value is smaller than the O2 column density observed in Oph A, but as we have shown earlier, this region has physical conditions not covered by our sample. As compared to the total proton density, it is interesting to notice that the O2 does not peak at the same place as H in most cases.
5 Conclusion
We report in this paper the predicted abundance of gas-phase O2 computed by a full gas-grain model coupled with time dependent physical conditions from a SPH model for trajectories of material forming nine cold cores. Considering the 2913 trajectories covering a large parameter space, we found that the predicted O2 abundance spreads over several orders of magnitudes for densities between and a few cm*-3* (resulting in temperatures between 10 and 75 K). Most of our predicted abundances are below . For the nine studied cold cores, the maximum O2 predicted column density is of a few cm*-2*. As compared to observations, these model results are in agreement with all upper limits of O2 in cold cores. It is smaller than the column density observed in Oph A. In the same source, both O2H and HOOH have been detected with a similar abundance. None of our models produce large abundances for the three molecules. We argue that the dense and warm conditions observed in Oph A are the reason for the large abundances of O2H and HOOH, conditions which are never reached by our simulations.
As conclusion of this paper, we have shown that the rare detection of O2 in the interstellar medium can be explained by the combined history of the interstellar material physical conditions and the time scale of the dynamical evolution. Indeed, in our simulations, the depletion of oxygen onto the grains (followed by hydrogenation) occurs before the gas-phase formation of O2. When the peak density is reached, only a small fraction of oxygen is still available.
Acknowledgements
VW’s research is funded by an ERC Starting Grant (3DICE, grant agreement 336474). The authors acknowledge the CNRS program "Physique et Chimie du Milieu Interstellaire" (PCMI) co-funded by the Centre National d’Etudes Spatiales (CNES). IAB acknowledges funding from the European Research Council for the FP7 ERC advanced grant project ECOGAL. This work used the DiRAC Complexity system, operated by the University of Leicester IT Services, which forms part of the STFC DiRAC HPC Facility (www.dirac.ac.uk). This equipment is funded by BIS National E-Infrastructure capital grant ST/K000373/1 and STFC DiRAC Operations grant ST/K0003259/1. DiRAC is part of the National E-Infrastructure. MR’s research was supported by an appointment to the NASA Postdoctoral Program at the NASA Ames Research Center, administered by Universities Space Research Association under contract with NASA.
The reference list from the paper itself. Each links out to its DOI / PubMed record.
- 1Bergman et al. (2011) Bergman P., Parise B., Liseau R., Larsson B., Olofsson H., Menten K. M., Güsten R., 2011, A&A , 531, L 8 · doi ↗
- 2Bonnell et al. (2013) Bonnell I. A., Dobbs C. L., Smith R. J., 2013, MNRAS , 430, 1790 · doi ↗
- 3Chen et al. (2014) Chen J.-H., et al., 2014, Ap J , 793, 111 · doi ↗
- 4Du et al. (2012) Du F., Parise B., Bergman P., 2012, A&A , 538, A 91 · doi ↗
- 5Garrod et al. (2007) Garrod R. T., Wakelam V., Herbst E., 2007, A&A , 467, 1103 · doi ↗
- 6Goldsmith et al. (2000) Goldsmith P. F., et al., 2000, Ap J , 539, L 123 · doi ↗
- 7Goldsmith et al. (2011) Goldsmith P. F., et al., 2011, Ap J , 737, 96 · doi ↗
- 8Hasegawa & Herbst (1993) Hasegawa T. I., Herbst E., 1993, MNRAS , 261, 83 · doi ↗