Retrieval of phase relation and emission profile of quantum cascade laser frequency combs
Francesco Cappelli (1), Luigi Consolino (1), Giulio Campo (1), Iacopo, Galli (1,2), Davide Mazzotti (1,2), Annamaria Campa (1), Mario Siciliani de, Cumis (3), Pablo Cancio Pastor (1,2), Roberto Eramo (1), Markus R\"osch (4),, Mattias Beck (4), Giacomo Scalari (4)

TL;DR
This paper introduces a dual-comb detection method to analyze the phase relation and emission profile of quantum cascade laser frequency combs, demonstrating their coherence and stability in mid-infrared and terahertz regimes.
Contribution
It presents a novel technique combining dual-comb detection and Fourier analysis for comprehensive characterization of quantum cascade laser frequency combs.
Findings
High coherence and long-term stability of quantum cascade laser combs confirmed.
Simultaneous monitoring of phase patterns over multiple timescales achieved.
Reconstruction of electric field, intensity, and frequency profiles demonstrated.
Abstract
The major development recently undergone by quantum cascade lasers has effectively extended frequency comb emission to longer-wavelength spectral regions, i.e. the mid and far infrared. Unlike classical pulsed frequency combs, their mode-locking mechanism relies on four-wave mixing nonlinear processes, with a temporal intensity profile different from conventional short-pulses trains. Measuring the absolute phase pattern of the modes in these combs enables a thorough characterization of the onset of mode-locking in absence of short-pulses emission, as well as of the coherence properties. Here, by combining dual-comb multi-heterodyne detection with Fourier-transform analysis, we show how to simultaneously acquire and monitor over a wide range of timescales the phase pattern of a generic frequency comb. The technique is applied to characterize a mid-infrared and a terahertz quantum cascade…
Click any figure to enlarge with its caption.
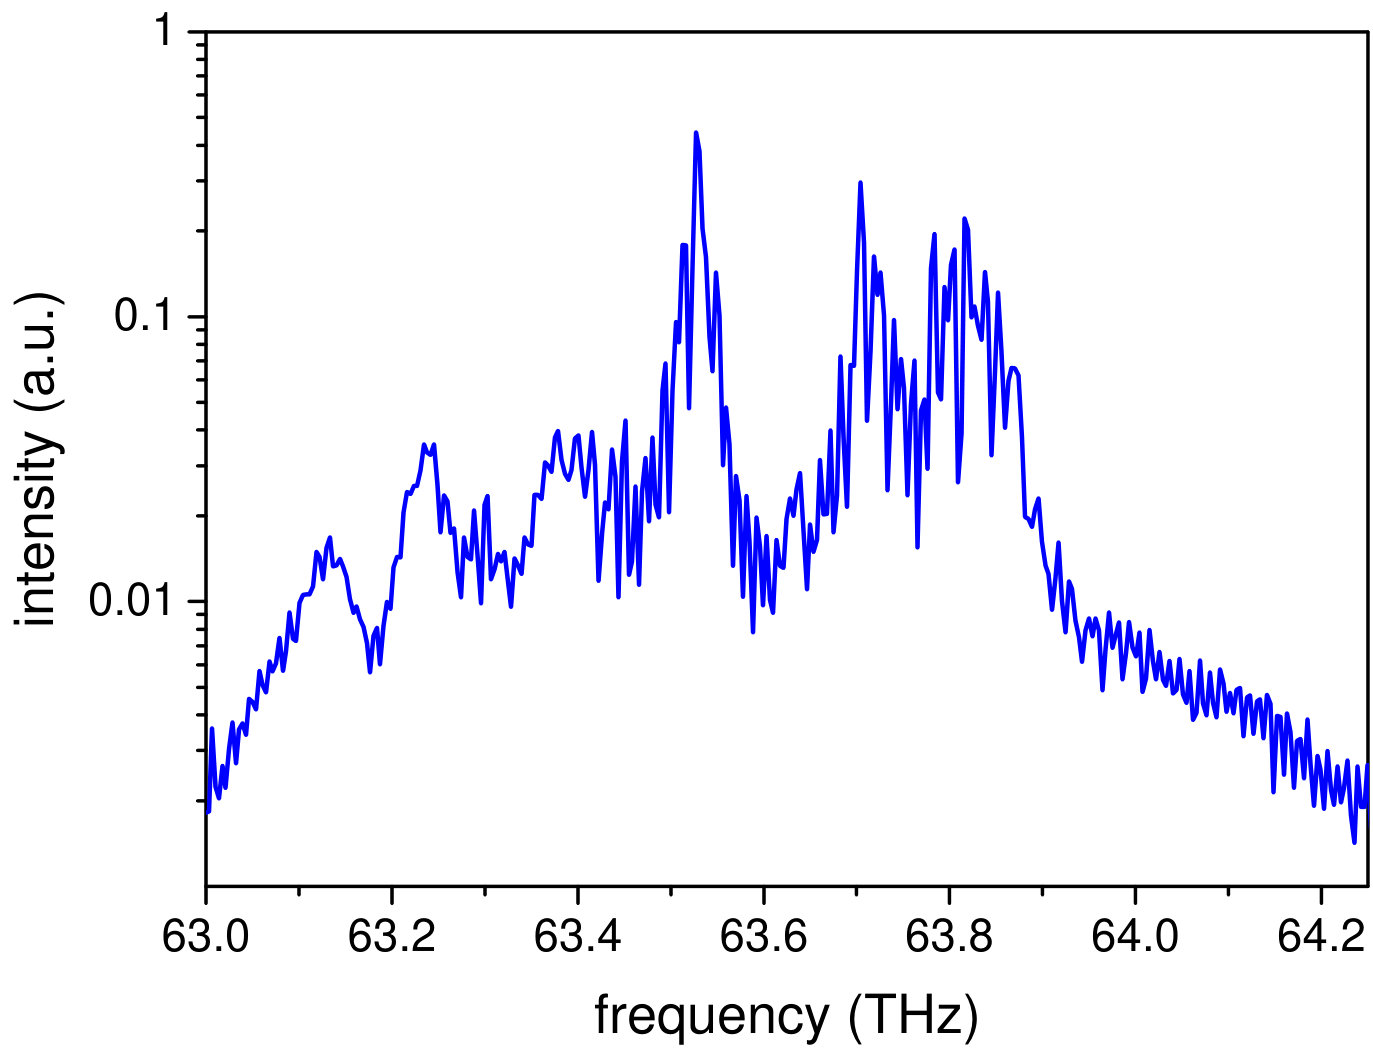 Figure 1
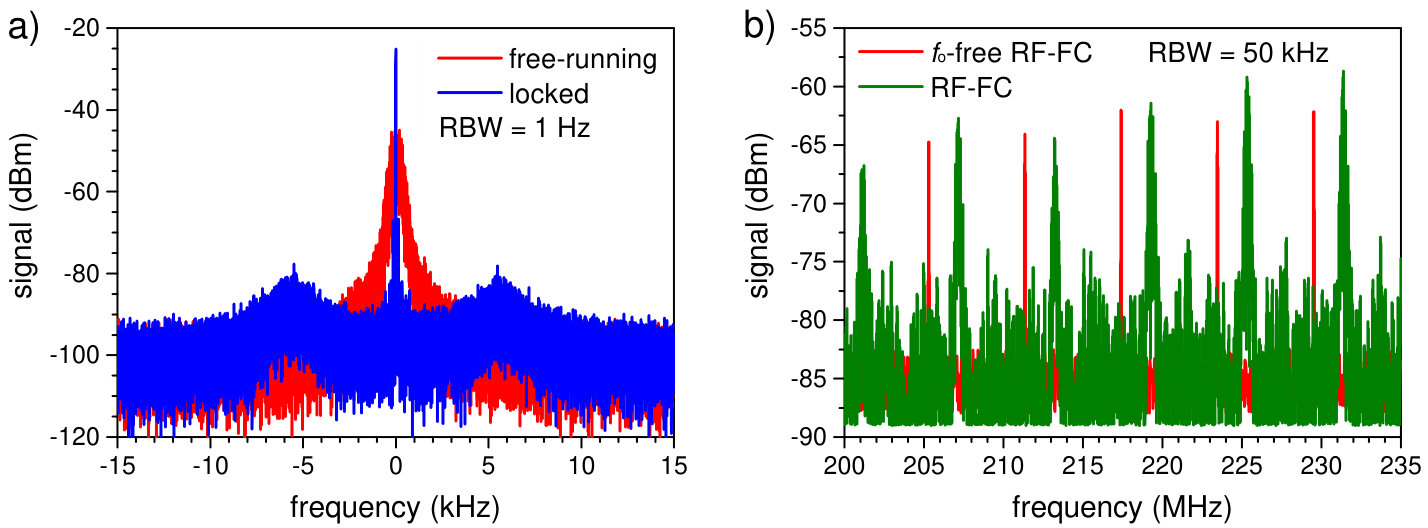 Figure 2
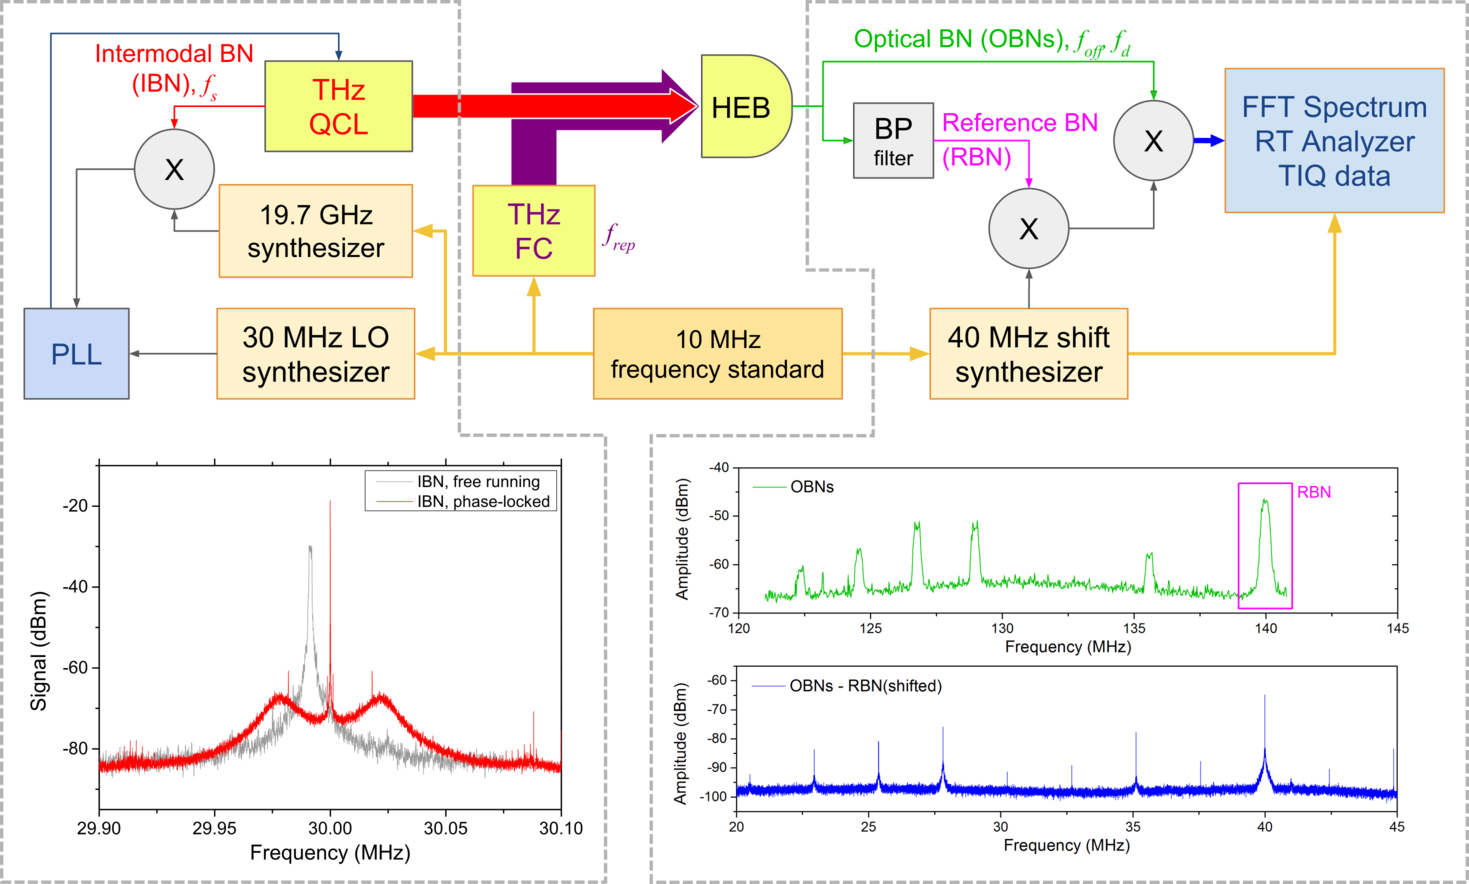 Figure 3
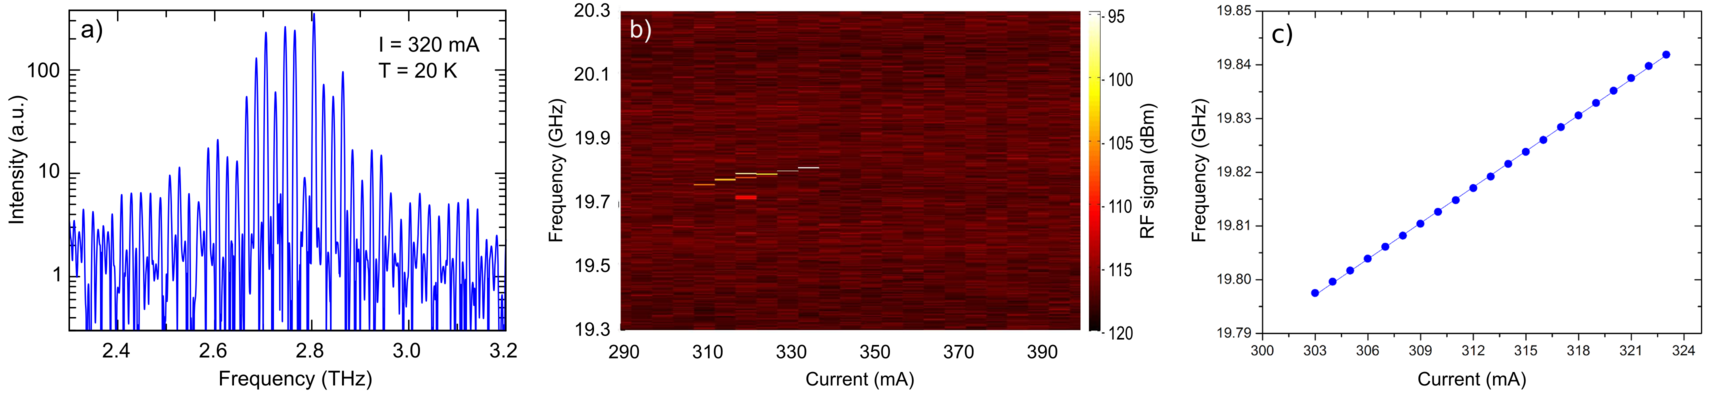 Figure 4
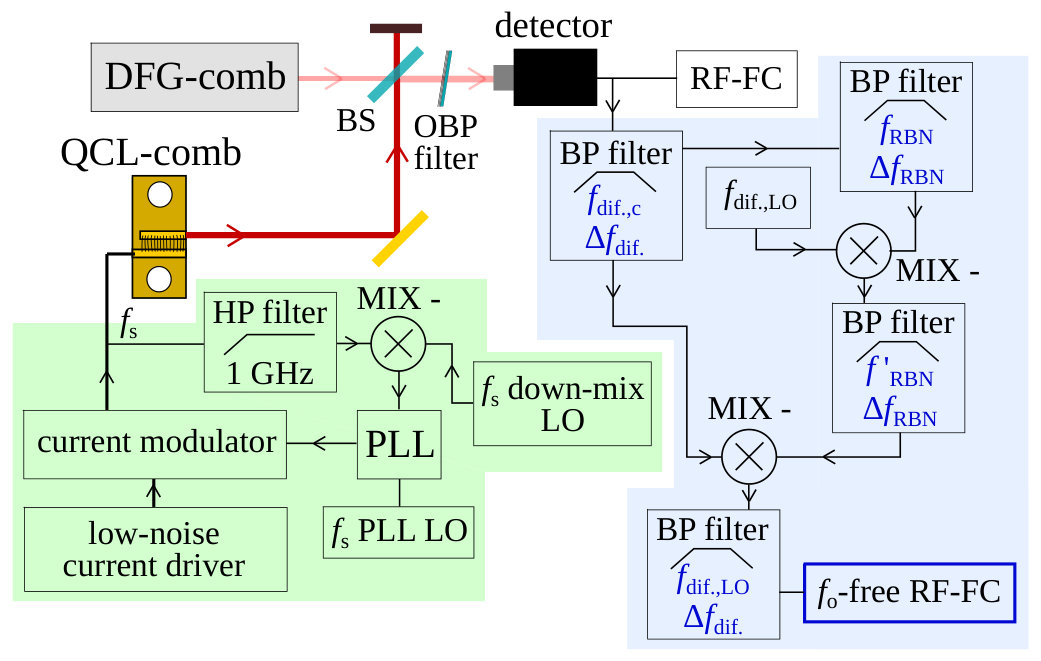 Figure 5
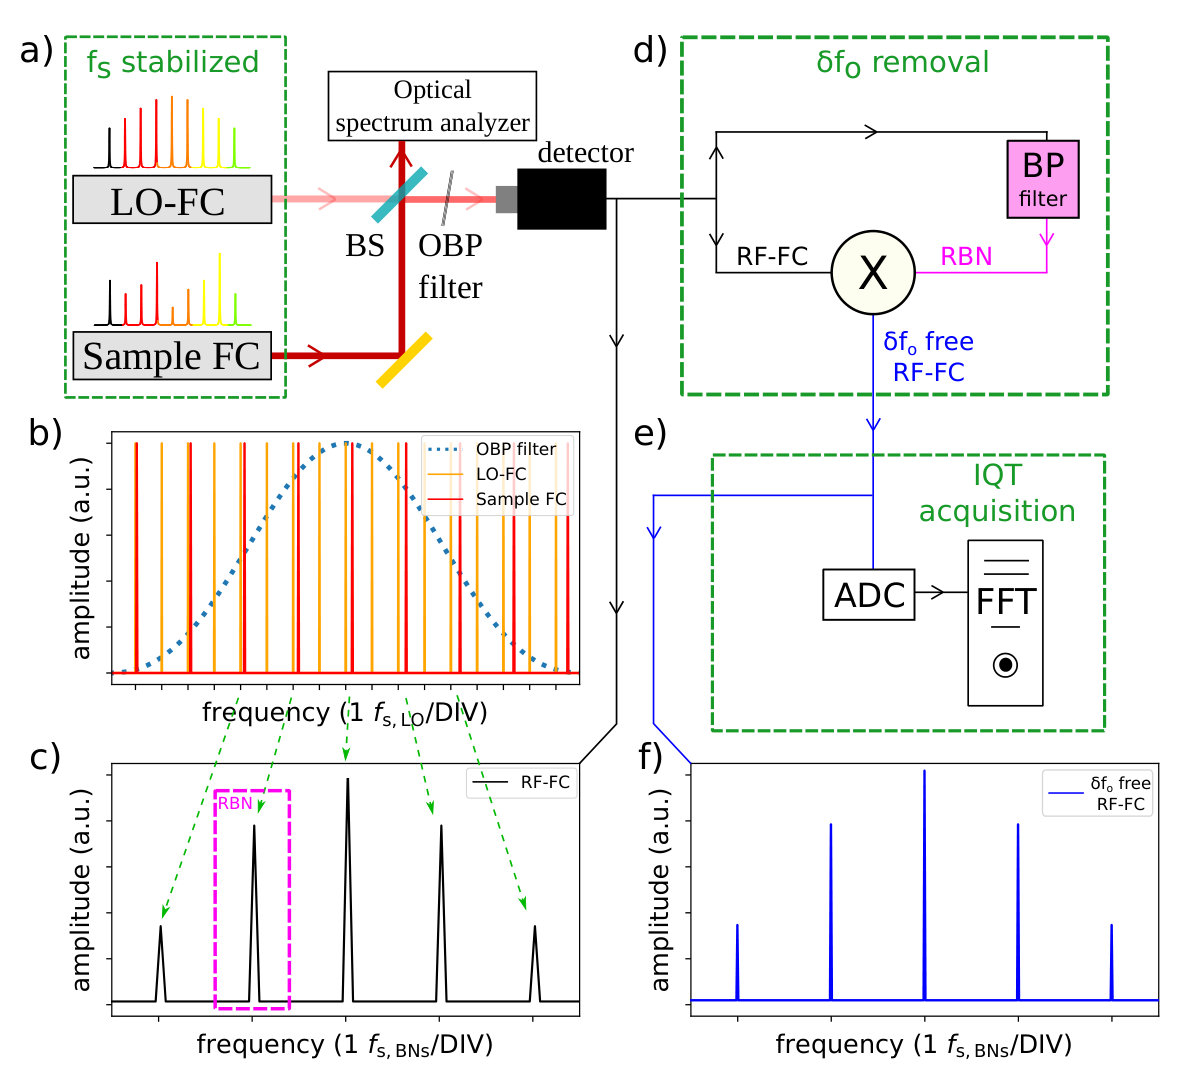 Figure 1
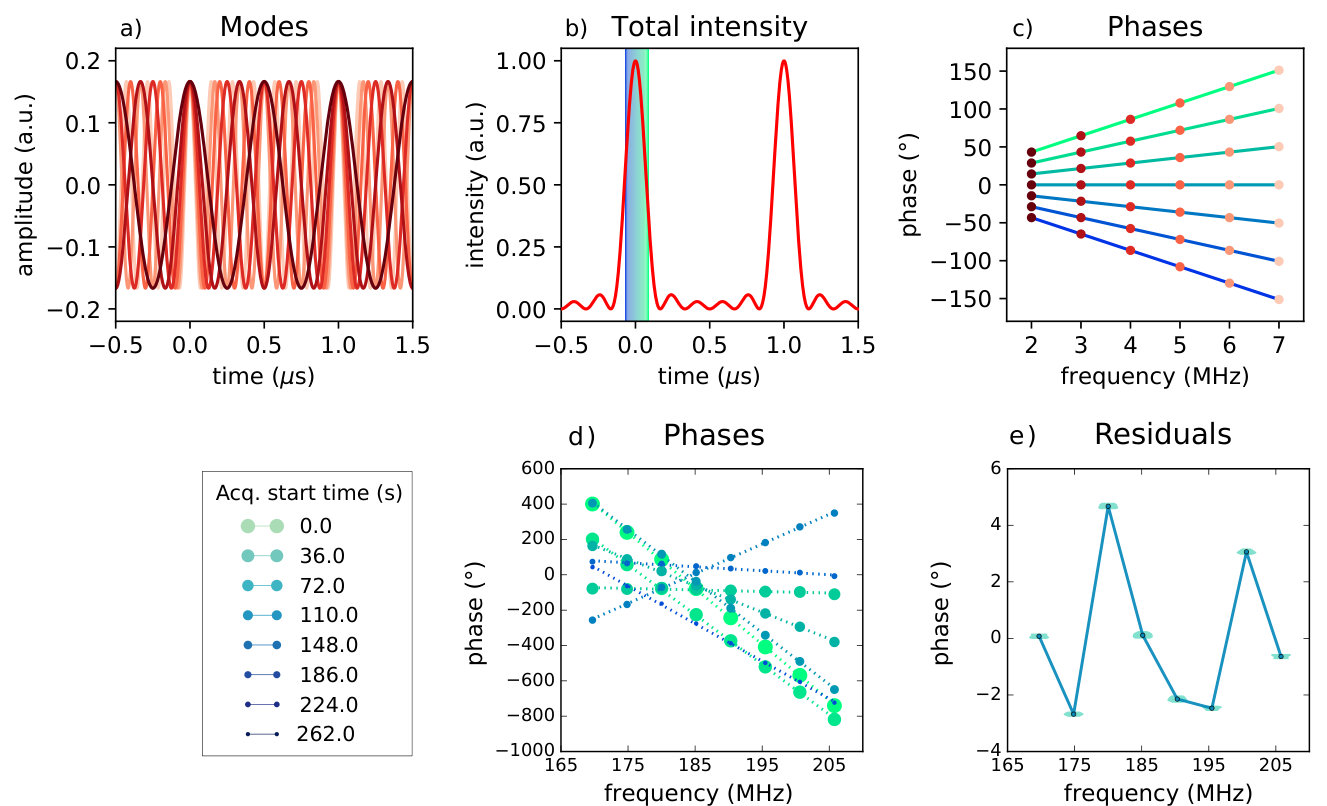 Figure 2
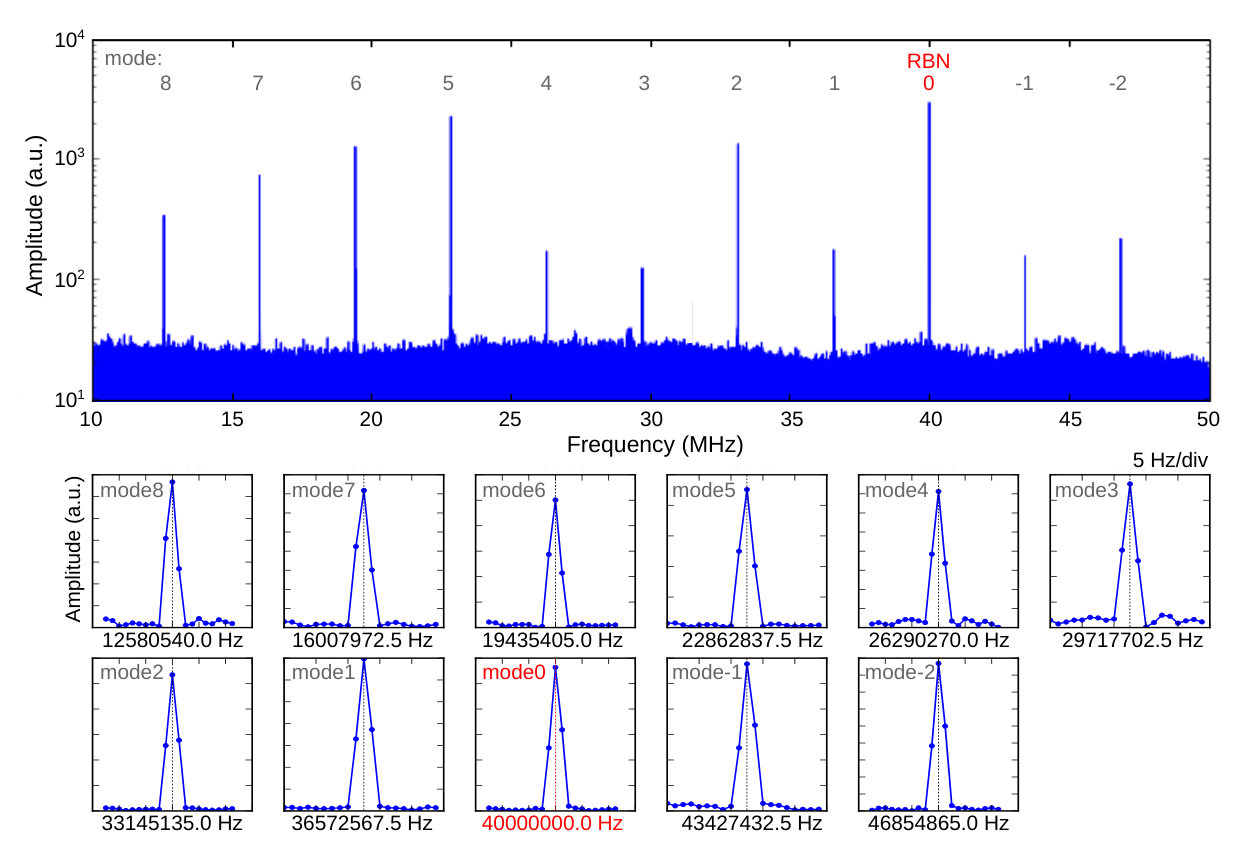 Figure 3
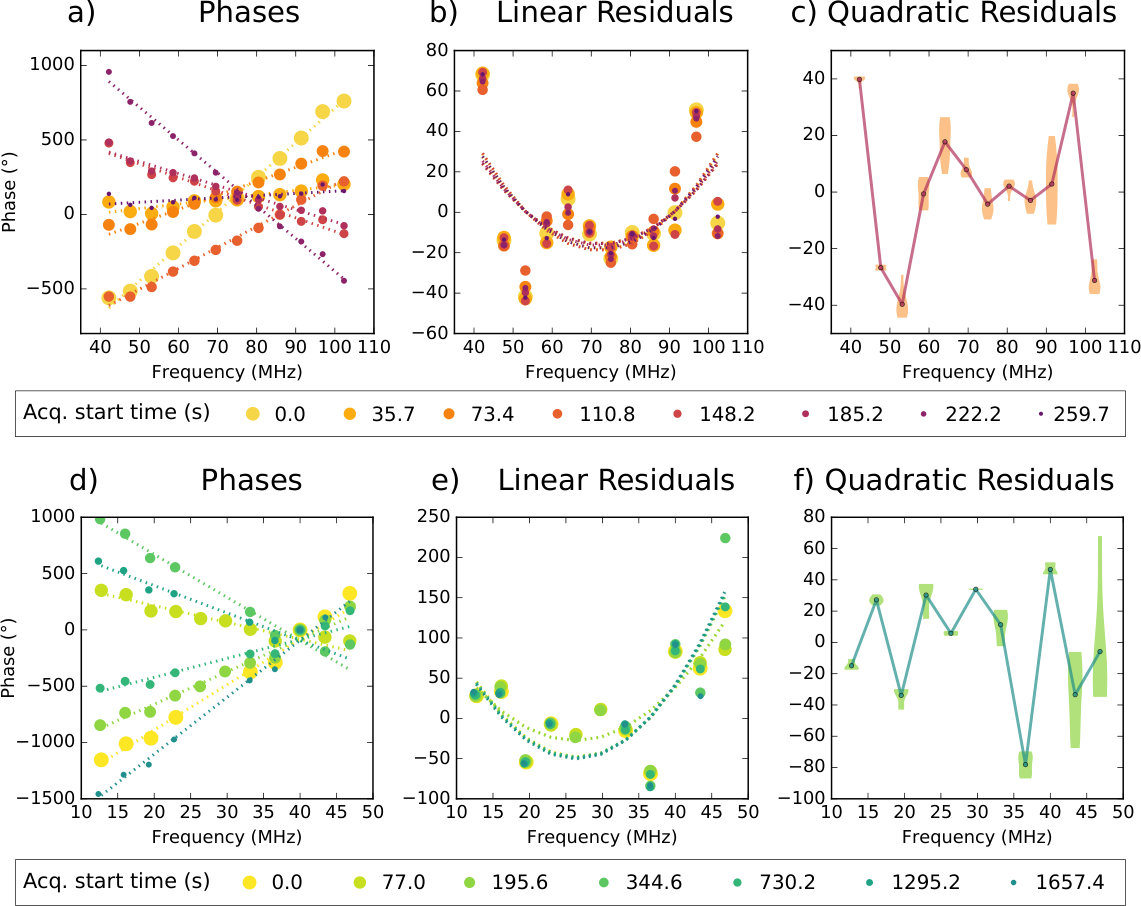 Figure 4
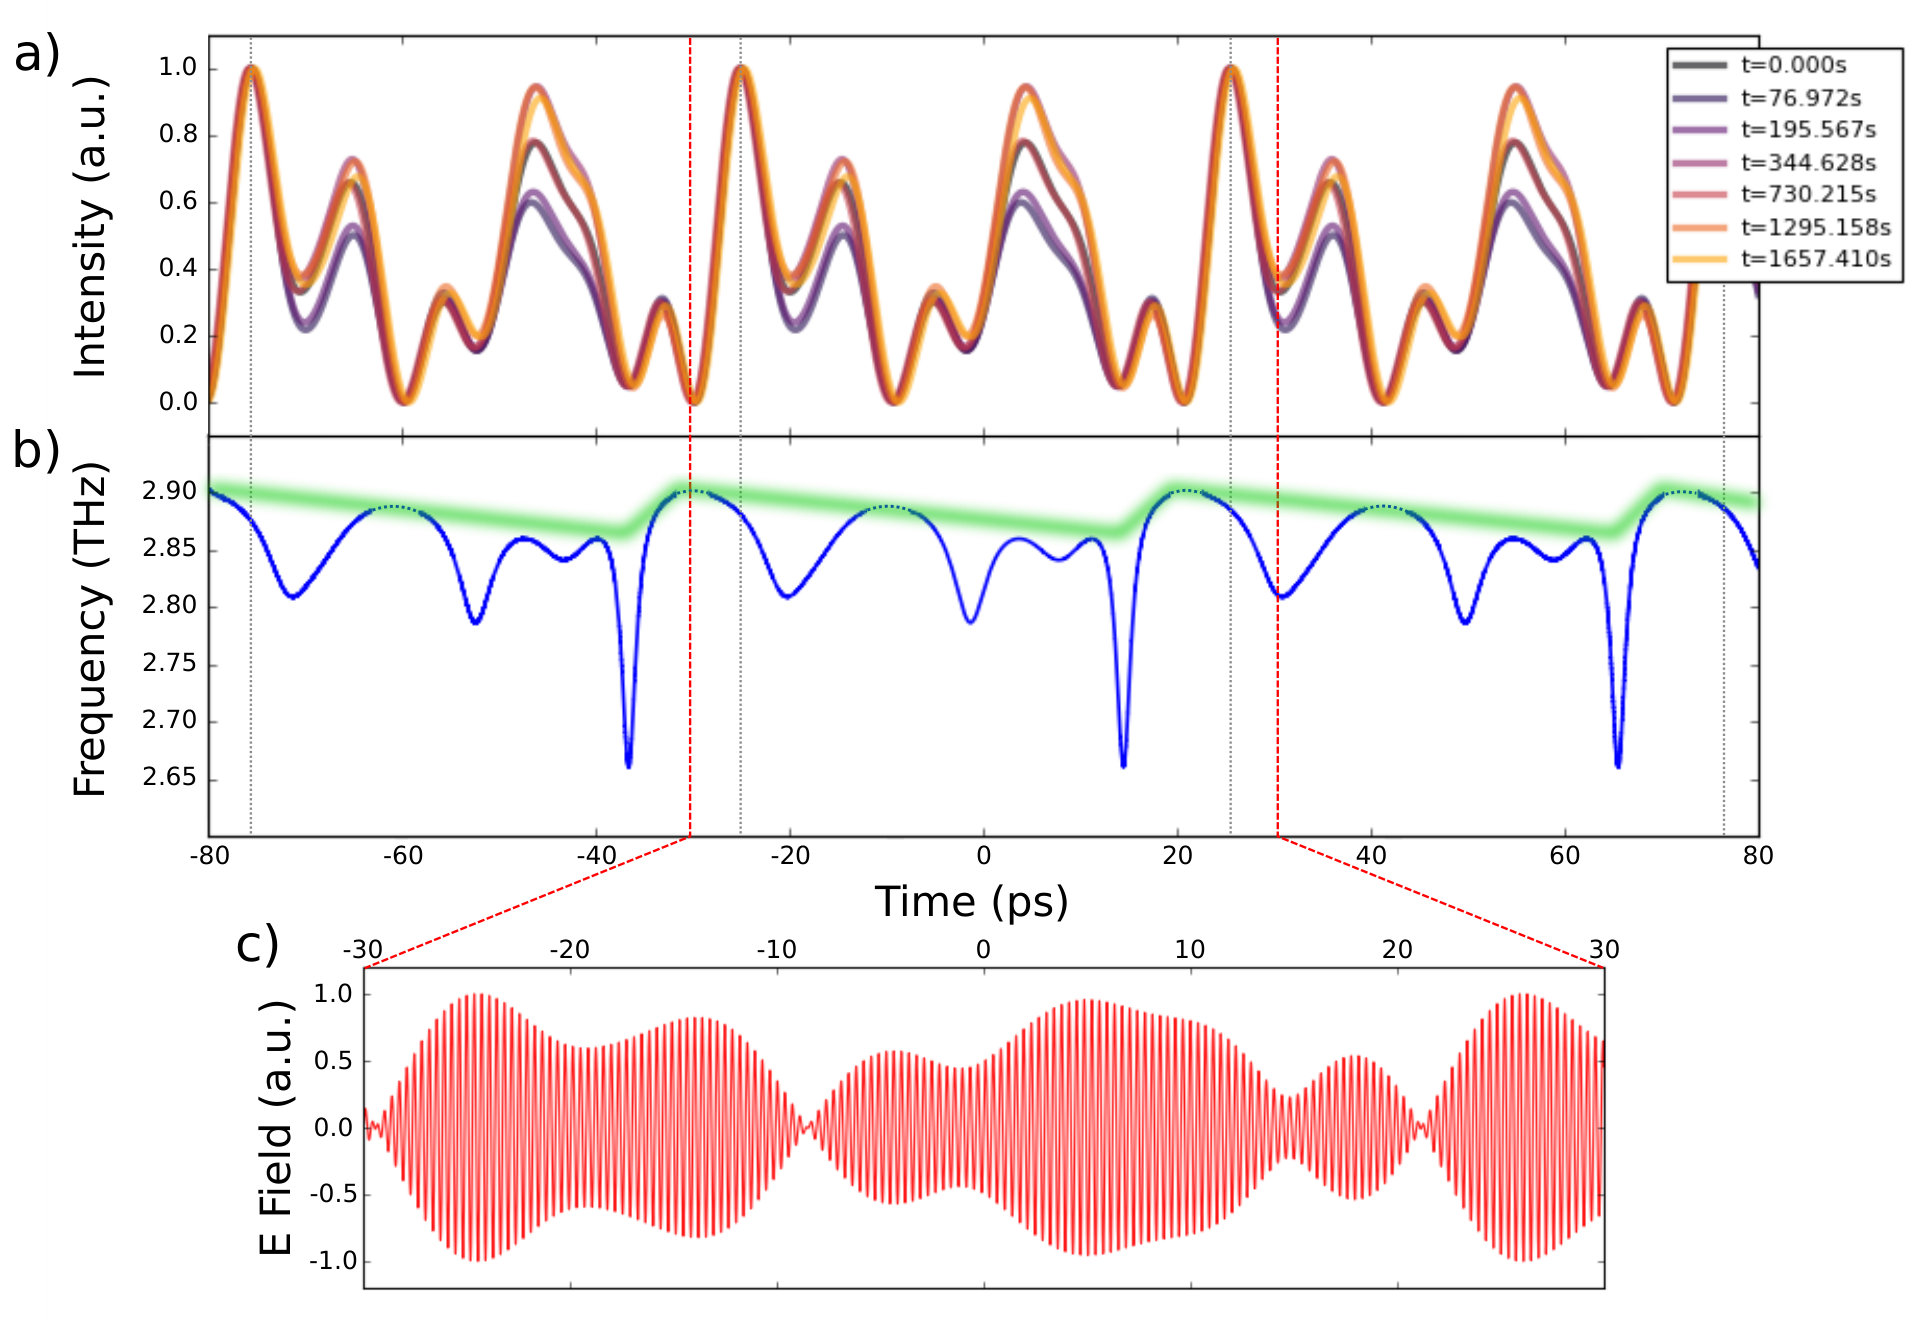 Figure 5
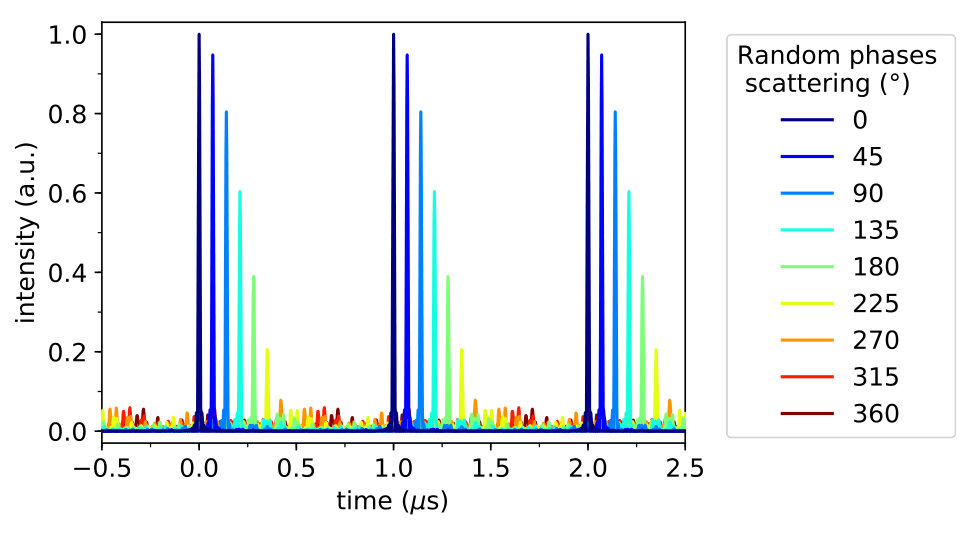 Figure 11
| mid-IR QCL-comb | THz QCL-comb | |
|---|---|---|
| single phases | 8.0 | 10.0 |
| phases scattering △ | 120 | 300 |
| phases concavity | ||
| GDD ∗ |
Peer Reviews
No public reviews on file for this paper yet. If you reviewed it on a platform where reviews are public (OpenReview, ICLR, NeurIPS, ICML), you can paste yours below so the community can read it here.
Videos
No videos yet. Explain this paper in a talk, walkthrough, or lecture? Add one.
Retrieval of phase relation and emission profile of quantum cascade laser frequency combs
Francesco Cappelli
CNR-INO – Istituto Nazionale di Ottica, Largo Enrico Fermi 6, 50125 Firenze FI, Italy
& LENS – European Laboratory for Non-Linear Spectroscopy, Via Nello Carrara 1, 50019 Sesto Fiorentino FI, Italy
These two authors contributed equally to this work.
Corresponding authors: [email protected], [email protected]
Luigi Consolino
CNR-INO – Istituto Nazionale di Ottica, Largo Enrico Fermi 6, 50125 Firenze FI, Italy
& LENS – European Laboratory for Non-Linear Spectroscopy, Via Nello Carrara 1, 50019 Sesto Fiorentino FI, Italy
These two authors contributed equally to this work.
Corresponding authors: [email protected], [email protected]
Giulio Campo
CNR-INO – Istituto Nazionale di Ottica, Largo Enrico Fermi 6, 50125 Firenze FI, Italy
& LENS – European Laboratory for Non-Linear Spectroscopy, Via Nello Carrara 1, 50019 Sesto Fiorentino FI, Italy
Iacopo Galli
CNR-INO – Istituto Nazionale di Ottica, Largo Enrico Fermi 6, 50125 Firenze FI, Italy
& LENS – European Laboratory for Non-Linear Spectroscopy, Via Nello Carrara 1, 50019 Sesto Fiorentino FI, Italy
ppqSense Srl, Via Gattinella 20, 50013 Campi Bisenzio FI, Italy
Davide Mazzotti
CNR-INO – Istituto Nazionale di Ottica, Largo Enrico Fermi 6, 50125 Firenze FI, Italy
& LENS – European Laboratory for Non-Linear Spectroscopy, Via Nello Carrara 1, 50019 Sesto Fiorentino FI, Italy
ppqSense Srl, Via Gattinella 20, 50013 Campi Bisenzio FI, Italy
Annamaria Campa
CNR-INO – Istituto Nazionale di Ottica, Largo Enrico Fermi 6, 50125 Firenze FI, Italy
& LENS – European Laboratory for Non-Linear Spectroscopy, Via Nello Carrara 1, 50019 Sesto Fiorentino FI, Italy
Mario Siciliani de Cumis
ASI – Agenzia Spaziale Italiana, Contrada Terlecchia, 75100 Matera MT, Italy
Pablo Cancio Pastor
CNR-INO – Istituto Nazionale di Ottica, Largo Enrico Fermi 6, 50125 Firenze FI, Italy
& LENS – European Laboratory for Non-Linear Spectroscopy, Via Nello Carrara 1, 50019 Sesto Fiorentino FI, Italy
ppqSense Srl, Via Gattinella 20, 50013 Campi Bisenzio FI, Italy
Roberto Eramo
CNR-INO – Istituto Nazionale di Ottica, Largo Enrico Fermi 6, 50125 Firenze FI, Italy
& LENS – European Laboratory for Non-Linear Spectroscopy, Via Nello Carrara 1, 50019 Sesto Fiorentino FI, Italy
Markus Rösch
Institute for Quantum Electronics, ETH Zurich, 8093 Zürich, Switzerland
Mattias Beck
Institute for Quantum Electronics, ETH Zurich, 8093 Zürich, Switzerland
Giacomo Scalari
Institute for Quantum Electronics, ETH Zurich, 8093 Zürich, Switzerland
Jérôme Faist
Institute for Quantum Electronics, ETH Zurich, 8093 Zürich, Switzerland
Paolo De Natale
CNR-INO – Istituto Nazionale di Ottica, Largo Enrico Fermi 6, 50125 Firenze FI, Italy
& LENS – European Laboratory for Non-Linear Spectroscopy, Via Nello Carrara 1, 50019 Sesto Fiorentino FI, Italy
Saverio Bartalini
CNR-INO – Istituto Nazionale di Ottica, Largo Enrico Fermi 6, 50125 Firenze FI, Italy
& LENS – European Laboratory for Non-Linear Spectroscopy, Via Nello Carrara 1, 50019 Sesto Fiorentino FI, Italy
ppqSense Srl, Via Gattinella 20, 50013 Campi Bisenzio FI, Italy
Abstract
The major development recently undergone by quantum cascade lasers has effectively extended frequency comb emission to longer-wavelength spectral regions, i.e. the mid and far infrared. Unlike classical pulsed frequency combs, their mode-locking mechanism relies on four-wave mixing nonlinear processes, with a temporal intensity profile different from conventional short-pulses trains. Measuring the absolute phase pattern of the modes in these combs enables a thorough characterization of the onset of mode-locking in absence of short-pulses emission, as well as of the coherence properties.
Here, by combining dual-comb multi-heterodyne detection with Fourier-transform analysis, we show how to simultaneously acquire and monitor over a wide range of timescales the phase pattern of a generic frequency comb. The technique is applied to characterize a mid-infrared and a terahertz quantum cascade laser frequency comb, conclusively proving the high degree of coherence and the remarkable long-term stability of these sources. Moreover, the technique allows also the reconstruction of electric field, intensity profile and instantaneous frequency of the emission.
1 Introduction
The optical frequency comb (FC) is a peculiar multi-frequency coherent photonic state made of a series of evenly-spaced modes in the frequency domain, typically generated by frequency-stabilized and controlled femtoseconds mode-locked lasers [1, 2, 3, 4]. In the visible and near infrared (IR) such technology is nowadays well established [5]. The miniaturization of these sources, together with the expansion of their operation range towards other spectral regions (e.g. mid and far IR), is crucial for broadening their application range.
In this direction, the most interesting results have recently been achieved with quantum cascade lasers (QCLs), current-driven semiconductor lasers based on intersubband transitions in quantum wells, emitting high-power coherent radiation in the mid IR and terahertz (THz) [6, 7, 8, 9, 10, 11]. In these devices the upper lasing state lifetime is very short compared to the cavity round-trip time. Therefore, energy cannot be stored during the round trip, the formation of optical pulses is prevented and classical passive mode locking is not achievable [12, 13, 14].
Recently, active pulsed mode locking has been achieved both in mid-IR [15, 16] and THz [17, 18] QCLs. The limitation of this approach derives from the need of close-to-threshold operation in order to mitigate gain saturation, significantly limiting the emitted power, and from the length of the pulses that cannot reach the inverse of the gain bandwidth.
Quite astonishingly, by using broadband Fabry-Pérot QCLs [19, 20] designed to have a low group velocity dispersion, FC generation was demonstrated in fully free-running operation (QCL-combs) [12, 21, 22]. Starting from the independent longitudinal modes generated by a Fabry-Pérot multimode laser, degenerate and non-degenerate four-wave mixing (FWM) processes induce a proliferation of modes over the entire laser emission spectrum [23]. The original modes are then injection-locked by the modes generated by FWM, ensuring a fixed phase relation among all the longitudinal modes, giving birth to a FC [14].
Various techniques to characterize the emission of mid- and far-infrared QCL-combs have been developed. Actively mode-locked QCL-combs can, in principle, be characterized by means of techniques based on second harmonic generation, such as frequency-resolved optical gating (FROG) [24, 25]. On the other hand, FWM-based QCL-combs have been characterized with techniques waiving nonlinear effects [12, 21, 26, 27, 28, 29, 30]. Among them, only the shifted-wave interference Fourier-transform spectroscopy (SWIFTS) technique [29, 30] can access the phase domain by measuring the phase difference between adjacent FC modes, and therefore retrieving the phase relation of continuous portions of the FC spectrum by a cumulative sum on the phases. This latter is one of the main limitations of the SWIFTS technique, together with the need of a mechanical scan, not allowing a simultaneous analysis of the phases.
In this paper, we propose and experimentally demonstrate the possibility of acquiring in real-time the Fourier phases of the modes of a generic FC. The proposed approach, based on a dual-comb multi-heterodyne detection and a subsequent Fourier transform analysis, allows both a simultaneous retrieval of the modes phases of FCs with spectra of any shape, and monitoring the evolution of the phase relation. We call this method Fourier-transform Analysis of Comb Emission (FACE) and we consider it as the most direct and general method for a thorough FCs characterization, with the additional advantage to be suitable for any spectral region of interest.
A mid-IR and a THz QCL-comb have been characterized, showing both robust correlation among the modes over a ms timescale, and remarkable stability over tens of minutes. For the THz QCL-comb the complete set of measured phases and amplitudes allows to reconstruct the emitted intensity profile and the instantaneous frequency, confirming a hybrid frequency/amplitude modulation regime in the device emission.
2 Results
2.1 Measurement technique
A FC is made of a series of evenly-spaced modes in the frequency domain. The overall emitted electric field can be written as:
[TABLE]
Here is the integer numbering the -th FC mode, is the (real) amplitude of the -th mode, the exponent is the total phase of the -th mode, is the mode spacing, is the offset frequency, the time, and is the Fourier phase of the -th mode. The condition for representing a FC field is that all the s are constant in time, with fluctuations , meaning that a well-defined phase relation among the modes is established, without any constraint on the actual shape of the phase relation itself.
The information on the Fourier phases of the FC modes is stored in the time-varying electric field of the emitted radiation and can be extracted by a fast Fourier transform (FFT) analysis. In order to be acquired, the field oscillating at optical frequencies ( THz) is down-converted to the radio frequencies (RF) by beating the sample FC with a second local oscillator FC (LO-FC). This dual-comb multi-heterodyne detection scheme [31, 32], sketched in fig. 1a, allows a one-by-one mapping of the sample FC in the RF (RF-FC, see fig. 1b and c), with a spacing between the beat notes (BNs)
[TABLE]
being and the integer minimizing . Naming and the Fourier phases of the sample FC and of the LO-FC, respectively, the phases of the related BNs are given by (see section S.4). By measuring , the Fourier phases of the sample FC are determined against those of the LO-FC.
Differently from dual-comb spectroscopy (DCS) [32], where the unknown sample is usually a molecular absorption spectrum, here the sample is the sample FC with its modes amplitudes/phases, while the LO-FC ones are known and taken as reference. As we will see in the following, the precision of the phase measurement is below , achieved thanks to the combination of an active stabilization of the sample FC spacing with an electronic cancellation of common-mode noise, significantly improving the phase stability. As a consequence, we have been able to monitor the phase coherence at a time-scale of seconds, while typical DCS setups do not average the signal for longer than tens of ms [33].
In fig. 1 the setup used for dual-comb multi-heterodyne detection is sketched. According to eq. 1, the frequency of a FC mode can be written as . In order to measure the Fourier phases, it is mandatory to get rid of and fluctuations, for both the involved FCs. can usually be detected as BN between the FC modes (IBN), and its fluctuations can be canceled by implementing a phase-locked loop (PLL) RF chain acting on the FC, having a stable clock as reference (see section S.2).
For FCs with a suitable second actuator, a referencing scheme implementing a second PLL chain, controlling , is used [1]. In case the second actuator is missing or inefficient, noise can be removed from the RF-FC by electronically mixing a selected reference BN (RBN) with the other BNs (see fig. 1d) [27]. The resulting RF difference BNs are free of common-mode frequency noise (see fig. 1d and f, and sections S.2 and S.3). In this regard, since common-mode noise provides no information on intrinsic FC operation, all the results presented here are common-mode-noise-free.
In order to get simultaneous information about the Fourier phases of the modes, the RF-FC signal is acquired as time trace (two quadratures, I and Q) with a spectrum analyzer (see fig. 1e) using the highest sampling rate available (75 MS/s), which results in a Nyquist frequency of MHz. The RF-FC time traces can be split into a variable number of consecutive time frames. This allows to observe the evolution of the phases at different time scales. At shorter time scales, i.e. 1 ms, the limiting factor is the BNs signal-to-noise ratio (S/N), whereas at longer time scales is the buffer capacity of the digitiser, the limit being about 2 s. Each frame is processed by means of an automated FFT analysis routine, retrieving frequency, amplitude and phase of all the BNs. This procedure is at the basis of the FACE method. The detailed procedure used for analyzing these signals is described in section M.1.
2.2 fs-pulsed FCs
Fig. 2-top shows a simulation of a pulsed FC emission, whose modes constructively interfere for pulse formation (fig. 2a and b). Fig. 2c shows the phases of the modes presented in fig. 2a, color coded. The phase relation is linear, with an evolving slope depending only on the observation time. The first experiment here presented, involving two commercial fs-pulsed FCs, aims to probe the precision of our technique on this well-defined phase pattern.
The experimental details regarding the pulsed FCs can be found in section M.2, while in fig. 2d the phases retrieved for 8 consecutive 1-s-long acquisitions are plotted, with a dead time of 38 s between consecutive acquisitions, thus covering an overall 4-minutes time interval. The peak centered at 185 MHz is the RBN for subtraction. The relevant time-independent phase information (Fourier phases) is provided by the fit residuals (see fig. 2e) representing the phase relation. Computing the standard deviation of each BN phase it is possible to estimate its time stability over the considered time interval. The phase of each BN is stable within , basically depending on the S/N of the BN.
The results show that the phase relation among the observed modes of the two classical FCs is not completely flat, the phases falling within a range of (see fig. 2e). In this regard, in section S.5 a simulation of a pulsed FC emission, obtained by varying the scattering of the randomly-generated phase values assigned to the modes, is shown. Pulses with a good contrast can still be generated with a scattering of the phases of , while scattering values exceeding severely degrade the pulsed regime.
2.3 Mid-IR and THz QCL-combs
The specific, almost-flat, phase relation of pulsed FCs is particularly handy when using these sources as LOs for measuring the unknown phase relation of a sample FC, e.g. mid- and far-IR QCL-combs. For measurements in the mid-IR and THz regions, convenient pulsed LO-FCs can be obtained by difference frequency generation (DFG-FCs). In the measurements on QCL-combs presented in this paper, we have used the FCs described in section M.2 as pumping sources for down-conversion setups to mid- and far-IR [34, 35, 36, 37, 38]. Due to the generation process, DFG-FCs inherit the same as the pumping FCs. A complete QCL-combs descriptions can be found in section S.1. QCL-combs can be electrically extracted from the laser chip. This signal is used in a PLL for actively phase locking to a RF oscillator (referenced to the quartz/Rb/GPS clock) by modulating the QCL bias current. Such phase-locking removes the frequency noise contribution on the detected BNs coming from . Again, a single RBN is isolated and mixed with all the other BNs in order to remove common-mode noise (). All the RF chains are described in detail in sections S.2 and S.3.
The effect of the PLL and of the common-mode noise removal is reported in fig. 3, where an acquisition of the RF-FC amplitude spectrum related to the THz QCL-comb is shown. The spectrum is made of a series of equally-spaced narrow peaks, confirming FC operation. For this reason, the technique can also detect in real-time a non-perfect FC behaviour, or transitions in or out of FC operation. Zooming over each BN (fig. 3-bottom) reveals that the BNs width is always limited by the analysis resolution bandwidth (RBW – 1.25 Hz in this case). This result is the first direct evidence of the remarkable stability, at 1-Hz level, of the BNs frequencies.
For the mid-IR QCL-comb, whose is about 7.060 GHz, in order to optimize the multi-heterodyne dual-comb BN detection, is set to 1.00780 GHz, leading to MHz with (eq. 2), enabling the simultaneous acquisition of 12 BNs within an actual frequency span of 61 MHz.
In fig. 4-top the phases retrieved for 8 consecutive 1s-long acquisitions covering a total of 4 minutes are compared. Here, the linear fit residuals (fig. 4b) show an evident parabolic trend with a concavity of , corresponding to a group delay dispersion (GDD) of . The quadratic fit residuals (fig. 4c) clearly show a fixed phase relation. The obtained phases are stable within . The only exception is the phase of the BN at 91.4 MHz, that is clearly less stable than the others, with fluctuations of about .
For the THz QCL-comb GHz, while is set to 250.39 MHz, yielding MHz with (eq. 2), enabling the simultaneous acquisition of 11 BNs, corresponding to all the modes emitted by the device. Fig. 4-bottom shows the phases retrieved in 7 different 1s-long acquisitions taken in a time interval of about 30 minutes. In this case, the linear fit residuals (fig. 4e) show a parabolic trend with a concavity of , yielding a GDD of , while the quadratic fit residuals of each mode (fig. 4f) are stable within about , excluding the last two modes that are clearly less stable.
3 Discussion
Considering the stability of the measured Fourier phases, the newly-proposed combination of active stabilization and electronic subtraction of common-mode noise allowed to achieve a precision of at minutes timescales. As a consequence, this is the level of coherence that has been proven for the fully-stabilized commercial fs-pulsed FCs.
On the other hand, when studying QCL-combs, our approach works also with the active stabilization of only. This minimizes the interaction with the QCL-comb, and allows its study in a condition as close as possible to unperturbed operation. In this case, the observed standard deviations are more than one order of magnitude larger than the ones in pulsed FCs, in the order of at tens-of-minutes timescale (see table 1).
Concerning the phase relation, noticeably, the scattering of THz QCL-comb phases (linear residuals) encompasses a range of , a value which cannot be associated to short-pulses operation (see section S.5). On the other hand, the scattering of the mid-IR QCL-comb phases covers a range of , a value that would still allow generation of short pulses with a good contrast. However, only a limited number of mid-IR FC modes could be observed in this case ( of the total number), possibly leading to an underestimation of the overall phases scattering.
The quadratic term found in the phase relations of the two QCL-combs (see fig. 4b and e, and table 1) can be attributed to chirping in either DFG-FCs pulses or QCL-combs emission. However, the obtained GDD values are very similar in the two cases, while the two experimental setups are completely different. Moreover, the pump fs lasers used for DFG-FCs generation are optimized for the shortest possible pulse duration, i.e. the smallest chirp in the emission. As a consequence, it is highly probable that the measured chirp is due to the QCL-combs. A comparison of the obtained GDD values with what reported in ref. [30] for a dispersion-compensated mid-IR QCL-comb suggests that the devices described in this work operate in a non-pure linear-chirp regime. In fact, the measured GDD values for these two devices are smaller (2 and 6 times for mid-IR and THz QCL-combs, respectively) compared to the theoretical values calculated following the approach therein presented for maximally-chirped pulse operation. This evidence suggests that dispersion compensation significantly influences the operation of QCL-combs, favoring maximally-chirped operation, and that the devices described in this work operate in a different regime, as confirmed by the following analysis.
For the THz QCL-comb we are able to simultaneously measure the complete set of emitted modes. Starting from the measured frequencies, amplitudes and phases of the modes, we are able to reconstruct the electric field, the intensity profile and the instantaneous frequency of the QCL-comb emission, as shown in fig. 5. The intensity profiles are obtained from seven reconstructions, based on the independent measurements shown in fig. 4-bottom. The emission profiles are roughly the same from measurement to measurement, as already suggested by the consistency of the phases over the entire 30 minutes-long observation period. Noticeably, the QCL-comb emission deviates from a pulsed emission, even though its amplitude is deeply modulated during the round trip time. The frequency of the QCL-comb is calculated by Hilbert transform of the electric field and confirms that the THz QCL-comb operates in a hybrid amplitude-/frequency-modulated regime [39]. In fact, in the region around 2–10 ps (see fig. 5), a pulse-like shape coherently corresponds to an almost constant frequency (amplitude modulation). In the remaining time intervals, an important frequency modulation clearly emerges. This sort of behaviour is found also in similar devices, both in THz QCL-combs, with opposite operation modes observed for two distinct emission lobes [29], and in dispersion-compensated mid-IR QCL-combs [30], where the strong linear chirp is absent in correspondence of the pulse-like emission. In addition, for the device under investigation the emission intensity and the instantaneous frequency appear to be related. This might be due to phenomena induced by the high third-order nonlinear coefficient originating the four-wave mixing, such as self-phase modulation. At the same time, the retrieved electric field, shown in fig. 5c, is similar to that found with a completely different technique for actively mode-locked devices [40].
In conclusion, we have introduced the FACE method for real-time monitoring of the Fourier phases of a generic FC by direct comparison with those of a metrological-grade FC, using a phase-stable dual-comb multi-heterodyne detection scheme and the Fourier analysis. This is particularly interesting for new-generation FCs, where the phase relation among the modes can be non-trivial. The knowledge of the phase relation provides the basis for future implementation of programmable pulse shaping [41]. Moreover, the analysis covers time scales ranging from ms to tens of minutes, and can be used to validate theoretical models describing FC formation mechanisms [42, 43, 14, 44, 45, 46]. The remarkable phase stability attained for the QCL-combs modes conclusively proves the high coherence characterizing their emission, paving the way to significant improvements for present applications, e.g. broadband phase-sensitive spectroscopy and metrological FC signals distribution, but also to unpredictably new setups and measurements.
M Methods
M.1 IQT acquisition and phases retrieval
A real-time FFT approach is required in order to obtain a simultaneous information about the Fourier phases of the modes (FACE method). For this reason the RF-FC signal is acquired as time trace (in its two quadratures I and Q, related to a reference RF LO) with a spectrum analyzer using the highest sampling rate available (75 MS/s). A dedicated FFT routine computes the Fourier transform giving the amplitude and the phase spectrum of the signal. Successively, a specifically-developed routine identifies the FFT frequencies of the BNs in the amplitude spectrum and collects the related phases from the phase spectrum. For the FFT algorithm the resolution bandwidth is given by , where is the length of the time trace.
M.2 Pulsed fs FCs
The dual-comb multi-heterodyne detection setup for measuring the phases of the modes of the two commercial FCs is here described (see fig. 1a in the main text). The sample FC is a visible/near-IR FC generated by a Ti:Sa laser centered at 810 nm, operating in pulsed passive mode-locking, with tunable around 1 GHz, spectrally broadened to more than one octave (500–1100 nm) by a photonic-crystal fiber. The LO FC is a near-IR FC generated by an Er-doped fiber laser centered at 1550 nm, operating in pulsed passive mode-locking, with MHz, and broadened to achieve a 1000–2000 nm spectral coverage by a highly-nonlinear fiber. The optimal spectral superposition between the two FCs falls in the wavelength region around 1064 nm. There, the two FCs are optically filtered by means of a high-resolution 2-m-focal-length Fastie-Ebert monochromator SOPRA [47], opportunely modified for operating in the near-IR with an echelle grating (720 g/mm) working at first order. Optical filtering ensures the detection of only the BNs of interest, contemporarily increasing their signal to noise ratio (S/N). and are phase stabilized and tuned in order to have MHz with (see eq. 2). In this configuration, a RF-FC is detected by using a fast photodetector, one RBN is isolated with a narrow-band RF filter and is canceled out by RF mixing (see section S.2). With MHz within a frequency span of 40 MHz 8 BNs can be simultaneously acquired.
Acknowledgements
The authors acknowledge financial support by:
- •
Ministero dell’Istruzione, dell’Università e della Ricerca (Project PRIN-2015KEZNYM “NEMO – Nonlinear dynamics of optical frequency combs”);
- •
European Union’s Horizon 2020 research and innovation programme (Laserlab-Europe Project [grant No 654148], CHIC Project [ERC grant No 724344], ULTRAQCL Project [FET Open grant No 665158] “Ultrashort Pulse Generation from Terahertz Quantum Cascade Lasers”, and Qombs Project [FET Flagship on Quantum Technologies grant No 820419] “Quantum simulation and entanglement engineering in quantum cascade laser frequency combs”);
- •
European ESFRI Roadmap (“Extreme Light Infrastructure” – ELI Project);
- •
Swiss National Science Foundation (SNF200020-165639).
Author contributions
F.C. and S.B. conceived the experiment. L.C., F.C., G.C., I.G., M.S.d.C., A.C., P.C.P. and R.E. performed the measurements. F.C., G.C., R.E. and S.B. analyzed the data. L.C. and F.C. wrote the manuscript. G.C., D.M., M.S.d.C., P.C.P., R.E., S.B., G.S., J.F. and P.D.N. contributed to manuscript revision. J.F., G.S., M.R. and M.B. provided the quantum cascade lasers. L.C., F.C., D.M., P.C.P., R.E., S.B., G.S., J.F. and P.D.N. discussed the results. L.C. and F.C. contributed equally to this work. All work was performed under the joint supervision of P.D.N. and S.B..
Competing interests
The authors declare no competing financial interests.
Data availability
The data that support the plots within this paper and other findings of this study are available from the corresponding authors upon reasonable request.
S Supplementary information
S.1 Quantum cascade laser devices
The mid-IR QCL investigated in this work is a broad-gain Fabry-Pérot device operating at a temperature C, with a threshold current mA, emitting at a wavelength m. Within the 645–760-mA driving current range the QCL generates a FC [27] characterized by about 100 modes with GHz and an overall emitted power of 40 mW per facet.
In fig. S1 the QCL-comb spectrum acquired with an optical spectrum analyzer is shown.
The THz QCL-comb is a heterogeneous cascade laser device emitting in the 2.5–3.1 THz spectral region (see fig. S2a). It is based on a double-metal ridge waveguide, defined via dry etching, of length 2 mm and width m, with lateral side absorbers for enhanced transverse mode suppression [48]. When operated in continuous wave (CW) at K, it displays a clear and narrow intermodal beat note (IBN) around 19.8 GHz in the current range 305–335 mA, as shown in fig. S2b. In this regime, the IBN width is in the order of tens of kHz, and has a tunability of 2.23 MHz/mA (see fig. S2c). It is worth noting that, in the range of current where the IBN signal is detected (305–335 mA), the spectrum of the QCL shows 11 intense modes, while the other emitting modes have an intensity more than 10 times lower.
S.2 Mid-IR: phase locking and fluctuations suppression
An effective measurement of the Fourier phases of FC modes requires fully-stabilized signals, the residual frequency noise must be negligible within the adopted resolution bandwidth. For this purpose, a dedicated electronic setup for stabilization and cancellation has been realized (fig. S3). The setup is composed of two RF chains.
The first one (bottom left – green background) locks . When the sample FC is the QCL-comb, (7.060 GHz) can be detected as RF signal directly contacting the laser chip. is firstly filtered and down-mixed. At this point the attained signal can be phase locked to a RF LO (PLL LO) by using a PLL electronics for generating the error signal that is used to modulate the laser bias current. The current modulator consists of a control circuitry placed in parallel to the QCL. It is based on a field-effect transistor (FET) [27], where the processed error signal is fed to the gate of the FET itself, that acts by proportionally decreasing the current flowing through the laser. The locking shows satisfactory stability and efficiency (99.0%) with a bandwidth of 5 kHz (see fig. S4a).
The second RF chain (right side – blue background) is used for removing the common-mode noise ( fluctuations) from the dual-comb spectrum (RF-FC). The RF-FC spectrum is made of several BNs which are preliminarily filtered around within a bandwidth slightly larger than the Fourier transform span. A single BN is selected as reference (RBN) by tightly filtering at , then it is down shifted by RF mixing of a frequency (75 MHz for the mid-IR QCL-comb) and again filtered around . The down-shifted RBN is then subtracted from all the other BNs by RF mixing. The result is a RF-FC centered at , with a bandwidth corresponding to , where all the BNs are common-mode-frequency-noise free (-free RF-FC). Thanks to the two RF chains, resolution-bandwidth-limited BNs with S/N are attained (see fig. S4b for a comparison between the original RF-FC and the -free RF-FC).
All the RF signals used as LOs are referenced to the primary frequency standard through a GPS-disciplined Rb-locked quartz oscillator. Along the RF chains, dedicated RF amplifiers keep the signals level at an adequate value for transmission and circuitry operation.
S.3 THz: phase locking and fluctuations suppression
For the stabilization of the THz QCL-comb, a similar setup has been used (fig. S5). Once again, it consists of two different sections, devoted to the suppression of spacing and offset jitters, respectively.
For what concerns the stabilization of the modes spacing, an active phase-locking of the QCL IBN has been implemented (fig. S5-left). The IBN is electrically extracted from the QCL by mounting a bias-tee (Marki Microwave, mod. BT-0024SMG) inside the liquid helium cryostat, as close as possible to the device. The DC line feeds the current to the QCL, while the AC line is used to extract the IBN, that is acquired by a spectrum analyzer. The IBN frequency is about 19.8 GHz and with a 50 dB S/N ratio in a 1 kHz bandwidth. The IBN signal is mixed with a synthesized RF and down-converted to the MHz range, it is then amplified and sent to a PLL electronics working with a 30 MHz local oscillator (LO). The PLL output signal is fed back to the QCL current driver for the active stabilization of the IBN phase with a 20 kHz bandwidth. Both the synthesizer and the LO are linked to the 10 MHz frequency standard provided by a GPS-disciplined Rb-locked quartz oscillator chain. In these conditions, when the PLL is active, the IBN phase is locked to that of the LO, whose frequency is stable at a level of in 1 s. In this way the phase jitter depending on the spacing fluctuations of the THz QCL-comb is suppressed.
The THz QCL-comb offset fluctuations can be subtracted from the multi-heterodyne signal by implementing the passive scheme described in fig. S5-right. The multi-heterodyne signal detected by the HEB is split into two parts. The first part is filtered with a narrow band pass (BP) filter, in order to select a single BN, to be used as reference (RBN). The RBN is then shifted by 40 MHz and is mixed again with the multi-heterodyne signal. The difference-frequency component of the mixed signal is finally acquired by the real-time FFT spectrum analyzer. In this difference process the common-mode noise coming from offset fluctuations, and carried by the RBN, is automatically canceled out from all the modes.
S.4 Relation between the FC modes and the corresponding BNs
In this section we will show how the Fourier phases of the BNs are related to the Fourier phases of the FC modes that generate them.
We start by writing the time-dependent overall electric field emitted by the two FCs involved in the dual-comb multi-heterodyne detection.
[TABLE]
[TABLE]
Here and are the integers numbering the FC modes, is the (real) amplitude of the -th mode, is the mode spacing, is the offset frequency, is time, and the Fourier phase of the -th mode.
The intensity of the field on the detector is given by
[TABLE]
and explicitly
[TABLE]
where is the vacuum permittivity and is the speed of light in vacuum.
The first two lines in eq. 6 represent the total intensities and the harmonics of of the two FCs. These terms are generally deliberately excluded by using AC-coupled detectors with a bandwidth .
The oscillating term at line three of eq. 6 describes the generated dual-comb BNs. In particular, the amplitude, the frequency and the phase of each BN are the following:
[TABLE]
Only the BNs whose frequency falls within the acquisition bandwidth can be detected. A proper choice of the bandwidth of the optical band-pass filter, of the detection bandwidth (usually ) and of (see eq. 2) ensures a one-by-one mapping of the sample FC modes in terms of RF BNs (RF-FC), considering the LO-FC as reference (see fig. 1 in the main text). In particular, directly depend on the Fourier phase of the sample FC mode of interest.
S.5 Pulse operation vs scattering amplitude of the phases
In this section the results of a simulation of the pulse operation of a FC are reported. In particular, the effect of the varying scattering amplitude of a random distribution of the modes phases is investigated. For this purpose, a FC centered at 250 MHz, with MHz and emitting 100 modes, is considered. All the modes are characterized by the same intensity, while the phases distribution changes from run to run. The series of random numbers (from 0 to 1) used for generating the phases is generated only once, while the multiplying factor is changed from run to run (from to ). In fig. S6 the obtained intensity profiles are shown.
For low scattering amplitude values the pulses are evident, while with increasing scattering amplitude the pulse–background contrast drastically degrades. Changing the series of random numbers used for generating the phases does not significantly change the attained intensity profiles.
The reference list from the paper itself. Each links out to its DOI / PubMed record.
- 1[1] D. J. Jones, S. A. Diddams, J. K. Ranka, A. Stentz, R. S. Windeler, J. L. Hall, and S. T. Cundiff. Carrier-envelope phase control of femtosecond mode-locked lasers and direct optical frequency synthesis. Science 288 , 635 (2000).
- 2[2] S. A. Diddams, D. J. Jones, J. Ye, S. T. Cundiff, J. L. Hall, J. K. Ranka, R. S. Windeler, R. Holzwarth, T. Udem, and T. W. Hänsch. Direct link between microwave and optical frequencies with a 300 T Hz femtosecond laser comb. Phys. Rev. Lett. 84 , 5102 (2000).
- 3[3] R. Holzwarth, T. Udem, T. W. Hänsch, J. C. Knight, W. J. Wadsworth, and P. S. J. Russell. Optical frequency synthesizer for precision spectroscopy. Phys. Rev. Lett. 85 , 2264 (2000).
- 4[4] T. Udem, R. Holzwarth, and T. W. Hänsch. Optical frequency metrology. Nature 416 , 233 (2002).
- 5[5] S. A. Diddams. The evolving optical frequency comb [Invited]. J. Opt. Soc. Am. B 27 , B 51 (2010).
- 6[6] J. Faist, F. Capasso, D. L. Sivco, C. Sirtori, A. L. Hutchinson, and A. Y. Cho. Quantum cascade laser. Science 264 , 553 (1994).
- 7[7] M. Beck, D. Hofstetter, T. Aellen, J. Faist, U. Oesterle, M. Ilegems, E. Gini, and H. Melchior. Continuous wave operation of a mid-infrared semiconductor laser at room temperature. Science 295 , 301 (2002).
- 8[8] R. Köhler, A. Tredicucci, F. Beltram, H. E. Beere, E. H. Linfield, A. G. Davies, D. A. Ritchie, R. C. Iotti, and F. Rossi. Terahertz semiconductor-heterostructure laser. Nature 417 , 156 (2002).