A Study of the PDF uncertainty on the LHC W-boson mass measurement
Moh'd Hussein, Joshua Isaacson, and Joey Huston

TL;DR
This paper quantifies the uncertainty in measuring the W-boson mass at the LHC caused by parton distribution functions, using advanced calculations and simulations to provide precise estimates at different energies.
Contribution
It provides a detailed, quantitative assessment of PDF-induced uncertainties on the W-boson mass measurement at various LHC energies using NNLO PDFs and NNLL+NNLO calculations.
Findings
PDF uncertainties are around 13-17 MeV at 7 TeV.
Uncertainties are similar at 8 TeV and 13 TeV energies.
The study offers specific uncertainty estimates for different kinematic cuts.
Abstract
The determination of the -boson mass through an analysis of the decay charged-lepton transverse momentum distribution has a sizable uncertainty due to the imperfect knowledge of the relevant parton distribution functions (PDFs). In this paper, a quantitative assessment of the -boson mass uncertainty at the LHC resulting from the PDF uncertainty is examined. We use the CT14 NNLO PDFs with a NNLL + NNLO calculation (ResBos) to simulate the -boson production and decay kinematics. The uncertainty of the -boson mass determination is then determined as a function of the boson and lepton kinematics. For production using GeV and (GeV) , PDF uncertainties (at the 68% CL) of MeV, MeV, and MeV, are determined at 7 TeV, 8 TeV and 13 TeV respectively. The uncertainties of for…
Click any figure to enlarge with its caption.
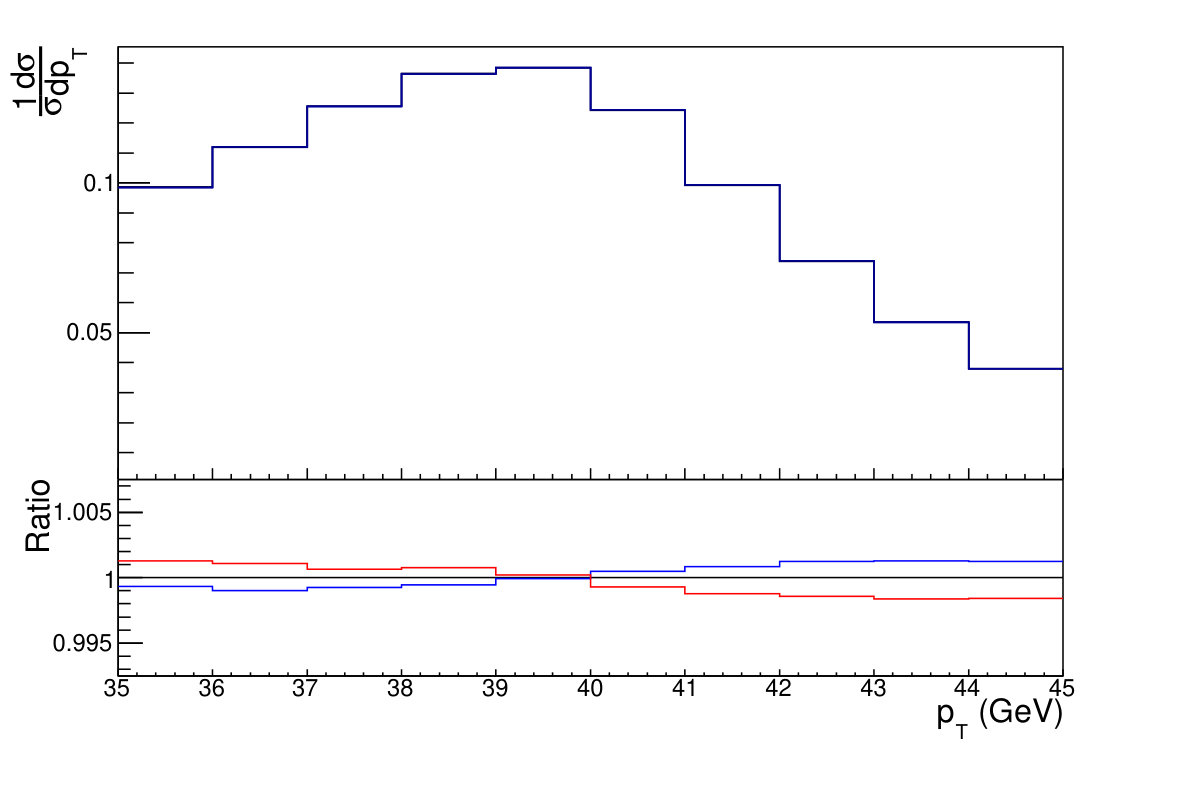 Figure 1
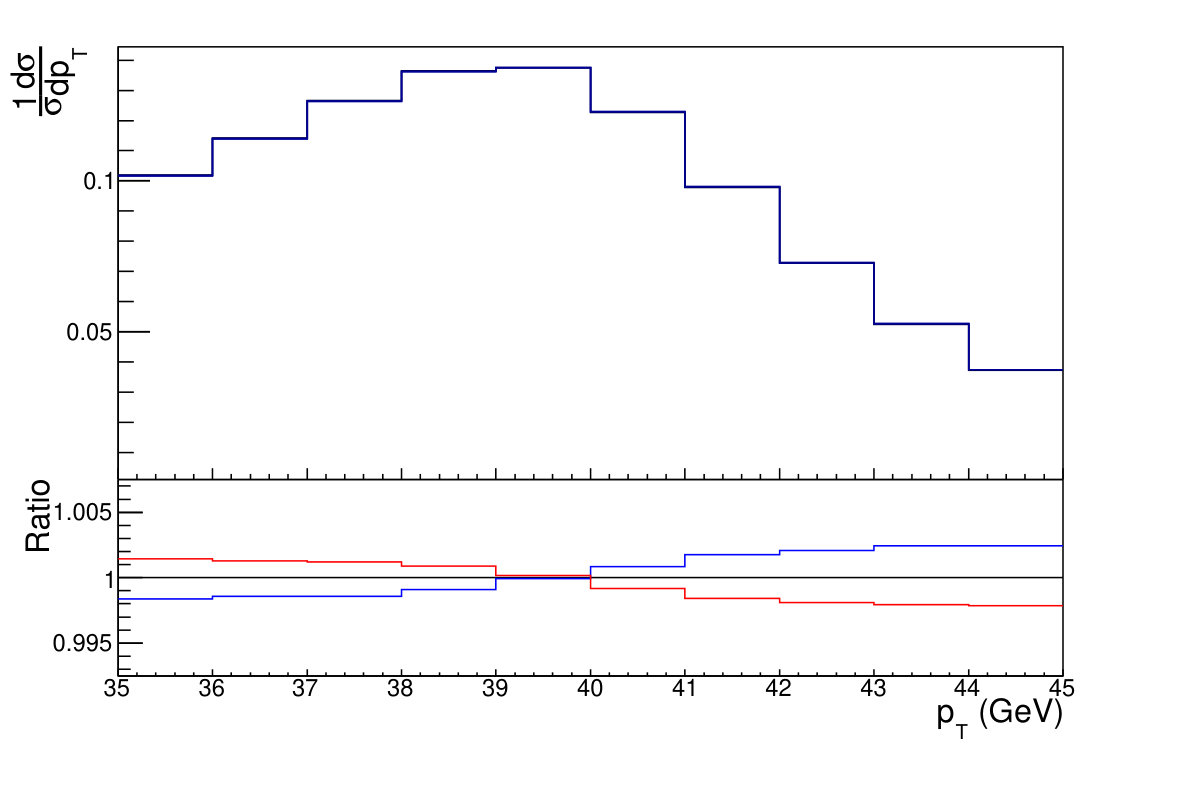 Figure 2
 Figure 3
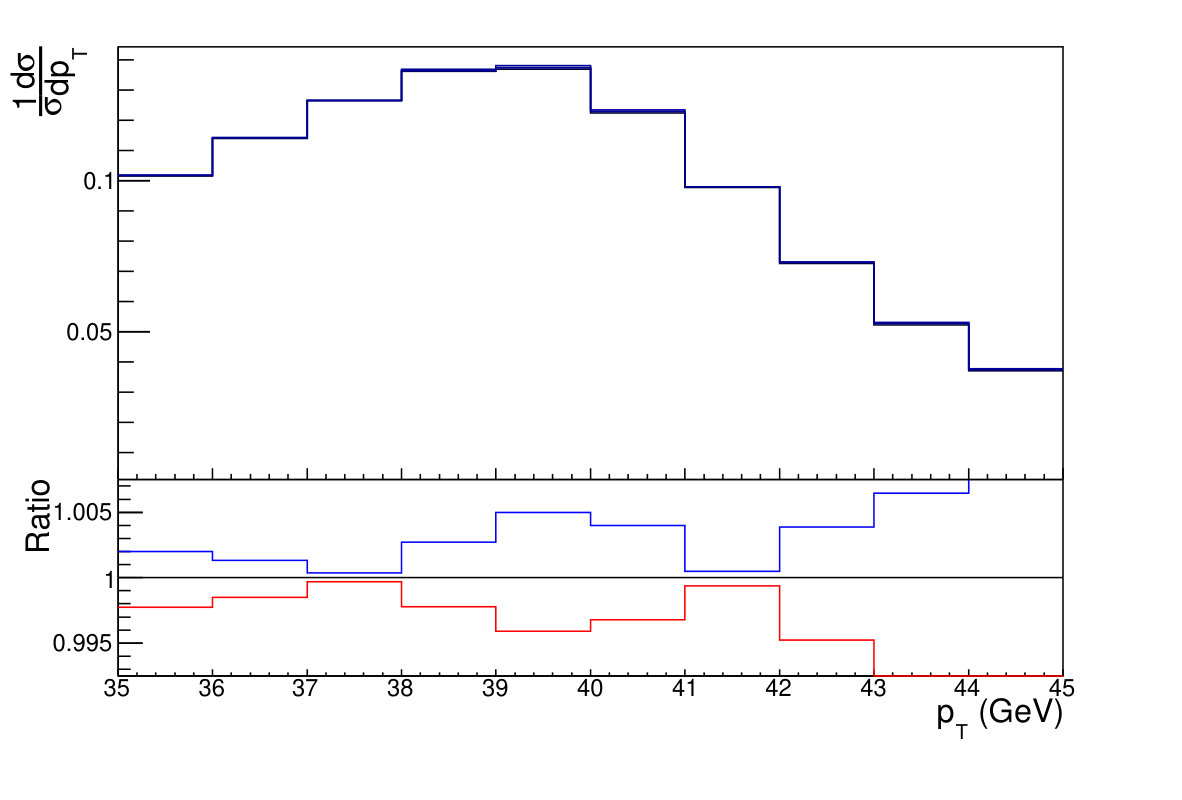 Figure 4
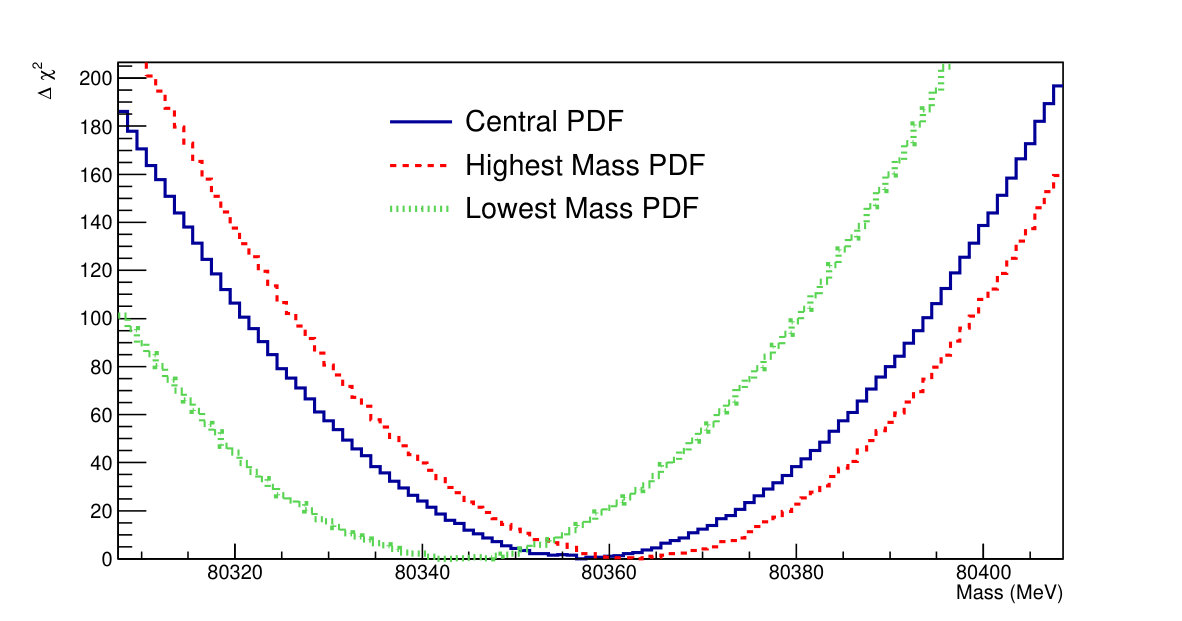 Figure 5
| Uncertainty (MeV) | Uncertainty (MeV) | |
|---|---|---|
| GeV | + 16.0 - 17.5 | + 15.9 - 15.6 |
| GeV | + 18.1 - 22.4 | + 22.4 - 18.1 |
| GeV | + 14.2 - 24.7 | + 21.1 - 20.5 |
| GeV | + 12.5 - 32.3 | + 28.5 - 17.2 |
| Uncertainty (MeV) | Uncertainty (MeV) | |
| GeV | + 17.4 - 18.7 | + 15.0 - 17.7 |
| GeV | + 20.1 - 27.6 | + 23.0 - 24.6 |
| GeV | + 21.1 - 27.8 | + 19.4 - 29.7 |
| GeV | + 17.8 - 30.0 | + 19.2 - 29.3 |
| Uncertainty (MeV) | Uncertainty (MeV) | |
| GeV | + 20.0 - 19.3 | + 20.7 - 14.1 |
| GeV | + 23.1 - 31.3 | + 31.9 - 21.5 |
| GeV | + 19.9 - 39.4 | + 14.1 - 42.8 |
| GeV | + 17.5 - 43.8 | + 10.0 - 51.3 |
| Uncertainty (MeV) | Uncertainty (MeV) | |
|---|---|---|
| GeV | + 13.9 - 14.8 | + 15.0 - 12.7 |
| GeV | + 21.7 - 16.3 | + 18.9 - 17.2 |
| GeV | + 21.5 - 21.7 | + 22.4 - 19.7 |
| GeV | + 20.0 - 25.2 | + 26.3 - 15.9 |
| Uncertainty (MeV) | Uncertainty (MeV) | |
| GeV | + 16.1 - 16.1 | + 17.6 - 15.4 |
| GeV | + 23.5 - 20.2 | + 23.0 - 21.2 |
| GeV | + 24.5 - 21.8 | + 29.1 - 19.7 |
| GeV | + 21.8 - 23.5 | + 28.3 - 20.0 |
| Uncertainty (MeV) | Uncertainty (MeV) | |
| GeV | + 13.6 - 21.9 | + 17.9 - 16.6 |
| GeV | + 20.9 - 32.0 | + 28.7 - 21.9 |
| GeV | + 25.1 - 34.5 | + 32.4 - 27.9 |
| GeV | + 34.2 - 26.8 | + 34.7 - 27.8 |
| Uncertainty (MeV) | Uncertainty (MeV) | |
|---|---|---|
| GeV | + 12.2 - 19.2 | + 14.8 - 15.3 |
| GeV | + 16.3 - 25.9 | + 14.7 - 24.8 |
| GeV | + 19.5 - 27.1 | + 20.7 - 24.3 |
| GeV | + 21.8 - 27.6 | + 16.4 - 27.3 |
| Uncertainty (MeV) | Uncertainty (MeV) | |
| GeV | + 17.8 - 18.3 | + 15.7 - 17.1 |
| GeV | + 24.2 - 24.6 | + 20.2 - 25.4 |
| GeV | + 24.0 - 25.8 | + 23.8 - 26.7 |
| GeV | + 20.4 - 29.3 | + 21.0 - 27.6 |
| Uncertainty (MeV) | Uncertainty (MeV) | |
| GeV | + 18.2 - 18.2 | + 16.9 - 17.2 |
| GeV | + 27.6 - 28.2 | + 23.6 - 27.1 |
| GeV | + 27.5 - 33.7 | + 30.4 - 30.6 |
| GeV | + 26.4 - 33.5 | + 24.6 - 30.3 |
Peer Reviews
No public reviews on file for this paper yet. If you reviewed it on a platform where reviews are public (OpenReview, ICLR, NeurIPS, ICML), you can paste yours below so the community can read it here.
Videos
No videos yet. Explain this paper in a talk, walkthrough, or lecture? Add one.
A Study of the PDF uncertainty on the LHC W-boson mass measurement
Moh’d Hussein
Department of Physics, The University of Jordan, Amman 11942, Jordan
Joshua Isaacson
Theoretical Physics Department, Fermilab, Batavia, IL 60510, USA
Joey Huston
Department of Physics and Astronomy, Michigan State University, East Lansing, MI 48824, USA
The determination of the -boson mass through an analysis of the decay charged-lepton transverse momentum distribution has a sizable uncertainty due to the imperfect knowledge of the relevant parton distribution functions (PDFs). In this paper, a quantitative assessment of the -boson mass uncertainty at the LHC resulting from the PDF uncertainty is examined. We use the CT14 NNLO PDFs with a NNLL + NNLO calculation (ResBos) to simulate the -boson production and decay kinematics. The uncertainty of the -boson mass determination is then determined as a function of the boson and lepton kinematics. For production using GeV and (GeV) , PDF uncertainties (at the 68% CL) of MeV, MeV, and MeV, are determined at 7 TeV, 8 TeV and 13 TeV respectively. The uncertainties of for the same cuts are found to be MeV, MeV and MeV, at 7 TeV, 8 TeV and 13 TeV respectively.
††preprint: FERMILAB-PUB-19-185-T
I Introduction
I.1 Importance of the precision -boson mass determination
The -boson mass () is a fundamental parameter of the Standard Model (SM). can be both directly measured, and computed indirectly from electroweak precision constraints. There is an interplay between , the top quark mass (), and the Higgs mass () when calculating electroweak precision observables Baak et al. (2012). Currently, there is some tension between the best fit value from the electroweak precision data and the direct measurement. Electroweak precision tests are most sensitive to . If a statistically significant discrepancy between the indirect measurement of and the direct measurement is found, this would be strong evidence for new physics beyond the SM such as the Minimal Supersymmetric Standard Model Heinemeyer et al. (2006). Therefore, more precise determinations of have been an important goal for collider physics programs at both the Tevatron and the LHC, both for testing the consistency of the SM and for exploring the possibility of new physics beyond the SM.
I.2 Current limits on and on PDF uncertainty
Currently, the best limits for the -boson mass come from the measurements at the Tevatron, and from a recent result from ATLAS. The -boson mass has been measured at CDF (8038719 MeV) and D0 ( GeV), with a combined Tevatron average of 8038716 MeV Aaltonen et al. (2014); Abazov et al. (2014); Aaltonen et al. (2013). A more recent measurement for at ATLAS has yielded a value of MeV Aaboud et al. (2018). CMS has not reported a result to date. One of the major systematic uncertainties for the direct measurement arises from an imperfect knowledge of the parton distribution functions (PDFs) relevant for -boson production. Using the measurement Aad et al. (2015), the combined value for ATLAS et al. (2014), and the SM precisely measured parameters of the fine-structure constant , the Fermi constant , and the -boson mass (), results in a predicted (indirect) mass for the -boson of 803628 MeV de Blas et al. (2016) and 803588 MeV Baak et al. (2014). This indirect uncertainty limit provides a goal for the desired experimental precision for the W-boson mass.
I.3 PDFs and their uncertainties
Parton distribution functions cannot at present be calculated from first principles, but must be determined by data. This determination requires the use of data from a wide variety of processes and experiments, both for the determination of the central PDFs and of their uncertainties. There are several collaborations dedicated to this endeavor, among them: CTEQ-TEA Dulat et al. (2016), MMHT Harland-Lang et al. (2015), and NNPDF Ball et al. (2015). PDFs have been produced at LO, NLO and (more recently) NNLO, in the strong coupling constant . The highest precision predictions at the LHC require the use of NNLO PDFs. Previously, NNLO PDFs from the CTEQ collaboration (CT10 Gao et al. (2014)), have been used in a determination of the W-mass uncertainty Bozzi et al. (2015). In this paper, we update those predictions using the NNLO PDFs of CT14 Dulat et al. (2016). The CT14 PDFs include data sets from the LHC at = 7 TeV for the first time, as well as updated data from the Tevatron and from HERA. The most important aspect of the LHC data sets for this analysis is their ability to impose constraints on the light quark and anti-quark PDFs at parton x-values appropriate for W-boson production at the LHC.
PDF uncertainties are calculated for CT14 through the use of Hessian eigenvectors Pumplin et al. (2001). CT14 NNLO has 56 Hessian error PDFs, corresponding to 28 eigenvectors, which result from the 28 free PDF parameters in the CT14 fit. In comparison, CT10 NNLO had 50 error sets, resulting from using 25 free parameters. The increased number of parameters is a result of a more flexible parametrization used in the CT14 global PDF fit. The purpose of the present analysis is to provide a quantitative assessment of the uncertainty resulting from PDF uncertainties using the CT14 NNLO PDFs.
II Methods for determining
The production of W/Z bosons is one of the most well-studied examples of hard scattering processes at hadron colliders Alioli et al. (2017). After production, the W boson decays into jets, or into a lepton-neutrino pair. Decays into the former channel are difficult to resolve due to large contributions from QCD dijet background processes. On the other hand, the and channels allow for precise measurements of prompt, energetic, and isolated electrons and muons. The decay of is also not included for precision measurements due to the complex nature of the decay.
The only observables directly measured by the detectors are the momenta of the leptons () and of the hadrons () produced in association with the -boson; the latter is referred to as the hadronic recoil. In addition, the hadronic recoil’s transverse momentum defines the negative transverse momentum of the -boson itself (). Since the neutrinos escape the detector without interaction, cannot be reconstructed on an event-by-event basis. However, the sum of the transverse momentum of all particles in the event should sum to zero in the absence of any particles evading detection and detector resolution effects. Therefore, the neutrino’s transverse momentum () can be inferred indirectly from the transverse energy missing from the event, ). The transverse mass of the -boson (), introduced in Barger et al. (1983); Smith et al. (1983), is defined as:
[TABLE]
where () is the azimuthal angle between the lepton and the neutrino (or the missing transverse energy).
It is potentially possible to measure the -boson mass using any one of the three kinematic variables, , and . In practice, the experimental resolution for does not allow for a competitive measurement of the W-boson mass (but it can still be useful as a cross-check). The other two variables can, and have been, used though at both the Tevatron and the LHC.
The extraction of is obtained through the use of templates generated from a highly parametrized Monte Carlo (MC) simulation. At leading order (LO), the -boson is produced with zero transverse momentum, and thus the charged lepton and neutrino are always back-to-back. Therefore, in the LO calculation, in the limit of zero width, and with a perfect detector, and would have extremely sharp Jacobian peaks exactly at and respectively. QCD radiation, and the impact of detector resolution, results in a shift in the location of the Jacobian peak and a broadening the distributions.
II.1 Differences between Tevatron and LHC
Compared to the Tevatron, the LHC experiments benefit from larger signal and calibration samples. For luminosities in the multi- range, the data samples are larger by an order of magnitude compared to the corresponding samples used at the Tevatron, and thus the statistical errors are significantly smaller. Moreover, and given the precisely measured value of Abbaneo et al. (2000) and the clean leptonic final state, the processes are able to be used to model the detector’s response to and to validate the analysis synopsis Krasny et al. (2007).
Uncertainties in the PDFs are the dominant source of error for the extraction of at the Tevatron (a complete list of these uncertainties can be found in Tables XIV and VI in Ref. Abazov et al. (2014); Aaltonen et al. (2014) respectively). The PDF uncertainties for -boson production were expected to be larger at the LHC Krasny et al. (2010), due to the smaller parton x-values (where the uncertainties are larger) being sampled, and due to larger contributions from sea quarks from a collider vs. a collider (see Table 3 of Ref. Aaboud et al. (2018)).
Whereas -boson production at the Tevatron is charge symmetric, the -boson production rate at the LHC exceeds that of -boson by about 40%. Moreover, the second generation quarks contribute only approximately 5% of the overall -boson production rate at the Tevatron, while at the LHC ( = 7 TeV) this rate is approximately 25% of the overall -boson production rate Aaboud et al. (2018). This fraction continues to increase as the center-of-mass energy increases. The uncertainty on the strange and charm quarks is larger than those on the light quarks(anti-quarks), and thus result in a proportionally larger contribution to the boson mass determination.
Compared to , the measurement at the LHC is affected by larger experimental systematic uncertainties, due, for example, to high pile-up energy deposited in the detector from the additional proton-proton interactions in each bunch crossing. This results in a degradation of the resolution of the measurement of that scales roughly as the square root of the total hadronic energy in the event ATL (2014). The limiting factor to balance, at present, between the experimental uncertainty () and the theoretical uncertainty () depends on the ability to develop pile-up mitigation techniques Aad et al. (2016). Although both techniques have been used at the LHC Aaboud et al. (2018), the greater discriminatory power lies with the use of the distribution, as shown in Table 10 and in Fig. 23 of Ref. Aaboud et al. (2018). Therefore, this paper will focus on determining the PDF uncertainties for the distribution.
II.2 Resummed QCD
At NLO, the -boson can recoil against one parton, and at NNLO, against two partons, thus acquiring a non-zero transverse momentum. For much less than , soft gluon radiation has a large impact on the , and resummation calculations are necessary to provide a good description of the distribution. At very low values, non-perturbative effects also become important, and must also be taken into account in the resummation calculations. In practice, most -boson events used in the determination of Aaboud et al. (2018) are produced with low values (smaller than 30 GeV). This means that, in principle, a resummed generator with non-perturbative effects such as ResBos is preferable to fixed-order calculations Quackenbush and Sullivan (2015).
Fixed-order QCD predictions work well for boson production at intermediate and large . However, the -bosons are predominantly produced at low , where the fixed-order cross section behaves as
[TABLE]
in the limit of . It can be seen that the above equation has an unphysical divergence when . This results in large logarithms (), making perturbative calculations unreliable Campbell et al. (2017). This unphysical divergence is addressed through the resummation procedure, in which the logarithmic terms are resummed to all orders in the expansion. The general formalism for transverse momentum resummation was first introduced by Collins, Soper, and Sterman (CSS) Collins et al. (1985).
[TABLE]
where
[TABLE]
Here is the leading order cross section, is the regular piece in the limit , the ’s contain the hard collinear virtual corrections, is the perturbative Sudakov factor, is the non-perturbative Sudakov factor, represent the momentum fractions carried by the incoming partons in the given process, and , are the PDFs. The non-perturbative Sudakov factor is introduced to handle the Landau pole in QCD in the limit that , or . Therefore, we adopt the formalism introduced in Collins et al. (1985), and defined as:
[TABLE]
The resummed and fixed-order calculations then have to be matched at intermediate , where the fixed-order calculation does not contain large logarithms, in order to obtain QCD predictions for the entire range of . Kinematic restrictions on the decay products of the -boson can then be applied to mimic the cuts applied to the data.
II.3 ResBos versus parton shower
ResBos, the analytic resummation program proposed and discussed in detail in Refs. Ladinsky and Yuan (1994); Balazs and Yuan (1997); Landry et al. (2003), is used to calculate at next-to-next-to-leading-log and next-to-next-to-leading order (NNLL) + (NNLO) the W boson cross section for the process pp\rightarrow W^{\pm}+X\rightarrow l^{\pm}\overset{\scalebox{0.3}{(}\raisebox{-1.7pt}[0.0pt][0.0pt]{-}\scalebox{0.3}{)}}{\nu}+X, using a renormalization and factorization scale of . ResBos uses a NNLO/NLO k-factor to obtain the NNLO correction for the -piece of the resummed cross-section. This k-factor is calculated as a function of , and . The non-perturbative Sudakov form factor, which describes the at low , is fit using DY data, and parameterized by the BLNY form Landry et al. (2003).
Parton shower Monte Carlo (MC) programs such as POWHEG Alioli et al. (2008) can also be used to simulate -boson production at the LHC. Parton showers resum the leading tower of logarithms while resummation programs can include higher order logarithms, providing a more accurate description of the distribution. The -boson decay distributions are highly sensitive to the order of resummation in the calculation, and these small differences can potentially lead to an uncertainty in greater than the desired goal of 10 MeV. Therefore, it is important to use a calculation which includes as many higher logs and higher order corrections as possible to obtain the highest accuracy currently obtainable.
The MC event generators output are fully exclusive, i.e. they provide information on all final-state particles, but approximate the resummation effects through the parton shower. On the other hand, resummation programs are inclusive, that is they provide information only about the -boson and its decay products, integrating out all additional QCD radiation. However, the information provided by resummation codes is sufficient for a precise analysis of the -boson mass. Additionally, corrections to the width of -boson and spin correlations between the initial and final state particles are included in ResBos when applicable.
III Technique for PDFs error uncertainty determination
III.1 PDF uncertainty estimation
In order to quantify the PDF uncertainty on , we need to fit the detailed shapes of the distributions using the log-likelihood () analysis. The steps we have followed are outlined below, following Ref. Bozzi et al. (2015):
- 1 -
While keeping fixed at a given central value (=80358 MeV), we generate the lepton distribution for the 56 Hessian error PDFs. Here we choose the mass at 80358 MeV based on the indirect fit obtained in Ref. Baak et al. (2014) (since we are only interested in the shift of the mass due to the PDF, and not what the central prediction is, this is an acceptable choice to make).
- 2 -
We now leave the PDF fixed to the central value (CT14), and vary in the generator to obtain the lepton transverse momentum distributions for each of the different masses considered. Here we consider values between 80308 MeV and 80408 MeV, creating templates in steps of 1 MeV.
- 3 -
For each template generated in step 1, corresponding to the different error PDFs for a fixed W boson mass (termed ), we loop through all the different templates generated in step 2, corresponding to the different -boson masses using the central CT14 PDF (termed ), and compute the corresponding ;
[TABLE]
where the summation is over all of the lepton transverse momentum bins and is the statistical uncertainty for the given bin.
- 4 -
For a fixed PDF , the value of that minimizes the distribution corresponds to the mass that would be predicted by the given PDF error set. In other words, the mass predicted by PDF would be mass (), if the corresponding was the smallest.
The PDF Hessian uncertainty on then is calculated using the master equation proposed in Ref Nadolsky and Sullivan (2001); Lai et al. (2010) for asymmetric uncertainties as follows:
[TABLE]
where represents the best fit value for the corresponding to the PDF set induced by a change of 1 standard deviations of each independent parameter describing the PDF set.
Normalizing the templates to use the shape of the distribution, instead of the overall rate, in the fit region can substantially reduce the size of the PDF uncertainties without losing the sensitivity to the value of ATL (2014). Thus, in this study we use normalized distributions.
III.2 Fit parameters and kinematic cuts
ResBos is used to calculate the boson kinematics at NNLL+NNLO for the processes pp\rightarrow W^{\pm}+X\rightarrow l^{\pm}\overset{\scalebox{0.3}{(}\raisebox{-1.7pt}[0.0pt][0.0pt]{-}\scalebox{0.3}{)}}{\nu}+X, based on the CT14 NNLO sets, at = 7, 8 and 13 TeV. A charm pole mass of 1.3 GeV is used, as in the CT10 NNLO PDFs. The PDFs for up, down, strange (anti) quarks and the gluon are parametrized at an initial scale of 1.295 GeV. The central PDF sets are obtained using a central value of of 0.118, as recommended by the PDF4LHC group Butterworth et al. (2016). The CT14 NNLO PDFs uncertainties are provided as 90% confidence level (CL) intervals, and then are scaled by a multiplicative factor of (1/1.642) to provide 68% CL intervals. This scaling is appropriate if the distribution is suitably quadratic.
The -boson signal in the data is extracted by selecting events with one central isolated, high lepton, large missing energy, and low hadronic recoil. In the ResBos-generated events, the cuts described below are implemented, mimicking the cuts used in the experimental analyses. The missing transverse energy () is required to be greater than 20 GeV and the absolute value of the lepton pseudo-rapidity () is restricted to the region less than 2.5. For comparative purposes, different ranges for (in GeV) are used: (, and ). All of these ranges have equally spaced bins of 0.5 GeV. Additional boson transverse momentum cuts ( GeV, GeV, GeV and GeV) are applied as well for comparison. We generate approximately 100M events for each template to minimize the effects of statistical fluctuations.
IV Results
Figure 1 shows sample lepton transverse momentum distributions for the -boson mass variations (left) and for the error PDF variations (right) for at at = 7 TeV. Figure 2 shows the same lepton transverse momentum distributions for . The variations, too small to easily observe in the top distributions, are more easily seen in the ratio plots underneath.
For the ratio plots for the W boson mass variations (left side of Figs. 1,2), the red (blue) curve corresponds to the maximum (minimum) allowed mass from the fit. The crossing of the two curves occurs due to the fact that the result is normalized to unity. Similarly, the ratio plots for the PDF variations (right side of Figs. 1,2), the upper (lower) curve corresponds to the total positive (negative) PDF uncertainty obtained from the master equation for the transverse momentum of the lepton. Here the curves do not cross due to the fact that the upper curve always corresponds to the positive direction uncertainty, while the lower corresponds to the negative direction uncertainty. For the variation of the error PDFs, the positive and negative ratios are approximately mirror images of each other, indicating that the uncertainty on the mass from the PDFs is reasonably symmetriic.
As an example, the profiles as a function of the -boson mass at = 7 TeV are shown in Figure 3. The profiles are reproduced for the central PDF, for the PDF that produces the highest mass -boson, and the PDF that produces the lowest mass -boson. Note that the distributions are parabolic, indicating that the 90% errors can be scaled down to 68% by applying a scaling factor. Similar curves are obtained at center-of-mass energies of 8 and 13 TeV.
The Hessian PDF uncertainties, as a function of various kinematic cuts, for both at = 7 TeV, are listed in Table 1. Those for = 8 TeV are listed in Table 2, and those for = 13 TeV are shown in Table 3.
A number of generalizations can be made from this information. As expected, restricting the -boson transverse momentum, , to be <15 GeV results in the smallest PDF uncertainties, as does restricting the range to a narrow band ( (GeV) ) about the Jacobian peak. The PDF uncertainty (and the asymmetry for the uncertainty) tends to grow as the cut increases. The PDF uncertainties are similar for and production.
A previous analysis Bozzi et al. (2015), using the techniques outlined here, estimated the PDF uncertainty for the mass using a selection of PDF sets including CT10 NNLO. The analysis framework was based on the POWHEG MC interfaced with PYTHIA PS Sjöstrand et al. (2015). This analysis obtained a global uncertainty that ranged between and MeV, depending on the final state, collider energy and the PDF set. For CT10 NNLO, Ref. Bozzi et al. (2015) reported that at = 13 TeV and with GeV and (GeV) , the errors are MeV and MeV for and respectively. The results in this paper for a similar lepton transverse momentum range (30 <P (GeV) <50) are MeV and MeV respectively. At = 8 TeV, Ref. Bozzi et al. (2015) reported errors of MeV for and MeV for , similar to what we have observed.
V Summary
The data samples for W-boson production at the LHC are large, for all center-of-mass energies. However, one of the limiting factors for determination of is not statistics, but rather our imprecise knowledge of PDFs. In this study, we investigated this dominant source of uncertainty.
To improve the PDF uncertainty on the determination, a better knowledge of the relevant PDFs is needed. Such improvement may be possible as new generations of PDFs (such as CT18) include more LHC data, such as precision measurements of the and boson cross sections.
Acknowledgment
We would like to than M. Boonekamp and A. Vicini for useful discussions, and for C.P. Yuan for suggesting the project. This work was partly supported by Fermi Research Alliance, LLC, under Contract No. DE–AC02–07CH11359 with the U.S. Department of Energy, Office of Science, Office of High Energy Physics.
The reference list from the paper itself. Each links out to its DOI / PubMed record.
- 1Baak et al. (2012) M. Baak, M. Goebel, J. Haller, A. Hoecker, D. Kennedy, R. Kogler, K. Moenig, M. Schott, and J. Stelzer, Eur. Phys. J. C 72 , 2205 (2012), eprint 1209.2716.
- 2Heinemeyer et al. (2006) S. Heinemeyer, W. Hollik, D. Stockinger, A. M. Weber, and G. Weiglein, JHEP 08 , 052 (2006), eprint hep-ph/0604147.
- 3Aaltonen et al. (2014) T. A. Aaltonen et al. (CDF), Phys. Rev. D 89 , 072003 (2014), eprint 1311.0894.
- 4Abazov et al. (2014) V. M. Abazov et al. (D 0), Phys. Rev. D 89 , 012005 (2014), eprint 1310.8628.
- 5Aaltonen et al. (2013) T. A. Aaltonen et al. (CDF, D 0), Phys. Rev. D 88 , 052018 (2013), eprint 1307.7627.
- 6Aaboud et al. (2018) M. Aaboud et al. (ATLAS), Eur. Phys. J. C 78 , 110 (2018), [Erratum: Eur. Phys. J.C 78,no.11,898(2018)], eprint 1701.07240.
- 7Aad et al. (2015) G. Aad et al. (ATLAS, CMS), Phys. Rev. Lett. 114 , 191803 (2015), eprint 1503.07589.
- 8ATLAS et al. (2014) ATLAS, CDF, CMS, and D 0 (ATLAS, CDF, CMS, D 0) (2014), eprint 1403.4427.