Noise spectra in the reversible-irreversible transition in amorphous solids under oscillatory driving
Ido Regev, C. Reichhardt, and C.J.O. Reichhardt

TL;DR
This paper investigates stress fluctuation spectra in amorphous solids under cyclic shear, revealing a broad 1/f-like noise spectrum above a critical amplitude and linking noise peaks to yielding, indicating a non-equilibrium phase transition.
Contribution
It provides the first detailed analysis of noise spectra across the reversible-irreversible transition in amorphous solids under oscillatory driving.
Findings
Stress fluctuations exhibit a broad 1/f^{b1}a0spectra in the irreversible regime.
Low frequency noise peaks near the yielding stress.
The results suggest a non-equilibrium phase transition at the critical amplitude.
Abstract
We study the stress fluctuations in simulations of a two-dimensional amorphous solid under a cyclic drive. It is known that this system organizes into a reversible state for small driving amplitudes and remains in an irreversible state for high driving amplitudes, and that a critical driving amplitude separates the two regimes. Here we study the time series of the stress fluctuations below and above the reversible-irreversible transition. In the irreversible regime above the transition, the power spectrum of the stress fluctuations is broad and has a shape with . We find that the low frequency noise power peaks near the stress at which dc yielding occurs, which is consistent with the behavior expected in systems undergoing a non-equilibrium phase transition.
Click any figure to enlarge with its caption.
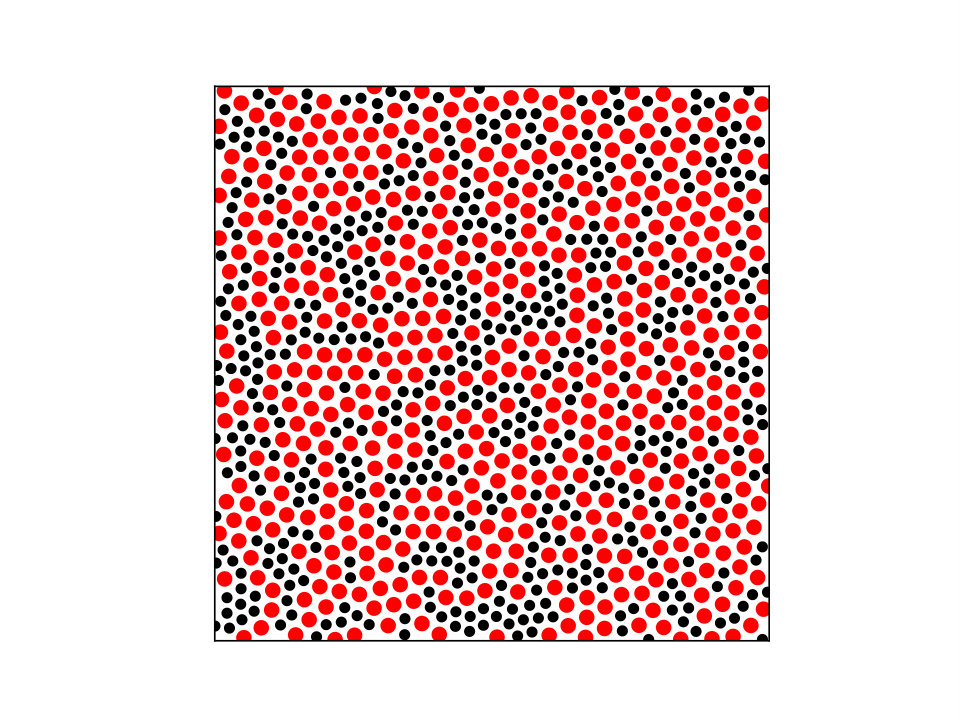 Figure 1
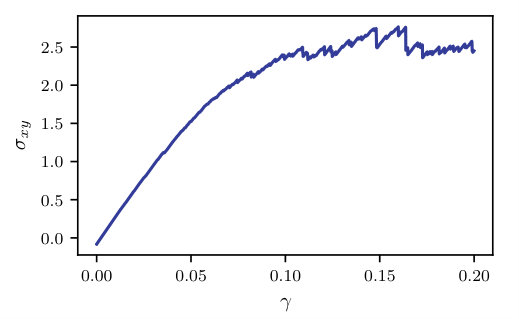 Figure 2
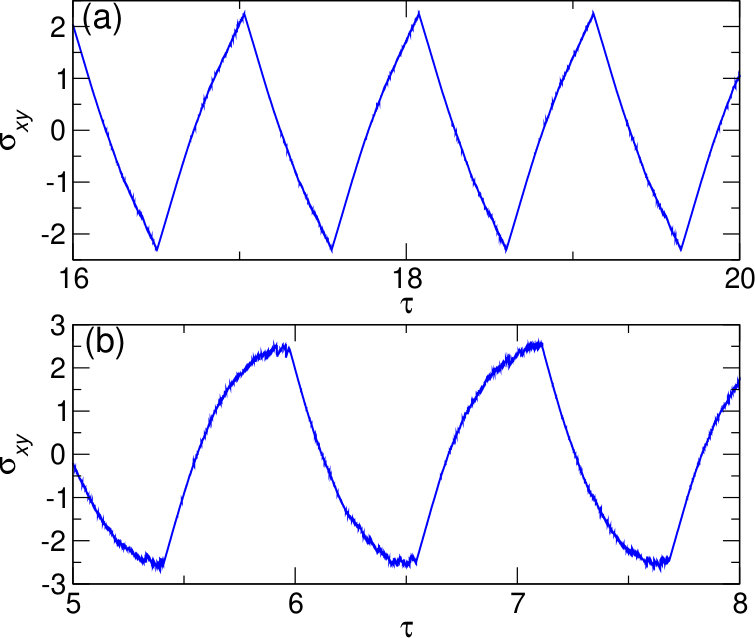 Figure 3
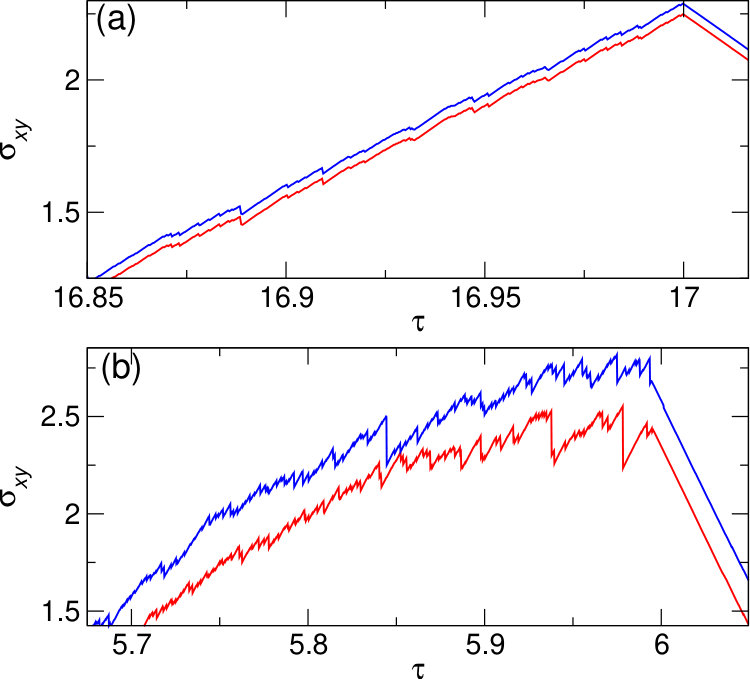 Figure 4
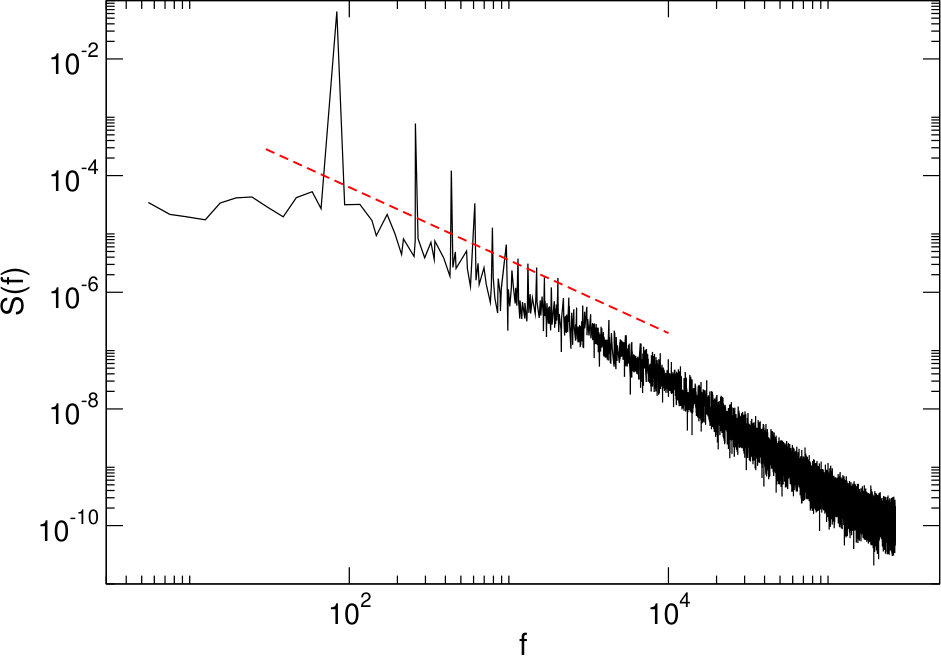 Figure 5
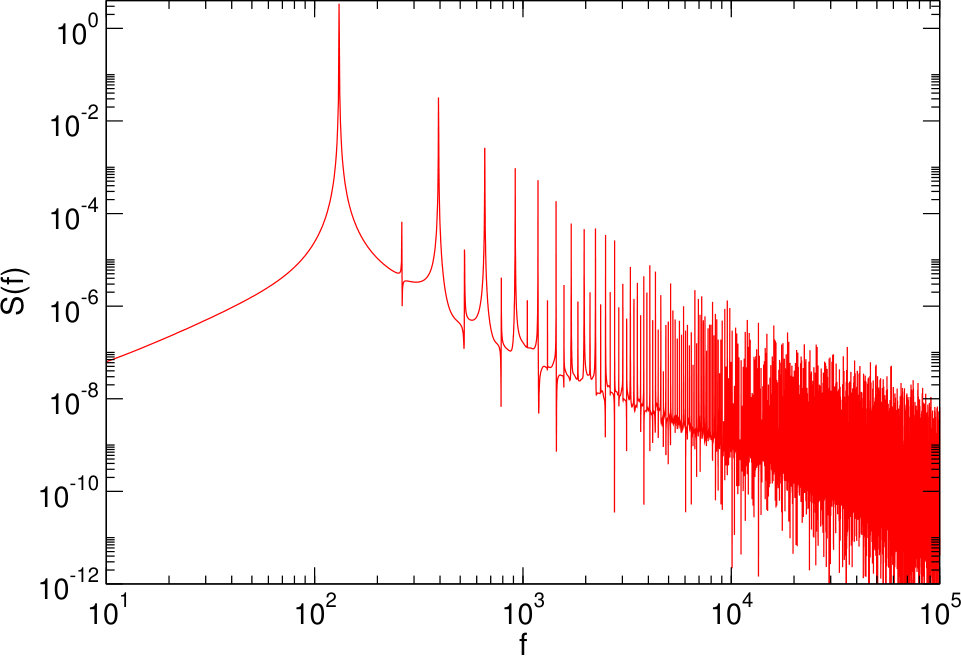 Figure 6
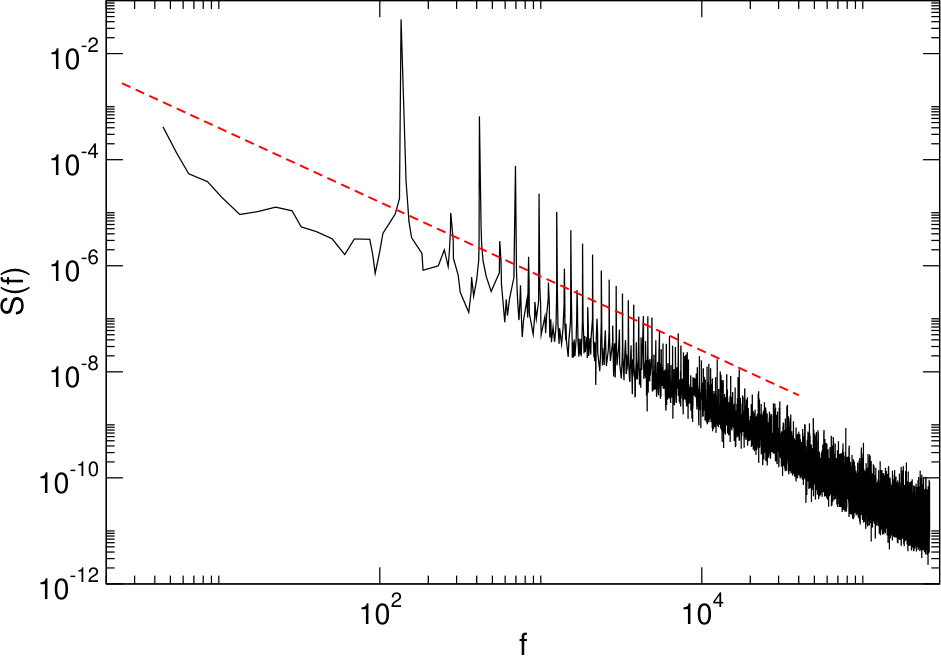 Figure 7
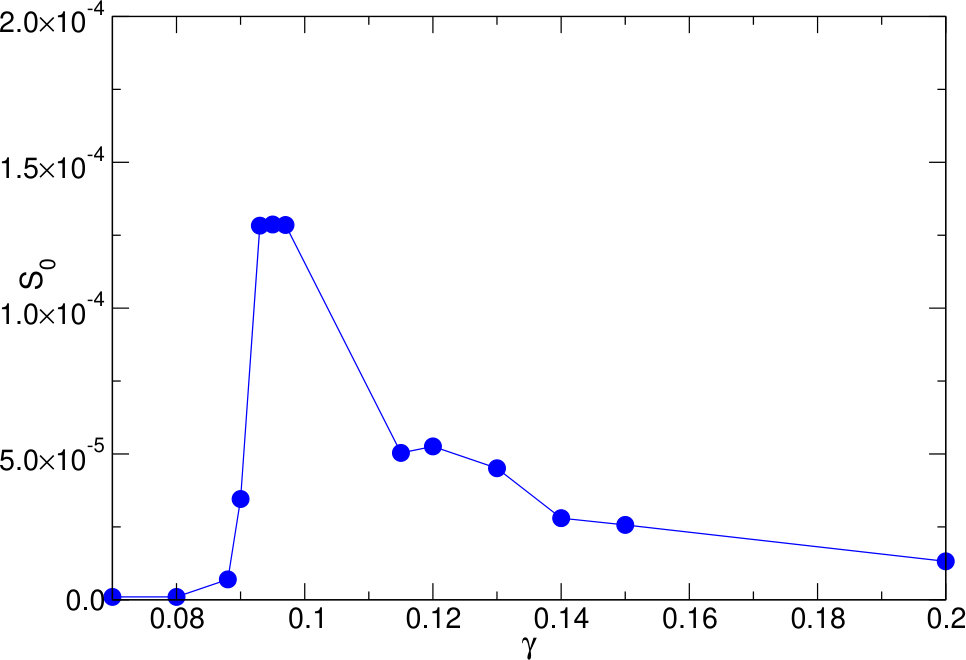 Figure 8
Peer Reviews
No public reviews on file for this paper yet. If you reviewed it on a platform where reviews are public (OpenReview, ICLR, NeurIPS, ICML), you can paste yours below so the community can read it here.
Videos
No videos yet. Explain this paper in a talk, walkthrough, or lecture? Add one.
Noise spectra
in the reversible-irreversible transition in amorphous solids under oscillatory driving
Ido Regev1, C Reichhardt2 and C J O Reichhardt3
1Jacob Blaustein Institutes for Desert Research, Ben-Gurion University of the Negev, Sede Boqer Campus 84990, Israel
2Theoretical Division and Center for Nonlinear Studies, Los Alamos National Laboratory, Los Alamos, New Mexico 87545, United States of America
Abstract
We study the stress fluctuations in simulations of a two-dimensional amorphous solid under a cyclic drive. It is known that this system organizes into a reversible state for small driving amplitudes and remains in an irreversible state for high driving amplitudes, and that a critical driving amplitude separates the two regimes. Here we study the time series of the stress fluctuations below and above the reversible-irreversible transition. In the irreversible regime above the transition, the power spectrum of the stress fluctuations is broad and has a shape with . We find that the low frequency noise power peaks near the stress at which dc yielding occurs, which is consistent with the behavior expected in systems undergoing a non-equilibrium phase transition.
Keywords: reversible-irreversible transition, amorphous solids, noise spectra
1 Introduction
A transition from a non-fluctuating to a fluctuating nonequilibrium state as a function of external driving appears in many systems, including those that undergo depinning transitions [1], collective transport [2] jamming [3], and static to active regime changes [4, 5]. Critical features often appear at these transitions, such as scaling behavior of the velocity-force curves, correlation functions, and structural measures [4, 5]. Similar effects appear near the yielding transition under oscillatory shear, where the system settles into a periodic state after some transient rearrangements for driving amplitudes below yielding, but can undergo continuous plastic rearrangements with large fluctuations for driving amplitudes above yielding [6, 7]. It is often difficult to define the exact point at which yielding occurs using only the stress-strain curve; however, a new method was recently proposed to identify the yielding transition based on the reversible behavior of the system under a cyclic, rather than dc, drive [8]. This approach was inspired by work in dilute colloidal systems under periodic shear [9], in which colloid-colloid collisions die away at low shear and the system organizes to a completely reversible state after a number of shear cycles that diverges at a critical maximal shearing amplitude [10]. Above the critical shearing amplitude, the system remains in an irreversible state. In a similar study on a jammed amorphous system, at small ac shear amplitudes the sample initially behaves irreversibly from one cycle to the next, but after a transient period it settles into a reversible state in which all particles return to the same positions at the end of each shear cycle. As the shear amplitude increases, the number of cycles needed to converge to a reversible state diverges near a critical drive amplitude [8, 11, 13]. Above the transition, the system remains in an irreversible state, while the critical maximal amplitude of the cyclic driving at the onset of irreversibility is close to the expected yielding point of the stress-strain curve under a dc drive [8, 12].
Time series analysis methods, such as the power spectrum of noise fluctuations, can be used to identify and characterize changes in the dynamics of driven many-body systems. Such methods have been applied to sliding charge density waves [26], driven superconducting vortices [27, 28], and Barkhausen noise in magnetic systems [29]. The use of these techniques for fluctuations in systems that exhibit yielding transitions is problematic since there are typically no fluctuations below the yielding transition. Subjecting the system to a cyclic drive induces fluctuations even in the reversible state below yielding, making a power spectrum analysis possible. Here we show that the spectra contain useful information about the dynamics of the ac driven yielding system both above and below the yield transition.
2 Simulation and system
We consider a two-dimensional amorphous system containing a bidisperse assembly of pairwise interacting particles. One particle species has a radius 1.4 times larger than that of the other species, so the system forms a disordered state. We fix the density of the particles at , which is higher than the jamming density. The initial state is obtained by quenching the system from a high temperature down to in order to obtain an amorphous configuration. The particles move according to overdamped dynamics as described in detail in [30] and [8]. We apply a periodic athermal quasi-static shear with maximal strain amplitude in each realization. In figure 1 we show a snapshot of an initialized system with a disordered structure. For more details of the simulations, see [8].
3 Results and discussion
In figure 2 we plot a typical dc stress () versus strain () curve. At low strains, increases with increasing strain until it begins to saturate and starts to exhibit significant fluctuations at . If we keep increasing the strain, the stress continues to fluctuate forever in a chaotic non-repetitive manner. If, however, we apply a cyclic or ac drive with a maximal strain amplitude , we observe two different types of behavior. When is smaller than the dc yielding transition, the system organizes into a reversible state in which the stress fluctuations are still noisy but repeat exactly after each shearing cycle. When is larger than the dc yielding transition, we obtain chaotic, non-repetitive dynamics.
In figure 3(a) we show a time series of in the reversible regime at , where we find a smooth oscillatory curve with the same noise pattern appearing in each drive cycle, as illustrated in figure 4(a). In figure 3(b) at , in the irreversible regime, there are larger fluctuations near the maxima and minima in , and the noise fluctuations are different from one cycle to the next, as shown in figure 4(b).
We next examine the power spectrum of the time series,
[TABLE]
where the frequency . In figure 5 we plot the power spectrum versus of the time series taken from 100 ac drive cycles for the system in figure 3(b) at a strain amplitude of . The large spike in is at the ac driving frequency, and the smaller spikes are the harmonics of this frequency. Between the spikes the curve is relativity smooth, indicating a lack of response at other specific frequencies due to the irreversible, non-periodic, nature of the dynamics. The dashed line indicates a fit to with . This resembles the noise frequently observed in strongly fluctuating driven disordered systems such as superconducting vortices or domain walls exhibiting Barkhausen noise, where [1]. We note that the behavior at high frequencies is better fit by ; however, the large scale avalanches and plastic rearrangements that occur in the system are associated with much slower time scales corresponding to the low frequency dynamics.
In figure 6(a) we plot for the same system at where the behavior is reversible. Here we find numerous spikes in the power spectrum in addition to those associated with the ac driving frequency. These additional spikes are produced by the repeatable avalanches or plastic events that each have their own characteristic frequency, so that the overall power spectrum is best described as a collection of specific frequencies rather than as noise. In general, as increases in the reversible regime, the number of additional power spectrum spikes increases since a larger number of distinct reversible events occur, and when the system reaches the irreversible regime, a true broad band background noise signature emerges.
In figure 7 we plot at , closer to the yielding threshold. Compared to the spectrum, here we find that the peaks produced by the ac drive are smaller since the particle arrangements become more random as the yielding transition is approached. At the same time, the low frequency power for is higher at , indicating the occurrence of large scale, and thus long time, rearrangements in the system. Previous work on the noise power of fluctuating quantities near a critical point indicates that the largest low frequency noise occurs close to the transition [31, 32]. The fluctuations are small and local both well below the critical point and well above it, but near the critical point the fluctuations become self-similar and extend across all sizes, giving a maximum in the low frequency noise power. The dashed line in figure 7 indicates a power law fit to with . The power law behavior extends over a larger range of frequencies than for the system in figure 5, and the power law exponent is somewhat larger than in the case.
In figure 8 we plot the noise power at the lowest frequencies versus . The noise power is largest near , close to the yielding point, and it drops off for higher . We note that for , is close to zero since all the fluctuations are lost and the system begins to behave elastically. A peak in the noise power is expected near a critical point, and in this same regime, the exponent of the power spectrum can contain information about the universality class [32]. A more careful analysis would be needed to find the exact critical point and exponents; however, our results clearly show that analyzing the power spectra can be a useful tool for understanding the reversible-irreversible transition in periodically driven amorphous systems.
4 Summary
We have examined the transition from reversible to irreversible dynamics in a periodically shared two dimensional amorphous system by measuring the power spectra of the time series of the stress versus strain. For maximal driving amplitudes , for which the system is reversible, the power spectrum shows a peak at the ac drive frequency along with a series of smaller peaks associated with reversible plastic events that repeat with typical frequencies. In the irreversible regime, the only peaks present are associated with the driving frequency, and the peaks appear on top of a background noise response, where . We find that the low frequency noise power is maximal near the dc yielding point, a behavior similar to that observed near other nonequilibrium transitions. Our results show that features of the power spectra can be useful in characterizing reversible-irreversible transitions in amorphous systems. Further directions for study include filtering out the driving frequency in order to focus exclusively on the periodic rearrangements as well as adding thermal noise or other fluctuations to examine the robustness of the peak in the noise power near the transition.
We gratefully acknowledge the support of the U.S. Department of Energy through the LANL/LDRD program for this work. This work was supported by the US DoE through Los Alamos National Laboratory. Los Alamos National Laboratory is operated by Triad National Security, LLC, for the NNSA of the U.S. DoE (Contract No. 892333218NCA000001). I.R. would like to thank the Israel Science Foundation (ISF) for its support through Grant No. 1301/17.
The reference list from the paper itself. Each links out to its DOI / PubMed record.
- 1[1] Reichhardt C and Reichhardt C J O 2017 Rep. Prog. Phys. 80 026501
- 2[2] Fisher D S 1998 Phys. Rep. 301 113
- 3[3] O’Hern C S, Silbert L E, Liu A J and Nagel S R 2003 Phys. Rev. E 68 011306
- 4[4] Takeuchi K A, Kuroda M, Chaté H and Sano M 2009 Phys. Rev. E 80 051116
- 5[5] Hinrichsen H 2000 Adv. Phys. 49 815
- 6[6] Maloney C M and Lemaitre A 2006 Phys. Rev. E 74 016118
- 7[7] Schall P, Weitz D A and Spaepen F 2007 Science 318 1895
- 8[8] Regev I, Lookman T and Reichhardt C 2013 Phys. Rev. E 88 062401