TL;DR
This paper addresses the challenge of skewed rating distributions in recommender systems by developing adaptive matrix completion methods that improve predictions for users and items with few ratings.
Contribution
The authors introduce four novel matrix completion approaches that adapt to rating frequency, enhancing prediction accuracy for sparse data in recommender systems.
Findings
Proposed methods outperform traditional approaches on sparse data.
Adaptive techniques improve accuracy for users and items with few ratings.
Skewed rating distribution impacts matrix completion effectiveness.
Abstract
Recommender systems are widely used to recommend the most appealing items to users. These recommendations can be generated by applying collaborative filtering methods. The low-rank matrix completion method is the state-of-the-art collaborative filtering method. In this work, we show that the skewed distribution of ratings in the user-item rating matrix of real-world datasets affects the accuracy of matrix-completion-based approaches. Also, we show that the number of ratings that an item or a user has positively correlates with the ability of low-rank matrix-completion-based approaches to predict the ratings for the item or the user accurately. Furthermore, we use these insights to develop four matrix completion-based approaches, i.e., Frequency Adaptive Rating Prediction (FARP), Truncated Matrix Factorization (TMF), Truncated Matrix Factorization with Dropout (TMF + Dropout) and Inverse…
Click any figure to enlarge with its caption.
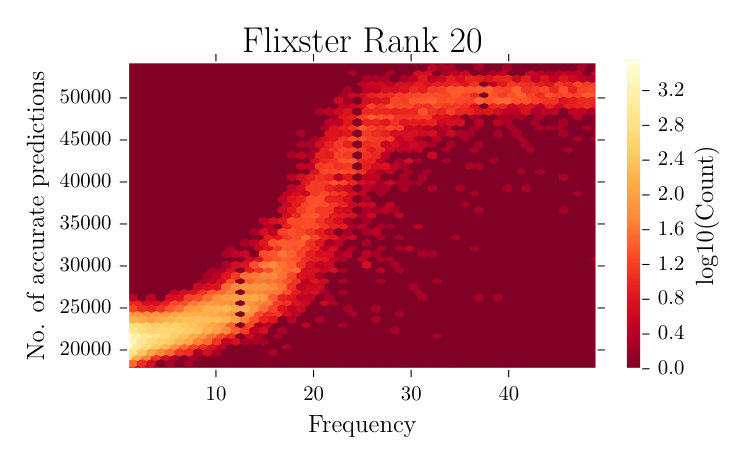 Figure 1
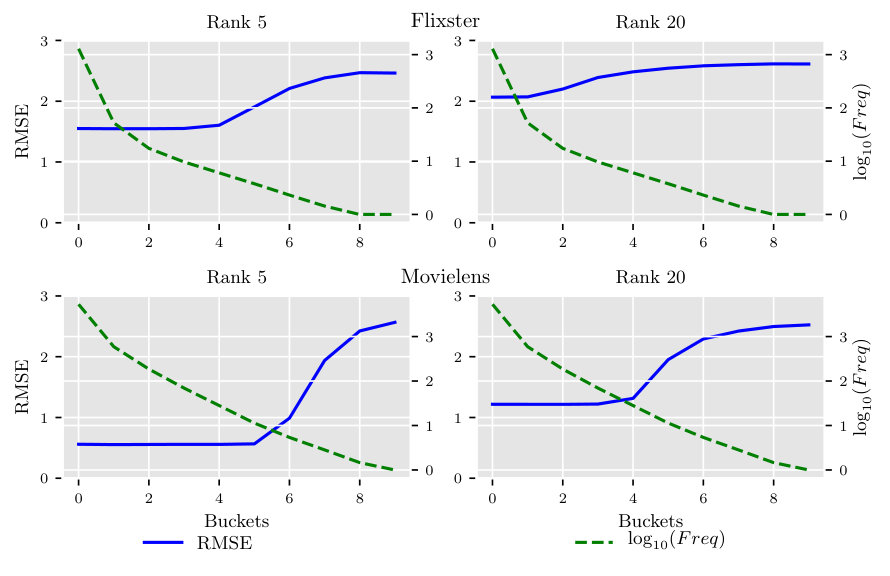 Figure 2
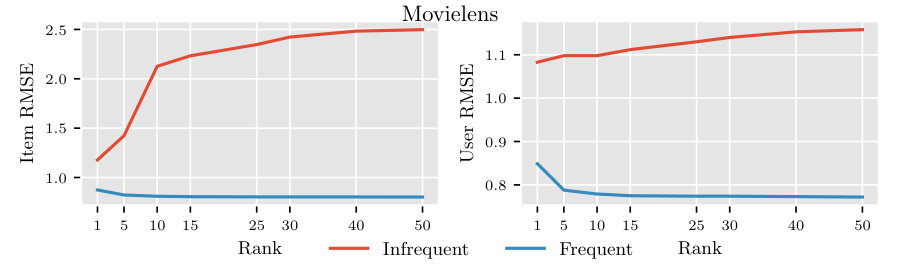 Figure 3
 Figure 4
| Dataset | users | items | ratings | %† | ||||
| Flixster (FX) | 147K | 48K | 8.1M | 55 | 226 | 168 | 934 | 1e-1 |
| Movielens (ML) | 229K | 26K | 21M | 92 | 190 | 786 | 3269 | 3e-1 |
| Yahoo Music (YM) | 143K | 136K | 9.9M | 69 | 199 | 73 | 141 | 5e-4 |
| Netflix (NF) | 354K | 17K | 9.5M | 27 | 59 | 535 | 1693 | 1e-3 |
| Flixster (FX) | Movielens (ML) | |||||||||||
| MF | LLORMA | IFWMF | FARP | TMF | TMF + Dropout | MF | LLORMA | IFWMF | FARP | TMF | TMF + Dropout | |
| No. of low-rank models | 1 | 20 | 1 | 8 | 1 | 1 | 1 | 8 | 1 | 8 | 1 | 1 |
| Rank | 15 | 50 | 15 | NA† | 10 | 15 | 100 | 25 | 100 | NA† | 100 | 25 |
| All test ratings | 0.864 | 0.871 | 0.867 | 0.863 | 0.851 | 0.847 | 0.806 | 0.806 | 0.804 | 0.797 | 0.804 | 0.804 |
| Item Q1 | 1.302 | 1.705 | 1.289 | 1.258 | 1.252 | 1.256 | 2.527 | 1.501 | 2.382 | 1.178 | 2.377 | 2.115 |
| Item Q2 | 0.961 | 1.099 | 0.961 | 0.962 | 0.944 | 0.944 | 1.619 | 0.974 | 1.449 | 0.937 | 1.499 | 1.123 |
| Item Q3 | 0.800 | 0.863 | 0.801 | 0.798 | 0.785 | 0.780 | 0.891 | 0.841 | 0.869 | 0.855 | 0.866 | 0.851 |
| Item Q4 | 0.864 | 0.865 | 0.867 | 0.863 | 0.851 | 0.847 | 0.799 | 0.805 | 0.799 | 0.795 | 0.798 | 0.801 |
| User Q1 | 1.292 | 1.388 | 1.261 | 1.246 | 1.247 | 1.260 | 1.174 | 1.092 | 1.120 | 1.083 | 1.115 | 1.078 |
| User Q2 | 1.177 | 1.255 | 1.156 | 1.143 | 1.144 | 1.151 | 0.975 | 0.964 | 0.965 | 0.965 | 0.964 | 0.968 |
| User Q3 | 0.974 | 1.002 | 0.969 | 0.967 | 0.964 | 0.964 | 0.853 | 0.856 | 0.852 | 0.853 | 0.852 | 0.863 |
| User Q4 | 0.853 | 0.852 | 0.857 | 0.853 | 0.841 | 0.836 | 0.767 | 0.774 | 0.769 | 0.761 | 0.769 | 0.769 |
| Item | User | |||||||
| Q1 | Q2 | Q3 | Q4 | Q1 | Q2 | Q3 | Q4 | |
| FX | 1 | 1 | 15 | 15 | 1 | 1 | 1 | 15 |
| ML | 1 | 5 | 10 | 100 | 1 | 15 | 30 | 100 |
| YM | 75 | 75 | 100 | 100 | 5 | 5 | 100 | 100 |
| NF | 50 | 50 | 50 | 75 | 50 | 50 | 50 | 75 |
| Item | User | |||||||
| Q1 () | Q2 () | Q3 () | Q4 () | Q1 () | Q2 () | Q3 () | Q4 () | |
| FX | 4.8 | 6.3 | 22.0 | 1.4 | 16.5 | 15.9 | 54.7 | 1.4 |
| ML | 2.7 | 9.5 | 92.5 | 3.7 | 111.2 | 194.8 | 533.5 | 2.9 |
| YM | 83.4 | 175.4 | 303.2 | 1.2 | NA† | 38.9 | 181.4 | 1.6 |
| NF | 13.6 | 40.1 | 136.0 | 1.5 | NA† | 32.0 | 209.8 | 1.4 |
Peer Reviews
No public reviews on file for this paper yet. If you reviewed it on a platform where reviews are public (OpenReview, ICLR, NeurIPS, ICML), you can paste yours below so the community can read it here.
Code & Models
Videos
No videos yet. Explain this paper in a talk, walkthrough, or lecture? Add one.
Taxonomy
MethodsDropout
Adaptive Matrix Completion for the Users and the Items in Tail
Mohit Sharma
University of MinnesotaTwin CitiesMNUSA
and
George Karypis
University of MinnesotaTwin CitiesMNUSA
(2019)
Abstract.
Recommender systems are widely used to recommend the most appealing items to users. These recommendations can be generated by applying collaborative filtering methods. The low-rank matrix completion method is the state-of-the-art collaborative filtering method. In this work, we show that the skewed distribution of ratings in the user-item rating matrix of real-world datasets affects the accuracy of matrix-completion-based approaches. Also, we show that the number of ratings that an item or a user has positively correlates with the ability of low-rank matrix-completion-based approaches to predict the ratings for the item or the user accurately. Furthermore, we use these insights to develop four matrix completion-based approaches, i.e., Frequency Adaptive Rating Prediction (FARP), Truncated Matrix Factorization (TMF), Truncated Matrix Factorization with Dropout (TMF + Dropout) and Inverse Frequency Weighted Matrix Factorization (IFWMF), that outperforms traditional matrix-completion-based approaches for the users and the items with few ratings in the user-item rating matrix.
Recommender systems; Collaborative filtering; Matrix completion; Matrix factorization
This work was supported in part by NSF (1447788, 1704074, 1757916, 1834251), Army Research Office (W911NF1810344), Intel Corp, and the Digital Technology Center at the University of Minnesota. Access to research and computing facilities was provided by the Digital Technology Center and the Minnesota Supercomputing Institute.
††journalyear: 2019††copyright: iw3c2w3††conference: Proceedings of the 2019 World Wide Web Conference; May 13–17, 2019; San Francisco, CA, USA††booktitle: Proceedings of the 2019 World Wide Web Conference (WWW ’19), May 13–17, 2019, San Francisco, CA, USA††doi: 10.1145/3308558.3313736††isbn: 978-1-4503-6674-8/19/05††ccs: Information systems Collaborative filtering††ccs: Information systems Personalization††ccs: Information systems Recommender systems
1. Introduction
Recommender systems are used in e-commerce, social networks, and web search to suggest the most relevant items to each user. Recommender systems commonly use methods based on Collaborative Filtering (Sarwar et al., 2001), which rely on historical preferences of users over items in order to generate recommendations. These methods predict the ratings for the items not rated by the user and then select the unrated items with the highest predicted ratings as recommendations to the user.
In practice, a user may not rate all the available items, and hence we observe only a subset of the user-item rating matrix. For the task of recommendations, we need to complete the matrix by predicting the missing ratings and select the unrated items with high predicted ratings as recommendations for a user. The matrix completion approach (Candès and Recht, 2009) assumes that the user-item rating matrix is low rank and estimates the missing ratings based on the observed ratings in the matrix. The state-of-the-art collaborative filtering methods, e.g., Matrix Factorization (MF) (Koren et al., 2009) are based on the matrix completion approach.
Assuming that the user-item rating matrix is low-rank, it was shown that in order to accurately recover the underlying low-rank model of a matrix of rank , at least entries in the matrix should be sampled uniformly at random (Candès and Tao, 2010). However, most real-world rating matrices exhibit a skewed distribution of ratings as some users have provided ratings to few items and certain items have received few ratings from the users. This skewed distribution may result in insufficient ratings for certain users and items, and can negatively affect the accuracy of the matrix completion-based methods.
This paper investigates how the skewed distribution of ratings in the user-item rating matrix affects the accuracy of the matrix completion-based methods and shows by extensive experiments on different low-rank synthetic datasets and as well as on real datasets that the matrix completion-based methods tend to have poor accuracy for the items and the users with few ratings. Moreover, this work illustrates that as we increase the number of latent dimensions, the prediction performance for the items and the users with sufficiently many ratings continues to improve, whereas the accuracy of the items and the users with few ratings degrades. This suggests that because of over-fitting, the matrix completion-based methods for large number of latent dimensions do not generalize well for the items and the users with few ratings.
Building on this finding, we develop four matrix completion-based approaches that explicitly consider the number of ratings received by an item or provided by a user to estimate the rating of the user on the item. Specifically, we introduce (i) Frequency Adaptive Rating Prediction (FARP) method, which uses multiple low-rank models for different frequency of the users and the items; (ii) Truncated Matrix Factorization (TMF) method, which estimates a single low-rank model that adapts with the number of ratings a user and an item has; (iii) Truncated Matrix Factorization with Dropout (TMF + Dropout) method, which is similar to TMF but probabilistically select the ranks for the users and the items; and (iv) Inverse Frequency Weighted Matrix Factorization (IFWMF) method, which weighs the infrequent users and items higher during low-rank model estimation. Extensive experiments on various datasets demonstrate the effectiveness of the proposed approaches over traditional MF-based methods by improving the accuracy for the items (up to 53% improvement in RMSE) and the users (up to 8% improvement in RMSE) with few ratings.
2. Related Work
The current state-of-the-art methods for rating prediction are based on matrix completion, and most of them involve factorizing the user-item rating matrix (Koren et al., 2009; Koren, 2008; Hu et al., 2008). In this work, our focus is on analyzing the performance of the matrix completion-based MF approach and use the derived insights to develop an approach that performs better for the users and the items with few ratings in the user-item rating matrix. These approaches estimate user-item rating matrix as a product of two low-rank matrices known as the user and the item latent factors. If for a user , the vector denotes the dimensional user’s latent factor and similarly for the item , the vector represents the dimensional item’s latent factor, then the predicted rating () for user on item is given by
[TABLE]
The user and the item latent factors are estimated by minimizing a regularized square loss between the actual and predicted ratings
[TABLE]
where is the user-item rating matrix, is the observed rating of user on item , and parameter controls the Frobenius norm regularization of the latent factors to prevent overfitting.
In another related work (Xin et al., 2017), it was shown that the lack of uniform distribution of ratings in the observed data could lead to folding, i.e., the unintentional affinity of dissimilar users and items in the low-rank space estimated by matrix completion-based methods. For example, the absence of an explicit rating between a child viewer and a horror movie could lead to an estimation of the corresponding latent factors such that both the child viewer and the horror movie are close in the low-rank space leading to the erratic recommendation of horror movies to the child viewer. We believe that the non-uniform distribution of the ratings is the reason behind this phenomenon.
The non-uniform distribution of ratings can also be viewed as an instance of rating data missing not at random (MNAR) (Little and Rubin, 2014). The proposed solutions to MNAR model the missing data to improve the generated recommendations (Steck, 2010, 2013; Schnabel et al., 2016; Marlin and Zemel, 2009). However, in our work, we focus on the skewed distribution of ratings which often comes as a result of either new items or new users that are added to the system, or the items that are not popular to get many ratings. We use our analysis to develop a matrix completion-based approach to improve rating prediction for the users who have provided few ratings on items or for the items that have received few ratings from the users.
3. Impact of Skewed Distribution
As described in Section 1, the matrix completion-based methods can accurately recover the underlying low-rank model of a given low-rank matrix provided entries are observed uniformly at random from the matrix. However, the ratings in the user-item rating matrix in real-world datasets represent a skewed distribution of entries because some users have provided ratings to few items and certain items have received few ratings from the users.
In order to study how the skewed distribution of ratings in real datasets affects the ability of matrix completion to accurately complete the matrix (i.e., predict the missing entries) we performed a series of experiments using synthetically generated low-rank rating matrices. In order to generate a rating matrix of rank we followed the following protocol. We started by generating two matrices and whose values are uniformly distributed at random in . We then computed the singular value decomposition of these matrices to obtain and . We then let and and . Thus, the final matrix of rank is obtained as the product of two randomly generated rank matrices whose columns are orthogonal. The parameter was determined empirically in order to produce ratings in the range of .
We used the above approach to generate full rating matrices whose dimensions are those of the two real-world datasets, i.e., Flixster (FX) and Movielens (ML), shown in Table 1. For each of these matrices we select the entries that correspond to the actual user-item pairs that are present in the corresponding dataset and give it as input to the matrix completion algorithm. For each dataset we generated five different sets of matrices using different random seeds and we performed a series of experiments using synthetically generated low-rank matrices of rank 5 and 20. For each rank, we report the average of performance metrics in each set from the estimated low-rank models over all the synthetic matrices.
3.1. Results
3.1.1. Effect of item frequency in synthetic datasets
In order to investigate if the number of ratings an item has, i.e., item frequency, has any influence on the accuracy of the matrix completion-based methods for the item, we ordered all the items in decreasing order by their frequency in the rating matrix. Furthermore, we divided these ordered items into ten buckets and for a user computed the RMSE for items in each bucket based on the error between the predicted rating by the estimated low-rank model and the ground-truth rating. We repeated this for all the users and computed the average of the RMSE of the items in each bucket over all the users.
Figure 1 shows the RMSEs across the buckets along with the average frequency of the items in the buckets. As can be seen in the figure, the predicted ratings for the frequent items tend to have lower RMSE in contrast to infrequent items for all the datasets.
Figure 2 shows the scatter map of items in FX having different frequency against the number of instances where the absolute difference between the original and the predicted rating, i.e., Mean Absolute Error (MAE), is . As can be seen in the figure, the number of accurate predictions is significantly lower for items having fewer ratings () compared to that of the items having a large number of ratings (). The lower error of the frequent items is because they have sufficient ratings to estimate their latent factors accurately. Hence for the real datasets, items appearing at the top in ordering by frequency and having high predicted scores will form a reliable set of recommendations to a user.
3.1.2. Effect of frequency on accuracy in real datasets
In order to assess the finding that the infrequent items are not estimated accurately by the matrix completion method, we evaluated matrix completion on a random held-out subset of the real datasets. We followed the standard procedure of cross-validation and exhaustive grid search for hyperparameters for model selection. We computed RMSE over the infrequent items in the test split, i.e., the items that have few ratings in the training split. For the analysis, we ordered the items in increasing order by the number of ratings in training splits. Next, we divided these ordered items into quartiles and identified the items in the first and the last quartile as the infrequent and the frequent items, respectively.
Figures 3 show the RMSE for the items and the users in the test for the Movielens (ML) dataset. We can see that the RMSE of the frequent items (or users) is lower than that of the infrequent items (or users). Furthermore, we observed similar trends in the remaining datasets (results not shown here due to space constraints). These results suggest that the matrix completion method fails to estimate the preferences for the infrequent items (or users) accurately in the real datasets. Also, the RMSE of the infrequent items increases with the increase in the rank while that of frequent items decreases with the increase in the rank. Similarly, the RMSE of the infrequent users increases with the increase in the rank. The increase in RMSE with the increase in ranks suggests that infrequent items or infrequent users may not have sufficient ratings to estimate all the ranks accurately thereby leading to the error in predictions for such users or items. The finding that infrequent items or infrequent users have better accuracy for fewer ranks follows from the result that entries are required to recover the underlying low-rank model of a matrix of rank (Candès and Tao, 2010), and therefore for fewer entries (e.g., infrequent users or infrequent items) we may recover only fewer ranks of the underlying low-rank model accurately.
4. Methods
The analysis presented in the previous section showed that as the underlying rank of the low-rank model that describes the data increases, the error associated with estimating such a low-rank model from the skewed data increases for the infrequent users and the infrequent items. We use these observations to devise multiple approaches to improve the accuracy of the low-rank models for such users and items.
4.1. Frequency Adaptive Rating Prediction (FARP)
Since the error of the predictions from the estimated low-rank models increases for the infrequent users or items in skewed data, we propose to estimate lower dimensional latent factors for the infrequent users or items, and estimate higher dimensional latent factors for the frequent users or items. In this approach, we propose to learn multiple low-rank models with different ranks from all the available data and while predicting the rating of a user on an item we select the model that performed the best for the infrequent user or the item associated with the rating. Hence, the predicted rating of user on item is given by
[TABLE]
where and are the user and the item latent factors from the th low-rank model. For example, if then we select the th low-rank model for prediction such that it has the best performance for users having frequency , and similarly if then we select the model with the best performance for items with frequency .
The user and items can be assigned to different low rank models based on the number of ratings that exists for them in the dataset. One approach that we investigated is to order the users and the items by the number of ratings and divide them into equal quartiles and save the best performing model for each quartile.
4.2. Truncated Matrix Factorization (TMF)
An alternate approach we develop is to estimate only a subset of the ranks for these users or items. In this approach, the estimated rating for user on item is given by
[TABLE]
where denotes the latent factor of user , represents the latent factor of item , is a vector containing s in the beginning followed by [math]s, and represents the elementwise Hadamard product between the vectors. The vector is used to select the ranks that are active for the tuple. The s in denote the active ranks for the tuple.
4.2.1. Frequency adaptive truncation
One approach that we investigated for selecting the active ranks, i.e., , for a user-item rating is based on the frequency of the user and the item in the rating matrix. In this approach, for a given rating by a user on an item, first, we determine the number of ranks to be updated based on either the user or the item depending on the one having a lower number of ratings. In order to select the ranks, we normalize the frequency of the user and the item, and use a non-linear activation function, e.g., sigmoid function, to map this frequency of the user or the item in [0, 1]. Finally, we used this mapped value as the number of active ranks selected for the update of the user and the item latent factors. The number of active ranks to be selected is given by
[TABLE]
where is the dimension of the user and the item latent factors, , is the frequency of user , is the frequency of item , controls the steepness of the sigmoid function and is the value of the sigmoid’s midpoint. The use of such a function assists in identifying the users or the items that can not be estimated accurately using all the ranks and we can only estimate few ranks more accurately for such users or items. The active ranks for a user or an item can be chosen either from the beginning of all ranks or end of all ranks or can be chosen arbitrarily among all ranks until the same active ranks are used consistently for the user and the item. For ease of discussion and simplicity, we will assume that active ranks are chosen from the beginning of all ranks. Hence, the active ranks to be selected are given by
[TABLE]
We will refer to this method as Truncated Matrix Factorization (TMF).
4.2.2. Frequency adaptive probabilistic truncation
An alternative way to select the active ranks is to assume that the number of active ranks follows a Poisson distribution with parameter . This method is similar to Dropout (Srivastava et al., 2014) technique in neural networks, where parameters are selected probabilistically for updates during learning of the model. Similar to regularization it provides a way of preventing overfitting in learning of the model. The active ranks to be selected are given by
[TABLE]
where . We will call this method as Truncated Matrix Factorization with Dropout (TMF + Dropout). Similar to Equation 2, the parameters of the model, i.e., the user and the item latent factors can be estimated by minimizing a regularized square loss between the actual and the predicted ratings.
4.2.3. Rating prediction
After learning the model the predicted rating for user on item for TMF model is given by
[TABLE]
where the active ranks, i.e., , is given by Equation 6. The predicted rating for the user and the item under TMF + Dropout model is given by the least number of ranks for whom the cumulative distribution function (CDF) for Poisson distribution with parameter obtains approximately the value of
- The active ranks, i.e., , for prediction under TMF + Dropout are given by
[TABLE]
where is the least number of ranks for whom the CDF, i.e, and .
Unlike FARP, which requires us to estimate multiple models, TMF estimates a single model however it involves tuning of more hyperparameters in comparison to FARP.
4.3. Inverse Frequency Weighted Matrix Factorization (IFWMF)
In addition to the above approaches, we explored a weighted matrix factorization-based approach where we weigh the reconstruction error higher for the infrequent users and items. We propose to estimate the user and the item latent factors by minimizing a regularized weighted square error loss between the actual and the predicted ratings
[TABLE]
where the the weight is given by
[TABLE]
where is a constant, , and are the normalized frequency of user and item , respectively. Essentially, we weigh the error in predictions more for the infrequent users and the infrequent items. This resembles the weighted matrix factorization (Hu et al., 2008; Koenigstein and Koren, 2013) where the weight of the reconstruction error is proportional to the confidence on the observed rating of user on item however in our method we weigh the error inversely proportional to the frequency of ratings observed for user or item . This is similar to the inverse propensity model-based approach (Schnabel et al., 2016), where the propensity is proportional to the frequency of the user or the item. The up-weighting of the reconstruction error associated with the infrequent users or the infrequent items may lead to over-fitting as we only have few ratings for these users and items.
5. Experimental Evaluation
5.1. Comparison algorithms
We compared our proposed approaches111 Code for reference is available at github.com/mohit-shrma/matfac. against the the state-of-the-art Matrix Factorization (Koren, 2008) and LLORMA (Lee et al., 2013) method. LLORMA assumes that the different parts of the user-item rating matrix can be approximated by different low-rank models and the complete user-item rating matrix is approximated as a weighted sum of these individual low-rank models. We have used the LibRec (Guo et al., 2015) software package to compare the proposed methods against the LLORMA approach.
5.2. Model selection
We performed grid search to tune the dimensions of the latent factors, regularization hyper-parameters, constant (), and sigmoid function’s parameters, i.e., and . We searched for regularization weights () in the range [0.001, 0.01, 0.1, 1, 10], dimension of latent factors () in the range [1, 5, 10, 15, 25, 50, 75, 100], constant () in the range [1, 10, 50], steepness constant () in the range [1 5, 10, 20, 40], and mid-point () in the range [-0.75, -0.50, -0.25, 0, 0.25, 0.50, 0.75]. The final parameters were selected based on the performance on the validation split. For LLORMA, we varied the number of local models () in the range [1, 5, 8, 15, 25, 50].
For FARP, we ordered the users in ascending order by frequency and divided them into equal quartiles. For each quartile, we saved the best performing model, i.e., the model having the lowest RMSE for all the users in that quartile in the validation split. Similarly, we ordered the items in ascending order by frequency and divided them into equal quartiles. Similar to users, we saved the best performing model for each quartile of items. At the time of prediction of rating for a user on an item, we choose the the model associated with the quartile of the user if the user is having lower number of ratings than the item, and if the item is having lower number of ratings than the user than we choose the model associated with the quartile of the item .
5.3. Datasets
In addition to Flixster (FX) (Zafarani and Liu, 2009) and Movielens 20M (ML) (Harper and Konstan, 2016) datasets, we evaluated our proposed methods on subsets of the Yahoo Music (YM) (ymu, 2008; Schelter et al., 2013) and Netflix (NF) (Bennett et al., 2007) datasets that we created in order to have a skewed distribution. These datasets were generated as follow. First, for each user we randomly selected the number of ratings that we want to sample from the user’s ratings and randomly sampled these ratings for all users. Next, from the sampled ratings in previous step, for each item we randomly selected the number of ratings that an item has received from users in sampled ratings and randomly sampled these ratings for all the items. After following the above two steps, the sampled ratings from these datasets follows a skewed distribution and characteristics of all the datasets used in experiments are presented in Table 1.
5.4. Evaluation methodology
To evaluate the performance of the proposed methods we divided the available ratings in different datasets into training, validation and test splits by randomly selecting 20% of the ratings for each of the validation and the test splits. The validation split was used for model selection, and the model that was selected was used to predict ratings on the test split. We repeated this process three times and report the average RMSE across the runs.
In addition to computing RMSE obtained by different methods for the ratings in the test split, we also investigated the performance of the proposed approaches for the items and the users with a different number of ratings in the training split. To this end, we ordered the items and the users in increasing order by their number of ratings in training split and divided them equally into quartiles. We will report the RMSE achieved by different methods for ratings in the test split for the users and the items in these quartiles.
6. Results and Discussion
6.1. Performance for rating prediction on entire dataset
Table 2 shows the results achieved by the proposed methods on the various datasets. As can be seen in the table for the task of rating predictions for all the ratings in the test splits the proposed approaches perform better than the MF method for FX, ML, YM and NF datasets. Interestingly, the proposed approaches have performed even better than the state-of-the-art LLORMA method and this suggests that LLORMA can be further improved by estimating local low-rank models that considers the skewed distribution of ratings in datasets. We found the difference between the predictions of different methods to be statistically significant (-value 0.01 using two sample -test). The performance is significantly better for FX in comparison to that of other datasets. Additionally, on FX dataset, the MF method outperforms the LLORMA method and a possible reason for this is that because of the skewed distribution LLORMA is not able to estimate a model that is as accurate as a global MF model. Moreover, LLORMA needs a significantly large number of local low-rank models in comparison to the proposed approaches. Also, by comparing the number of latent dimensions used by the models shown in Table 2 we can see that, for ML, TMF + Dropout and LLORMA needs significantly fewer ranks, i.e., 25, in comparison to that of MF, i.e., 100, to achieve the same performance and we believe that this could be because of MF overfitting the ML dataset for higher dimension of latent factors.
6.2. Performance for the users and the items with different number of
ratings
Table 2 also shows the performance achieved by the different methods across the different quartiles of users and items. By comparing the performance of the different schemes we can see that the proposed methods significantly outperform the MF method and state-of-the-art LLORMA method for lower quartiles for majority of the datasets. This illustrates the effectiveness of the developed methods for the users and the items with few ratings. The better performance of the proposed methods for the users and the items with few ratings is because we can estimate accurately only a few ranks for them, and unlike MF and LLORMA the proposed approaches are effective in model estimation or predicting the ratings for these users and items.
Among the proposed approaches, the TMF-based approaches (TMF and TMF + Dropout), perform better in most of the quartiles in FX dataset. Surprisingly, FARP consistently performs better than the MF and LLORMA across most of the datasets, and this is promising as compared to TMF-based approaches FARP has fewer hyperparameters to tune. Specifically, in TMF-based approaches we have to tune regularization weights (), dimension of latent factors (), steepness constant () and mid-point (), while in FARP we have to tune only three parameters, i.e., number of low-rank models, regularization weights () and dimension of latent factors (). This might be of interest to practitioners because multiple low-rank models under FARP can be estimated in parallel using vanilla MF widely available in off-the-shelf packages, e.g., SPARK (Zaharia et al., 2016) and scikit-learn (Pedregosa et al., 2011).
While the IFWMF method performs better than MF in lower quartiles, the other proposed approaches, i.e., FARP and TMF-based methods, outperform IFWMF for most of the quartiles in all the dataset thereby illustrating the effectiveness of FARP and TMF-based methods in preventing over-fitting and generating better predictions.
7. Conclusion
In this work, we have investigated the performance of the matrix completion-based low-rank models for estimating the missing ratings in real datasets and its impact on the item recommendations. We showed in Section 3 that the matrix completion-based methods because of skewed distribution of ratings fail to predict the missing entries accurately in the matrices thereby leading to an error in predictions and thus affecting item recommendations. Based on these insights we presented different methods in Section 4, which considers the frequency of both the user and the item to estimate the low-rank model or for predicting the ratings. The experiments on real datasets show that the proposed approaches significantly outperforms the state-of-the-art Matrix Factorization method for rating predictions for the users and the items having few ratings in the user-item rating matrix.
The reference list from the paper itself. Each links out to its DOI / PubMed record.
- 1(1)
- 2ymu (2008) 2008. Yahoo! Music User Ratings of Songs with Artist, Album, and Genre Meta Information, v. 1.0. https://webscope.sandbox.yahoo.com/
- 3Bennett et al . (2007) James Bennett, Stan Lanning, et al . 2007. The netflix prize. In Proceedings of KDD cup and workshop , Vol. 2007. New York, NY, USA, 35.
- 4Candès and Recht (2009) Emmanuel J. Candès and Benjamin Recht. 2009. Exact Matrix Completion via Convex Optimization. Foundations of Computational Mathematics 9, 6 (2009), 717–772. https://doi.org/10.1007/s 10208-009-9045-5 · doi ↗
- 5Candès and Tao (2010) Emmanuel J. Candès and Terence Tao. 2010. The Power of Convex Relaxation: Near-optimal Matrix Completion. IEEE Trans. Inf. Theor. 56, 5 (May 2010), 2053–2080. https://doi.org/10.1109/TIT.2010.2044061 · doi ↗
- 6Guo et al . (2015) Guibing Guo, Jie Zhang, Zhu Sun, and Neil Yorke-Smith. 2015. Lib Rec: A Java Library for Recommender Systems.. In UMAP Workshops , Vol. 4.
- 7Harper and Konstan (2016) F Maxwell Harper and Joseph A Konstan. 2016. The movielens datasets: History and context. Acm transactions on interactive intelligent systems (tiis) 5, 4 (2016), 19.
- 8Hu et al . (2008) Yifan Hu, Yehuda Koren, and Chris Volinsky. 2008. Collaborative filtering for implicit feedback datasets. In 2008 Eighth IEEE International Conference on Data Mining . Ieee, 263–272.