Observations of CH$_3$OH and CH$_3$CHO in a Sample of Protostellar Outflow Sources
Jonathan Holdship, Serena Viti, Claudio Codella, Jonathan Rawlings,, Izaskun Jimenez-Serra, Yenabeb Ayalew, Justin Curtis, Annur Habib, Jamel, Lawrence, Sumaya Warsame, Sarah Horn

TL;DR
This study observes methanol and acetaldehyde in protostellar outflows, revealing their grain-surface formation and destruction in shocks, with implications for astrochemical processes.
Contribution
First detection and analysis of CH$_3$OH and CH$_3$CHO in multiple protostellar outflows using RADEX and LTE models.
Findings
Methanol and acetaldehyde are formed on grain surfaces.
Line profiles show destruction in faster outflows.
Column density ratios suggest grain-surface formation for both species.
Abstract
Iram 30-m Observations towards eight protostellar outflow sources were taken in the 96-\SI{176}{\giga\hertz} range. Transitions of CHOH and CHCHO were detected in seven of them. The integrated emission of the transitions of each species that fell into the observed frequency range were measured and fit using RADEX and LTE models. Column densities and gas properties inferred from this fitting are presented. The ratio of the A and E-type isomers of CHOH indicate that the methanol observed in these outflows was formed on the grain surface. Both species demonstrate a reduction of terminal velocity in their line profiles in faster outflows, indicating destruction in the post-shock gas phase. This destruction, and a near constant ratio of the CHOH and CHCHO column densities imply it is most likely that CHCHO also forms on the grain surface.
Click any figure to enlarge with its caption.
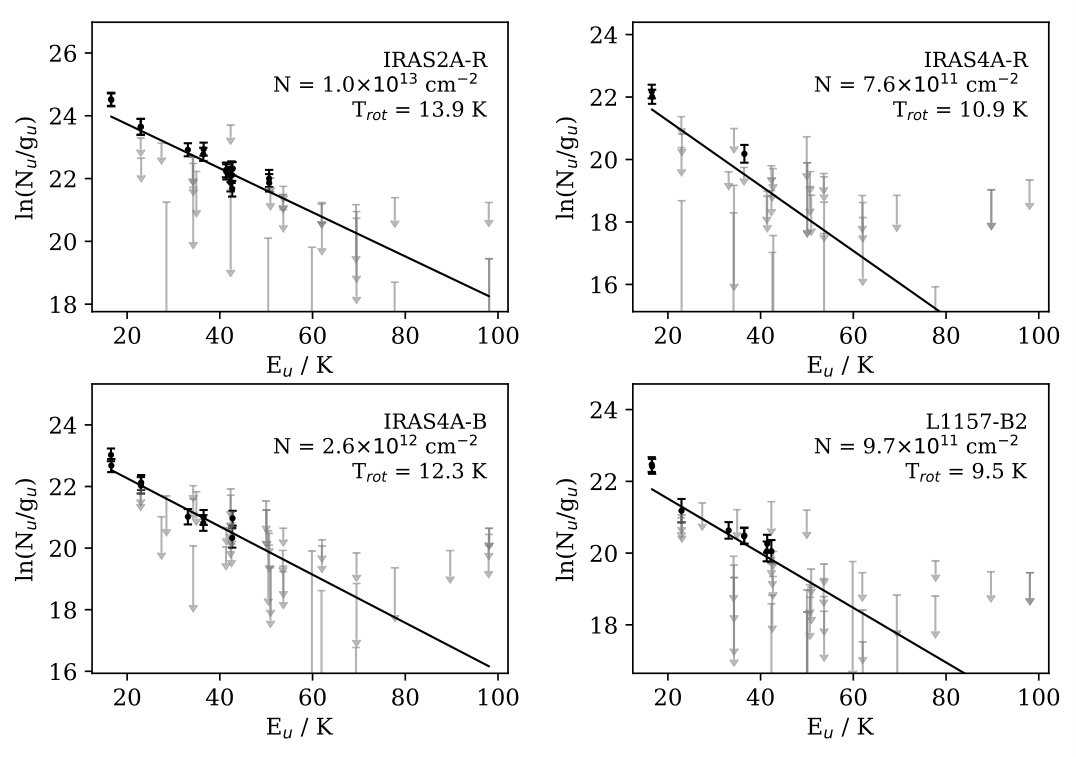 Figure 1
 Figure 2
 Figure 3
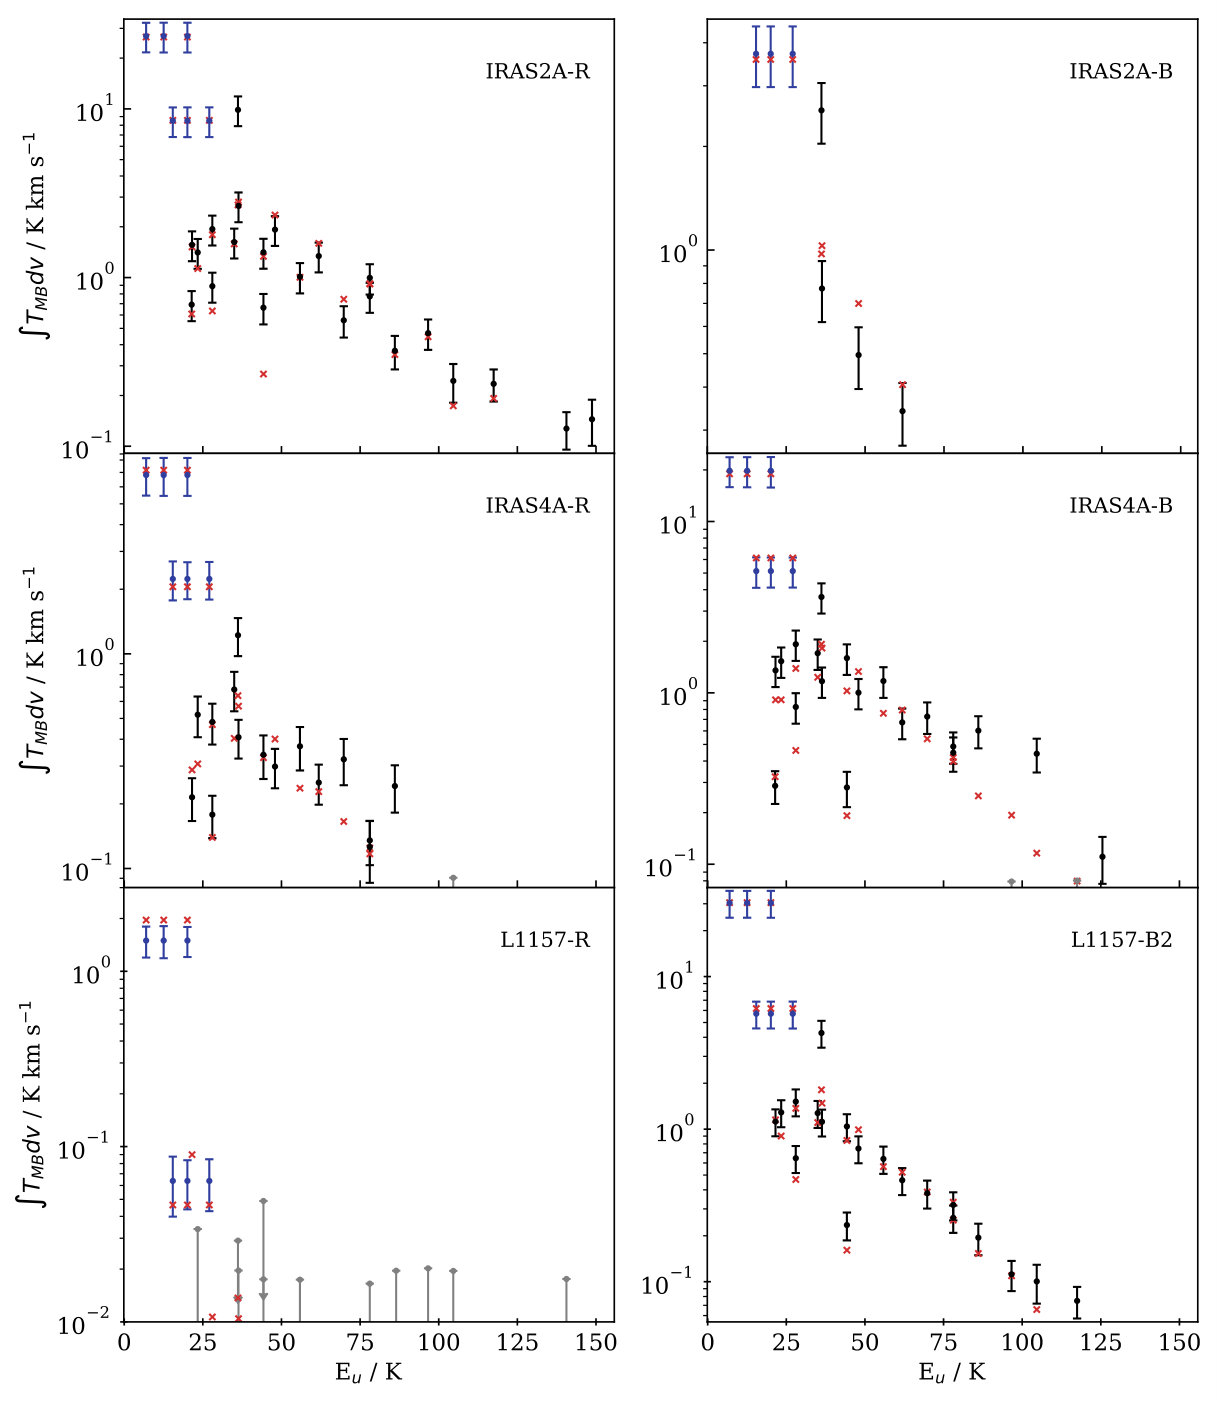 Figure 4
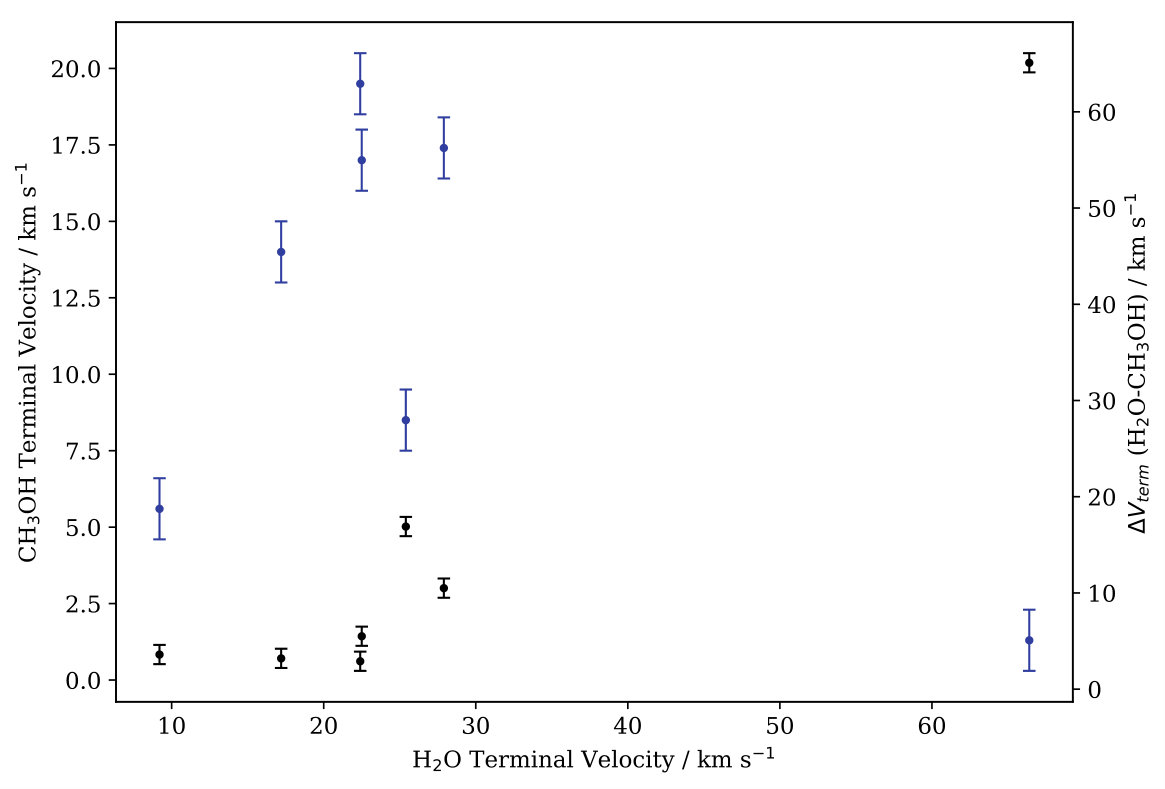 Figure 5
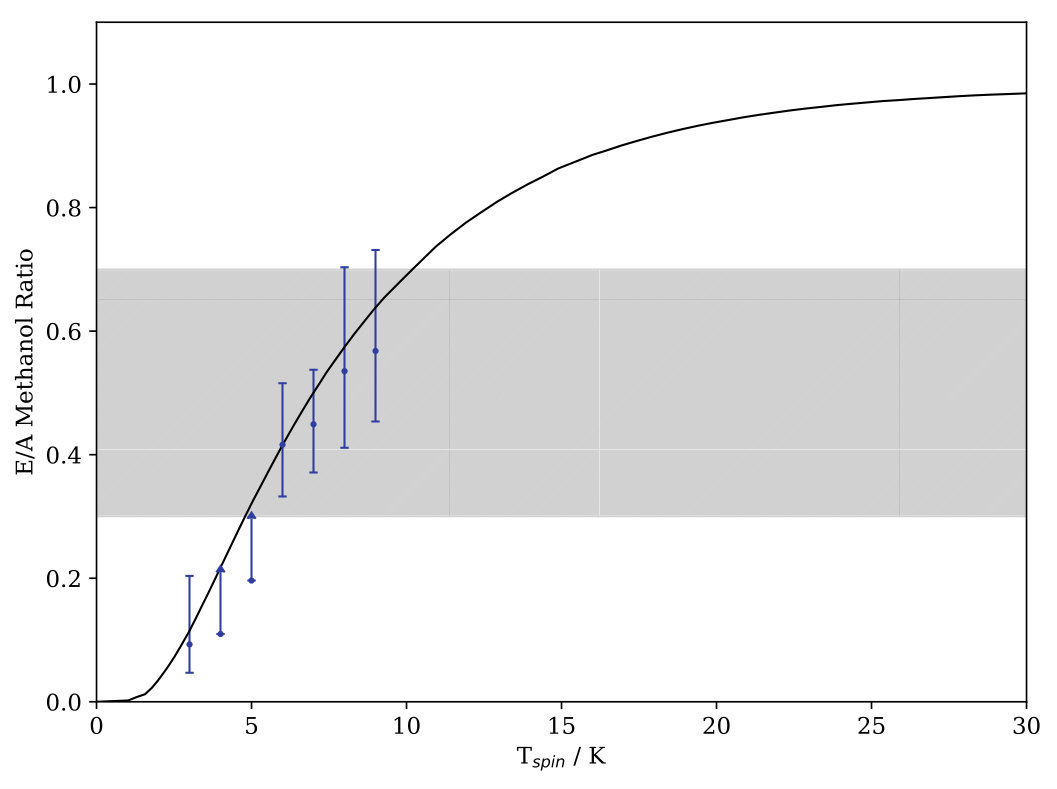 Figure 6
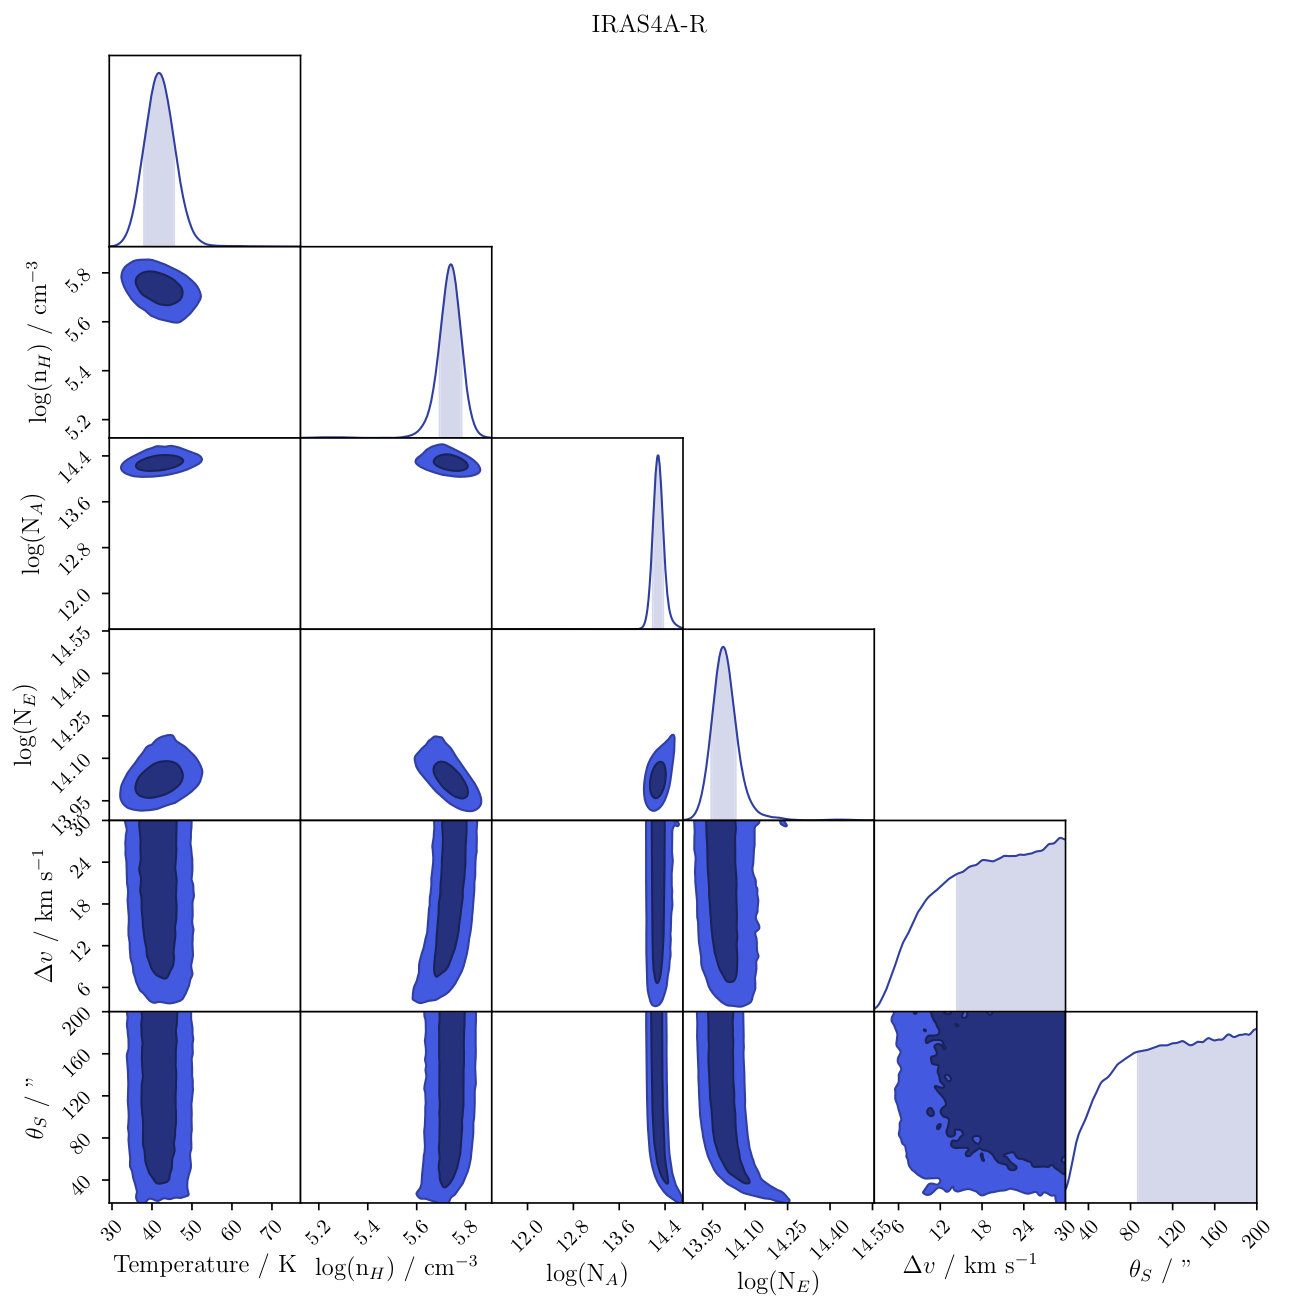 Figure 7
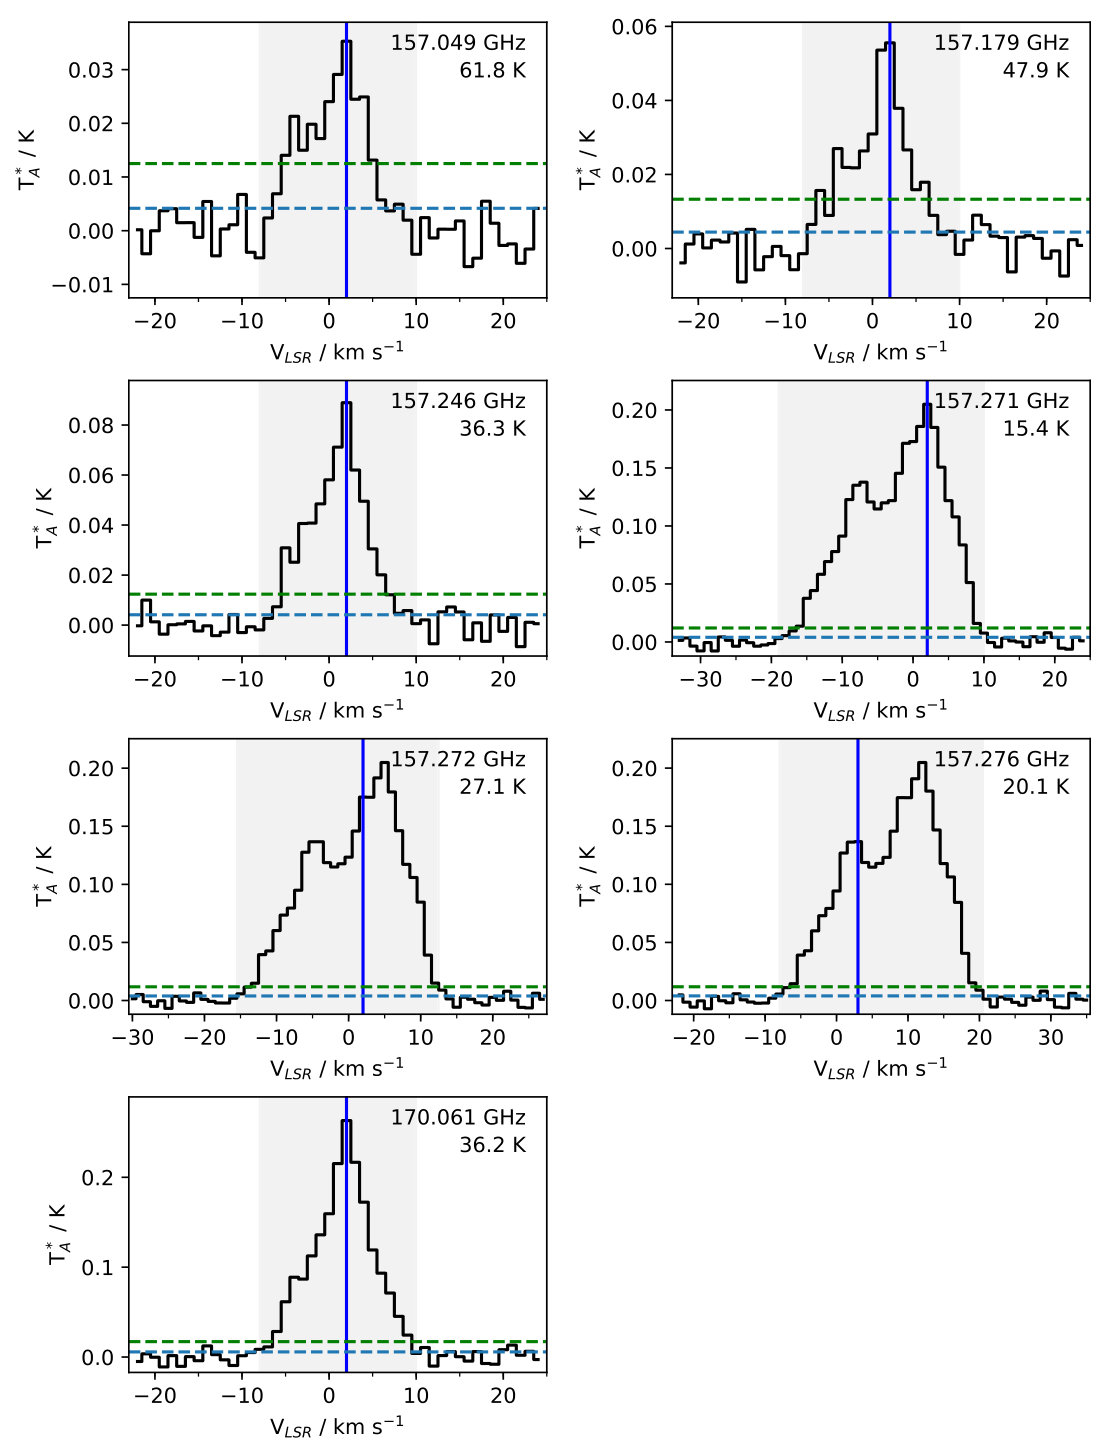 Figure 8
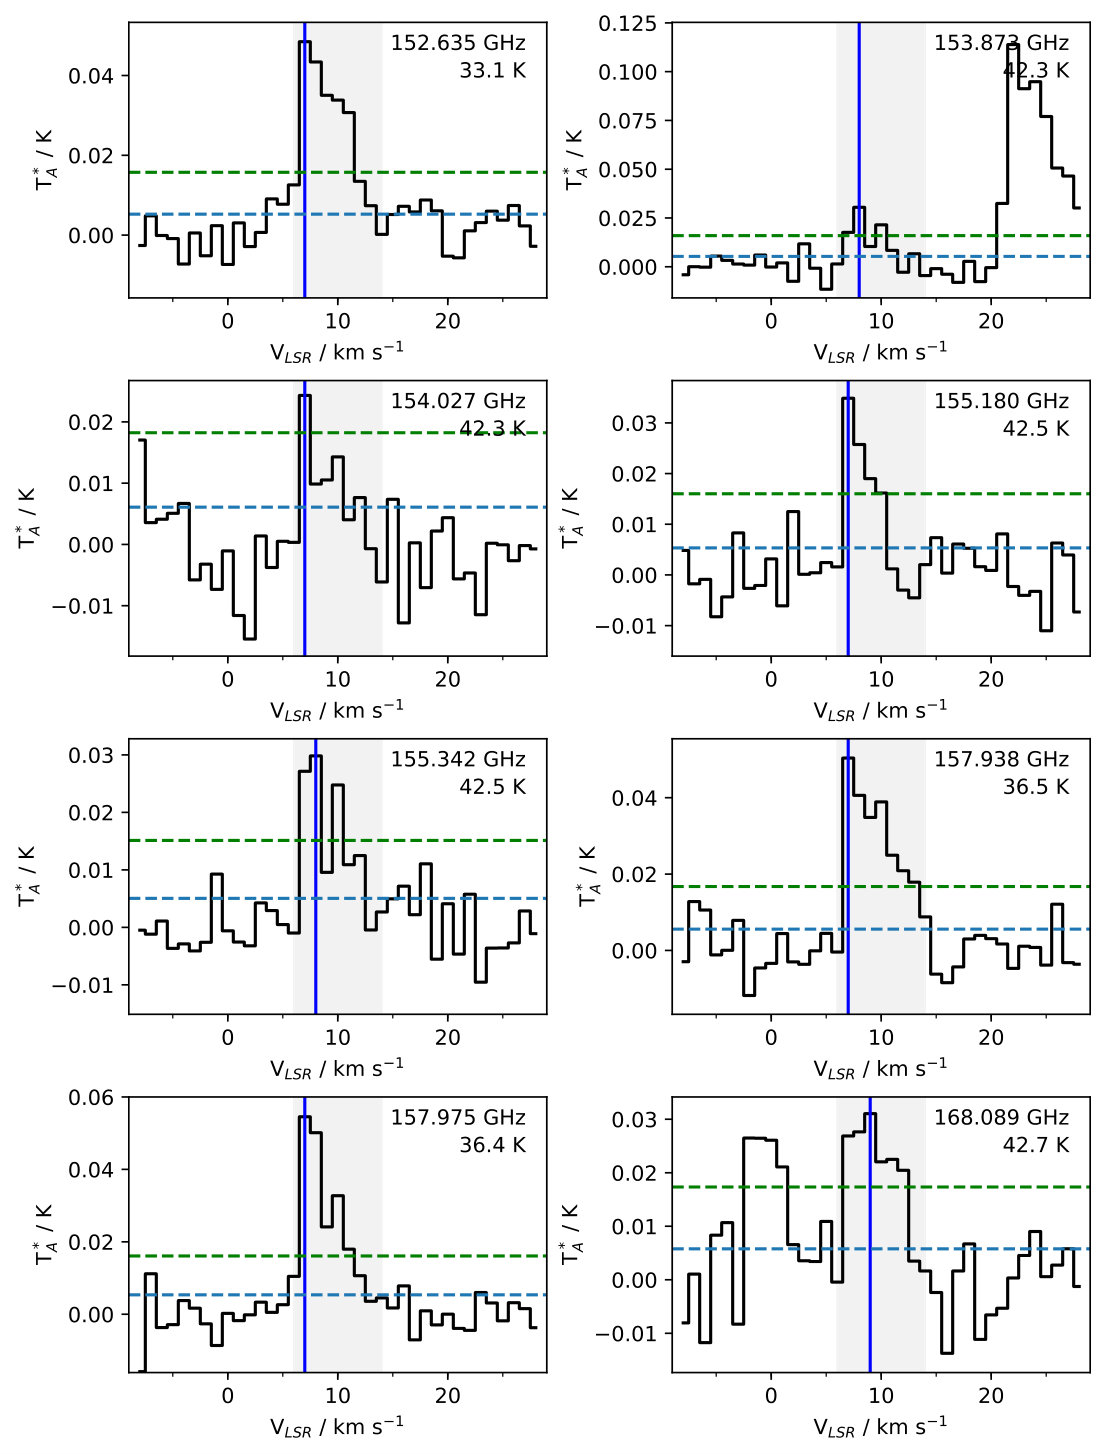 Figure 9
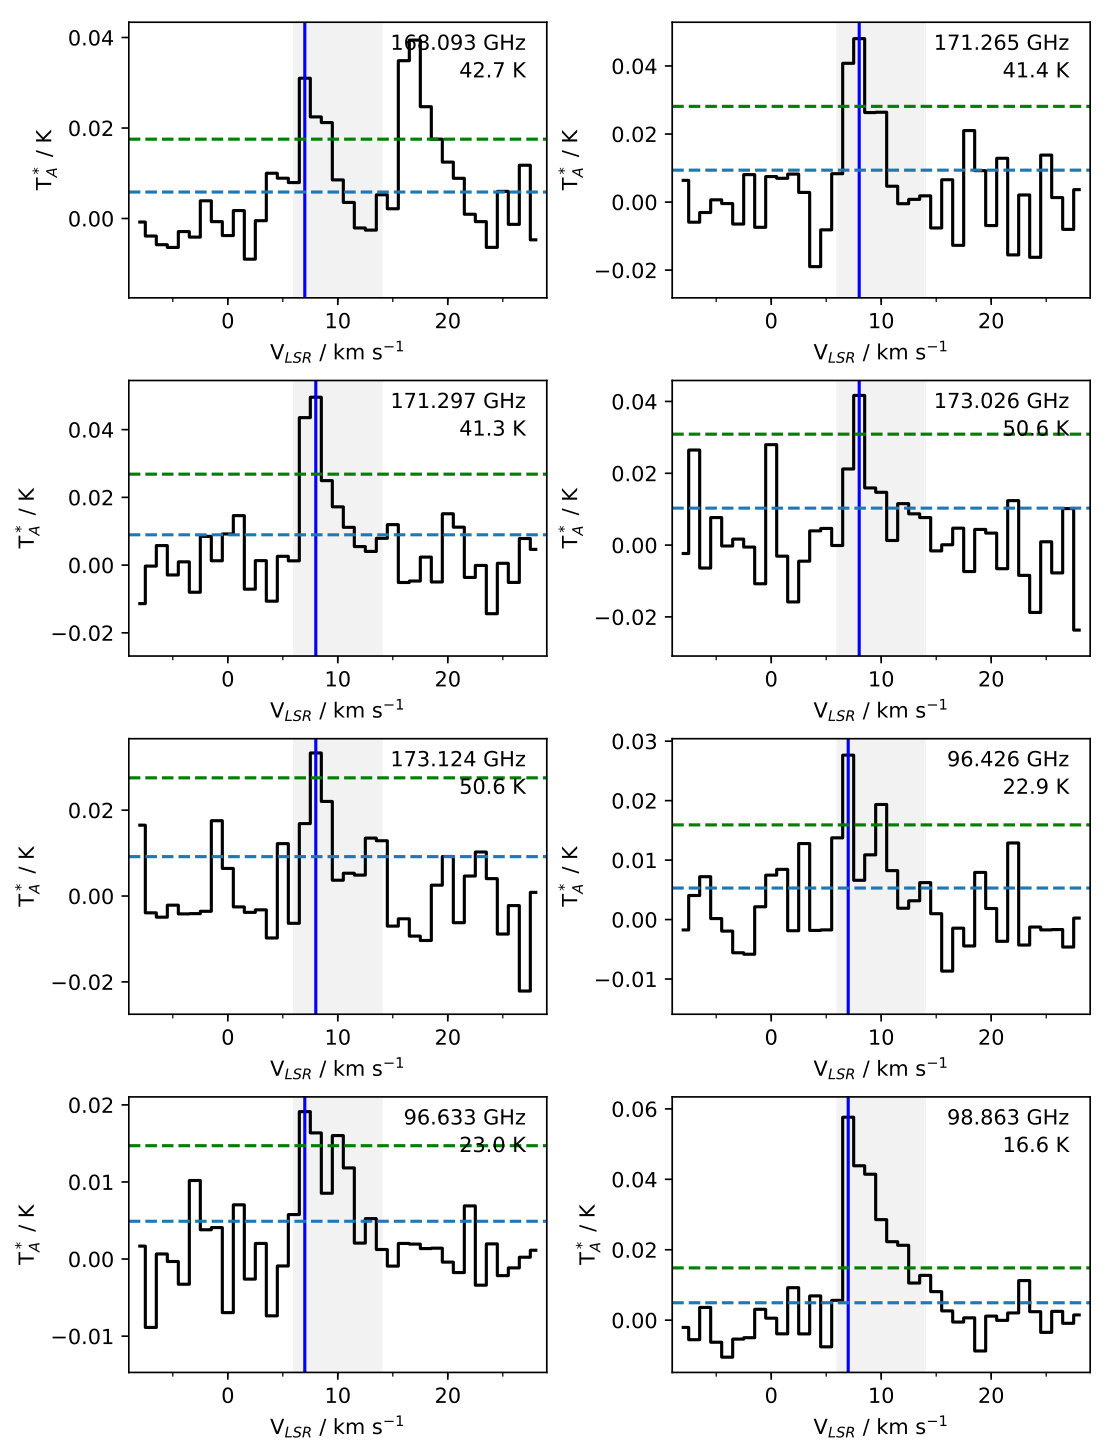 Figure 10
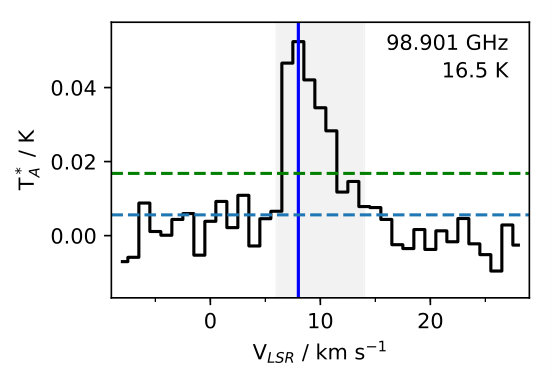 Figure 11
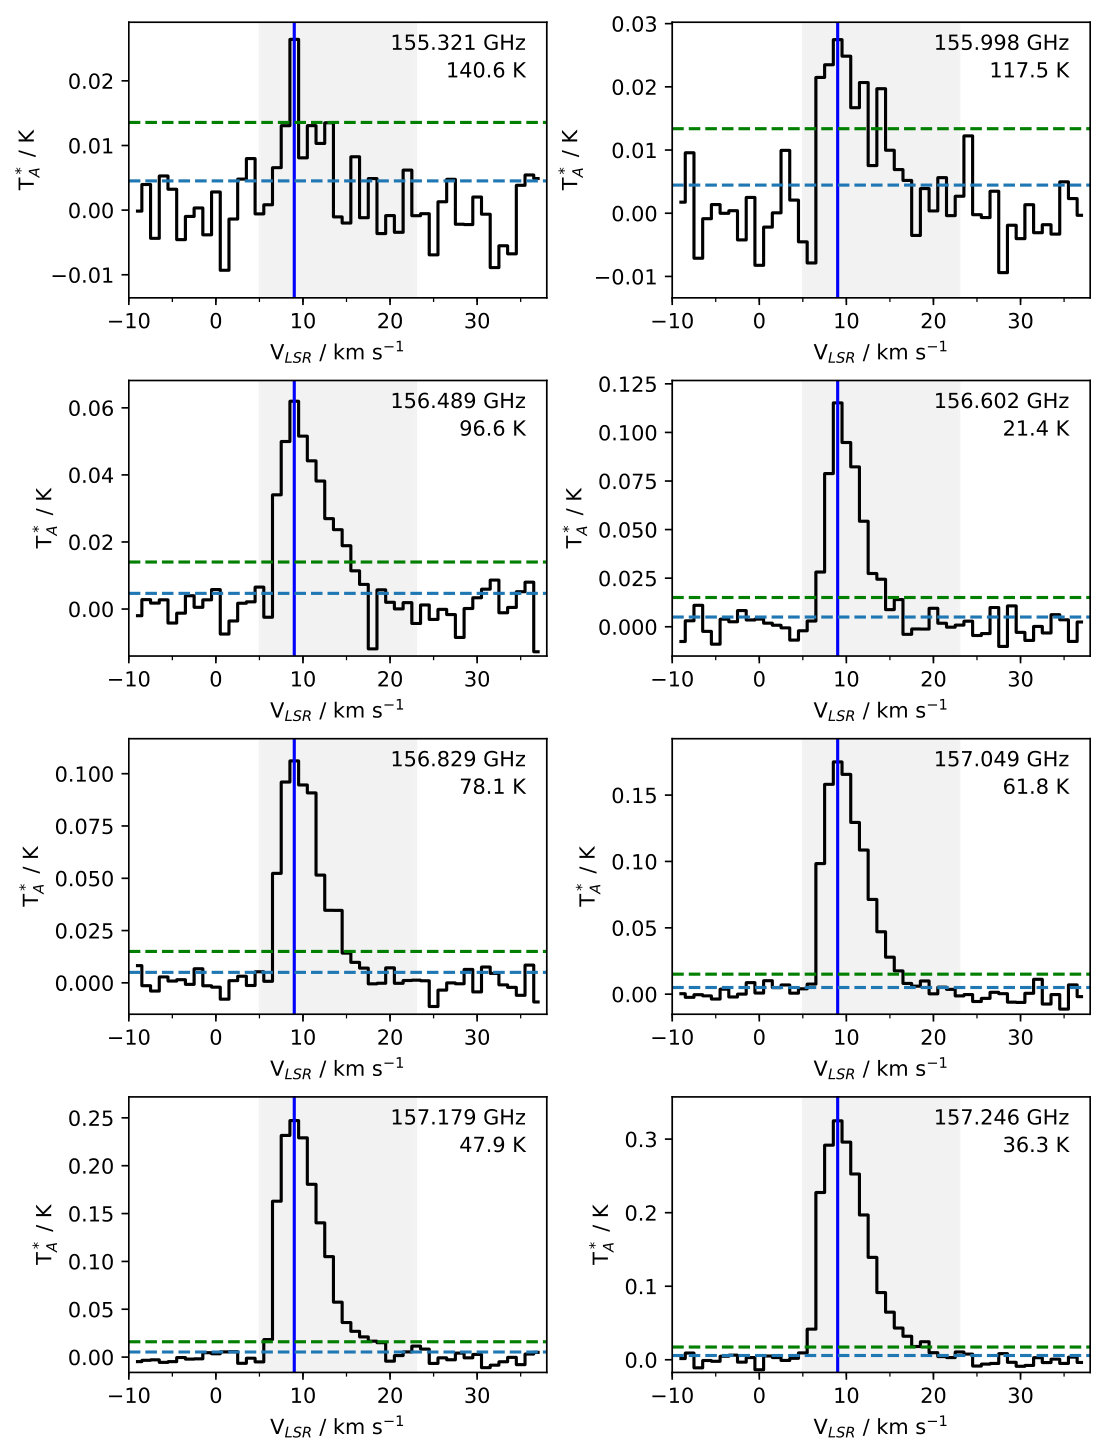 Figure 12
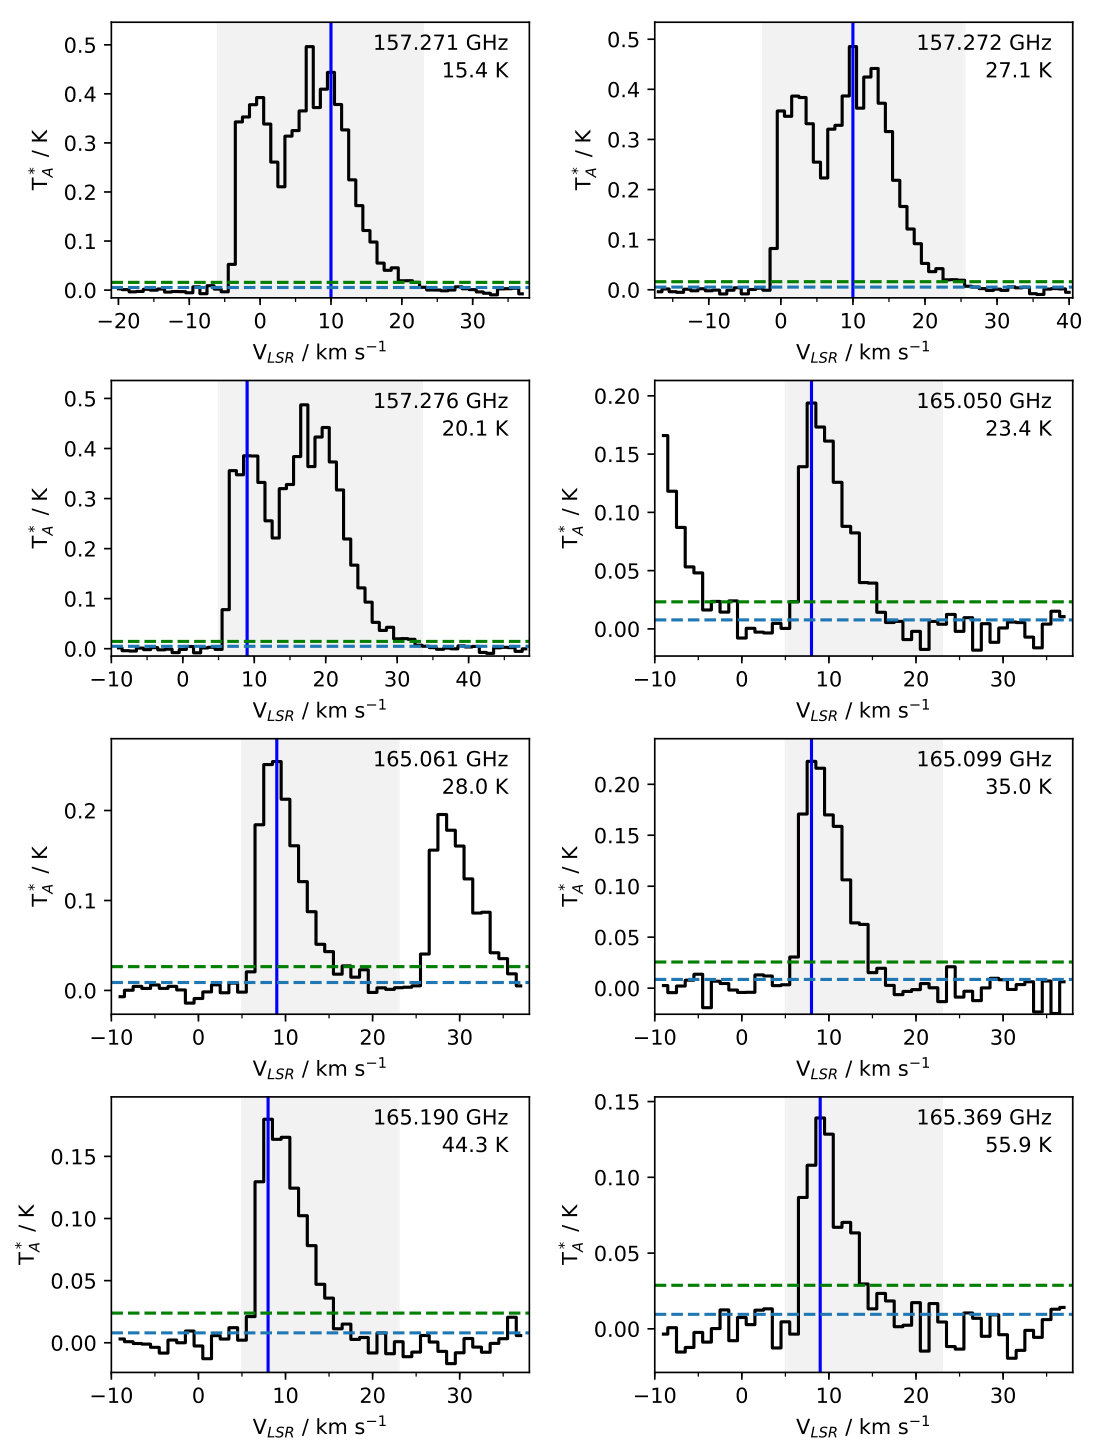 Figure 13
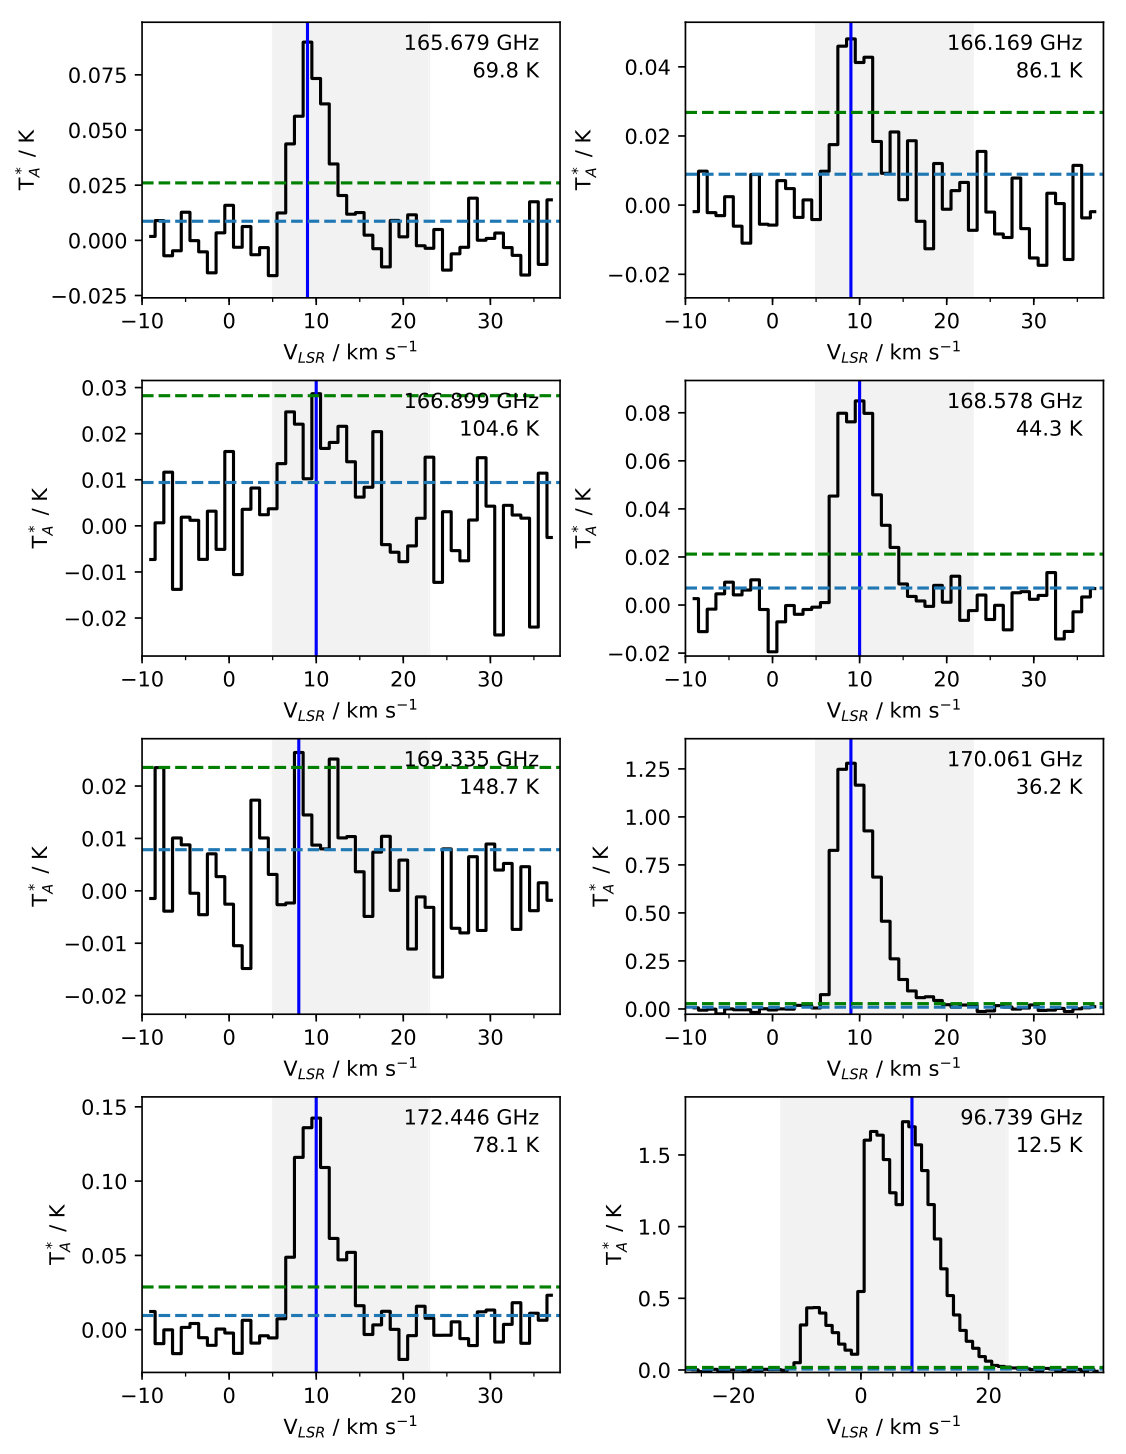 Figure 14
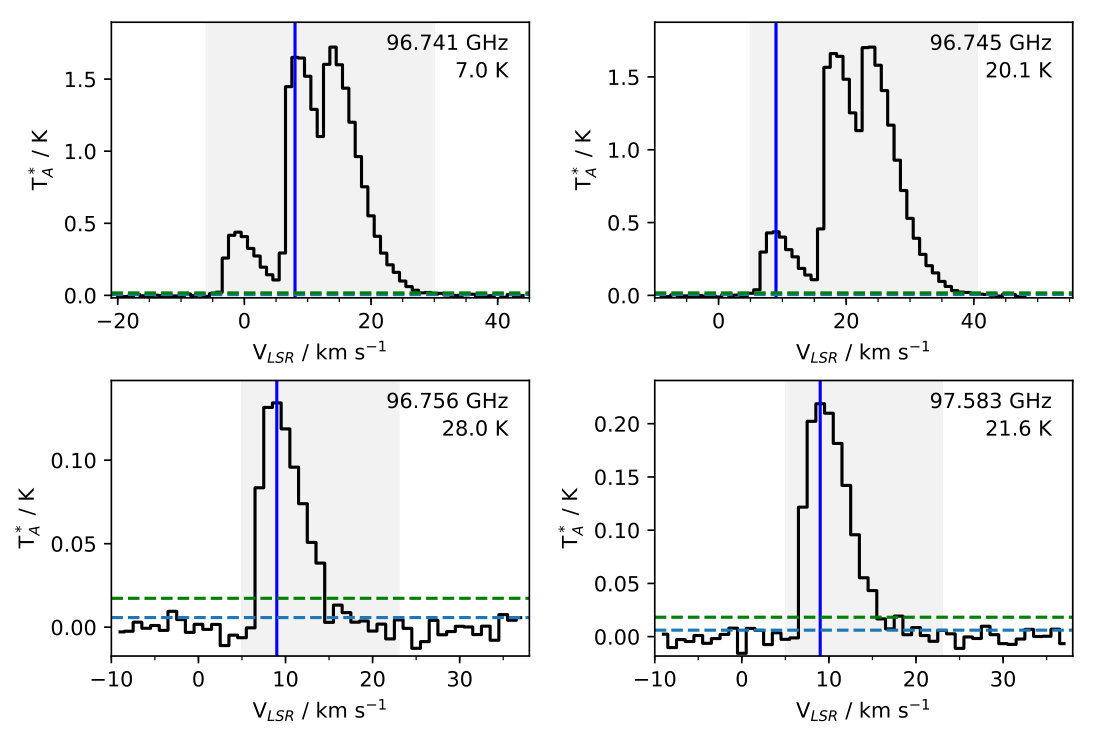 Figure 15
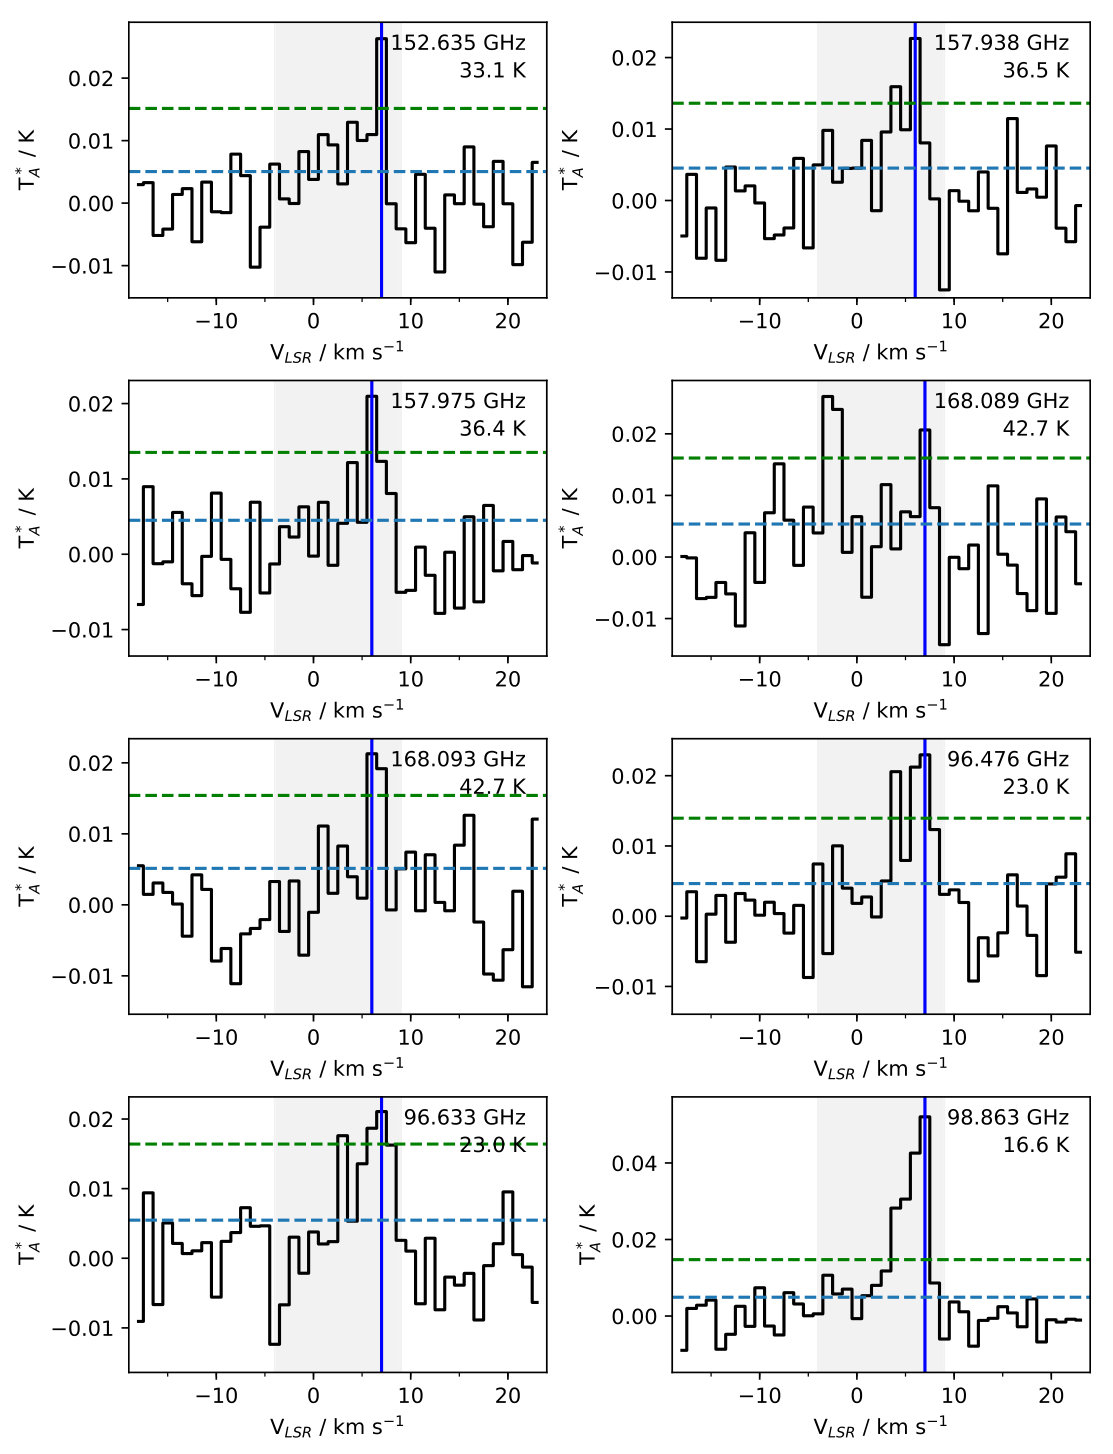 Figure 16
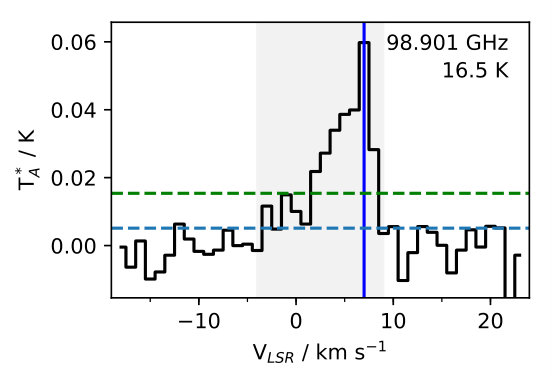 Figure 17
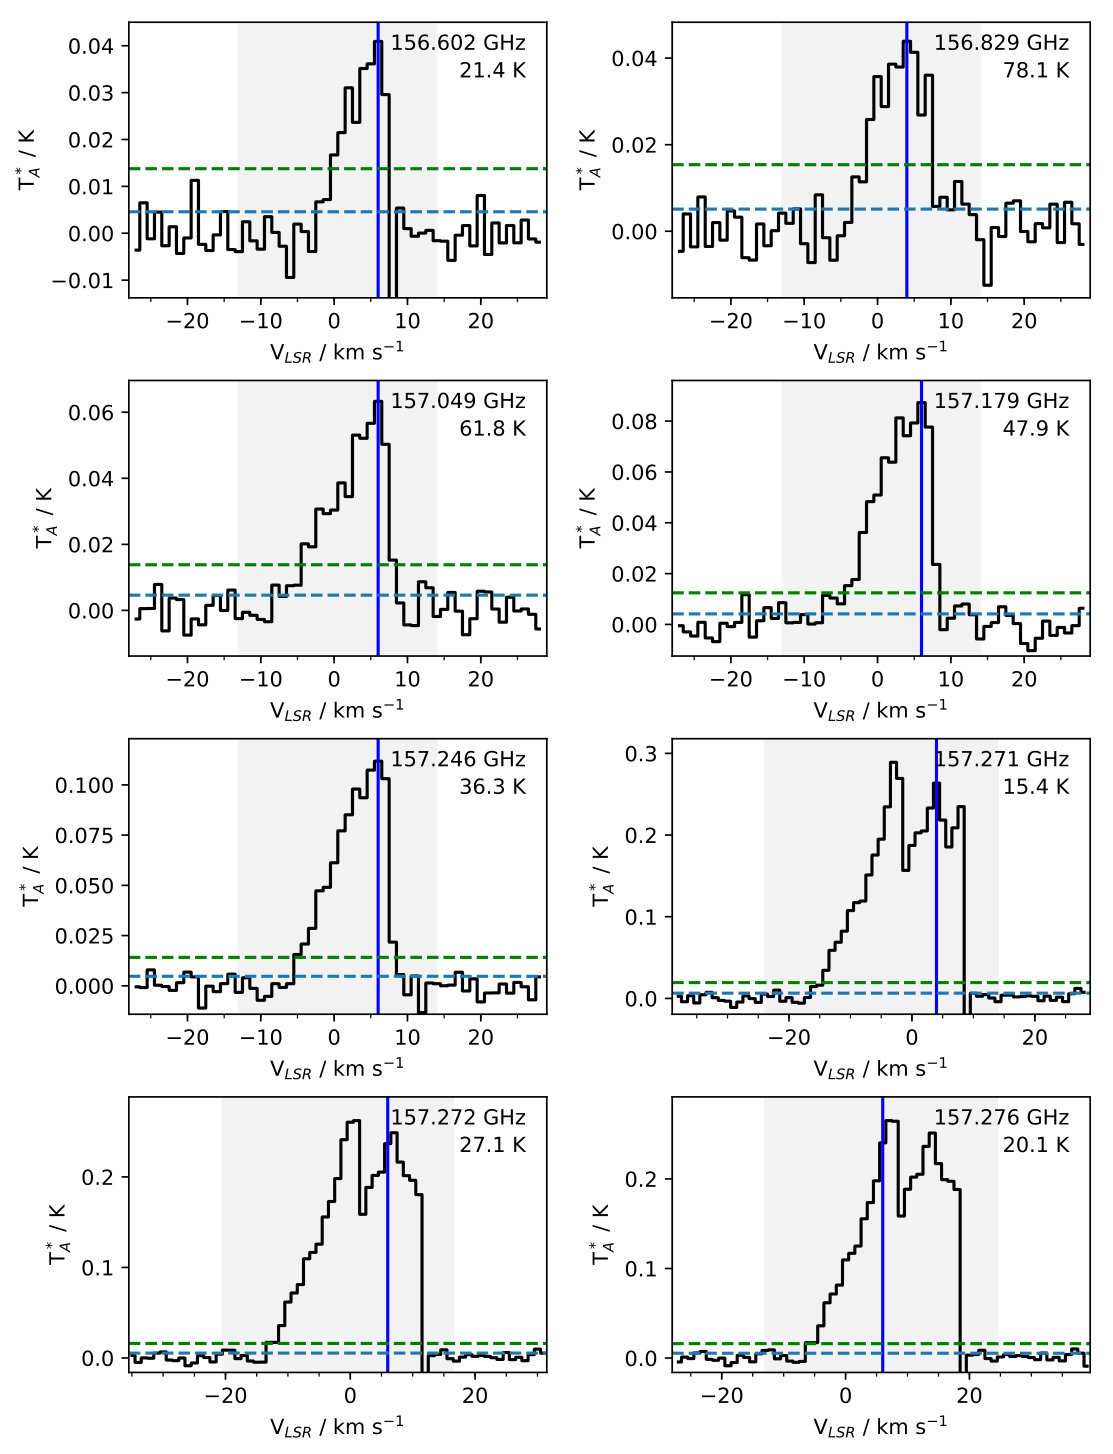 Figure 18
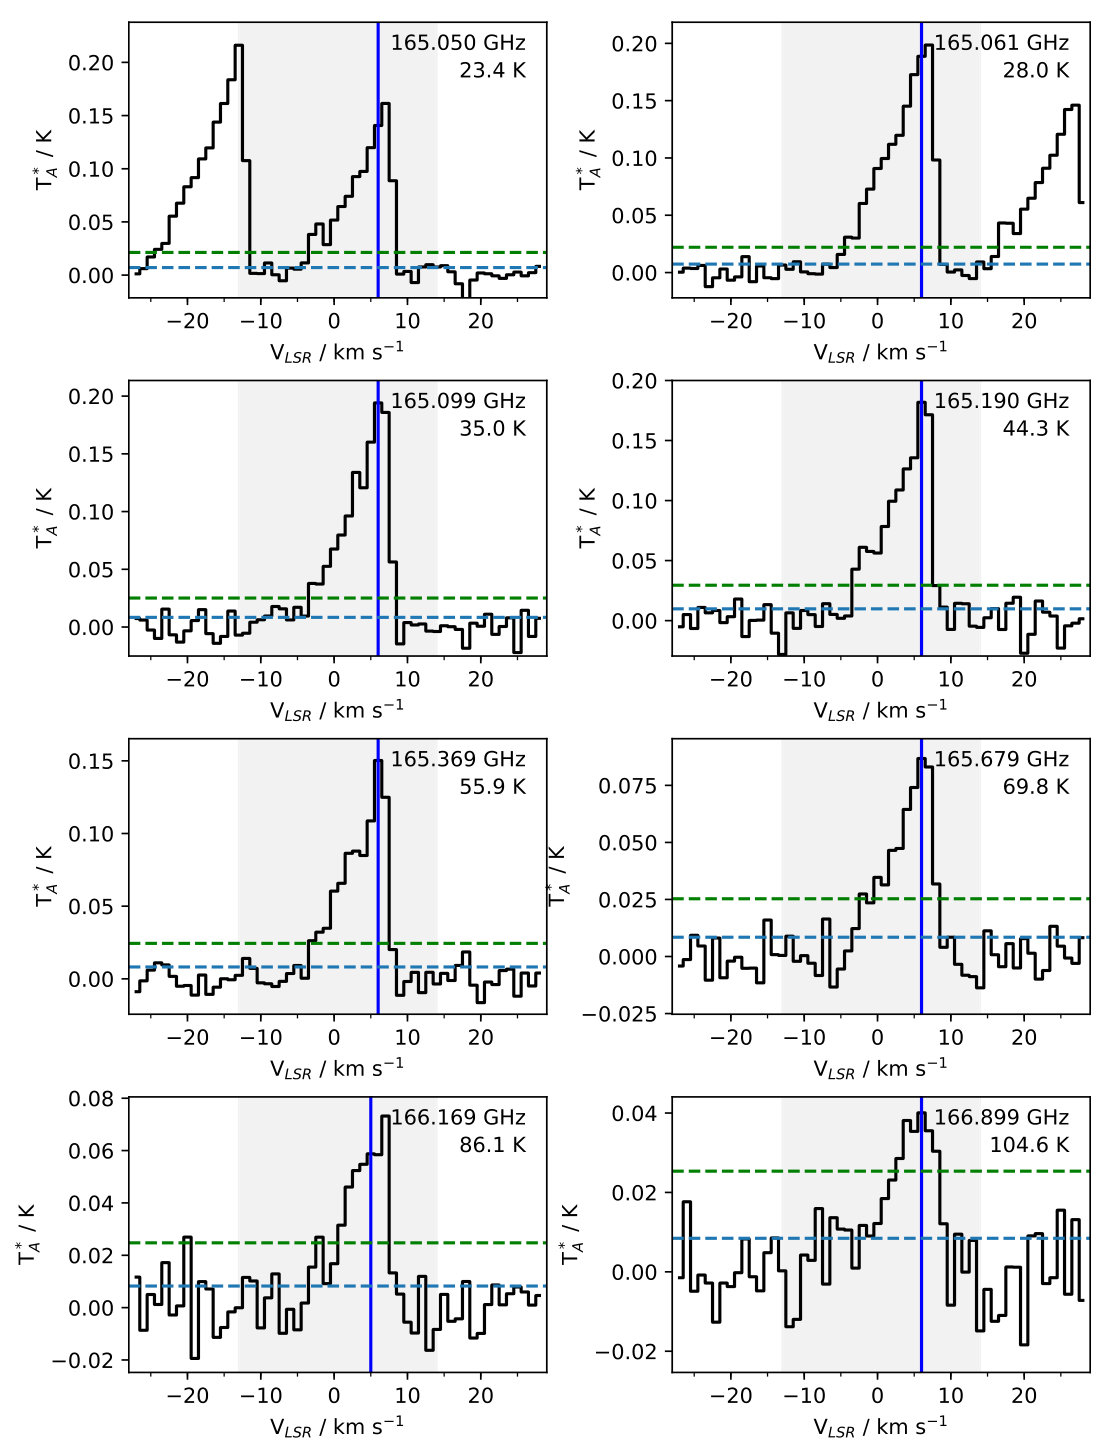 Figure 19
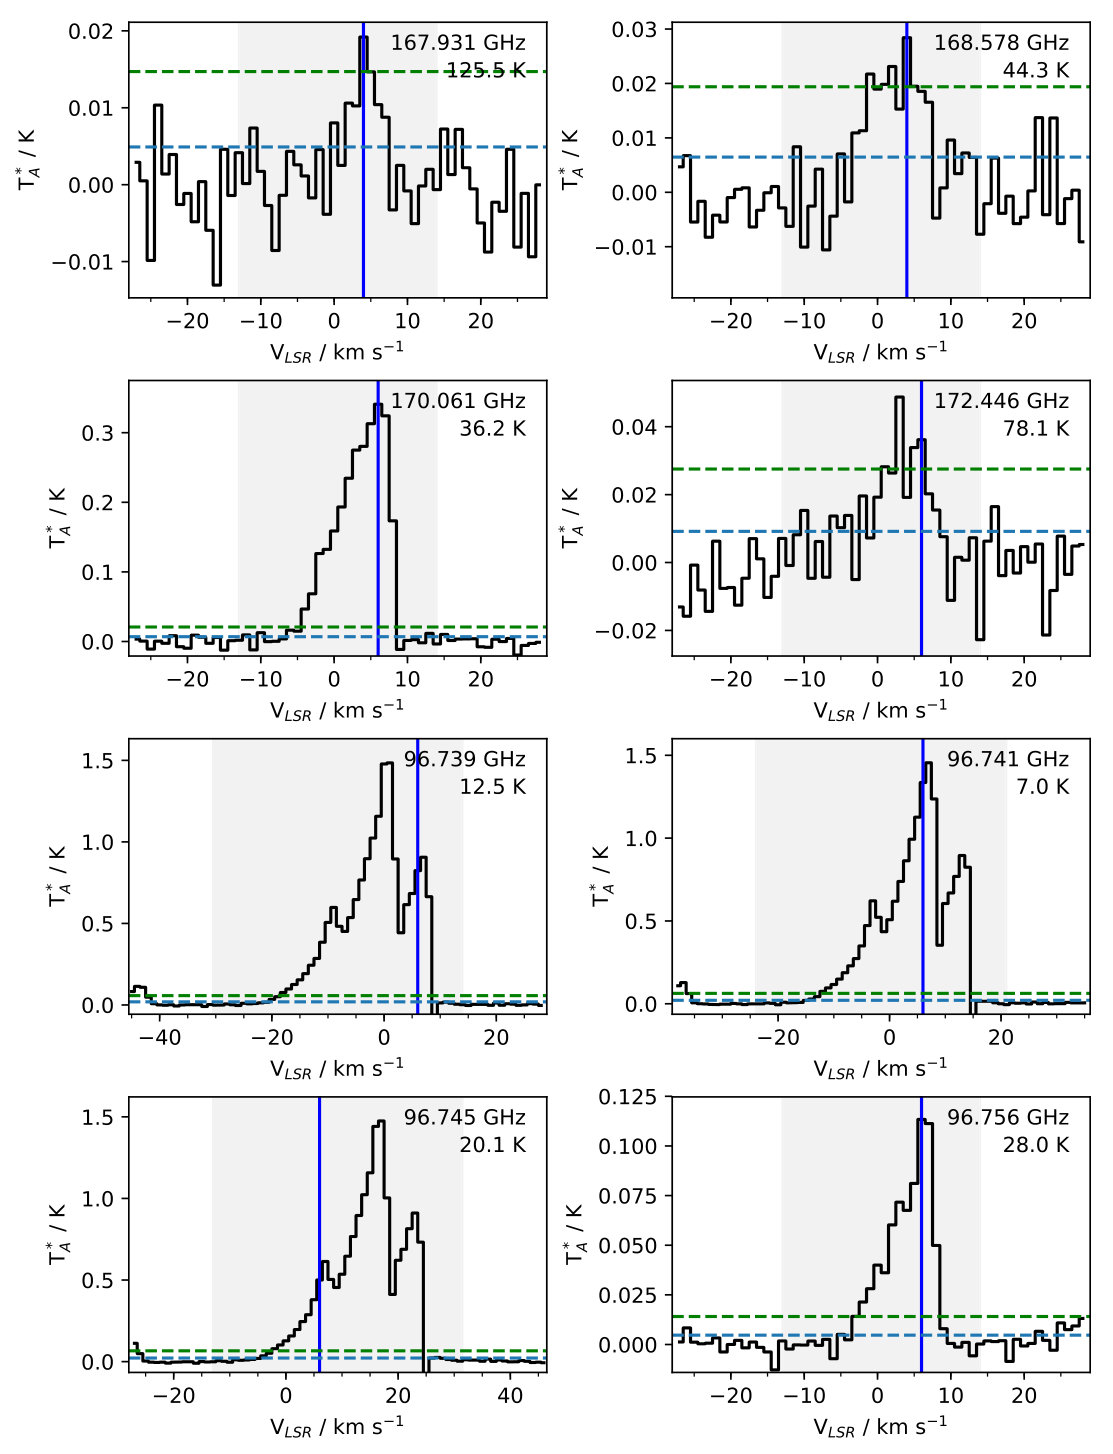 Figure 20
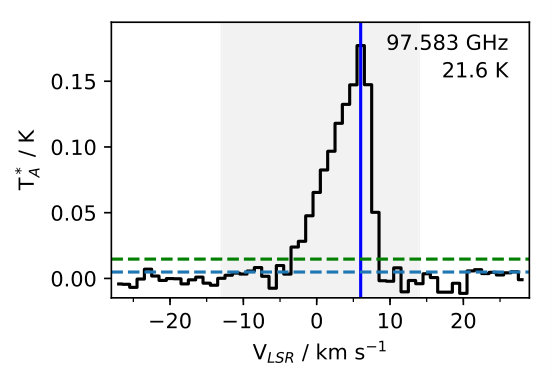 Figure 21
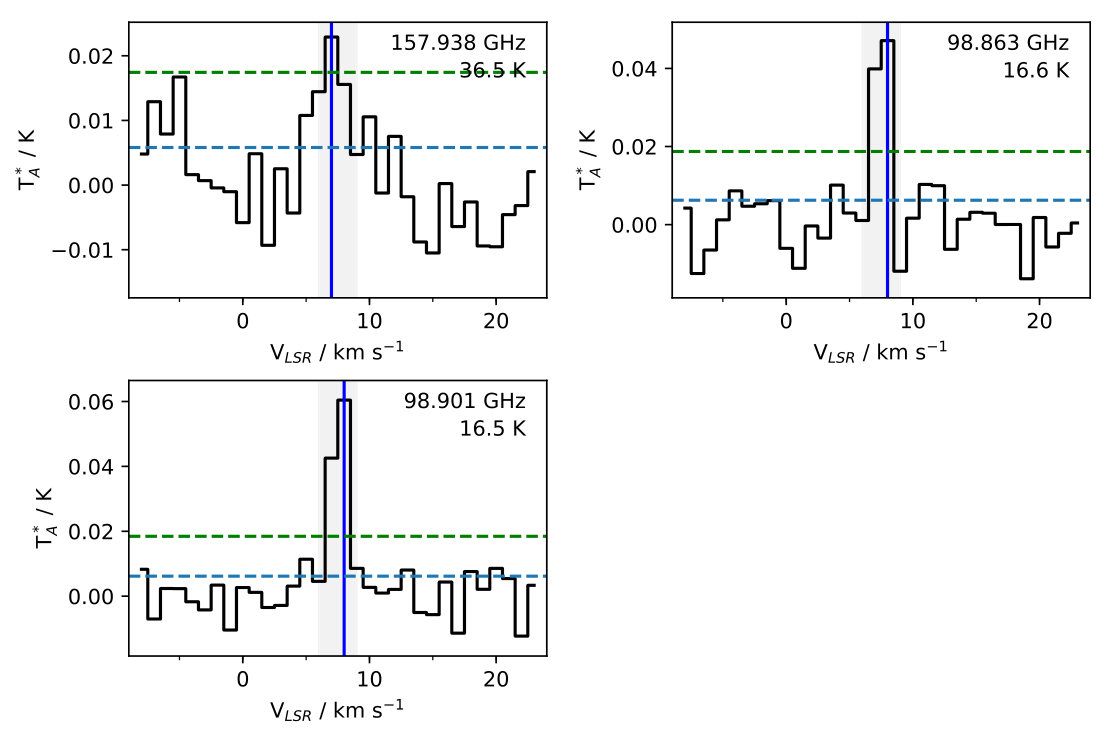 Figure 22
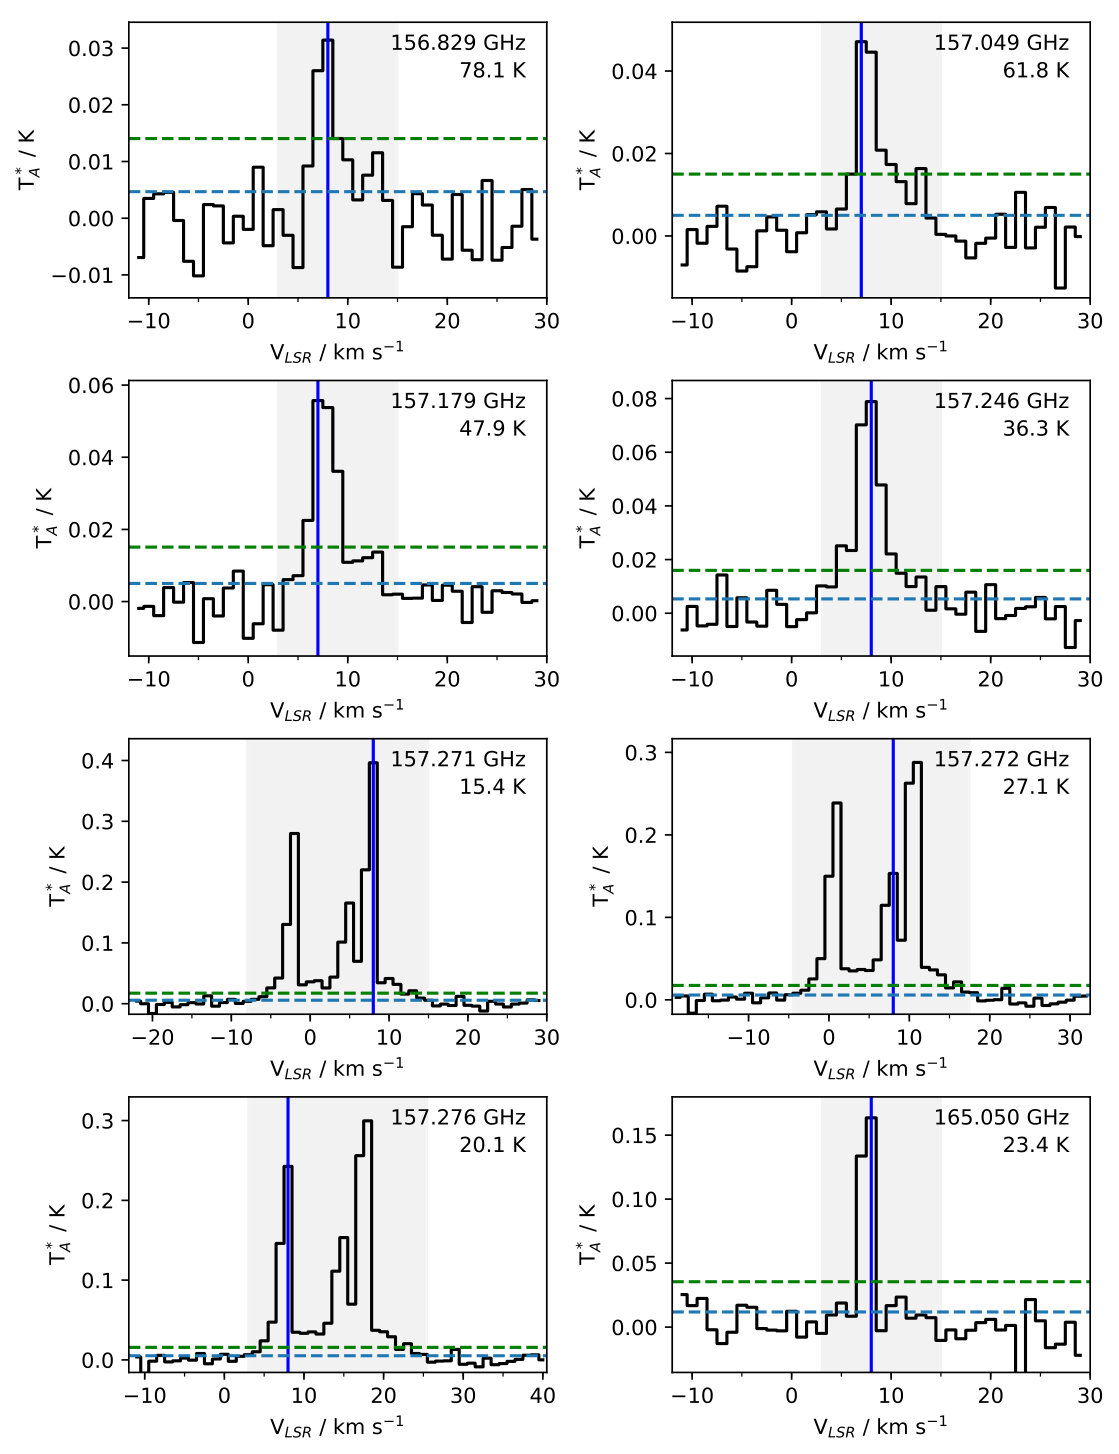 Figure 23
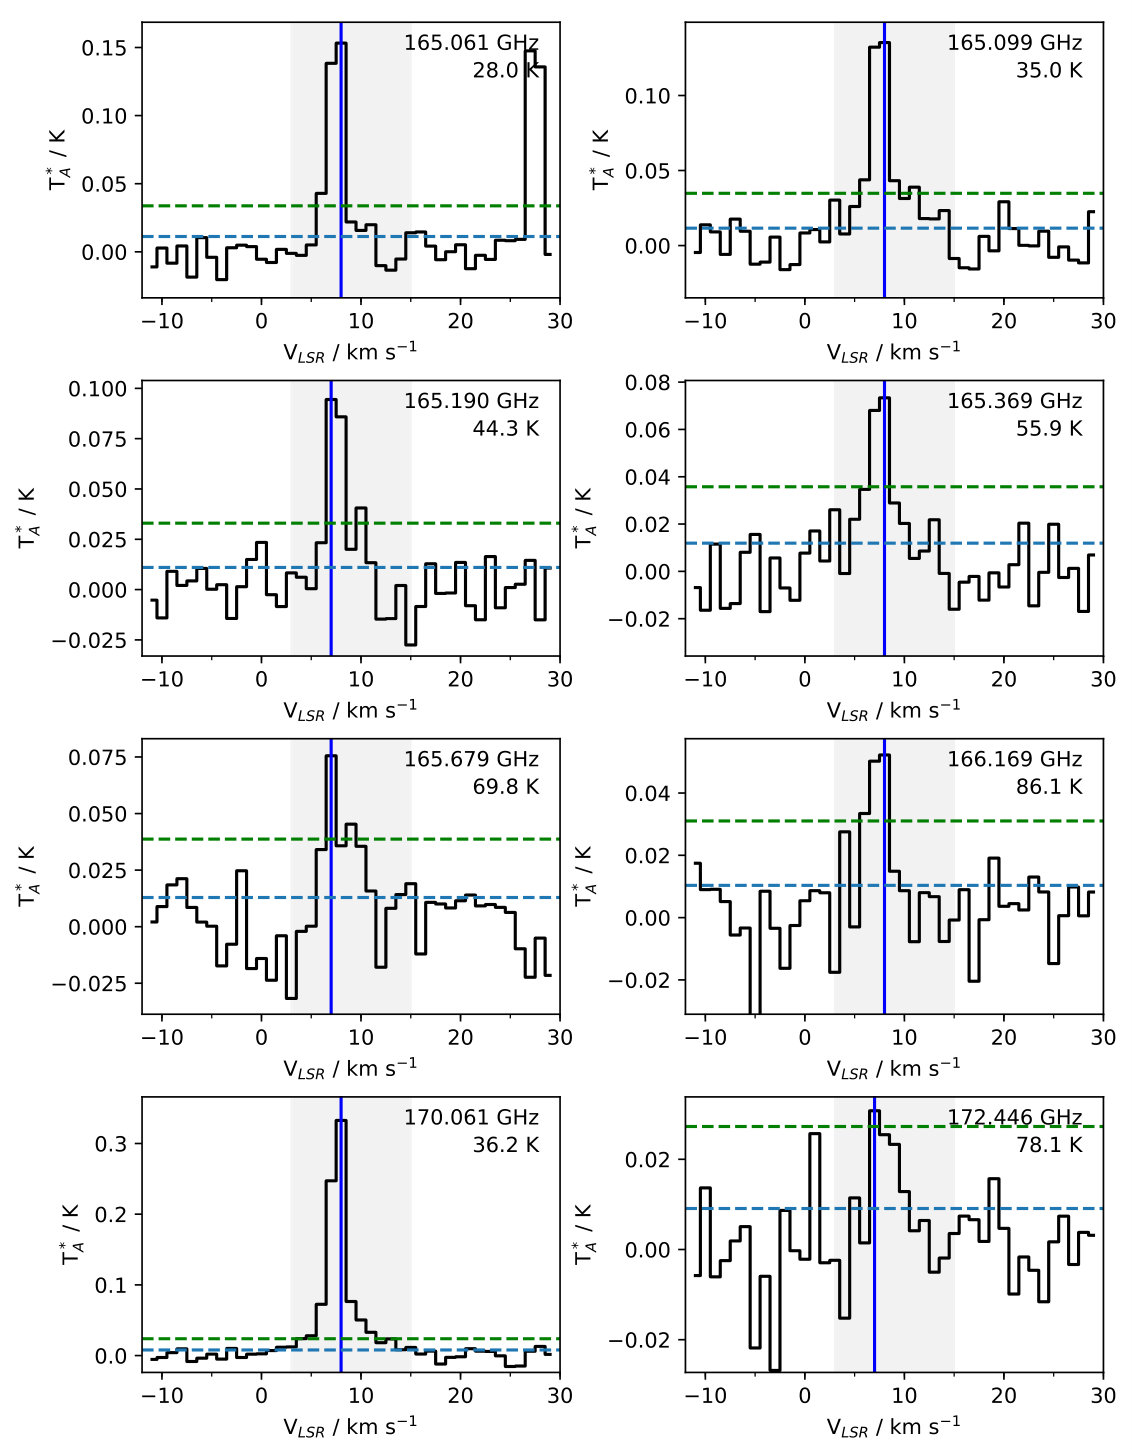 Figure 24
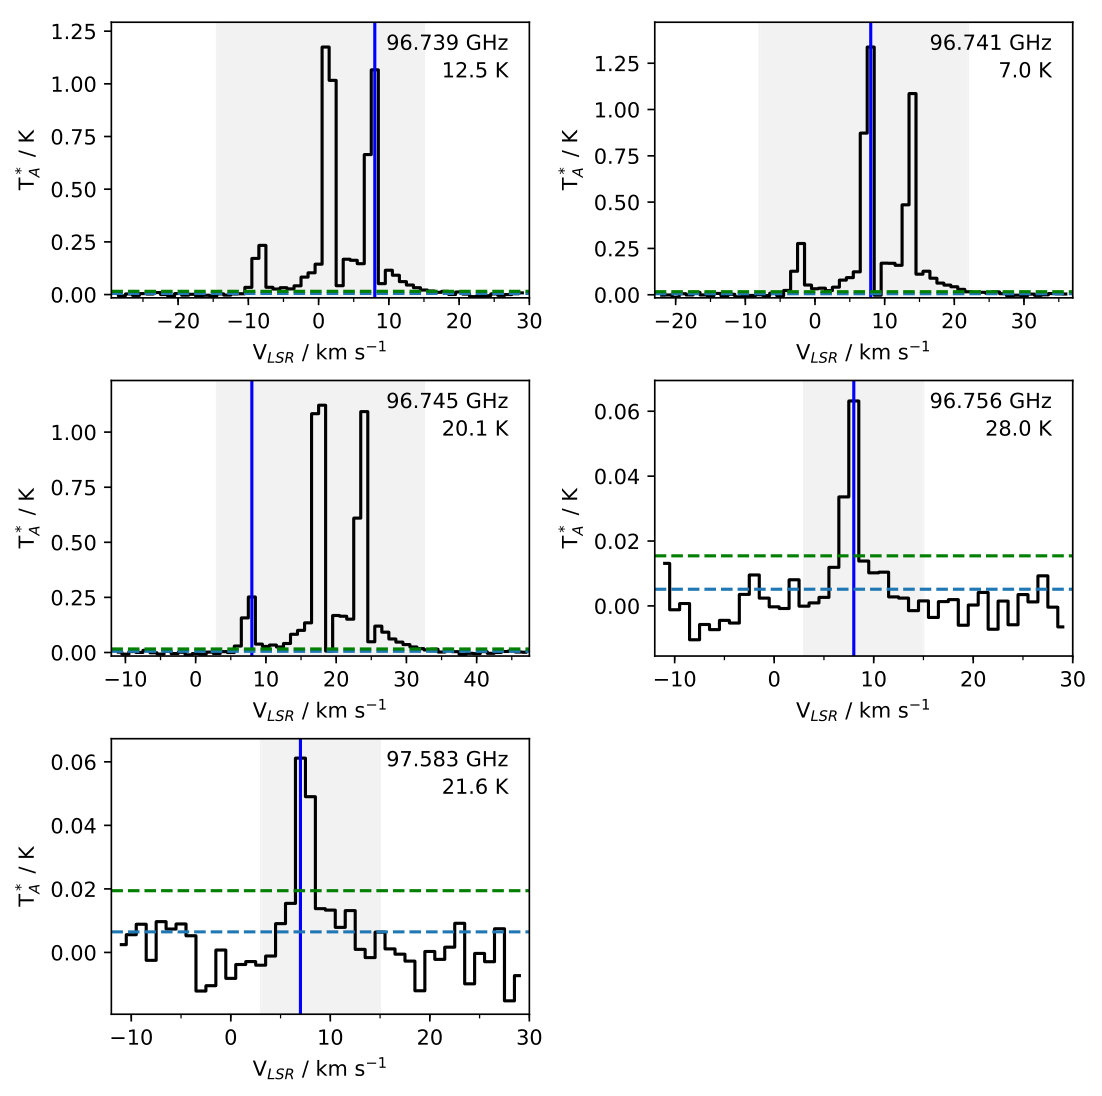 Figure 25
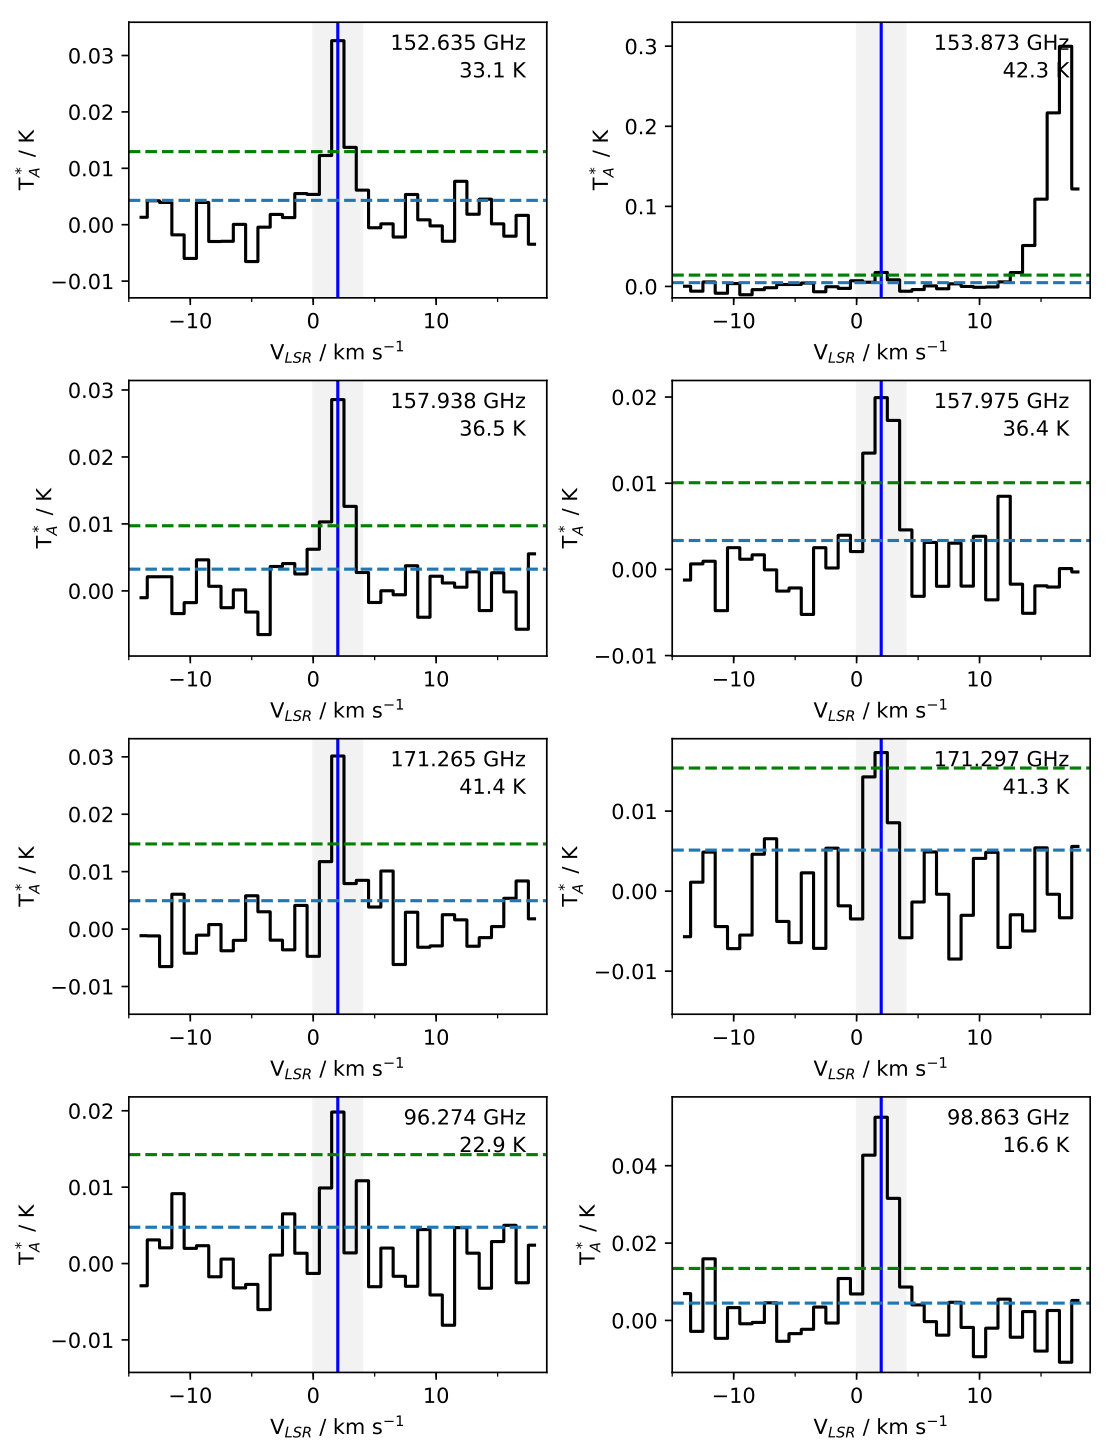 Figure 26
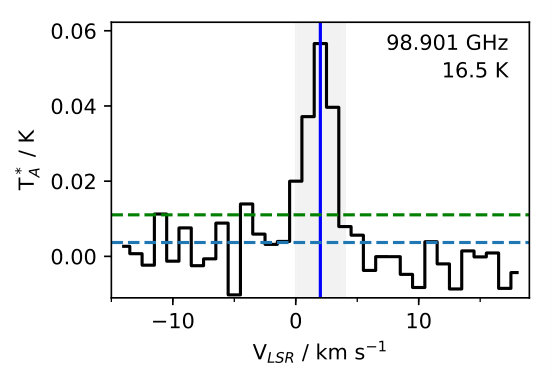 Figure 27
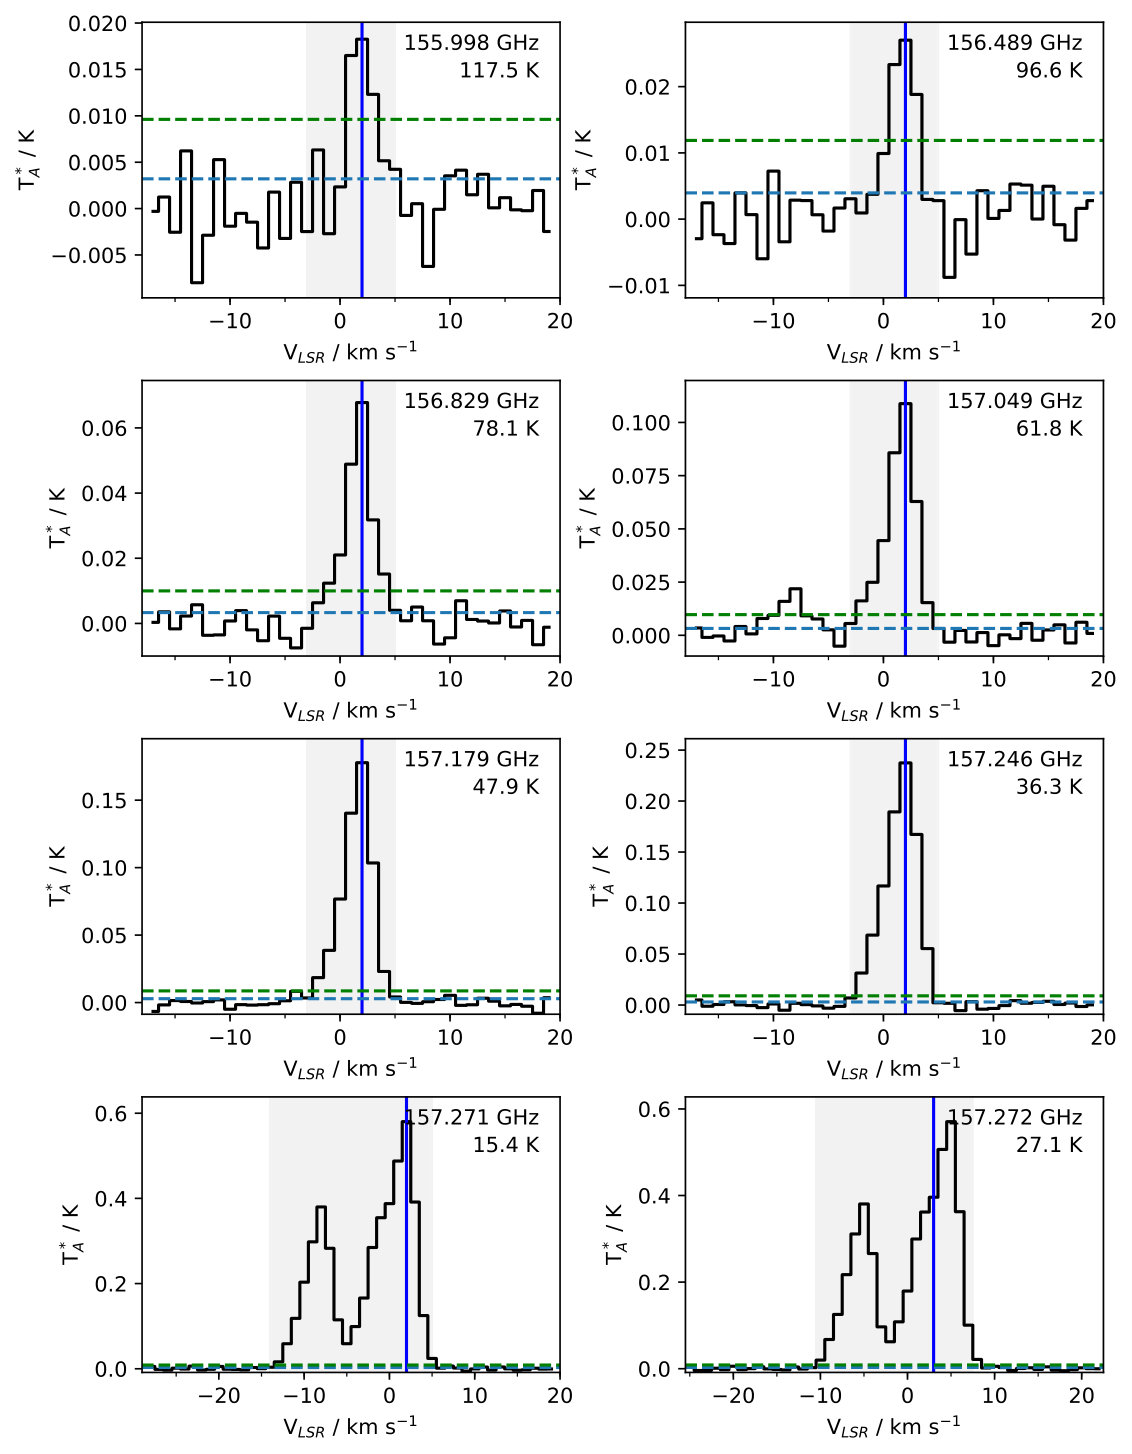 Figure 28
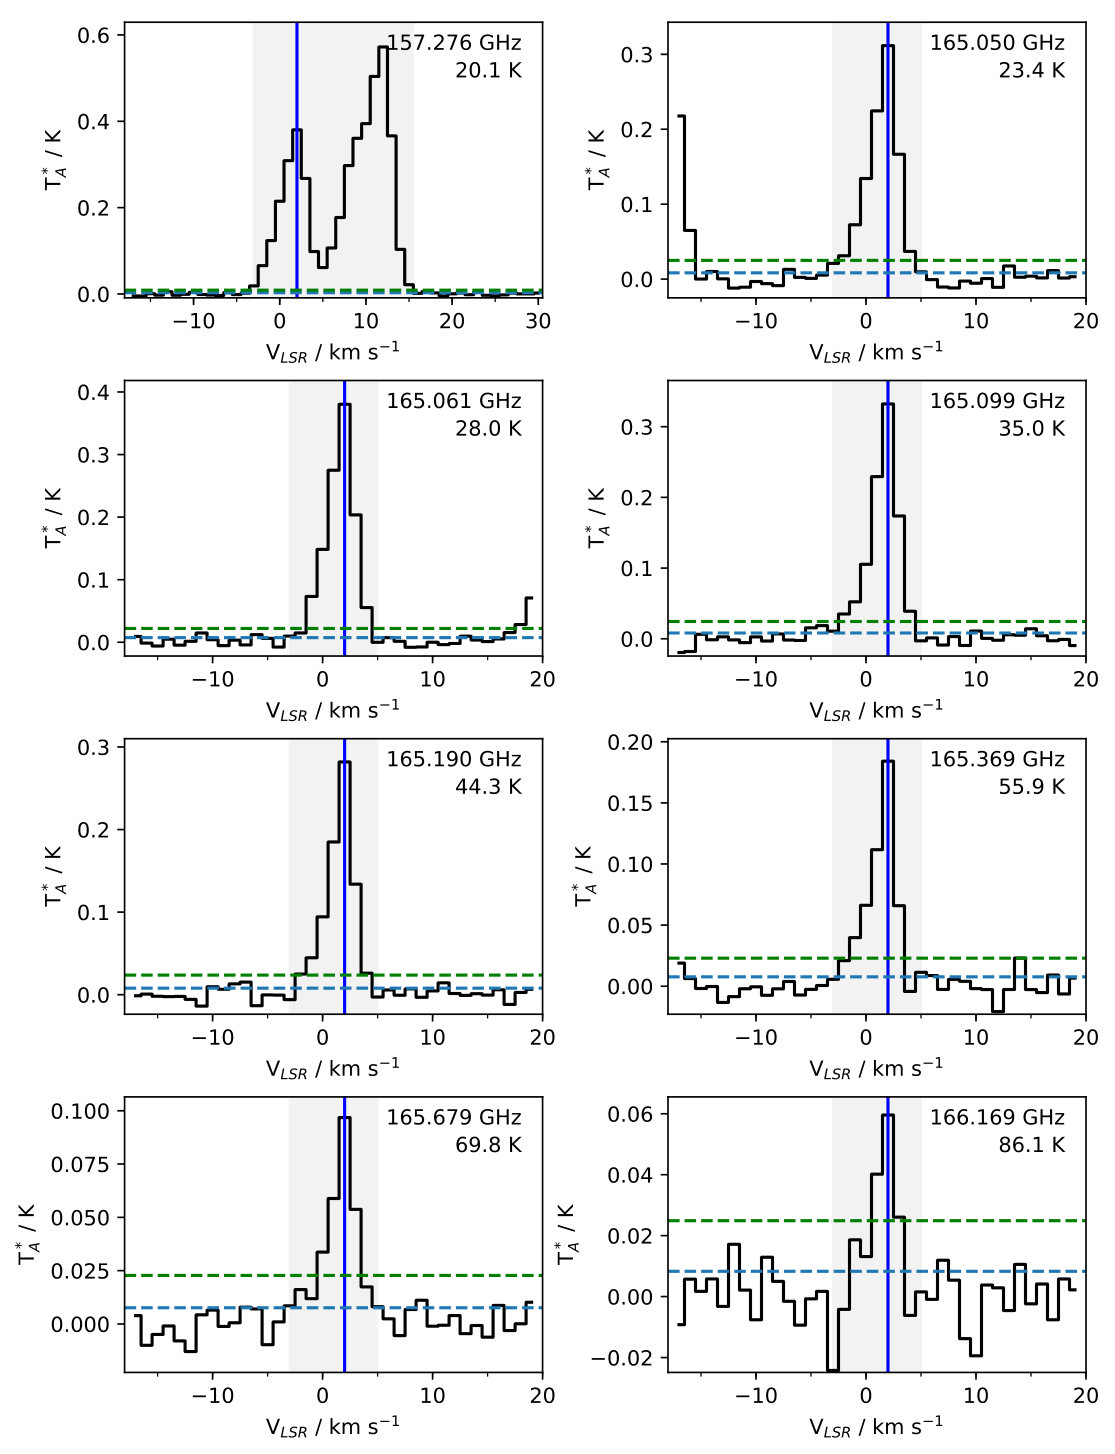 Figure 29
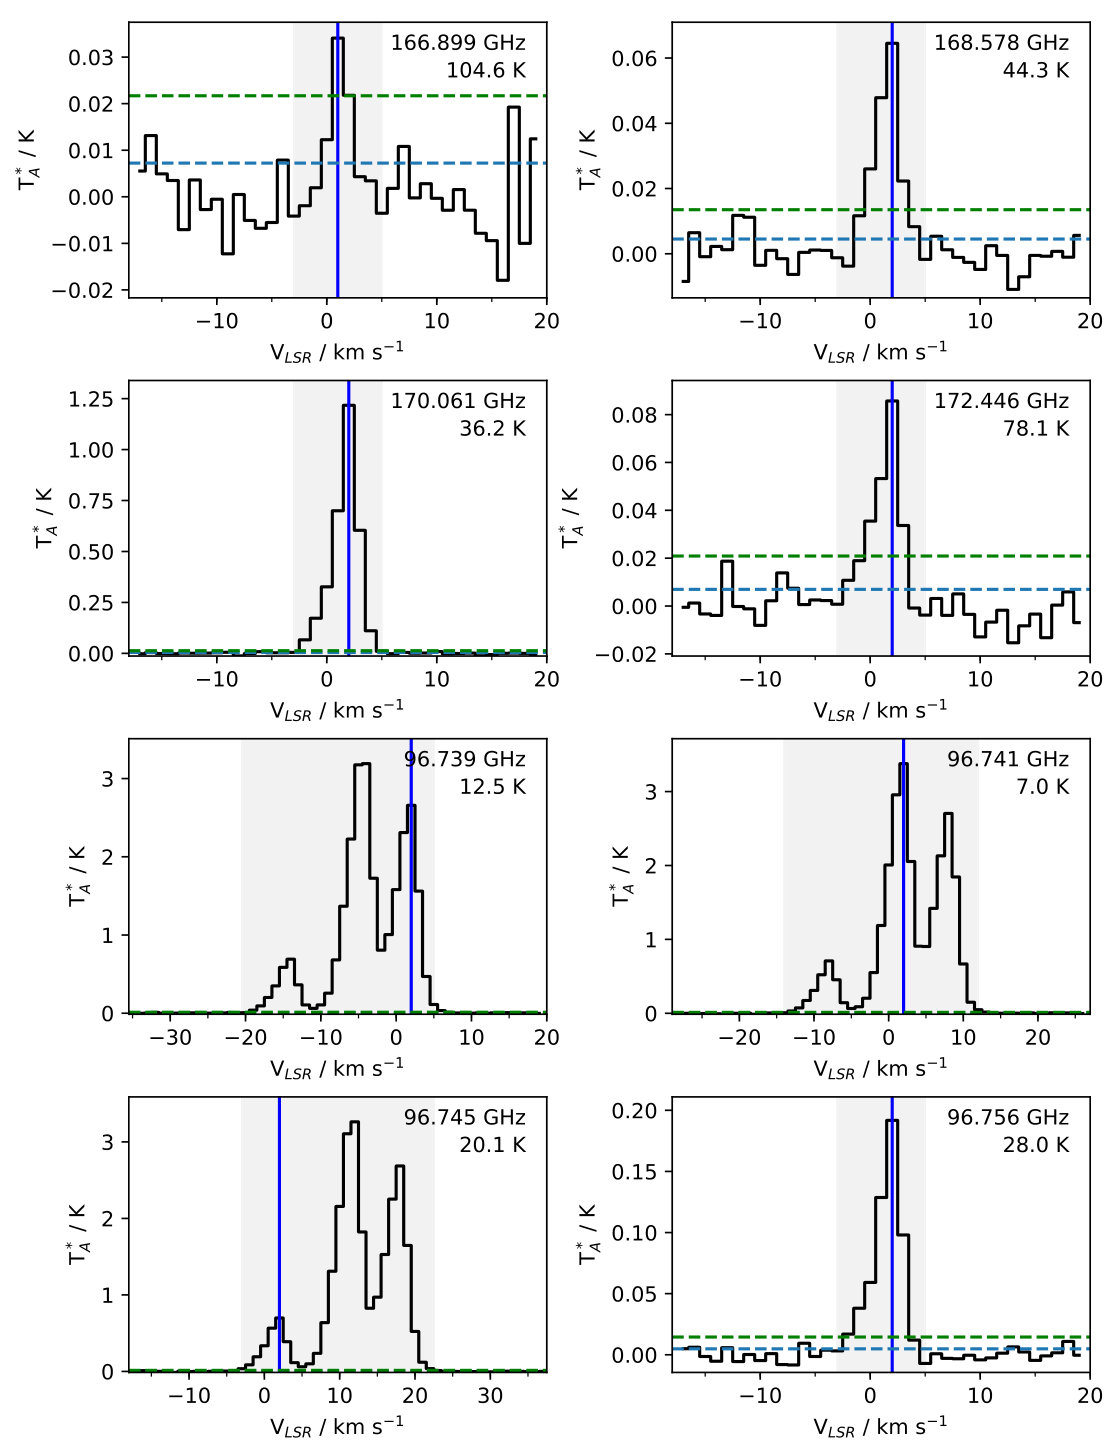 Figure 30
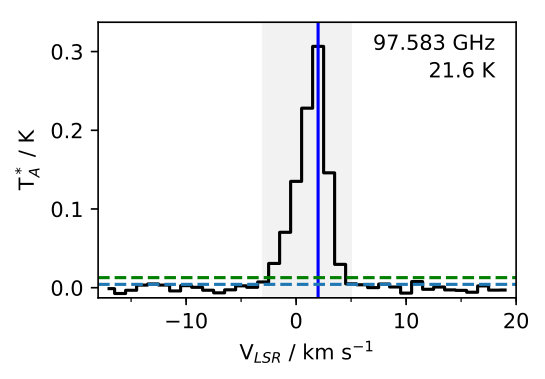 Figure 31
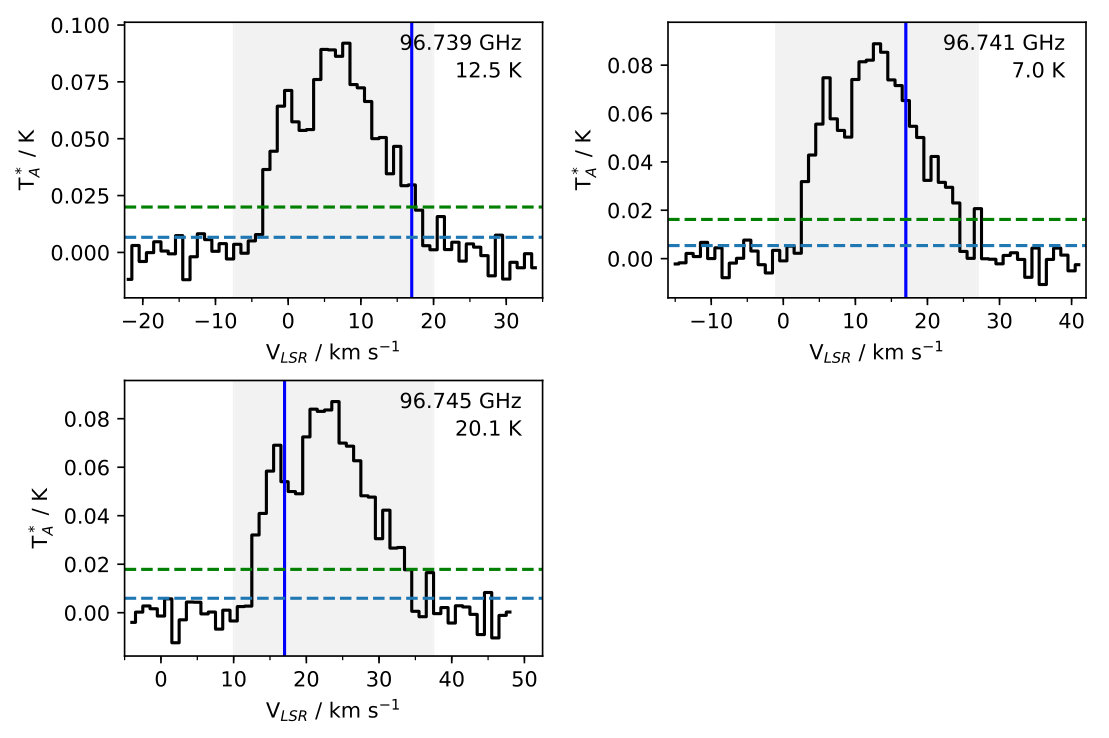 Figure 32
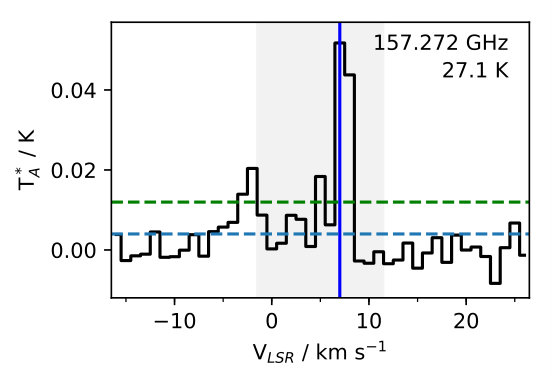 Figure 33
| Source | VLSR | Lbol | d | Offsets Blue/Red | ||
|---|---|---|---|---|---|---|
| (h:m:s) | () | L⊙ | pc | arcseconds | ||
| NGC1333-IRAS2A | 03:28:55.4 | 31:14:35.0 | +6.0 | 25 | 235 | B(-100,+25), R(70,-15) |
| NGC1333-IRAS4A | 03:29:10.4 | 31:13:31.0 | +6.5 | 8 | 235 | B(-6,-19), R(14,25) |
| L1157 | 20:39:06.2 | 68:02:16.0 | +2.6 | 4 | 250 | B2(35,-95), R(-30,140) |
| L1448 | 03:25:38.9 | 30:44:05.0 | +4.7 | 6 | 235 | B2(-13,+29), R4(26,-125) |
| Source | Lines | TKin | nH2 | N(A-CH3OH) | N(A-CH3OH) Range | N(E-CH3OH) | N(E-CH3OH) Range |
|---|---|---|---|---|---|---|---|
| K | |||||||
| IRAS2A-R | 28 | 49.1 - 57.8 | 3.8 - 5.3 | - | - | ||
| IRAS2A-B | 7 | < 41.7 | 2.1 - 27.6 | - | < | - | |
| IRAS4A-R | 21 | 38.0 - 45.6 | 4.9 - 6.1 | - | - | ||
| IRAS4A-B | 25 | 40.7 - 46.4 | 4.9 - 6.0 | - | - | ||
| L1157-R | 3 | <136.5 | 1.7 - 5.0 | - | - | ||
| L1157-B2 | 25 | 41.9 - 47.1 | 2.8 - 4.1 | - | - | ||
| L1448-B2 | 1 | < 22.9 | 1.6 - 8.0 | - | < | - |
| Source | Lines | Trot | N | N(CH3CHO) Range | CH3CHO/CH3OH |
|---|---|---|---|---|---|
| K | |||||
| IRAS2A-R | 17 | 12.6 - 15.5 | - | ||
| IRAS2A-B | 0 | - | - | < | < |
| IRAS4A-R | 3 | 6.1 - 15.2 | - | ||
| IRAS4A-B | 9 | 11.1 - 13.7 | - | ||
| L1157-R | 0 | - | - | < | < |
| L1157-B2 | 9 | 8.4 - 12.1 | - | ||
| L1448-B2 | 0 | - | - | < | < |
| Frequency | Eu | log(Aij) | gu | Vmin | Vmax | Vpeak | Tpeak | ||
|---|---|---|---|---|---|---|---|---|---|
| GHz | K | ” | K | ||||||
| 96.739 | 12.54 | -5.59 | 5 | 25.4 | -11.00 | 24.0 | 8.0 | 1.697 (0.006) | 27.08 (5.42) |
| 96.741 | 6.97 | -5.47 | 5 | 25.4 | -5.00 | 30.0 | 8.0 | 1.651 (0.006) | 26.88 (5.38) |
| 96.745 | 20.09 | -5.47 | 5 | 25.4 | 5.00 | 40.0 | 9.0 | 0.436 (0.006) | 27.04 (5.41) |
| 96.756 | 28.01 | -5.58 | 5 | 25.4 | 6.00 | 15.0 | 9.0 | 0.134 (0.006) | 0.89 (0.18) |
| 97.583 | 21.56 | -5.58 | 5 | 25.2 | 6.00 | 16.0 | 9.0 | 0.219 (0.006) | 1.56 (0.31) |
| 155.321 | 140.60 | -4.81 | 21 | 15.8 | 8.00 | 10.0 | 9.0 | 0.026 (0.005) | 0.13 (0.03) |
| 155.998 | 117.46 | -4.78 | 19 | 15.8 | 6.00 | 13.0 | 9.0 | 0.027 (0.004) | 0.23 (0.05) |
| 156.128 | 86.47 | -5.17 | 13 | 15.8 | - | - | - | - (0.005) | 0.01 (0.02) |
| 156.489 | 96.61 | -4.75 | 17 | 15.7 | 6.00 | 16.0 | 9.0 | 0.062 (0.005) | 0.47 (0.10) |
| 156.602 | 21.44 | -5.05 | 10 | 15.7 | 6.00 | 15.0 | 9.0 | 0.115 (0.005) | 0.69 (0.14) |
| 156.829 | 78.08 | -4.73 | 15 | 15.7 | 6.00 | 15.0 | 9.0 | 0.106 (0.005) | 0.77 (0.16) |
| 157.049 | 61.85 | -4.71 | 13 | 15.7 | 6.00 | 17.0 | 9.0 | 0.175 (0.005) | 1.34 (0.27) |
| 157.179 | 47.94 | -4.69 | 11 | 15.7 | 5.00 | 19.0 | 9.0 | 0.247 (0.005) | 1.93 (0.39) |
| 157.246 | 36.34 | -4.68 | 9 | 15.6 | 5.00 | 20.0 | 9.0 | 0.325 (0.006) | 2.66 (0.53) |
| 157.271 | 15.45 | -4.66 | 3 | 15.6 | -5.00 | 22.0 | 10.0 | 0.444 (0.005) | 8.48 (1.70) |
| 157.272 | 27.05 | -4.67 | 7 | 15.6 | -2.00 | 26.0 | 10.0 | 0.485 (0.005) | 8.51 (1.70) |
| 157.276 | 20.09 | -4.66 | 5 | 15.6 | 5.00 | 33.0 | 9.0 | 0.385 (0.005) | 8.52 (1.70) |
| 165.050 | 23.37 | -4.63 | 3 | 14.9 | 5.00 | 16.0 | 8.0 | 0.194 (0.008) | 1.41 (0.28) |
| 165.061 | 28.01 | -4.63 | 5 | 14.9 | 6.00 | 16.0 | 9.0 | 0.254 (0.009) | 1.94 (0.39) |
| 165.099 | 34.98 | -4.63 | 7 | 14.9 | 5.00 | 15.0 | 8.0 | 0.223 (0.009) | 1.62 (0.33) |
| 165.190 | 44.26 | -4.63 | 9 | 14.9 | 6.00 | 16.0 | 8.0 | 0.180 (0.008) | 1.41 (0.28) |
| 165.369 | 55.87 | -4.64 | 11 | 14.9 | 6.00 | 15.0 | 9.0 | 0.139 (0.010) | 1.01 (0.21) |
| 165.679 | 69.80 | -4.64 | 13 | 14.8 | 6.00 | 13.0 | 9.0 | 0.090 (0.009) | 0.56 (0.12) |
| 166.169 | 86.05 | -4.64 | 15 | 14.8 | 7.00 | 12.0 | 9.0 | 0.048 (0.009) | 0.37 (0.08) |
| 166.899 | 104.62 | -4.64 | 17 | 14.7 | 9.00 | 11.0 | 10.0 | 0.029 (0.009) | 0.24 (0.06) |
| 167.931 | 125.52 | -4.64 | 19 | 14.6 | - | - | - | - (0.007) | 0.08 (0.03) |
| 168.578 | 44.26 | -5.36 | 9 | 14.6 | 6.00 | 15.0 | 10.0 | 0.085 (0.007) | 0.66 (0.14) |
| 169.335 | 148.73 | -4.64 | 21 | 14.5 | 7.00 | 9.0 | 8.0 | 0.026 (0.008) | 0.14 (0.04) |
| 170.061 | 36.17 | -4.59 | 7 | 14.5 | 5.00 | 20.0 | 9.0 | 1.279 (0.009) | 9.87 (1.97) |
| 172.446 | 78.08 | -4.94 | 15 | 14.3 | 6.00 | 15.0 | 10.0 | 0.142 (0.010) | 1.00 (0.20) |
| Frequency | Eu | log(Aij) | gu | Vmin | Vmax | Vpeak | Tpeak | ||
|---|---|---|---|---|---|---|---|---|---|
| GHz | K | ” | K | ||||||
| 155.321 | 140.60 | -4.81 | 21 | 15.8 | - | - | - | - (0.006) | 0.01 (0.02) |
| 155.998 | 117.46 | -4.78 | 19 | 15.8 | - | - | - | - (0.005) | 0.06 (0.02) |
| 156.128 | 86.47 | -5.17 | 13 | 15.8 | - | - | - | - (0.005) | -0.00 (0.02) |
| 156.489 | 96.61 | -4.75 | 17 | 15.7 | - | - | - | - (0.005) | 0.06 (0.03) |
| 156.829 | 78.08 | -4.73 | 15 | 15.7 | - | - | - | - (0.006) | 0.13 (0.04) |
| 157.049 | 61.85 | -4.71 | 13 | 15.7 | -6.00 | 6.0 | 2.0 | 0.035 (0.004) | 0.34 (0.07) |
| 157.179 | 47.94 | -4.69 | 11 | 15.7 | -5.00 | 7.0 | 2.0 | 0.056 (0.004) | 0.50 (0.10) |
| 157.246 | 36.34 | -4.68 | 9 | 15.6 | -6.00 | 7.0 | 2.0 | 0.089 (0.004) | 0.77 (0.16) |
| 157.271 | 15.45 | -4.66 | 3 | 15.6 | -17.00 | 10.0 | 2.0 | 0.205 (0.004) | 3.72 (0.74) |
| 157.272 | 27.05 | -4.67 | 7 | 15.6 | -14.00 | 13.0 | 2.0 | 0.175 (0.004) | 3.72 (0.74) |
| 157.276 | 20.09 | -4.66 | 5 | 15.6 | -7.00 | 20.0 | 3.0 | 0.137 (0.004) | 3.72 (0.74) |
| 167.931 | 125.52 | -4.64 | 19 | 14.6 | - | - | - | - (0.006) | 0.03 (0.03) |
| 168.578 | 44.26 | -5.36 | 9 | 14.6 | - | - | - | - (0.007) | 0.06 (0.03) |
| 169.335 | 148.73 | -4.64 | 21 | 14.5 | - | - | - | - (0.006) | 0.02 (0.03) |
| 170.061 | 36.17 | -4.59 | 7 | 14.5 | -7.00 | 10.0 | 2.0 | 0.263 (0.006) | 2.55 (0.51) |
| 172.446 | 78.08 | -4.94 | 15 | 14.3 | - | - | - | - (0.010) | 0.11 (0.05) |
| Frequency | Eu | log(Aij) | gu | Vmin | Vmax | Vpeak | Tpeak | ||
|---|---|---|---|---|---|---|---|---|---|
| GHz | K | ” | K | ||||||
| 96.739 | 12.54 | -5.59 | 5 | 25.4 | -11.00 | 17.0 | 8.0 | 1.066 (0.005) | 6.84 (1.37) |
| 96.741 | 6.97 | -5.47 | 5 | 25.4 | -5.00 | 9.0 | 8.0 | 1.337 (0.006) | 6.75 (1.35) |
| 96.745 | 20.09 | -5.47 | 5 | 25.4 | 5.00 | 19.0 | 8.0 | 0.252 (0.005) | 6.84 (1.37) |
| 96.756 | 28.01 | -5.58 | 5 | 25.4 | 6.00 | 9.0 | 8.0 | 0.063 (0.005) | 0.18 (0.04) |
| 97.583 | 21.56 | -5.58 | 5 | 25.2 | 6.00 | 9.0 | 7.0 | 0.061 (0.006) | 0.21 (0.05) |
| 155.321 | 140.60 | -4.81 | 21 | 15.8 | - | - | - | - (0.005) | 0.04 (0.02) |
| 155.998 | 117.46 | -4.78 | 19 | 15.8 | - | - | - | - (0.006) | 0.07 (0.02) |
| 156.128 | 86.47 | -5.17 | 13 | 15.8 | - | - | - | - (0.006) | -0.00 (0.02) |
| 156.489 | 96.61 | -4.75 | 17 | 15.7 | - | - | - | - (0.006) | 0.03 (0.02) |
| 156.602 | 21.44 | -5.05 | 10 | 15.7 | - | - | - | - (0.004) | 0.06 (0.02) |
| 156.829 | 78.08 | -4.73 | 15 | 15.7 | 6.00 | 10.0 | 8.0 | 0.031 (0.005) | 0.14 (0.03) |
| 157.049 | 61.85 | -4.71 | 13 | 15.7 | 5.00 | 11.0 | 7.0 | 0.047 (0.005) | 0.25 (0.05) |
| 157.179 | 47.94 | -4.69 | 11 | 15.7 | 5.00 | 10.0 | 7.0 | 0.056 (0.005) | 0.30 (0.06) |
| 157.246 | 36.34 | -4.68 | 9 | 15.6 | 4.00 | 11.0 | 8.0 | 0.079 (0.005) | 0.41 (0.08) |
| 157.271 | 15.45 | -4.66 | 3 | 15.6 | -6.00 | 12.0 | 8.0 | 0.396 (0.006) | 2.30 (0.46) |
| 157.272 | 27.05 | -4.67 | 7 | 15.6 | -3.00 | 15.0 | 8.0 | 0.153 (0.006) | 2.22 (0.45) |
| 157.276 | 20.09 | -4.66 | 5 | 15.6 | 4.00 | 22.0 | 8.0 | 0.243 (0.005) | 2.19 (0.44) |
| 165.050 | 23.37 | -4.63 | 3 | 14.9 | 6.00 | 9.0 | 8.0 | 0.164 (0.012) | 0.52 (0.11) |
| 165.061 | 28.01 | -4.63 | 5 | 14.9 | 5.00 | 9.0 | 8.0 | 0.153 (0.011) | 0.48 (0.10) |
| 165.099 | 34.98 | -4.63 | 7 | 14.9 | 5.00 | 10.0 | 8.0 | 0.135 (0.012) | 0.68 (0.14) |
| 165.190 | 44.26 | -4.63 | 9 | 14.9 | 6.00 | 9.0 | 7.0 | 0.094 (0.011) | 0.34 (0.08) |
| 165.369 | 55.87 | -4.64 | 11 | 14.9 | 6.00 | 9.0 | 8.0 | 0.073 (0.012) | 0.37 (0.08) |
| 165.679 | 69.80 | -4.64 | 13 | 14.8 | 6.00 | 8.0 | 7.0 | 0.076 (0.013) | 0.32 (0.08) |
| 166.169 | 86.05 | -4.64 | 15 | 14.8 | 5.00 | 9.0 | 8.0 | 0.052 (0.010) | 0.24 (0.06) |
| 166.899 | 104.62 | -4.64 | 17 | 14.7 | - | - | - | - (0.011) | 0.09 (0.04) |
| 167.931 | 125.52 | -4.64 | 19 | 14.6 | - | - | - | - (0.012) | 0.03 (0.04) |
| 168.578 | 44.26 | -5.36 | 9 | 14.6 | - | - | - | - (0.007) | 0.01 (0.02) |
| 169.335 | 148.73 | -4.64 | 21 | 14.5 | - | - | - | - (0.007) | 0.03 (0.02) |
| 170.061 | 36.17 | -4.59 | 7 | 14.5 | 3.00 | 12.0 | 8.0 | 0.333 (0.008) | 1.22 (0.25) |
| 172.446 | 78.08 | -4.94 | 15 | 14.3 | 6.00 | 8.0 | 7.0 | 0.031 (0.009) | 0.13 (0.04) |
| Frequency | Eu | log(Aij) | gu | Vmin | Vmax | Vpeak | Tpeak | ||
|---|---|---|---|---|---|---|---|---|---|
| GHz | K | ” | K | ||||||
| 96.739 | 12.54 | -5.59 | 5 | 25.4 | -19.00 | 9.0 | 6.0 | 0.824 (0.019) | 19.74 (3.95) |
| 96.741 | 6.97 | -5.47 | 5 | 25.4 | -13.00 | 15.0 | 6.0 | 1.336 (0.021) | 19.60 (3.92) |
| 96.745 | 20.09 | -5.47 | 5 | 25.4 | -3.00 | 25.0 | 6.0 | 0.501 (0.022) | 19.98 (4.00) |
| 96.756 | 28.01 | -5.58 | 5 | 25.4 | -4.00 | 9.0 | 6.0 | 0.113 (0.005) | 0.83 (0.17) |
| 97.583 | 21.56 | -5.58 | 5 | 25.2 | -4.00 | 9.0 | 6.0 | 0.177 (0.005) | 1.35 (0.27) |
| 99.611 | 61.85 | -9.83 | 13 | 24.7 | - | - | - | - (0.005) | 0.04 (0.03) |
| 101.097 | 39.83 | -8.89 | 7 | 24.3 | - | - | - | - (0.005) | -0.04 (0.03) |
| 101.102 | 49.11 | -8.40 | 9 | 24.3 | - | - | - | - (0.004) | -0.01 (0.02) |
| 101.103 | 32.86 | -9.59 | 5 | 24.3 | - | - | - | - (0.005) | 0.02 (0.02) |
| 101.127 | 60.73 | -8.02 | 11 | 24.3 | - | - | - | - (0.005) | -0.03 (0.03) |
| 101.185 | 74.66 | -7.70 | 13 | 24.3 | - | - | - | - (0.004) | -0.01 (0.02) |
| 101.293 | 90.91 | -7.43 | 15 | 24.3 | - | - | - | - (0.004) | 0.01 (0.02) |
| 101.470 | 109.49 | -7.19 | 17 | 24.2 | - | - | - | - (0.005) | 0.02 (0.03) |
| 101.737 | 130.40 | -6.97 | 19 | 24.2 | - | - | - | - (0.004) | 0.01 (0.02) |
| 155.321 | 140.60 | -4.81 | 21 | 15.8 | - | - | - | - (0.006) | 0.05 (0.03) |
| 155.998 | 117.46 | -4.78 | 19 | 15.8 | - | - | - | - (0.006) | 0.08 (0.04) |
| 156.128 | 86.47 | -5.17 | 13 | 15.8 | - | - | - | - (0.004) | 0.04 (0.02) |
| 156.489 | 96.61 | -4.75 | 17 | 15.7 | - | - | - | - (0.006) | 0.08 (0.04) |
| 156.602 | 21.44 | -5.05 | 10 | 15.7 | -1.00 | 8.0 | 6.0 | 0.041 (0.005) | 0.29 (0.06) |
| 156.829 | 78.08 | -4.73 | 15 | 15.7 | -2.00 | 8.0 | 4.0 | 0.044 (0.005) | 0.49 (0.10) |
| 157.049 | 61.85 | -4.71 | 13 | 15.7 | -5.00 | 9.0 | 6.0 | 0.063 (0.005) | 0.67 (0.14) |
| 157.179 | 47.94 | -4.69 | 11 | 15.7 | -5.00 | 9.0 | 6.0 | 0.087 (0.004) | 1.00 (0.20) |
| 157.246 | 36.34 | -4.68 | 9 | 15.6 | -6.00 | 9.0 | 6.0 | 0.112 (0.005) | 1.17 (0.24) |
| 157.271 | 15.45 | -4.66 | 3 | 15.6 | -15.00 | 9.0 | 4.0 | 0.264 (0.006) | 5.18 (1.04) |
| 157.272 | 27.05 | -4.67 | 7 | 15.6 | -14.00 | 12.0 | 6.0 | 0.237 (0.005) | 5.12 (1.02) |
| 157.276 | 20.09 | -4.66 | 5 | 15.6 | -7.00 | 19.0 | 6.0 | 0.240 (0.005) | 5.12 (1.02) |
| 159.030 | 133.15 | -8.80 | 21 | 15.5 | - | - | - | - (0.005) | -0.02 (0.02) |
| 165.050 | 23.37 | -4.63 | 3 | 14.9 | -4.00 | 9.0 | 6.0 | 0.141 (0.007) | 1.53 (0.31) |
| 165.061 | 28.01 | -4.63 | 5 | 14.9 | -5.00 | 9.0 | 6.0 | 0.189 (0.007) | 1.92 (0.39) |
| 165.099 | 34.98 | -4.63 | 7 | 14.9 | -4.00 | 9.0 | 6.0 | 0.194 (0.008) | 1.70 (0.34) |
| 165.190 | 44.26 | -4.63 | 9 | 14.9 | -4.00 | 8.0 | 6.0 | 0.182 (0.010) | 1.60 (0.32) |
| 165.369 | 55.87 | -4.64 | 11 | 14.9 | -4.00 | 8.0 | 6.0 | 0.150 (0.008) | 1.17 (0.24) |
| 165.679 | 69.80 | -4.64 | 13 | 14.8 | -1.00 | 9.0 | 6.0 | 0.087 (0.008) | 0.73 (0.15) |
| 165.934 | 117.46 | -8.71 | 19 | 14.8 | - | - | - | - (0.009) | -0.01 (0.05) |
| 166.169 | 86.05 | -4.64 | 15 | 14.8 | 0.00 | 8.0 | 5.0 | 0.059 (0.008) | 0.60 (0.13) |
| 166.899 | 104.62 | -4.64 | 17 | 14.7 | 2.00 | 9.0 | 6.0 | 0.040 (0.008) | 0.44 (0.10) |
| Frequency | Eu | log(Aij) | gu | Vmin | Vmax | Vpeak | Tpeak | ||
|---|---|---|---|---|---|---|---|---|---|
| GHz | K | ” | K | ||||||
| 167.931 | 125.52 | -4.64 | 19 | 14.6 | 3.00 | 5.0 | 4.0 | 0.019 (0.005) | 0.11 (0.03) |
| 168.464 | 112.71 | -7.91 | 15 | 14.6 | - | - | - | - (0.005) | -0.01 (0.03) |
| 168.578 | 44.26 | -5.36 | 9 | 14.6 | 3.00 | 6.0 | 4.0 | 0.028 (0.006) | 0.28 (0.07) |
| 169.335 | 148.73 | -4.64 | 21 | 14.5 | - | - | - | - (0.007) | 0.05 (0.04) |
| 170.061 | 36.17 | -4.59 | 7 | 14.5 | -5.00 | 9.0 | 6.0 | 0.341 (0.007) | 3.63 (0.73) |
| 172.446 | 78.08 | -4.94 | 15 | 14.3 | 4.00 | 7.0 | 6.0 | 0.036 (0.009) | 0.45 (0.10) |
| Frequency | Eu | log(Aij) | gu | Vmin | Vmax | Vpeak | Tpeak | ||
|---|---|---|---|---|---|---|---|---|---|
| GHz | K | ” | K | ||||||
| 96.739 | 12.54 | -5.59 | 5 | 25.4 | -4.00 | 18.0 | 17.0 | 0.030 (0.007) | 1.55 (0.31) |
| 96.741 | 6.97 | -5.47 | 5 | 25.4 | 2.00 | 25.0 | 17.0 | 0.065 (0.005) | 1.49 (0.30) |
| 96.745 | 20.09 | -5.47 | 5 | 25.4 | 12.00 | 34.0 | 17.0 | 0.054 (0.006) | 1.45 (0.29) |
| 96.756 | 28.01 | -5.58 | 5 | 25.4 | - | - | - | - (0.006) | -0.03 (0.02) |
| 97.583 | 21.56 | -5.58 | 5 | 25.2 | - | - | - | - (0.008) | 0.00 (0.02) |
| 155.321 | 140.60 | -4.81 | 21 | 15.8 | - | - | - | - (0.004) | 0.02 (0.01) |
| 155.998 | 117.46 | -4.78 | 19 | 15.8 | - | - | - | - (0.003) | -0.00 (0.01) |
| 156.128 | 86.47 | -5.17 | 13 | 15.8 | - | - | - | - (0.004) | 0.02 (0.01) |
| 156.489 | 96.61 | -4.75 | 17 | 15.7 | - | - | - | - (0.004) | 0.02 (0.01) |
| 156.602 | 21.44 | -5.05 | 10 | 15.7 | - | - | - | - (0.003) | -0.02 (0.01) |
| 156.829 | 78.08 | -4.73 | 15 | 15.7 | - | - | - | - (0.003) | 0.02 (0.01) |
| 157.049 | 61.85 | -4.71 | 13 | 15.7 | - | - | - | - (0.003) | 0.00 (0.01) |
| 157.179 | 47.94 | -4.69 | 11 | 15.7 | - | - | - | - (0.003) | -0.00 (0.01) |
| 157.246 | 36.34 | -4.68 | 9 | 15.6 | - | - | - | - (0.004) | 0.02 (0.01) |
| 157.271 | 15.45 | -4.66 | 3 | 15.6 | - | - | - | - (0.004) | 0.08 (0.02) |
| 157.272 | 27.05 | -4.67 | 7 | 15.6 | - | - | - | - (0.004) | 0.06 (0.02) |
| 157.276 | 20.09 | -4.66 | 5 | 15.6 | - | - | - | - (0.004) | 0.05 (0.02) |
| 165.050 | 23.37 | -4.63 | 3 | 14.9 | - | - | - | - (0.009) | 0.03 (0.03) |
| 165.061 | 28.01 | -4.63 | 5 | 14.9 | - | - | - | - (0.009) | -0.04 (0.03) |
| 165.099 | 34.98 | -4.63 | 7 | 14.9 | - | - | - | - (0.010) | 0.01 (0.03) |
| 165.190 | 44.26 | -4.63 | 9 | 14.9 | - | - | - | - (0.010) | 0.05 (0.03) |
| 165.369 | 55.87 | -4.64 | 11 | 14.9 | - | - | - | - (0.008) | 0.02 (0.03) |
| 165.679 | 69.80 | -4.64 | 13 | 14.8 | - | - | - | - (0.011) | -0.01 (0.03) |
| 166.169 | 86.05 | -4.64 | 15 | 14.8 | - | - | - | - (0.010) | -0.02 (0.03) |
| 166.899 | 104.62 | -4.64 | 17 | 14.7 | - | - | - | - (0.011) | 0.02 (0.03) |
| 167.931 | 125.52 | -4.64 | 19 | 14.6 | - | - | - | - (0.005) | -0.02 (0.02) |
| 168.578 | 44.26 | -5.36 | 9 | 14.6 | - | - | - | - (0.004) | 0.02 (0.01) |
| 169.335 | 148.73 | -4.64 | 21 | 14.5 | - | - | - | - (0.004) | 0.01 (0.01) |
| 170.061 | 36.17 | -4.59 | 7 | 14.5 | - | - | - | - (0.004) | 0.03 (0.02) |
| 172.446 | 78.08 | -4.94 | 15 | 14.3 | - | - | - | - (0.007) | -0.01 (0.02) |
| Frequency | Eu | log(Aij) | gu | Vmin | Vmax | Vpeak | Tpeak | ||
|---|---|---|---|---|---|---|---|---|---|
| GHz | K | ” | K | ||||||
| 96.739 | 12.54 | -5.59 | 5 | 25.4 | -20.00 | 7.0 | 2.0 | 2.659 (0.004) | 30.36 (6.07) |
| 96.741 | 6.97 | -5.47 | 5 | 25.4 | -14.00 | 14.0 | 2.0 | 3.378 (0.004) | 30.38 (6.08) |
| 96.745 | 20.09 | -5.47 | 5 | 25.4 | -4.00 | 23.0 | 2.0 | 0.699 (0.005) | 30.40 (6.08) |
| 96.756 | 28.01 | -5.58 | 5 | 25.4 | -3.00 | 4.0 | 2.0 | 0.192 (0.005) | 0.65 (0.13) |
| 97.583 | 21.56 | -5.58 | 5 | 25.2 | -3.00 | 5.0 | 2.0 | 0.307 (0.004) | 1.12 (0.22) |
| 155.321 | 140.60 | -4.81 | 21 | 15.8 | - | - | - | - (0.004) | 0.01 (0.01) |
| 155.998 | 117.46 | -4.78 | 19 | 15.8 | 0.00 | 4.0 | 2.0 | 0.018 (0.003) | 0.07 (0.02) |
| 156.128 | 86.47 | -5.17 | 13 | 15.8 | - | - | - | - (0.004) | -0.00 (0.01) |
| 156.489 | 96.61 | -4.75 | 17 | 15.7 | 0.00 | 4.0 | 2.0 | 0.027 (0.004) | 0.11 (0.03) |
| 156.602 | 21.44 | -5.05 | 10 | 15.7 | - | - | - | - (0.003) | -0.03 (0.01) |
| 156.829 | 78.08 | -4.73 | 15 | 15.7 | -2.00 | 5.0 | 2.0 | 0.068 (0.003) | 0.26 (0.05) |
| 157.049 | 61.85 | -4.71 | 13 | 15.7 | -3.00 | 5.0 | 2.0 | 0.109 (0.003) | 0.46 (0.09) |
| 157.179 | 47.94 | -4.69 | 11 | 15.7 | -3.00 | 5.0 | 2.0 | 0.178 (0.003) | 0.75 (0.15) |
| 157.246 | 36.34 | -4.68 | 9 | 15.6 | -3.00 | 5.0 | 2.0 | 0.237 (0.003) | 1.12 (0.22) |
| 157.271 | 15.45 | -4.66 | 3 | 15.6 | -14.00 | 6.0 | 2.0 | 0.580 (0.003) | 5.69 (1.14) |
| 157.272 | 27.05 | -4.67 | 7 | 15.6 | -11.00 | 9.0 | 3.0 | 0.396 (0.003) | 5.72 (1.14) |
| 157.276 | 20.09 | -4.66 | 5 | 15.6 | -4.00 | 16.0 | 2.0 | 0.380 (0.003) | 5.71 (1.14) |
| 165.050 | 23.37 | -4.63 | 3 | 14.9 | -3.00 | 5.0 | 2.0 | 0.312 (0.008) | 1.29 (0.26) |
| 165.061 | 28.01 | -4.63 | 5 | 14.9 | -2.00 | 5.0 | 2.0 | 0.380 (0.007) | 1.52 (0.30) |
| 165.099 | 34.98 | -4.63 | 7 | 14.9 | -3.00 | 5.0 | 2.0 | 0.332 (0.008) | 1.27 (0.26) |
| 165.190 | 44.26 | -4.63 | 9 | 14.9 | -3.00 | 5.0 | 2.0 | 0.282 (0.008) | 1.04 (0.21) |
| 165.369 | 55.87 | -4.64 | 11 | 14.9 | -2.00 | 4.0 | 2.0 | 0.184 (0.008) | 0.64 (0.13) |
| 165.679 | 69.80 | -4.64 | 13 | 14.8 | -1.00 | 4.0 | 2.0 | 0.097 (0.008) | 0.38 (0.08) |
| 166.169 | 86.05 | -4.64 | 15 | 14.8 | 0.00 | 4.0 | 2.0 | 0.060 (0.008) | 0.19 (0.05) |
| 166.899 | 104.62 | -4.64 | 17 | 14.7 | 0.00 | 3.0 | 1.0 | 0.034 (0.007) | 0.10 (0.03) |
| 167.931 | 125.52 | -4.64 | 19 | 14.6 | - | - | - | - (0.005) | 0.05 (0.02) |
| 168.578 | 44.26 | -5.36 | 9 | 14.6 | -1.00 | 4.0 | 2.0 | 0.065 (0.005) | 0.24 (0.05) |
| 169.335 | 148.73 | -4.64 | 21 | 14.5 | - | - | - | - (0.005) | 0.03 (0.01) |
| 170.061 | 36.17 | -4.59 | 7 | 14.5 | -3.00 | 5.0 | 2.0 | 1.217 (0.004) | 4.27 (0.85) |
| 172.446 | 78.08 | -4.94 | 15 | 14.3 | -1.00 | 4.0 | 2.0 | 0.086 (0.007) | 0.32 (0.07) |
| Frequency | Eu | log(Aij) | gu | Vmin | Vmax | Vpeak | Tpeak | ||
|---|---|---|---|---|---|---|---|---|---|
| GHz | K | ” | K | ||||||
| 155.321 | 140.60 | -4.81 | 21 | 15.8 | - | - | - | - (0.007) | 0.02 (0.01) |
| 155.998 | 117.46 | -4.78 | 19 | 15.8 | - | - | - | - (0.006) | -0.01 (0.01) |
| 156.128 | 86.47 | -5.17 | 13 | 15.8 | - | - | - | - (0.007) | 0.01 (0.01) |
| 156.489 | 96.61 | -4.75 | 17 | 15.7 | - | - | - | - (0.004) | -0.01 (0.01) |
| 156.602 | 21.44 | -5.05 | 10 | 15.7 | - | - | - | - (0.004) | 0.00 (0.01) |
| 156.829 | 78.08 | -4.73 | 15 | 15.7 | - | - | - | - (0.005) | -0.01 (0.01) |
| 157.049 | 61.85 | -4.71 | 13 | 15.7 | - | - | - | - (0.004) | -0.00 (0.01) |
| 157.179 | 47.94 | -4.69 | 11 | 15.7 | - | - | - | - (0.004) | -0.00 (0.01) |
| 157.246 | 36.34 | -4.68 | 9 | 15.6 | - | - | - | - (0.005) | 0.01 (0.01) |
| 157.271 | 15.45 | -4.66 | 3 | 15.6 | - | - | - | - (0.004) | 0.17 (0.04) |
| 157.272 | 27.05 | -4.67 | 7 | 15.6 | 6.00 | 9.0 | 7.0 | 0.052 (0.004) | 0.18 (0.04) |
| 157.276 | 20.09 | -4.66 | 5 | 15.6 | - | - | - | - (0.004) | 0.16 (0.03) |
| 168.578 | 44.26 | -5.36 | 9 | 14.6 | - | - | - | - (0.006) | -0.01 (0.01) |
| 169.335 | 148.73 | -4.64 | 21 | 14.5 | - | - | - | - (0.006) | 0.01 (0.01) |
| 170.061 | 36.17 | -4.59 | 7 | 14.5 | - | - | - | - (0.007) | -0.02 (0.01) |
| 172.446 | 78.08 | -4.94 | 15 | 14.3 | - | - | - | - (0.007) | 0.00 (0.01) |
| Frequency | Eu | log(Aij) | gu | Vmin | Vmax | Vpeak | Tpeak | ||
|---|---|---|---|---|---|---|---|---|---|
| GHz | K | ” | K | ||||||
| 96.274 | 22.93 | -4.60 | 22 | 25.6 | - | - | - | - (0.007) | 0.06 (0.02) |
| 96.343 | 50.06 | -4.97 | 22 | 25.5 | - | - | - | - (0.006) | -0.02 (0.02) |
| 96.343 | 50.06 | -4.97 | 22 | 25.5 | - | - | - | - (0.006) | -0.02 (0.02) |
| 96.353 | 49.99 | -4.97 | 22 | 25.5 | - | - | - | - (0.006) | -0.02 (0.02) |
| 96.361 | 49.95 | -4.97 | 22 | 25.5 | - | - | - | - (0.006) | -0.00 (0.02) |
| 96.368 | 34.26 | -4.72 | 22 | 25.5 | - | - | - | - (0.007) | 0.03 (0.02) |
| 96.368 | 34.26 | -4.72 | 22 | 25.5 | - | - | - | - (0.006) | 0.02 (0.02) |
| 96.372 | 34.26 | -4.72 | 22 | 25.5 | - | - | - | - (0.006) | 0.01 (0.02) |
| 96.384 | 34.16 | -4.72 | 22 | 25.5 | - | - | - | - (0.006) | 0.03 (0.02) |
| 96.426 | 22.91 | -4.60 | 22 | 25.5 | 6.00 | 8.0 | 7.0 | 0.028 (0.005) | 0.09 (0.02) |
| 96.476 | 23.03 | -4.60 | 22 | 25.5 | - | - | - | - (0.006) | 0.03 (0.02) |
| 96.633 | 22.96 | -4.60 | 22 | 25.5 | 6.00 | 9.0 | 7.0 | 0.019 (0.005) | 0.09 (0.02) |
| 98.863 | 16.59 | -4.51 | 22 | 24.9 | 6.00 | 13.0 | 7.0 | 0.058 (0.005) | 0.27 (0.06) |
| 98.901 | 16.51 | -4.51 | 22 | 24.9 | 6.00 | 12.0 | 8.0 | 0.052 (0.006) | 0.27 (0.06) |
| 152.635 | 33.10 | -3.91 | 34 | 16.1 | 6.00 | 12.0 | 7.0 | 0.048 (0.005) | 0.27 (0.06) |
| 153.004 | 28.48 | -4.97 | 26 | 16.1 | - | - | - | - (0.005) | 0.00 (0.01) |
| 153.873 | 42.33 | -3.93 | 34 | 16.0 | 6.00 | 9.0 | 8.0 | 0.030 (0.005) | 0.12 (0.03) |
| 154.027 | 42.33 | -3.93 | 34 | 16.0 | 6.00 | 8.0 | 7.0 | 0.024 (0.006) | 0.09 (0.02) |
| 154.161 | 89.76 | -4.11 | 34 | 16.0 | - | - | - | - (0.005) | -0.01 (0.01) |
| 154.161 | 89.76 | -4.11 | 34 | 16.0 | - | - | - | - (0.005) | -0.01 (0.01) |
| 154.183 | 89.69 | -4.11 | 34 | 16.0 | - | - | - | - (0.006) | -0.02 (0.02) |
| 154.189 | 89.65 | -4.11 | 34 | 16.0 | - | - | - | - (0.018) | -0.00 (0.05) |
| 154.201 | 69.48 | -4.02 | 34 | 16.0 | - | - | - | - (0.021) | 0.02 (0.06) |
| 154.201 | 69.48 | -4.02 | 34 | 16.0 | - | - | - | - (0.021) | 0.03 (0.06) |
| 154.230 | 69.38 | -4.02 | 34 | 16.0 | - | - | - | - (0.021) | 0.04 (0.06) |
| 154.275 | 53.69 | -3.96 | 34 | 15.9 | - | - | - | - (0.006) | 0.04 (0.02) |
| 154.296 | 53.69 | -3.96 | 34 | 15.9 | - | - | - | - (0.006) | 0.06 (0.02) |
| 154.322 | 53.60 | -3.96 | 34 | 15.9 | - | - | - | - (0.005) | 0.06 (0.02) |
| 154.323 | 53.69 | -3.96 | 34 | 15.9 | - | - | - | - (0.006) | 0.07 (0.02) |
| 155.180 | 42.54 | -3.92 | 34 | 15.9 | 6.00 | 11.0 | 7.0 | 0.035 (0.005) | 0.11 (0.03) |
| 155.342 | 42.50 | -3.91 | 34 | 15.8 | 6.00 | 9.0 | 8.0 | 0.030 (0.005) | 0.15 (0.03) |
| 156.807 | 34.94 | -4.94 | 30 | 15.7 | - | - | - | - (0.005) | 0.01 (0.01) |
| 157.938 | 36.50 | -3.87 | 34 | 15.6 | 6.00 | 14.0 | 7.0 | 0.050 (0.006) | 0.30 (0.06) |
| 157.975 | 36.43 | -3.87 | 34 | 15.6 | 6.00 | 12.0 | 7.0 | 0.055 (0.005) | 0.25 (0.05) |
| 159.692 | 42.33 | -4.95 | 34 | 15.4 | - | - | - | - (0.006) | 0.01 (0.02) |
| 161.172 | 42.33 | -4.91 | 34 | 15.3 | - | - | - | - (0.007) | 0.06 (0.02) |
| Frequency | Eu | log(Aij) | gu | Vmin | Vmax | Vpeak | Tpeak | ||
|---|---|---|---|---|---|---|---|---|---|
| GHz | K | ” | K | ||||||
| 162.044 | 50.44 | -4.79 | 42 | 15.2 | - | - | - | - (0.008) | 0.00 (0.02) |
| 164.727 | 50.64 | -4.90 | 38 | 14.9 | - | - | - | - (0.008) | -0.02 (0.02) |
| 167.981 | 27.42 | -4.74 | 30 | 14.6 | - | - | - | - (0.006) | 0.04 (0.02) |
| 168.089 | 42.73 | -3.79 | 38 | 14.6 | 6.00 | 13.0 | 9.0 | 0.031 (0.006) | 0.20 (0.04) |
| 168.093 | 42.66 | -3.79 | 38 | 14.6 | 6.00 | 10.0 | 7.0 | 0.031 (0.006) | 0.11 (0.03) |
| 170.293 | 59.86 | -4.86 | 42 | 14.4 | - | - | - | - (0.008) | -0.03 (0.02) |
| 171.265 | 41.42 | -3.76 | 38 | 14.4 | 6.00 | 9.0 | 8.0 | 0.048 (0.009) | 0.20 (0.05) |
| 171.297 | 41.32 | -3.76 | 38 | 14.4 | 6.00 | 9.0 | 8.0 | 0.050 (0.009) | 0.21 (0.05) |
| 171.606 | 59.85 | -4.84 | 42 | 14.3 | - | - | - | - (0.008) | 0.00 (0.02) |
| 173.026 | 50.63 | -3.77 | 38 | 14.2 | 7.00 | 9.0 | 8.0 | 0.042 (0.010) | 0.15 (0.04) |
| 173.124 | 50.64 | -3.77 | 38 | 14.2 | 7.00 | 9.0 | 8.0 | 0.033 (0.009) | 0.13 (0.04) |
| 173.446 | 98.09 | -3.90 | 38 | 14.2 | - | - | - | - (0.009) | 0.01 (0.02) |
| 173.446 | 98.09 | -3.90 | 38 | 14.2 | - | - | - | - (0.009) | 0.01 (0.02) |
| 173.470 | 98.01 | -3.90 | 38 | 14.2 | - | - | - | - (0.010) | 0.05 (0.03) |
| 173.476 | 97.98 | -3.90 | 38 | 14.2 | - | - | - | - (0.013) | -0.02 (0.04) |
| 173.519 | 77.75 | -3.83 | 38 | 14.2 | - | - | - | - (0.018) | 0.07 (0.05) |
| 173.534 | 77.70 | -3.83 | 38 | 14.2 | - | - | - | - (0.012) | 0.00 (0.03) |
| 173.595 | 62.02 | -3.79 | 38 | 14.2 | - | - | - | - (0.010) | 0.04 (0.03) |
| 173.638 | 62.03 | -3.79 | 38 | 14.2 | - | - | - | - (0.014) | 0.07 (0.04) |
| 173.664 | 61.93 | -3.79 | 38 | 14.2 | - | - | - | - (0.012) | 0.07 (0.04) |
| 174.982 | 50.94 | -3.75 | 38 | 14.1 | - | - | - | - (0.011) | 0.16 (0.05) |
| 175.091 | 50.91 | -3.75 | 38 | 14.0 | - | - | - | - (0.011) | 0.10 (0.04) |
| Frequency | Eu | log(Aij) | gu | Vmin | Vmax | Vpeak | Tpeak | ||
|---|---|---|---|---|---|---|---|---|---|
| GHz | K | ” | K | ||||||
| 152.635 | 33.10 | -3.91 | 34 | 16.1 | - | - | - | - (0.005) | 0.03 (0.02) |
| 153.004 | 28.48 | -4.97 | 26 | 16.1 | - | - | - | - (0.006) | -0.01 (0.02) |
| 153.873 | 42.33 | -3.93 | 34 | 16.0 | - | - | - | - (0.006) | -0.05 (0.03) |
| 154.027 | 42.33 | -3.93 | 34 | 16.0 | - | - | - | - (0.006) | 0.06 (0.03) |
| 154.161 | 89.76 | -4.11 | 34 | 16.0 | - | - | - | - (0.005) | -0.01 (0.02) |
| 154.161 | 89.76 | -4.11 | 34 | 16.0 | - | - | - | - (0.005) | -0.01 (0.02) |
| 154.183 | 89.69 | -4.11 | 34 | 16.0 | - | - | - | - (0.005) | -0.03 (0.02) |
| 154.189 | 89.65 | -4.11 | 34 | 16.0 | - | - | - | - (0.006) | -0.01 (0.02) |
| 154.201 | 69.48 | -4.02 | 34 | 16.0 | - | - | - | - (0.006) | -0.02 (0.03) |
| 154.201 | 69.48 | -4.02 | 34 | 16.0 | - | - | - | - (0.006) | -0.00 (0.03) |
| 154.230 | 69.38 | -4.02 | 34 | 16.0 | - | - | - | - (0.004) | -0.02 (0.02) |
| 154.275 | 53.69 | -3.96 | 34 | 15.9 | - | - | - | - (0.005) | 0.00 (0.02) |
| 154.296 | 53.69 | -3.96 | 34 | 15.9 | - | - | - | - (0.005) | 0.02 (0.02) |
| 154.322 | 53.60 | -3.96 | 34 | 15.9 | - | - | - | - (0.004) | 0.00 (0.02) |
| 154.323 | 53.69 | -3.96 | 34 | 15.9 | - | - | - | - (0.005) | 0.01 (0.02) |
| 155.180 | 42.54 | -3.92 | 34 | 15.9 | - | - | - | - (0.006) | 0.01 (0.02) |
| 155.342 | 42.50 | -3.91 | 34 | 15.8 | - | - | - | - (0.005) | 0.01 (0.02) |
| 156.807 | 34.94 | -4.94 | 30 | 15.7 | - | - | - | - (0.006) | -0.00 (0.03) |
| 157.938 | 36.50 | -3.87 | 34 | 15.6 | - | - | - | - (0.004) | 0.04 (0.02) |
| 157.975 | 36.43 | -3.87 | 34 | 15.6 | - | - | - | - (0.005) | -0.01 (0.02) |
| 159.692 | 42.33 | -4.95 | 34 | 15.4 | - | - | - | - (0.004) | 0.02 (0.02) |
| 167.981 | 27.42 | -4.74 | 30 | 14.6 | - | - | - | - (0.005) | 0.03 (0.02) |
| 168.089 | 42.73 | -3.79 | 38 | 14.6 | - | - | - | - (0.006) | 0.02 (0.03) |
| 168.093 | 42.66 | -3.79 | 38 | 14.6 | - | - | - | - (0.006) | 0.04 (0.03) |
| 170.293 | 59.86 | -4.86 | 42 | 14.4 | - | - | - | - (0.006) | 0.03 (0.03) |
| 171.265 | 41.42 | -3.76 | 38 | 14.4 | - | - | - | - (0.007) | -0.02 (0.03) |
| 171.297 | 41.32 | -3.76 | 38 | 14.4 | - | - | - | - (0.008) | -0.04 (0.03) |
| 171.606 | 59.85 | -4.84 | 42 | 14.3 | - | - | - | - (0.007) | 0.03 (0.03) |
| 173.124 | 50.64 | -3.77 | 38 | 14.2 | - | - | - | - (0.009) | 0.01 (0.04) |
| 173.446 | 98.09 | -3.90 | 38 | 14.2 | - | - | - | - (0.010) | 0.02 (0.04) |
| 173.446 | 98.09 | -3.90 | 38 | 14.2 | - | - | - | - (0.010) | 0.02 (0.04) |
| 173.470 | 98.01 | -3.90 | 38 | 14.2 | - | - | - | - (0.010) | -0.08 (0.05) |
| 173.476 | 97.98 | -3.90 | 38 | 14.2 | - | - | - | - (0.008) | -0.01 (0.03) |
| 173.519 | 77.75 | -3.83 | 38 | 14.2 | - | - | - | - (0.009) | 0.01 (0.04) |
| 173.534 | 77.70 | -3.83 | 38 | 14.2 | - | - | - | - (0.008) | 0.02 (0.04) |
| 173.595 | 62.02 | -3.79 | 38 | 14.2 | - | - | - | - (0.009) | 0.01 (0.04) |
| Frequency | Eu | log(Aij) | gu | Vmin | Vmax | Vpeak | Tpeak | ||
|---|---|---|---|---|---|---|---|---|---|
| GHz | K | ” | K | ||||||
| 173.638 | 62.03 | -3.79 | 38 | 14.2 | - | - | - | - (0.009) | 0.01 (0.04) |
| 173.664 | 61.93 | -3.79 | 38 | 14.2 | - | - | - | - (0.009) | 0.07 (0.04) |
| 174.982 | 50.94 | -3.75 | 38 | 14.1 | - | - | - | - (0.012) | 0.04 (0.05) |
| 175.091 | 50.91 | -3.75 | 38 | 14.0 | - | - | - | - (0.011) | 0.06 (0.05) |
| Frequency | Eu | log(Aij) | gu | Vmin | Vmax | Vpeak | Tpeak | ||
|---|---|---|---|---|---|---|---|---|---|
| GHz | K | ” | K | ||||||
| 96.274 | 22.93 | -4.60 | 22 | 25.6 | - | - | - | - (0.006) | 0.02 (0.01) |
| 96.343 | 50.06 | -4.97 | 22 | 25.5 | - | - | - | - (0.006) | 0.00 (0.01) |
| 96.343 | 50.06 | -4.97 | 22 | 25.5 | - | - | - | - (0.006) | 0.00 (0.01) |
| 96.353 | 49.99 | -4.97 | 22 | 25.5 | - | - | - | - (0.007) | -0.00 (0.01) |
| 96.361 | 49.95 | -4.97 | 22 | 25.5 | - | - | - | - (0.007) | 0.01 (0.01) |
| 96.368 | 34.26 | -4.72 | 22 | 25.5 | - | - | - | - (0.007) | 0.02 (0.01) |
| 96.368 | 34.26 | -4.72 | 22 | 25.5 | - | - | - | - (0.007) | 0.00 (0.01) |
| 96.372 | 34.26 | -4.72 | 22 | 25.5 | - | - | - | - (0.007) | -0.02 (0.01) |
| 96.384 | 34.16 | -4.72 | 22 | 25.5 | - | - | - | - (0.007) | 0.00 (0.01) |
| 96.426 | 22.91 | -4.60 | 22 | 25.5 | - | - | - | - (0.008) | 0.05 (0.02) |
| 96.476 | 23.03 | -4.60 | 22 | 25.5 | - | - | - | - (0.006) | 0.03 (0.01) |
| 96.633 | 22.96 | -4.60 | 22 | 25.5 | - | - | - | - (0.007) | 0.00 (0.01) |
| 98.863 | 16.59 | -4.51 | 22 | 24.9 | 6.00 | 9.0 | 8.0 | 0.047 (0.006) | 0.10 (0.02) |
| 98.901 | 16.51 | -4.51 | 22 | 24.9 | 6.00 | 9.0 | 8.0 | 0.060 (0.006) | 0.12 (0.03) |
| 152.635 | 33.10 | -3.91 | 34 | 16.1 | - | - | - | - (0.005) | 0.03 (0.01) |
| 153.004 | 28.48 | -4.97 | 26 | 16.1 | - | - | - | - (0.005) | -0.00 (0.01) |
| 153.873 | 42.33 | -3.93 | 34 | 16.0 | - | - | - | - (0.006) | 0.03 (0.01) |
| 154.027 | 42.33 | -3.93 | 34 | 16.0 | - | - | - | - (0.005) | 0.01 (0.01) |
| 154.161 | 89.76 | -4.11 | 34 | 16.0 | - | - | - | - (0.006) | 0.01 (0.01) |
| 154.161 | 89.76 | -4.11 | 34 | 16.0 | - | - | - | - (0.006) | 0.01 (0.01) |
| 154.183 | 89.69 | -4.11 | 34 | 16.0 | - | - | - | - (0.005) | -0.00 (0.01) |
| 154.189 | 89.65 | -4.11 | 34 | 16.0 | - | - | - | - (0.005) | -0.01 (0.01) |
| 154.201 | 69.48 | -4.02 | 34 | 16.0 | - | - | - | - (0.005) | -0.00 (0.01) |
| 154.201 | 69.48 | -4.02 | 34 | 16.0 | - | - | - | - (0.005) | -0.00 (0.01) |
| 154.230 | 69.38 | -4.02 | 34 | 16.0 | - | - | - | - (0.005) | 0.01 (0.01) |
| 154.275 | 53.69 | -3.96 | 34 | 15.9 | - | - | - | - (0.005) | 0.00 (0.01) |
| 154.296 | 53.69 | -3.96 | 34 | 15.9 | - | - | - | - (0.005) | 0.01 (0.01) |
| 154.322 | 53.60 | -3.96 | 34 | 15.9 | - | - | - | - (0.005) | 0.02 (0.01) |
| 154.323 | 53.69 | -3.96 | 34 | 15.9 | - | - | - | - (0.006) | 0.02 (0.01) |
| 155.180 | 42.54 | -3.92 | 34 | 15.9 | - | - | - | - (0.005) | 0.00 (0.01) |
| 155.342 | 42.50 | -3.91 | 34 | 15.8 | - | - | - | - (0.006) | 0.02 (0.01) |
| 156.807 | 34.94 | -4.94 | 30 | 15.7 | - | - | - | - (0.006) | -0.03 (0.01) |
| 157.938 | 36.50 | -3.87 | 34 | 15.6 | 6.00 | 8.0 | 7.0 | 0.023 (0.006) | 0.05 (0.01) |
| 157.975 | 36.43 | -3.87 | 34 | 15.6 | - | - | - | - (0.005) | 0.03 (0.01) |
| 159.692 | 42.33 | -4.95 | 34 | 15.4 | - | - | - | - (0.005) | -0.01 (0.01) |
| 161.172 | 42.33 | -4.91 | 34 | 15.3 | - | - | - | - (0.009) | -0.02 (0.02) |
| Frequency | Eu | log(Aij) | gu | Vmin | Vmax | Vpeak | Tpeak | ||
|---|---|---|---|---|---|---|---|---|---|
| GHz | K | ” | K | ||||||
| 162.044 | 50.44 | -4.79 | 42 | 15.2 | - | - | - | - (0.008) | -0.00 (0.01) |
| 164.727 | 50.64 | -4.90 | 38 | 14.9 | - | - | - | - (0.011) | -0.01 (0.02) |
| 167.981 | 27.42 | -4.74 | 30 | 14.6 | - | - | - | - (0.011) | -0.02 (0.02) |
| 168.089 | 42.73 | -3.79 | 38 | 14.6 | - | - | - | - (0.012) | 0.00 (0.02) |
| 168.093 | 42.66 | -3.79 | 38 | 14.6 | - | - | - | - (0.010) | 0.04 (0.02) |
| 170.293 | 59.86 | -4.86 | 42 | 14.4 | - | - | - | - (0.007) | -0.01 (0.01) |
| 171.265 | 41.42 | -3.76 | 38 | 14.4 | - | - | - | - (0.008) | 0.02 (0.01) |
| 171.297 | 41.32 | -3.76 | 38 | 14.4 | - | - | - | - (0.008) | 0.02 (0.02) |
| 171.606 | 59.85 | -4.84 | 42 | 14.3 | - | - | - | - (0.008) | -0.01 (0.01) |
| 173.026 | 50.63 | -3.77 | 38 | 14.2 | - | - | - | - (0.008) | 0.02 (0.01) |
| 173.124 | 50.64 | -3.77 | 38 | 14.2 | - | - | - | - (0.009) | 0.03 (0.02) |
| 173.446 | 98.09 | -3.90 | 38 | 14.2 | - | - | - | - (0.008) | -0.01 (0.01) |
| 173.446 | 98.09 | -3.90 | 38 | 14.2 | - | - | - | - (0.008) | -0.01 (0.01) |
| 173.470 | 98.01 | -3.90 | 38 | 14.2 | - | - | - | - (0.008) | 0.02 (0.01) |
| 173.476 | 97.98 | -3.90 | 38 | 14.2 | - | - | - | - (0.008) | -0.02 (0.01) |
| 173.519 | 77.75 | -3.83 | 38 | 14.2 | - | - | - | - (0.009) | -0.02 (0.02) |
| 173.534 | 77.70 | -3.83 | 38 | 14.2 | - | - | - | - (0.009) | 0.00 (0.02) |
| 173.595 | 62.02 | -3.79 | 38 | 14.2 | - | - | - | - (0.007) | 0.01 (0.01) |
| 173.638 | 62.03 | -3.79 | 38 | 14.2 | - | - | - | - (0.008) | 0.01 (0.01) |
| 173.664 | 61.93 | -3.79 | 38 | 14.2 | - | - | - | - (0.008) | 0.01 (0.01) |
| 174.982 | 50.94 | -3.75 | 38 | 14.1 | - | - | - | - (0.010) | -0.01 (0.02) |
| 175.091 | 50.91 | -3.75 | 38 | 14.0 | - | - | - | - (0.010) | 0.02 (0.02) |
| Frequency | Eu | log(Aij) | gu | Vmin | Vmax | Vpeak | Tpeak | ||
|---|---|---|---|---|---|---|---|---|---|
| GHz | K | ” | K | ||||||
| 96.274 | 22.93 | -4.60 | 22 | 25.6 | - | - | - | - (0.006) | 0.10 (0.03) |
| 96.343 | 50.06 | -4.97 | 22 | 25.5 | - | - | - | - (0.006) | 0.02 (0.02) |
| 96.343 | 50.06 | -4.97 | 22 | 25.5 | - | - | - | - (0.006) | 0.02 (0.02) |
| 96.353 | 49.99 | -4.97 | 22 | 25.5 | - | - | - | - (0.006) | 0.03 (0.02) |
| 96.361 | 49.95 | -4.97 | 22 | 25.5 | - | - | - | - (0.005) | -0.02 (0.02) |
| 96.368 | 34.26 | -4.72 | 22 | 25.5 | - | - | - | - (0.005) | 0.08 (0.02) |
| 96.368 | 34.26 | -4.72 | 22 | 25.5 | - | - | - | - (0.006) | 0.05 (0.02) |
| 96.372 | 34.26 | -4.72 | 22 | 25.5 | - | - | - | - (0.006) | 0.01 (0.02) |
| 96.426 | 22.91 | -4.60 | 22 | 25.5 | - | - | - | - (0.007) | 0.09 (0.03) |
| 96.476 | 23.03 | -4.60 | 22 | 25.5 | 5.00 | 8.0 | 7.0 | 0.023 (0.005) | 0.12 (0.03) |
| 96.633 | 22.96 | -4.60 | 22 | 25.5 | 5.00 | 8.0 | 7.0 | 0.021 (0.005) | 0.11 (0.03) |
| 98.863 | 16.59 | -4.51 | 22 | 24.9 | 3.00 | 8.0 | 7.0 | 0.052 (0.005) | 0.25 (0.05) |
| 98.901 | 16.51 | -4.51 | 22 | 24.9 | 1.00 | 9.0 | 7.0 | 0.060 (0.005) | 0.35 (0.07) |
| 152.635 | 33.10 | -3.91 | 34 | 16.1 | 6.00 | 8.0 | 7.0 | 0.026 (0.005) | 0.12 (0.03) |
| 153.004 | 28.48 | -4.97 | 26 | 16.1 | - | - | - | - (0.005) | 0.02 (0.02) |
| 153.873 | 42.33 | -3.93 | 34 | 16.0 | - | - | - | - (0.006) | 0.06 (0.02) |
| 154.027 | 42.33 | -3.93 | 34 | 16.0 | - | - | - | - (0.006) | 0.09 (0.03) |
| 154.161 | 89.76 | -4.11 | 34 | 16.0 | - | - | - | - (0.006) | -0.03 (0.02) |
| 154.161 | 89.76 | -4.11 | 34 | 16.0 | - | - | - | - (0.006) | -0.03 (0.02) |
| 154.183 | 89.69 | -4.11 | 34 | 16.0 | - | - | - | - (0.006) | 0.03 (0.02) |
| 154.189 | 89.65 | -4.11 | 34 | 16.0 | - | - | - | - (0.006) | -0.05 (0.02) |
| 154.201 | 69.48 | -4.02 | 34 | 16.0 | - | - | - | - (0.005) | 0.01 (0.02) |
| 154.201 | 69.48 | -4.02 | 34 | 16.0 | - | - | - | - (0.005) | 0.03 (0.02) |
| 154.230 | 69.38 | -4.02 | 34 | 16.0 | - | - | - | - (0.005) | 0.00 (0.02) |
| 154.275 | 53.69 | -3.96 | 34 | 15.9 | - | - | - | - (0.006) | 0.07 (0.03) |
| 154.296 | 53.69 | -3.96 | 34 | 15.9 | - | - | - | - (0.005) | 0.02 (0.02) |
| 154.322 | 53.60 | -3.96 | 34 | 15.9 | - | - | - | - (0.005) | 0.04 (0.02) |
| 154.323 | 53.69 | -3.96 | 34 | 15.9 | - | - | - | - (0.005) | 0.02 (0.02) |
| 155.180 | 42.54 | -3.92 | 34 | 15.9 | - | - | - | - (0.006) | 0.08 (0.03) |
| 155.342 | 42.50 | -3.91 | 34 | 15.8 | - | - | - | - (0.006) | 0.05 (0.02) |
| 156.807 | 34.94 | -4.94 | 30 | 15.7 | - | - | - | - (0.005) | 0.02 (0.02) |
| 157.938 | 36.50 | -3.87 | 34 | 15.6 | 5.00 | 7.0 | 6.0 | 0.023 (0.005) | 0.12 (0.03) |
| 157.975 | 36.43 | -3.87 | 34 | 15.6 | 5.00 | 7.0 | 6.0 | 0.021 (0.005) | 0.10 (0.03) |
| 159.692 | 42.33 | -4.95 | 34 | 15.4 | - | - | - | - (0.005) | 0.02 (0.02) |
| 161.172 | 42.33 | -4.91 | 34 | 15.3 | - | - | - | - (0.005) | 0.03 (0.02) |
| 162.044 | 50.44 | -4.79 | 42 | 15.2 | - | - | - | - (0.007) | 0.01 (0.02) |
| Frequency | Eu | log(Aij) | gu | Vmin | Vmax | Vpeak | Tpeak | ||
|---|---|---|---|---|---|---|---|---|---|
| GHz | K | ” | K | ||||||
| 164.727 | 50.64 | -4.90 | 38 | 14.9 | - | - | - | - (0.009) | -0.03 (0.03) |
| 167.981 | 27.42 | -4.74 | 30 | 14.6 | - | - | - | - (0.004) | 0.01 (0.02) |
| 168.089 | 42.73 | -3.79 | 38 | 14.6 | 6.00 | 8.0 | 7.0 | 0.021 (0.005) | 0.14 (0.03) |
| 168.093 | 42.66 | -3.79 | 38 | 14.6 | 5.00 | 8.0 | 6.0 | 0.021 (0.005) | 0.08 (0.02) |
| 170.293 | 59.86 | -4.86 | 42 | 14.4 | - | - | - | - (0.008) | -0.03 (0.03) |
| 171.265 | 41.42 | -3.76 | 38 | 14.4 | - | - | - | - (0.009) | 0.11 (0.04) |
| 171.297 | 41.32 | -3.76 | 38 | 14.4 | - | - | - | - (0.008) | 0.06 (0.03) |
| 171.606 | 59.85 | -4.84 | 42 | 14.3 | - | - | - | - (0.007) | 0.00 (0.03) |
| 173.026 | 50.63 | -3.77 | 38 | 14.2 | - | - | - | - (0.010) | 0.09 (0.04) |
| 173.124 | 50.64 | -3.77 | 38 | 14.2 | - | - | - | - (0.010) | 0.06 (0.04) |
| 173.446 | 98.09 | -3.90 | 38 | 14.2 | - | - | - | - (0.009) | 0.07 (0.03) |
| 173.446 | 98.09 | -3.90 | 38 | 14.2 | - | - | - | - (0.009) | 0.07 (0.03) |
| 173.470 | 98.01 | -3.90 | 38 | 14.2 | - | - | - | - (0.010) | 0.06 (0.04) |
| 173.476 | 97.98 | -3.90 | 38 | 14.2 | - | - | - | - (0.010) | 0.04 (0.04) |
| 173.519 | 77.75 | -3.83 | 38 | 14.2 | - | - | - | - (0.010) | 0.02 (0.04) |
| 173.534 | 77.70 | -3.83 | 38 | 14.2 | - | - | - | - (0.011) | -0.06 (0.04) |
| 173.595 | 62.02 | -3.79 | 38 | 14.2 | - | - | - | - (0.009) | 0.05 (0.04) |
| 173.638 | 62.03 | -3.79 | 38 | 14.2 | - | - | - | - (0.009) | 0.07 (0.03) |
| 173.664 | 61.93 | -3.79 | 38 | 14.2 | - | - | - | - (0.010) | 0.01 (0.03) |
| 174.982 | 50.94 | -3.75 | 38 | 14.1 | - | - | - | - (0.011) | 0.03 (0.04) |
| 175.091 | 50.91 | -3.75 | 38 | 14.0 | - | - | - | - (0.014) | 0.03 (0.05) |
| Frequency | Eu | log(Aij) | gu | Vmin | Vmax | Vpeak | Tpeak | ||
|---|---|---|---|---|---|---|---|---|---|
| GHz | K | ” | K | ||||||
| 96.274 | 22.93 | -4.60 | 22 | 25.6 | - | - | - | - (0.007) | -0.03 (0.02) |
| 96.343 | 50.06 | -4.97 | 22 | 25.5 | - | - | - | - (0.006) | 0.02 (0.02) |
| 96.343 | 50.06 | -4.97 | 22 | 25.5 | - | - | - | - (0.006) | 0.02 (0.02) |
| 96.353 | 49.99 | -4.97 | 22 | 25.5 | - | - | - | - (0.006) | 0.02 (0.02) |
| 96.361 | 49.95 | -4.97 | 22 | 25.5 | - | - | - | - (0.007) | 0.00 (0.02) |
| 96.368 | 34.26 | -4.72 | 22 | 25.5 | - | - | - | - (0.007) | -0.01 (0.02) |
| 96.368 | 34.26 | -4.72 | 22 | 25.5 | - | - | - | - (0.007) | -0.02 (0.02) |
| 96.372 | 34.26 | -4.72 | 22 | 25.5 | - | - | - | - (0.007) | -0.00 (0.02) |
| 96.384 | 34.16 | -4.72 | 22 | 25.5 | - | - | - | - (0.007) | -0.05 (0.02) |
| 96.426 | 22.91 | -4.60 | 22 | 25.5 | - | - | - | - (0.007) | 0.00 (0.02) |
| 96.476 | 23.03 | -4.60 | 22 | 25.5 | - | - | - | - (0.006) | 0.01 (0.02) |
| 96.633 | 22.96 | -4.60 | 22 | 25.5 | - | - | - | - (0.006) | -0.01 (0.02) |
| 98.863 | 16.59 | -4.51 | 22 | 24.9 | - | - | - | - (0.006) | -0.01 (0.02) |
| 98.901 | 16.51 | -4.51 | 22 | 24.9 | - | - | - | - (0.006) | -0.00 (0.02) |
| 152.635 | 33.10 | -3.91 | 34 | 16.1 | - | - | - | - (0.004) | -0.01 (0.01) |
| 153.004 | 28.48 | -4.97 | 26 | 16.1 | - | - | - | - (0.004) | -0.01 (0.01) |
| 153.873 | 42.33 | -3.93 | 34 | 16.0 | - | - | - | - (0.004) | 0.02 (0.01) |
| 154.027 | 42.33 | -3.93 | 34 | 16.0 | - | - | - | - (0.004) | -0.04 (0.02) |
| 154.161 | 89.76 | -4.11 | 34 | 16.0 | - | - | - | - (0.005) | -0.00 (0.01) |
| 154.161 | 89.76 | -4.11 | 34 | 16.0 | - | - | - | - (0.005) | -0.00 (0.01) |
| 154.183 | 89.69 | -4.11 | 34 | 16.0 | - | - | - | - (0.004) | -0.02 (0.01) |
| 154.189 | 89.65 | -4.11 | 34 | 16.0 | - | - | - | - (0.004) | 0.03 (0.01) |
| 154.201 | 69.48 | -4.02 | 34 | 16.0 | - | - | - | - (0.004) | 0.00 (0.01) |
| 154.201 | 69.48 | -4.02 | 34 | 16.0 | - | - | - | - (0.004) | 0.03 (0.01) |
| 154.230 | 69.38 | -4.02 | 34 | 16.0 | - | - | - | - (0.004) | 0.01 (0.01) |
| 154.275 | 53.69 | -3.96 | 34 | 15.9 | - | - | - | - (0.004) | 0.00 (0.01) |
| 154.296 | 53.69 | -3.96 | 34 | 15.9 | - | - | - | - (0.004) | -0.03 (0.01) |
| 154.322 | 53.60 | -3.96 | 34 | 15.9 | - | - | - | - (0.004) | -0.00 (0.01) |
| 154.323 | 53.69 | -3.96 | 34 | 15.9 | - | - | - | - (0.004) | -0.02 (0.01) |
| 155.180 | 42.54 | -3.92 | 34 | 15.9 | - | - | - | - (0.004) | 0.01 (0.01) |
| 155.342 | 42.50 | -3.91 | 34 | 15.8 | - | - | - | - (0.004) | -0.00 (0.01) |
| 156.807 | 34.94 | -4.94 | 30 | 15.7 | - | - | - | - (0.003) | -0.01 (0.01) |
| 157.938 | 36.50 | -3.87 | 34 | 15.6 | - | - | - | - (0.003) | -0.01 (0.01) |
| 157.975 | 36.43 | -3.87 | 34 | 15.6 | - | - | - | - (0.003) | 0.02 (0.01) |
| 159.692 | 42.33 | -4.95 | 34 | 15.4 | - | - | - | - (0.003) | 0.00 (0.01) |
| 161.172 | 42.33 | -4.91 | 34 | 15.3 | - | - | - | - (0.008) | -0.02 (0.02) |
| Frequency | Eu | log(Aij) | gu | Vmin | Vmax | Vpeak | Tpeak | ||
|---|---|---|---|---|---|---|---|---|---|
| GHz | K | ” | K | ||||||
| 162.044 | 50.44 | -4.79 | 42 | 15.2 | - | - | - | - (0.007) | -0.01 (0.02) |
| 164.727 | 50.64 | -4.90 | 38 | 14.9 | - | - | - | - (0.011) | -0.00 (0.03) |
| 167.981 | 27.42 | -4.74 | 30 | 14.6 | - | - | - | - (0.005) | -0.00 (0.02) |
| 168.089 | 42.73 | -3.79 | 38 | 14.6 | - | - | - | - (0.005) | 0.01 (0.01) |
| 168.093 | 42.66 | -3.79 | 38 | 14.6 | - | - | - | - (0.005) | 0.01 (0.02) |
| 170.293 | 59.86 | -4.86 | 42 | 14.4 | - | - | - | - (0.005) | -0.02 (0.02) |
| 171.265 | 41.42 | -3.76 | 38 | 14.4 | - | - | - | - (0.005) | -0.02 (0.02) |
| 171.297 | 41.32 | -3.76 | 38 | 14.4 | - | - | - | - (0.004) | 0.05 (0.02) |
| 171.606 | 59.85 | -4.84 | 42 | 14.3 | - | - | - | - (0.005) | 0.03 (0.02) |
| 173.026 | 50.63 | -3.77 | 38 | 14.2 | - | - | - | - (0.006) | -0.01 (0.02) |
| 173.124 | 50.64 | -3.77 | 38 | 14.2 | - | - | - | - (0.006) | 0.01 (0.02) |
| 173.446 | 98.09 | -3.90 | 38 | 14.2 | - | - | - | - (0.007) | -0.01 (0.02) |
| 173.446 | 98.09 | -3.90 | 38 | 14.2 | - | - | - | - (0.007) | -0.01 (0.02) |
| 173.470 | 98.01 | -3.90 | 38 | 14.2 | - | - | - | - (0.007) | 0.05 (0.02) |
| 173.476 | 97.98 | -3.90 | 38 | 14.2 | - | - | - | - (0.006) | -0.02 (0.02) |
| 173.519 | 77.75 | -3.83 | 38 | 14.2 | - | - | - | - (0.007) | 0.02 (0.02) |
| 173.534 | 77.70 | -3.83 | 38 | 14.2 | - | - | - | - (0.006) | 0.01 (0.02) |
| 173.595 | 62.02 | -3.79 | 38 | 14.2 | - | - | - | - (0.007) | 0.04 (0.02) |
| 173.638 | 62.03 | -3.79 | 38 | 14.2 | - | - | - | - (0.006) | -0.00 (0.02) |
| 173.664 | 61.93 | -3.79 | 38 | 14.2 | - | - | - | - (0.006) | 0.05 (0.02) |
| 174.982 | 50.94 | -3.75 | 38 | 14.1 | - | - | - | - (0.008) | -0.00 (0.02) |
| 175.091 | 50.91 | -3.75 | 38 | 14.0 | - | - | - | - (0.008) | 0.04 (0.03) |
| Frequency | Eu | log(Aij) | gu | Vmin | Vmax | Vpeak | Tpeak | ||
|---|---|---|---|---|---|---|---|---|---|
| GHz | K | ” | K | ||||||
| 96.274 | 22.93 | -4.60 | 22 | 25.6 | 1.00 | 3.0 | 2.0 | 0.020 (0.005) | 0.04 (0.01) |
| 96.343 | 50.06 | -4.97 | 22 | 25.5 | - | - | - | - (0.005) | 0.00 (0.01) |
| 96.343 | 50.06 | -4.97 | 22 | 25.5 | - | - | - | - (0.005) | 0.00 (0.01) |
| 96.353 | 49.99 | -4.97 | 22 | 25.5 | - | - | - | - (0.005) | 0.00 (0.01) |
| 96.361 | 49.95 | -4.97 | 22 | 25.5 | - | - | - | - (0.005) | 0.02 (0.01) |
| 96.368 | 34.26 | -4.72 | 22 | 25.5 | - | - | - | - (0.004) | 0.01 (0.01) |
| 96.368 | 34.26 | -4.72 | 22 | 25.5 | - | - | - | - (0.004) | 0.00 (0.01) |
| 96.372 | 34.26 | -4.72 | 22 | 25.5 | - | - | - | - (0.005) | 0.00 (0.01) |
| 96.384 | 34.16 | -4.72 | 22 | 25.5 | - | - | - | - (0.004) | 0.01 (0.01) |
| 96.426 | 22.91 | -4.60 | 22 | 25.5 | - | - | - | - (0.005) | 0.03 (0.01) |
| 96.476 | 23.03 | -4.60 | 22 | 25.5 | - | - | - | - (0.004) | 0.03 (0.01) |
| 96.633 | 22.96 | -4.60 | 22 | 25.5 | - | - | - | - (0.004) | 0.03 (0.01) |
| 98.863 | 16.59 | -4.51 | 22 | 24.9 | 0.00 | 4.0 | 2.0 | 0.053 (0.004) | 0.15 (0.03) |
| 98.901 | 16.51 | -4.51 | 22 | 24.9 | -1.00 | 4.0 | 2.0 | 0.057 (0.004) | 0.16 (0.03) |
| 152.635 | 33.10 | -3.91 | 34 | 16.1 | 1.00 | 4.0 | 2.0 | 0.033 (0.004) | 0.07 (0.02) |
| 153.004 | 28.48 | -4.97 | 26 | 16.1 | - | - | - | - (0.004) | -0.01 (0.01) |
| 153.873 | 42.33 | -3.93 | 34 | 16.0 | 1.00 | 3.0 | 2.0 | 0.017 (0.005) | 0.04 (0.01) |
| 154.027 | 42.33 | -3.93 | 34 | 16.0 | - | - | - | - (0.005) | 0.03 (0.01) |
| 154.161 | 89.76 | -4.11 | 34 | 16.0 | - | - | - | - (0.005) | -0.01 (0.01) |
| 154.161 | 89.76 | -4.11 | 34 | 16.0 | - | - | - | - (0.005) | -0.01 (0.01) |
| 154.183 | 89.69 | -4.11 | 34 | 16.0 | - | - | - | - (0.005) | 0.01 (0.01) |
| 154.189 | 89.65 | -4.11 | 34 | 16.0 | - | - | - | - (0.005) | -0.03 (0.01) |
| 154.201 | 69.48 | -4.02 | 34 | 16.0 | - | - | - | - (0.005) | -0.00 (0.01) |
| 154.201 | 69.48 | -4.02 | 34 | 16.0 | - | - | - | - (0.005) | 0.00 (0.01) |
| 154.230 | 69.38 | -4.02 | 34 | 16.0 | - | - | - | - (0.004) | 0.01 (0.01) |
| 154.275 | 53.69 | -3.96 | 34 | 15.9 | - | - | - | - (0.005) | 0.03 (0.01) |
| 154.296 | 53.69 | -3.96 | 34 | 15.9 | - | - | - | - (0.004) | 0.01 (0.01) |
| 154.322 | 53.60 | -3.96 | 34 | 15.9 | - | - | - | - (0.005) | 0.02 (0.01) |
| 154.323 | 53.69 | -3.96 | 34 | 15.9 | - | - | - | - (0.004) | 0.01 (0.01) |
| 155.180 | 42.54 | -3.92 | 34 | 15.9 | - | - | - | - (0.006) | 0.03 (0.01) |
| 155.342 | 42.50 | -3.91 | 34 | 15.8 | - | - | - | - (0.005) | 0.01 (0.01) |
| 156.807 | 34.94 | -4.94 | 30 | 15.7 | - | - | - | - (0.003) | 0.01 (0.01) |
| 157.938 | 36.50 | -3.87 | 34 | 15.6 | 0.00 | 4.0 | 2.0 | 0.029 (0.003) | 0.07 (0.01) |
| 157.975 | 36.43 | -3.87 | 34 | 15.6 | 0.00 | 4.0 | 2.0 | 0.020 (0.003) | 0.07 (0.01) |
| 159.692 | 42.33 | -4.95 | 34 | 15.4 | - | - | - | - (0.003) | 0.00 (0.01) |
| 161.172 | 42.33 | -4.91 | 34 | 15.3 | - | - | - | - (0.005) | 0.02 (0.01) |
| Frequency | Eu | log(Aij) | gu | Vmin | Vmax | Vpeak | Tpeak | ||
|---|---|---|---|---|---|---|---|---|---|
| GHz | K | ” | K | ||||||
| 162.044 | 50.44 | -4.79 | 42 | 15.2 | - | - | - | - (0.005) | -0.00 (0.01) |
| 164.727 | 50.64 | -4.90 | 38 | 14.9 | - | - | - | - (0.008) | -0.00 (0.02) |
| 167.981 | 27.42 | -4.74 | 30 | 14.6 | - | - | - | - (0.005) | 0.02 (0.01) |
| 168.089 | 42.73 | -3.79 | 38 | 14.6 | - | - | - | - (0.006) | 0.05 (0.02) |
| 168.093 | 42.66 | -3.79 | 38 | 14.6 | - | - | - | - (0.005) | 0.03 (0.01) |
| 170.293 | 59.86 | -4.86 | 42 | 14.4 | - | - | - | - (0.004) | -0.01 (0.01) |
| 171.265 | 41.42 | -3.76 | 38 | 14.4 | 1.00 | 3.0 | 2.0 | 0.030 (0.005) | 0.07 (0.02) |
| 171.297 | 41.32 | -3.76 | 38 | 14.4 | 1.00 | 3.0 | 2.0 | 0.017 (0.005) | 0.05 (0.01) |
| 171.606 | 59.85 | -4.84 | 42 | 14.3 | - | - | - | - (0.006) | 0.00 (0.01) |
| 173.026 | 50.63 | -3.77 | 38 | 14.2 | - | - | - | - (0.007) | 0.02 (0.01) |
| 173.124 | 50.64 | -3.77 | 38 | 14.2 | - | - | - | - (0.007) | 0.01 (0.01) |
| 173.446 | 98.09 | -3.90 | 38 | 14.2 | - | - | - | - (0.007) | 0.02 (0.01) |
| 173.446 | 98.09 | -3.90 | 38 | 14.2 | - | - | - | - (0.007) | 0.02 (0.01) |
| 173.470 | 98.01 | -3.90 | 38 | 14.2 | - | - | - | - (0.007) | -0.00 (0.01) |
| 173.476 | 97.98 | -3.90 | 38 | 14.2 | - | - | - | - (0.006) | -0.01 (0.01) |
| 173.519 | 77.75 | -3.83 | 38 | 14.2 | - | - | - | - (0.005) | 0.03 (0.01) |
| 173.534 | 77.70 | -3.83 | 38 | 14.2 | - | - | - | - (0.006) | 0.01 (0.01) |
| 173.595 | 62.02 | -3.79 | 38 | 14.2 | - | - | - | - (0.006) | 0.01 (0.01) |
| 173.638 | 62.03 | -3.79 | 38 | 14.2 | - | - | - | - (0.008) | 0.00 (0.02) |
| 173.664 | 61.93 | -3.79 | 38 | 14.2 | - | - | - | - (0.008) | 0.03 (0.02) |
| 174.982 | 50.94 | -3.75 | 38 | 14.1 | - | - | - | - (0.008) | 0.02 (0.02) |
| 175.091 | 50.91 | -3.75 | 38 | 14.0 | - | - | - | - (0.008) | 0.03 (0.02) |
| Frequency | Eu | log(Aij) | gu | Vmin | Vmax | Vpeak | Tpeak | ||
|---|---|---|---|---|---|---|---|---|---|
| GHz | K | ” | K | ||||||
| 152.635 | 33.10 | -3.91 | 34 | 16.1 | - | - | - | - (0.005) | -0.01 (0.01) |
| 153.004 | 28.48 | -4.97 | 26 | 16.1 | - | - | - | - (0.006) | 0.01 (0.01) |
| 153.873 | 42.33 | -3.93 | 34 | 16.0 | - | - | - | - (0.006) | -0.01 (0.01) |
| 154.027 | 42.33 | -3.93 | 34 | 16.0 | - | - | - | - (0.006) | 0.01 (0.01) |
| 154.161 | 89.76 | -4.11 | 34 | 16.0 | - | - | - | - (0.006) | 0.01 (0.01) |
| 154.161 | 89.76 | -4.11 | 34 | 16.0 | - | - | - | - (0.006) | 0.01 (0.01) |
| 154.183 | 89.69 | -4.11 | 34 | 16.0 | - | - | - | - (0.006) | 0.01 (0.01) |
| 154.189 | 89.65 | -4.11 | 34 | 16.0 | - | - | - | - (0.006) | -0.01 (0.01) |
| 154.201 | 69.48 | -4.02 | 34 | 16.0 | - | - | - | - (0.006) | 0.01 (0.01) |
| 154.201 | 69.48 | -4.02 | 34 | 16.0 | - | - | - | - (0.006) | 0.02 (0.01) |
| 154.230 | 69.38 | -4.02 | 34 | 16.0 | - | - | - | - (0.006) | 0.01 (0.01) |
| 154.275 | 53.69 | -3.96 | 34 | 15.9 | - | - | - | - (0.007) | -0.01 (0.01) |
| 154.296 | 53.69 | -3.96 | 34 | 15.9 | - | - | - | - (0.006) | 0.01 (0.01) |
| 154.322 | 53.60 | -3.96 | 34 | 15.9 | - | - | - | - (0.006) | 0.00 (0.01) |
| 154.323 | 53.69 | -3.96 | 34 | 15.9 | - | - | - | - (0.006) | -0.01 (0.01) |
| 155.180 | 42.54 | -3.92 | 34 | 15.9 | - | - | - | - (0.006) | 0.00 (0.01) |
| 155.342 | 42.50 | -3.91 | 34 | 15.8 | - | - | - | - (0.006) | -0.02 (0.01) |
| 156.807 | 34.94 | -4.94 | 30 | 15.7 | - | - | - | - (0.005) | 0.00 (0.01) |
| 157.938 | 36.50 | -3.87 | 34 | 15.6 | - | - | - | - (0.004) | -0.01 (0.01) |
| 157.975 | 36.43 | -3.87 | 34 | 15.6 | - | - | - | - (0.004) | 0.00 (0.01) |
| 159.692 | 42.33 | -4.95 | 34 | 15.4 | - | - | - | - (0.004) | -0.01 (0.01) |
| 170.293 | 59.86 | -4.86 | 42 | 14.4 | - | - | - | - (0.006) | -0.01 (0.01) |
| 171.265 | 41.42 | -3.76 | 38 | 14.4 | - | - | - | - (0.007) | -0.01 (0.01) |
| 171.297 | 41.32 | -3.76 | 38 | 14.4 | - | - | - | - (0.007) | 0.02 (0.01) |
| 171.606 | 59.85 | -4.84 | 42 | 14.3 | - | - | - | - (0.007) | 0.01 (0.01) |
| 173.026 | 50.63 | -3.77 | 38 | 14.2 | - | - | - | - (0.008) | -0.03 (0.02) |
| 173.124 | 50.64 | -3.77 | 38 | 14.2 | - | - | - | - (0.009) | 0.05 (0.02) |
| 173.446 | 98.09 | -3.90 | 38 | 14.2 | - | - | - | - (0.010) | 0.01 (0.02) |
| 173.446 | 98.09 | -3.90 | 38 | 14.2 | - | - | - | - (0.010) | 0.01 (0.02) |
| 173.470 | 98.01 | -3.90 | 38 | 14.2 | - | - | - | - (0.010) | 0.01 (0.02) |
| 173.476 | 97.98 | -3.90 | 38 | 14.2 | - | - | - | - (0.009) | 0.02 (0.02) |
| 173.519 | 77.75 | -3.83 | 38 | 14.2 | - | - | - | - (0.008) | -0.02 (0.01) |
| 173.534 | 77.70 | -3.83 | 38 | 14.2 | - | - | - | - (0.009) | 0.01 (0.02) |
| 173.595 | 62.02 | -3.79 | 38 | 14.2 | - | - | - | - (0.009) | 0.01 (0.02) |
| 173.638 | 62.03 | -3.79 | 38 | 14.2 | - | - | - | - (0.010) | -0.00 (0.02) |
| 173.664 | 61.93 | -3.79 | 38 | 14.2 | - | - | - | - (0.009) | 0.02 (0.02) |
| Frequency | Eu | log(Aij) | gu | Vmin | Vmax | Vpeak | Tpeak | ||
|---|---|---|---|---|---|---|---|---|---|
| GHz | K | ” | K | ||||||
| 174.982 | 50.94 | -3.75 | 38 | 14.1 | - | - | - | - (0.008) | -0.00 (0.01) |
| 175.091 | 50.91 | -3.75 | 38 | 14.0 | - | - | - | - (0.010) | -0.01 (0.02) |
Peer Reviews
No public reviews on file for this paper yet. If you reviewed it on a platform where reviews are public (OpenReview, ICLR, NeurIPS, ICML), you can paste yours below so the community can read it here.
Videos
No videos yet. Explain this paper in a talk, walkthrough, or lecture? Add one.
Observations of CH3OH and CH3CHO in a Sample of Protostellar Outflow Sources
Department of Physics and Astronomy, University College London, Gower Street, London WC1E 6BT
Department of Physics and Astronomy, University College London, Gower Street, London WC1E 6BT
Claudio Codella
INAF, Osservatorio Astrofisico di Arcetri, Largo E. Fermi 5, 50125 Firenze, Italy
Univ. Grenoble Alpes, Institut de Planétologie et d’Astrophysique de Grenoble (IPAG), 38401 Grenoble, France
Jonathan Rawlings
Department of Physics and Astronomy, University College London, Gower Street, London WC1E 6BT
Izaskun Jimenez-Serra
Centro de Astrobiología (CSIC, INTA), Ctra. de Ajalvir, km. 4, Torrejón de Ardoz, E-28850 Madrid, Spain
Yenabeb Ayalew
Hammersmith Academy, London, UK
Justin Curtis
Hammersmith Academy, 25 Cathnor Road, London, W12 9JD
Annur Habib
Hammersmith Academy, 25 Cathnor Road, London, W12 9JD
Jamel Lawrence
Hammersmith Academy, 25 Cathnor Road, London, W12 9JD
Sumaya Warsame
Hammersmith Academy, 25 Cathnor Road, London, W12 9JD
Sarah Horn
Hammersmith Academy, 25 Cathnor Road, London, W12 9JD
(Received January 1, 2018; Revised January 7, 2018)
Abstract
Iram 30-m Observations towards eight protostellar outflow sources were taken in the 96- range. Transitions of CH3OH and CH3CHO were detected in seven of them. The integrated emission of the transitions of each species that fell into the observed frequency range were measured and fit using RADEX and LTE models. Column densities and gas properties inferred from this fitting are presented. The ratio of the A and E-type isomers of CH3OH indicate that the methanol observed in these outflows was formed on the grain surface. Both species demonstrate a reduction of terminal velocity in their line profiles in faster outflows, indicating destruction in the post-shock gas phase. This destruction, and a near constant ratio of the CH3OH and CH3CHO column densities imply it is most likely that CH3CHO also forms on the grain surface.
ISM: molecules, ISM: jets and outflows, astrochemistry
††journal: ApJ††software: GILDAS/CLASS http://www.iram.fr/IRAMFR/GILDAS, Emcee (Foreman-Mackey et al., 2013), RADEX (van der Tak et al., 2007)
\savesymbol
tablenum \restoresymbolSIXtablenum
1 Introduction
In the early stages of their evolution, low mass protostars launch outflows: fast flows of gas that can generate shocks when colliding with the surrounding medium. These shocked regions often have a rich chemistry with many species experiencing significant enhancement in abundance (van Dishoeck & Blake, 1998). They are warm and bright, making them excellent locations to observe molecules (Bachiller & Pérez Gutiérrez, 1997; Jørgensen et al., 2004).
Further, the shocks driven by the outflow are of sufficient speed to sputter the ice mantles of dust grains, and even the dust grain material itself, into the gas phase (May et al., 2000). Thus shocked regions along protostellar outflows represent complex and interesting locations where the chemistry may be dominated by material recently released from the ices.
This is particularly relevant in the case of complex organic molecules (COMs). Debate over the main formation routes of these molecules (eg. Chuang et al., 2017; Skouteris et al., 2019) is ongoing. The most simple of these COMs, methanol (CH3OH), is known to form efficiently on the grains (Fuchs et al., 2009) but other more complex molecules are not well understood.
However, shocks present an interesting case in that it is possible that the majority of CH3OH on the grains is destroyed in the sputtering process (Suutarinen et al., 2014). Thus, it is possible that some of the CH3OH observed towards outflows may be formed in the post-shock gas phase, despite the efficiency of methanol formation in interstellar ices.
Acetaldehyde (CH3CHO) has been detected in outflows (Codella et al., 2015) as well as hot corinos (Cazaux et al., 2003) and cold cores (Jiménez-Serra et al., 2016). There exist viable routes to forming the molecule on the grain surface through diffusion reactions (Garrod & Herbst, 2006) and UV processing (Öberg et al., 2009) as well as in the gas phase (Charnley, 2004, and references therein).
In this work, observations towards eight protostellar outflows, seven of which were found to contain many transitions of CH3OH and CH3CHO, are presented. By considering the trends in the column densities of these molecules and the ratio of CH3OH isomers across different shocked regions and with different shock speeds, it is expected some information as to the origin of each molecule can be extracted.
Moreover, the set of outflows presented here are a sample that was initially chosen to investigate the chemical differences between NH3 and H2O in shocked regions (Gómez-Ruiz et al., 2016). In the outflow source L1157-B1, it was was observed that NH3 transitions had a much lower terminal velocity than H2O despite arising from the same source (Codella et al., 2010). Through chemical and radiative transfer modelling, this was attributed to gas phase reactions in the hot post-shock gas (Viti et al., 2011). Both species were sputtered by the shock and enhanced, but in the hot, fast moving gas NH3 was destroyed through reactions with H atoms. The same behaviour was observed in MHD shock models with radiative transfer (Flower & Pineau des Forêts, 2012).
The difference between NH3 and H2O were found to hold across the outflows presented here (Gómez-Ruiz et al., 2016) and a search for other species that followed similar trends was attempted. In observations targeting sulfur-bearing species, a large number of CH3OH and CH3CHO were serendipitously detected by student researchers as part of the ORBYTS researchers in schools programme 111http://www.twinkle-spacemission.co.uk/orbyts/. In this work, the emission from those species is analysed to find the trends of their emission and abundance with shock velocity
In Section 2, the observations and basic measurements are described. In Section, 3 the column density inference procedure is detailed. In Section 4, the results of these measurements are presented and in Section 5, the implications of the results are discussed. Finally, the work is summarized in Section 6.
2 Observations and Processing
Observations of eight outflow sources were obtained using the IRAM-30m telescope. The sources were chosen to match the sample observed by Gómez-Ruiz et al. (2016). The sources, listed by central object, are presented in Table 1. Given that the offset from the central object is generally much larger than the beam width, it is assumed that the contribution from those protostars is negligible.
The observations contain two frequency ranges, the first from and the second from . In the case of L1448-B2 and IRAS2A-B, only the second range was observed. These ranges were intended to capture transitions of many sulfur bearing species, the exploitation of which will be presented in future work.
Observations were carried out between the 2nd and 4th of June 2016 in wobbler switching mode. Pointing was monitored regularly, using Mercury, and found to be stable. The atmospheric opacity was low, . The observations were taken using the IRAM-30m telescope’s EMIR receivers and the Fourier Transform Spectrometer back end. This gave a spectral resolution of or, equivalently, velocity resolutions between and . All spectra were smoothed and resampled to a common velocity resolution of for analysis. This allowed comparison between sources and greatly improved the signal to noise ratio of weak lines.
The data were manually inspected using the GILDAS CLASS software package222http://www.iram.fr/IRAMFR/GILDAS. This was primarily for initial line identification. Where a peak in the spectrum was above three times the noise level, it was identified by comparing the rest frequency of the brightest channel to the JPL catalog (Pickett, 1985) accessed via Splatalogue333http://www.splatalogue.net/. Transitions of the E isomer of CH3CHO and both the A and E isomers of CH3OH were detected in every source except L1448-R4. The L1448-R4 spectra were badly affected by absorption at the systematic velocity of L1448 and so this source is not discussed further.
Whilst many transitions of the species were detected, many more transitions are present in the observed frequency ranges. In order to make use of these non-detections, the CLASS WEEDS library and the JPL catalog were used to extract every transition in the observed frequency range. However, this was a prohibitively large number of transitions and so limits on and were chosen based on the properties of the manually detected lines. Only transitions within these limits were exported for further processing. This included every CH3OH transition with an 250\text{,}\mathrm{K} and $A_{ij}>${10}^{-6}\text{\,}{\mathrm{s}}^{-1} and every CH3CHO transition with an E100\text{,}\mathrm{K} and $A_{ij}>${10}^{-5}\text{\,}{\mathrm{s}}^{-1}. These ranges include every detected transition in the observed frequency range but limited the number of non-detections in the data set. Spectra covering a velocity range of centred on each transition were exported regardless of whether a peak had been identified in the spectrum.
The exported spectra were baseline subtracted in python by fitting polynomials of up to order 3 to the spectra using numpy’s polyfit. The rms difference between the baseline and the spectra was then calculated to give the spectrum rms. The smoothed spectra have rms values between 3 and . Transitions were classed as detections if the peak emission was above three times the rms noise level. The spectra of detected lines were median stacked and the velocities at which the median stacked peak fell to the rms emission level were recorded. These were considered to be the minimum and maximum velocity limits of the emission of that species in that source. All transitions of the species were then integrated between these limits even if a peak was not detected. The uncertainty on the integrated emission of each transition was found by propagating the uncertainties due to the noise and velocity resolution of their spectra as well as a 20% calibration error.
Finally, transitions where the integrated emission was larger than the noise level were inspected visually. Any transition which was blended with the emission of another species was removed from the data set. Two groups of three CH3OH transitions were blended in every source. For these, the distance between the peaks of the blended transitions in velocity space was added to the integration limits such that all blended lines were integrated together. The total flux of these lines was treated specially as detailed in Section 3.1.
In the online appendix, the measured properties of every transition in the observed frequency ranges are presented in tables for each source in Appendix A. In Appendix B, plots of the spectra of every detected line of each species in each source are also presented.
3 Inference of Gas Properties
The integrated emission of the CH3OH and CH3CHO transitions were used to infer the column density of each species towards each source as well as the gas properties through model fitting. Since any model that predicts strong emission for an undetected transition cannot be correct, the measured emission of every line of each species was included in the fits regardless of whether or not a peak was detected. In this section, the model used for each species and the fitting procedure is detailed.
3.1 CH3OH Fluxes
The LAMDA database444http://home.strw.leidenuniv.nl/~moldata/CH3OH.html contains collisional data for the two isomers of CH3OH (A-CH3OH and E-CH3OH) orginally computed by Rabli & Flower (2010). This allowed the use of RADEX (van der Tak et al., 2007) to predict the emission of each transition. RADEX requires the column density of each isomer, the gas temperature, and the linewidth as input parameters.
RADEX assumes the source fills the telescope beam and so the fluxes had to be adjusted for a fifth free parameter, the source size. To do this the source size was used to calculate a filling factor,
[TABLE]
where is the source size and is the beamsize which is a function of frequency. The RADEX outputs were multiplied by this factor to account for the beam dilution present for an assumed source size.
Fitting the integrated emission directly provided a convenient solution to the blended transitions of CH3OH. The total integrated area of each set of blended transitions was measured from the spectra and compared to the sum of the RADEX emission for those transitions. If a RADEX model fits the individual transitions in a data set, it follows that it would fit the sum of any set of transitions. Therefore, fitting the sum of blended transitions allows them to contribute information to the fit, avoiding any approximations that are often used to separate the flux from blended transitions such as assuming LTE. However, it does create a degeneracy in the fits as the relative emission of each line is not considered. Where many other transitions are detected, this degeneracy is resolved. If few other transitions are detected, the reported uncertainties are significantly larger.
3.2 CH3CHO Fluxes
For CH3CHO, no collisional data was available and so the integrated emission was predicted by assuming optically thin emission and LTE conditions. Assuming every transition has an upper state column density () given by a Boltzmann distribution, the upper state column density can be related to the integrated emission () and rearranged to give that emission as a function of the column density (), rotational temperature (), and the source size or filling factor,
[TABLE]
The result is an approach that is effectively equivalent to the rotation diagram method (Goldsmith & Langer, 1999) but allows the source size to be accounted for in a more direct fashion and is more similar to the method used for CH3OH.
3.3 Inference Procedure
The likelihood of having obtained the data given a set of parameters can be defined as,
[TABLE]
where and are the observed and model integrated emission of transition , is the observational uncertainty, and is the set of parameters which may include the gas temperature and column density. From here, Bayes’ theorem can be applied to obtain the probability distribution of the parameters given the observed data,
[TABLE]
where is the prior probability of the parameters and is the Bayesian evidence, which can simply be treated as a normalizing factor.
An advantage of this method is that poorly constrained variables can be marginalized over. For example, the angular size of each source is an unknown in this work. However, if it is treated as a free parameter, the uncertainty this introduces to the model will be reflected in the marginalized posterior distributions of the other parameters.
The posterior distribution was sampled using the python package emcee (Foreman-Mackey et al., 2013). This is an affine-invariant sampler (Goodman & Weare, 2010) in which multiple chains of samples are created by “walkers” which each sample the space. Each walker moves through the parameter space generating a chain of parameter samples, starting with a random value of the parameters of interest drawn from the prior distributions. However, unlike many MCMC samplers, walkers do not move randomly and are instead informed by each other.
The prior probability distributions were simply assumed to be flat between limits. The temperature prior was non-zero between 0 and and the source size prior was non-zero between 0 and . The column density prior was non-zero between and and, in the case of CH3OH, the H2 density prior was non-zero between and . The column density and gas density were sampled in log-space for numerical reasons as large values will otherwise dominate the sampling.
For the parameter inference, 12 walkers were used and the chains were run for steps per walker. The Geweke diagnostic (Geweke, 1992) was used to verify that the chains had converged.
4 Results
The gas densities and kinetic temperature of the gas traced by CH3OH as well as the column densities of both species in each object obtained from the parameter inference are given in Tables 2 and 3. Most likely values are presented for the column densities as well as the 67% probability intervals of all parameters. This implies that if the model is correct, there is 67% chance the true value of each parameter lies within the given range.
These values should be treated with some caution as RADEX gives an imperfect representation of a slab of gas described by a single density and temperature and this not the ideal model for a shocked region. This is even more of an issue for the LTE results presented for CH3CHO. Further, in the best case, the parameter values obtained will represent the average values of the gas encompassed by the telescope beam. However, in both cases, the model results do give some insight and represent the best models available to us. All of the results of the fitting are discussed below.
4.1 CH3OH - Gas Properties
In Table 2, third and fourth columns give the 67% probability range of the gas density and temperature. In the weakest emitting sources, the kinetic temperature is poorly constrained and only an upper limit is reported. This is due to the low range of Eu values of the detected transitions. The temperature only needs to be sufficiently low not to excite the higher energy undetected transitions and beyond this, there is no change in the fit.
In sources with a large number of detected lines, the gas temperatures are well constrained. There is no clear variation between these sources, most giving values between 40 and . Whilst this is much lower than the maximum temperature typically reached in the shocks used to model outflows (Flower & Pineau des Forêts, 2015), a single temperature and gas density is being fit to a shock structure that will encompass a wide range of gas conditions. Further, it is consistent with that found in other protostellar shock sources (eg. CO in L1157-B1 Lefloch et al., 2012), including that found previously for CH3OH in L1157-B2 (McGuire et al., 2015).
The gas densities do not vary greatly, only the sources associated with IRAS4A have most likely ranges that are differ significantly from \sim$$4\text{\times}{10}^{5}\text{\,}{\mathrm{cm}}^{-3}. However, it is interesting to note that each pair of sources associated with the same central objects are very similar. Whilst the IRAS2A-B gas density posterior distribution is quite wide, the majority of the probability density is in the same range as that reported for IRAS2A-R. Further, the IRAS4A and L1157 sources are remarkably consistent.
4.2 CH3OH - Column Density
In Figure 1, the measured flux of each observed CH3OH transition is plotted. In red, the fluxes obtained from RADEX using the most likely values of the parameters are also plotted. The agreement is good considering the use of a single gas component to fit a shocked region, with values of 1.5. In Table 2, the most likely column density of each CH3OH isomer is given along with the 67% confidence interval. In the case of L1448-B2 and IRAS2A-B, only an upper limit can be given for A-CH3OH.
CH3OH has been previously detected towards each of these sources. The most likely column densities from this work were compared to the column density of CH3OH found towards the outflows of IRAS-2A (Jørgensen et al., 2004), IRAS-4A (Blake et al., 1995), L1448 (Tafalla et al., 2010), and L1157 (Burkhardt et al., 2016). The observations in those works covered fewer lines so only total CH3OH column densities were reported. However, for every source, the sum of the isomer column densities obtained through this analysis is consistent with the value reported in those works.
4.3 CH3CHO Column Density
The results of the LTE parameter inference for CH3CHO emission from the observed sources are summarized in Table 3. No transitions of CH3CHO were detected at a significant level towards IRAS2A-B, L1157-R and L1448-B2. As a result, the posterior distribution of N only has upper bounds in these sources and only the upper limit is reported.
The fits to the CH3CHO fluxes are presented as rotation diagrams in Figure 2. The best fit and are used to plot the expected Boltzmann distribution as a straight line. The points are the upper state column density of each transition, calculated from the measured integrated emission and adjusted for the filling factor using the most likely value of .
4.4 ”Nuisance” Parameters
There are two parameters that are not of particular interest to the analysis but are important for the fitting, these are the line width in the case of the RADEX fits and the filling factor for both the RADEX and LTE fits.
In Figure 3, it can be seen that when the linewidth is allowed to vary freely, the probability distribution tends to large values. From the RADEX manual 555http://home.strw.leidenuniv.nl/~moldata/radex_manual.pdf, one finds that the manner in which the flux and line intensity are calculated means that the line width is irrelevant in the limit of low optical depth. Thus the fits are tending to a regime that is consistent with optically thin CH3OH emission.
The line width is only constrained in the case of IRAS2A-R, in which the most likely value is half the full width of the detected lines. A second parameter inference was run, fixing the line widths to their FWHM values and consistent results were found for the other parameters. Thus it is considered that the linewidth is unimportant and is left as a free parameter as this increases the reported uncertainties and is thus more conservative. This is appropriate because the lines are not Gaussian and RADEX assumes they are.
Figure 3 also shows a common result for the source size: it also tends to large values. In these cases, it is reasonable to assume the source fills the beam. For source sizes much larger than the beam, the filling factor tends to unity so the actual value becomes irrelevant and thus any source that fills the beam will have a posterior that simply tends to high values rather than a specific value. From the figure, it can be seen the column densities and the source size are correlated below 80”. This broadens the column density distributions and is thus included in the reported column density uncertainty.
In other sources, the filling factor probability distribution is close to constant across transitions for many source sizes. Most transitions of CH3OH in the observed frequency range are associated with beam sizes of 15” with only a small number of transitions reaching 25” thus, in a source with few detections the source size is not constrained. This manifests as a broader variation of column densities as the filling factor is a constant offset and a low source size can be compensated by a smaller column density and vice versa.
5 discussion
5.1 E/A Methanol Ratio
Methanol has two spin isomers referred to as E and A-CH3OH respectively. Since the conversion of one isomer to another is a strongly forbidden process, it is often assumed in that this ratio is fixed at formation and then preserved (Kawakita & Kobayashi, 2009).
Whilst this assumption is typically applied to methanol observed in cometary ices, Wirström et al. (2011) argue this should also be true for the interstellar medium. They argue that the timescale for the reactions that would alter the ratio are long compared to the lifetime of an average methanol molecule and thus conversion must be negligible. The ratio of the E and A isomers of CH3OH can be used to calculate a characteristic temperature () through the equation,
[TABLE]
where the sums over and are sums over all transitions of E and A-CH3OH respectively. If the methanol was thermalized at formation, represents the temperature of the formation environment.
Assuming this is the case, the ratio of E to A-CH3OH in the observed sources can be calculated to give the spin temperature and hence the temperature at which the methanol in those sources formed. Figure 4 shows that the ratio in every source. Most sources are consistent with a spin temperature between 5 and . The one source which has an unusually low ratio but is not an upper limit is L1157-R. Only one A-CH3OH transition was detected in this source and it was part of the blended triplet at \sim$$96\text{\,}\mathrm{GHz}.
Such low and similar spin temperatures are inconsistent with a scenario in which methanol forms in the post-shock gas in the outflow. If thermalization is assumed, the spin temperature would equal the post-shock gas temperature, which is \sim$$50\text{\,}\mathrm{K} in each source. Thus it is concluded that that the methanol observed in these outflows formed before the shock on the grain surfaces before being released by shock sputtering. This is corroborated by Fuchs et al. (2009) who showed CO efficiently hydrogenates to form methanol between 12 and on interstellar ice analogues.
5.2 Velocity Trends of CH3OH
In section 1, the difference in terminal velocities between NH3 and H2O in the observed sources is discussed. The terminal velocity of H2O in these sources was taken from Gómez-Ruiz et al. (2016) and compared to CH3OH. The terminal velocity is the velocity at which the emission peak reaches the rms level and is given as an absolute value relative to the local standard of rest. Figure 5 shows that CH3OH follows the same trend as NH3 (Figure 8, Gómez-Ruiz et al., 2016). Up to a H2O terminal velocity of , the CH3OH terminal velocity increases with the H2O velocity. However, the difference between the H2O and CH3OH terminal velocity increases steadily and at much higher velocities, the CH3OH terminal velocity decreases drastically. This is consistent with previous observations of H2O and CH3OH transitions towards IRAS2A and IRAS4A (Suutarinen et al., 2014).
The velocity trend is consistent with CH3OH behaving similarly to NH3. That is, it is released from the ice mantles by the sputtering in the shock and is then destroyed in the post-shock gas phase to a degree that is dependent on the shock speed. This is corroborated by the results of Section 5.1, which showed that the isomer ratio of methanol is consistent with a grain surface origin. It is also the case that the fractional abundance of CH3OH is lower in sources with higher H2O terminal velocities.
There are no gas phase destruction routes for CH3OH in the KIDA or UMIST databases that have large energetic barriers. However, a reaction with H with an energetic barrier of \sim$$3000\text{\,}\mathrm{K} exists in the atmospheric chemistry literature (Sander et al., 2011). Alternatively, as suggested by Suutarinen et al. (2014), the sputtering process could destroy the CH3OH molecules if the shock is sufficiently high speed. Suutarinen et al. (2014) find speeds >$$25\text{\,}\mathrm{km}\text{\,}{\mathrm{s}}^{-1} are required to observe the destruction of methanol which is confirmed here as the first major drop in CH3OH abundance occurs in L1157-R which has a H2O terminal velocity of .
5.3 Velocity Trends of CH3CHO
CH3CHO also shows an extremely similar terminal velocity trend to that seen in figure 5. This implies that CH3CHO is also destroyed through a process that is more efficient in faster shocks.
Figure 6 shows the ratio of the column densities of CH3CHO and e-CH3OH in each source. By drawing random column densities from the MCMC chains, probability distributions for the ratios can be calculated and their most likely values and 67% probability intervals are plotted as error bars. From the probability distributions, the relationship between the ratios and the H2O terminal velocity can also be found. The most likely case is that the ratio is independent of the shock velocity and is constant at 0.002. This constant ratio and the variation due to uncertainty in the fit are plotted as a blue line and shaded region respectively.
Taken together, these two facts indicate a grain surface origin of CH3CHO. The velocity behaviour shows that in the post-shock gas of fast outflows, CH3CHO is largely destroyed in the gas phase. Whereas the approximately constant ratio of CH3CHO and CH3OH in lower velocity outflows is inconsistent with CH3OH being formed in the pre-shock grains and CH3CHO being formed in post-shock gas. The initial abundance of CH3OH should be independent of the shock properties (assuming a fast enough shock for complete sputtering of the ice mantles) but the amount of gas phase synthesis of CH3CHO would be strongly tied to the conditions of the post-shock gas before it reaches temperatures that destroy CH3CHO.
6 Conclusions
Eight outflow sources have been observed and, in seven, transitions of CH3OH and CH3CHO were detected. These have been analysed to determine the origin of those species in outflows and their post-shock behaviour.
The integrated emission of a large set of transitions of each species in the observed frequency range were measured and used to infer the column density of each species as well as the gas density and temperature fits from RADEX for CH3OH. All of these quantities are summarized in Tables 2 and 3. Whilst these are informative, shock structures are likely to contain regions with highly varying gas properties. The higher resolution view provided by interferometry such as that being performed for CH3OH by the SOLIS project (e.g. De Simone et al in prep.) would greatly improve our understanding of such objects.
From column density ratios of CH3OH isomers, it is concluded that the most likely case is that CH3OH is formed on the pre-shock ice mantles and released into the gas phase via sputtering. This assumes the spin temperature of the isomers was set at the formation of the molecules and reflects the temperature of the formation environment. Spin temperature of 5 to are considered inconsistent with formation in shocked gas.
From the terminal velocity trends of the CH3OH transitions and the CH3OH fractional abundance as a function of H2O, it is concluded that in sufficiently fast shocks CH3OH is destroyed either during the sputtering process or by chemistry in the post shock gas phase.
There is no direct evidence for the formation route of CH3CHO. However, the near constant ratio of CH3CHO to CH3OH casts doubt on a gas phase origin. The amount of gas phase production of CH3CHO would vary from source to source depending on the gas properties which makes a constant ratio unlikely if CH3OH is formed on dust grains.
JH, SV and JCR acknowledge funding from the STFC grant ST/M001334/1. CC acknowledges the project PRIN-INAF 2016 The Cradle of Life - GENESIS-SKA (General Conditions in Early Planetary Systems for the rise of life with SKA). The authors would like to thank Blues Skies Space Limited and UCL for their support of ORBYTS. ORBYTS is a programme to bring researchers to schools to lead original research projects. The work of the students of Hammersmith Academy during ORBYTS formed the basis of this manuscript. The authors thank the anonymous referee for their helpful comments which improved this manuscript.
Appendix A Observed Transitions
In this section, the observed transitions of CH3OH and CH3CHO are tabulated. Every CH3OH transition with an 250\text{,}\mathrm{K} and $A_{ij}>${10}^{-6}\text{\,}{\mathrm{s}}^{-1} that fell into the observed frequency range was extracted for processing. For CH3CHO transitions with an E100\text{,}\mathrm{K} and $A_{ij}>${10}^{-5}\text{\,}{\mathrm{s}}^{-1} were extracted. These ranges were selected to include every 3 detection in the data set and then limit the number of non-detections that contribute to the fit. These are all listed regardless of whether or not they were detected. For non-detections, only the spectroscopic properties of the transition and the integrated emission are presented.
Note, the CH3OH transitions between 96.739 and and those between 157.271 and are blended. The total extent in velocity space of those blended lines are given in the and columns and thus, the ranges are much broader than the other transitions.
Appendix B Spectra
In this appendix, plots of every detected transition of CH3OH and CH3CHO in each source are presented. The full set is available in the online journal and an example is shown in Figure 7. Blue lines indicate velocity at which the transition peaks and grey shaded areas show the interval over which the line was integrated to measure the integrated emission. There are two groups of blended CH3OH lines which can be clearly seen in the spectra. One includes the transitions at 156.271, 156.272 and and the other includes the lines at 96.741, 96.745, and . For blended lines, the emission was integrated over all blended transitions and the sum of the predicted fluxes was compared to that.
The reference list from the paper itself. Each links out to its DOI / PubMed record.
- 1Bachiller & Pérez Gutiérrez (1997) Bachiller, R., & Pérez Gutiérrez, M. 1997, Ap J, 487, L 93. https://doi.org/10.1086/310877 · doi ↗
- 2Blake et al. (1995) Blake, G. A., Sandell, G., van Dishoeck, E. F., et al. 1995, Ap J, 441, 689. http://adsabs.harvard.edu/doi/10.1086/175392
- 3Burkhardt et al. (2016) Burkhardt, A. M., Dollhopf, N. M., Corby, J. F., et al. 2016, Ap J, 827, 21. https://doi.org/10.3847%2F 0004-637x%2F 827%2F 1%2F 21 · doi ↗
- 4Cazaux et al. (2003) Cazaux, S., Tielens, A. G. G. M., Ceccarelli, C., et al. 2003, Ap J, 593, L 51. http://stacks.iop.org/1538-4357/593/i=1/a=L 51
- 5Charnley (2004) Charnley, S. B. 2004, Ad Sp R, 33, 23. http://www.sciencedirect.com/science/article/pii/S 0273117703008561
- 6Chuang et al. (2017) Chuang, K.-J., Fedoseev, G., Qasim, D., et al. 2017, MNRAS, 467, 2552. http://dx.doi.org/10.1093/mnras/stx 222 · doi ↗
- 7Codella et al. (2015) Codella, C., Fontani, F., Ceccarelli, C., et al. 2015, MNRAS, 449, L 11. http://dx.doi.org/10.1093/mnrasl/slu 204 · doi ↗
- 8Codella et al. (2010) Codella, C., Lefloch, B., Ceccarelli, C., et al. 2010, A&A, 518, 4. http://dx.doi.org/10.1051/0004-6361/201014630 · doi ↗