On the curious pulsation properties of the accreting millisecond pulsar IGR J17379-3747
Peter Bult, Craig B. Markwardt, Diego Altamirano, Zaven Arzoumanian,, Deepto Chakrabarty, Keith C. Gendreau, Sebastien Guillot, Gaurava K., Jaisawal, Paul. S. Ray, Tod E. Strohmayer

TL;DR
This study presents NICER observations of the 468 Hz accreting millisecond pulsar IGR J17379-3747, revealing energy-dependent pulsation delays, large pulse fractions, and pulsations at very low luminosities, offering insights into pulsar geometry and transitional states.
Contribution
It provides detailed spectral and timing analysis of IGR J17379-3747, highlighting extreme pulsation properties and their potential explanation through viewing geometry and magnetic misalignment.
Findings
Energy-dependent pulsation delays (~640 microseconds)
Pulse fractions exceeding 20%, fluctuations up to 70%
Detection of pulsations at low luminosity (~5 x 10^33 erg s^-1)
Abstract
We report on the Neutron Star Interior Composition Explorer (NICER) monitoring campaign of the 468 Hz accreting millisecond X-ray pulsar IGR J17379-3747. From a detailed spectral and timing analysis of the coherent pulsations we find that they show a strong energy dependence, with soft thermal emission lagging about 640 microseconds behind the hard, Comptonized emission. Additionally, we observe uncommonly large pulse fractions, with measured amplitudes in excess of 20% sinusoidal fractional amplitude across the NICER passband and fluctuations of up to ~70%. Based on a phase-resolved spectral analysis, we suggest that these extreme properties might be explained if the source has an unusually favorable viewing geometry with a large magnetic misalignment angle. Due to these large pulse fractions, we were able to detect pulsations down to quiescent luminosities (~5 x 10^33 erg s^-1). We…
Click any figure to enlarge with its caption.
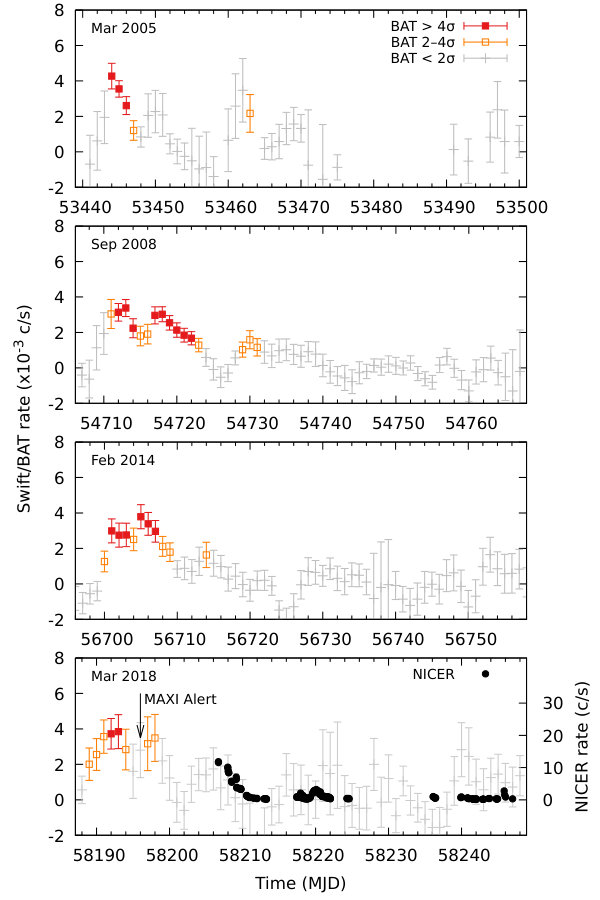 Figure 1
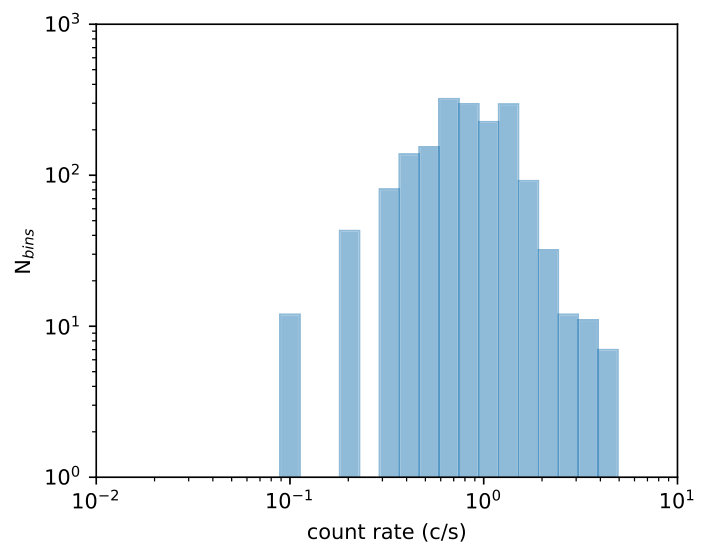 Figure 2
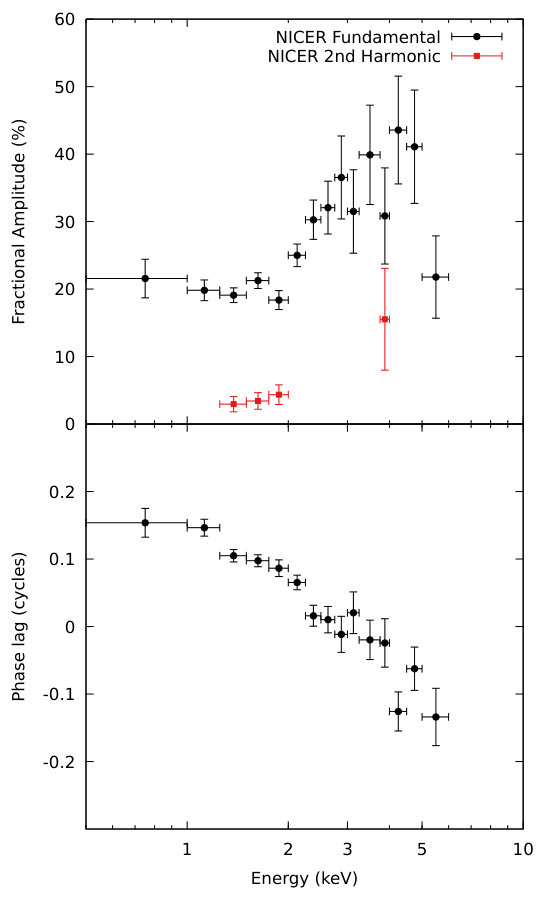 Figure 3
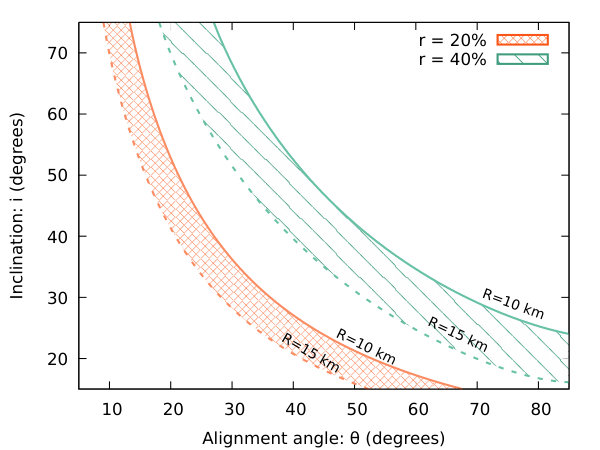 Figure 4
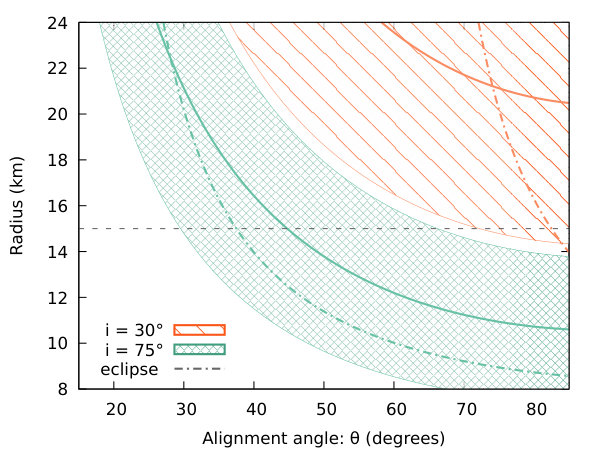 Figure 5
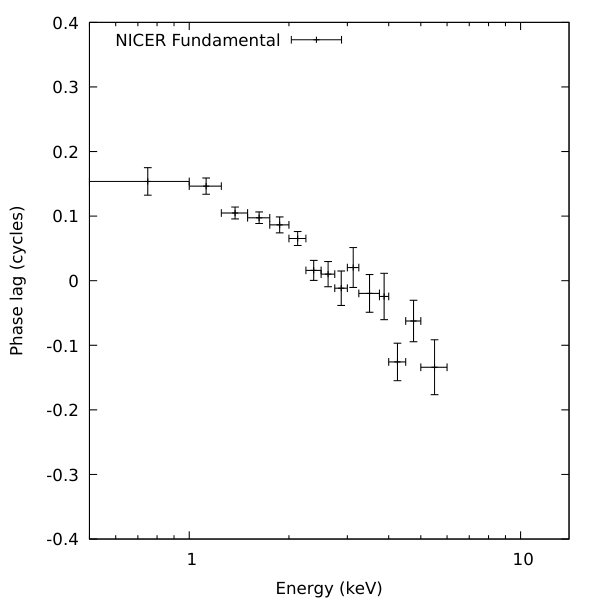 Figure 6
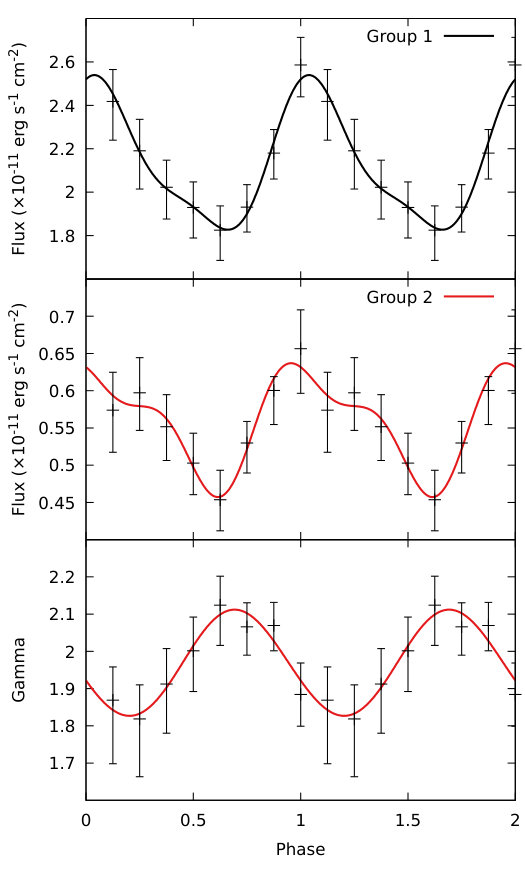 Figure 7
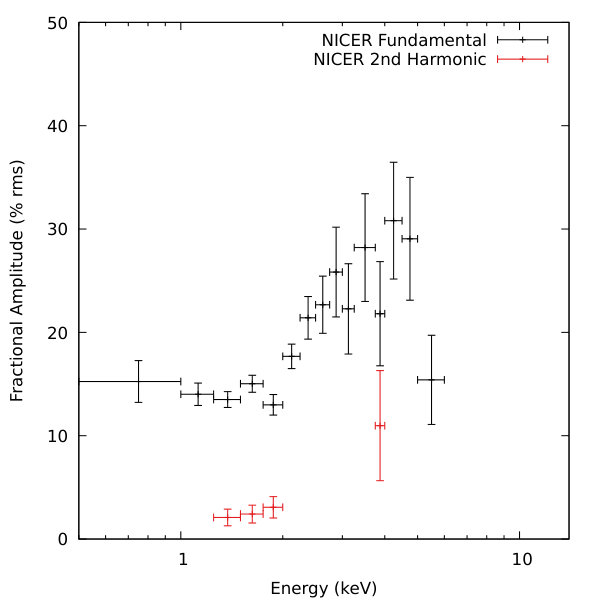 Figure 8
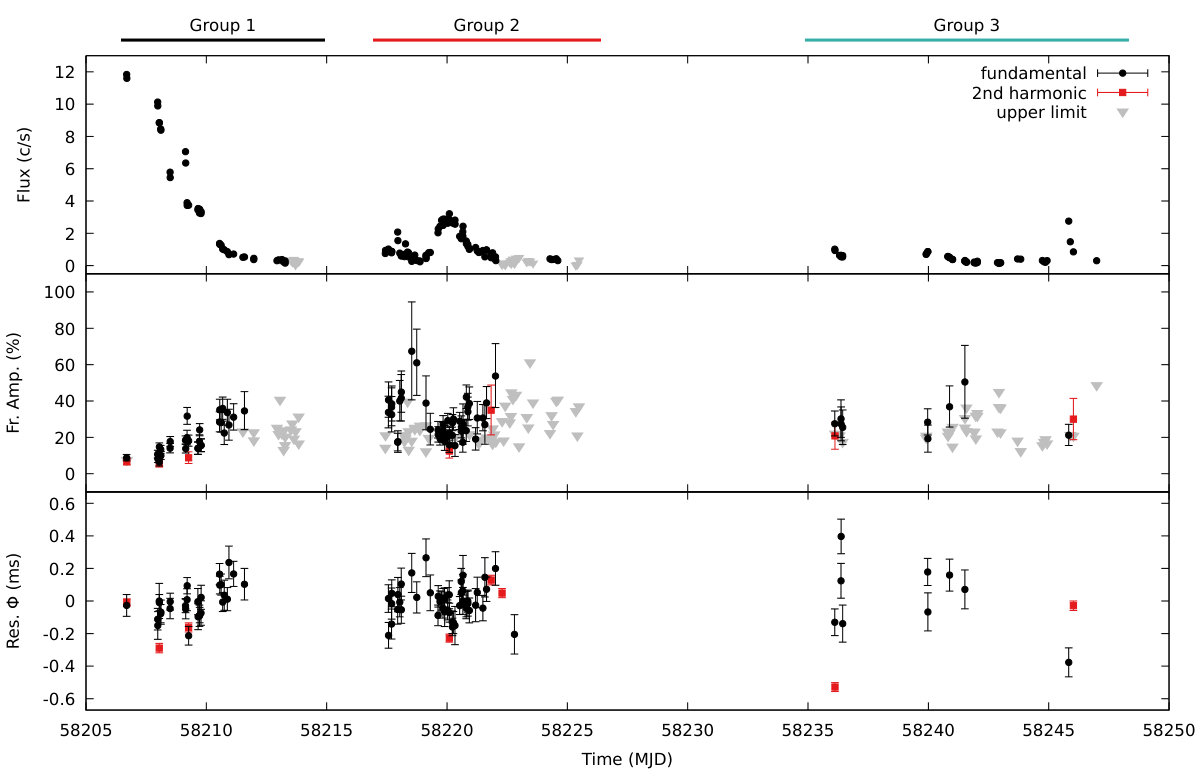 Figure 9
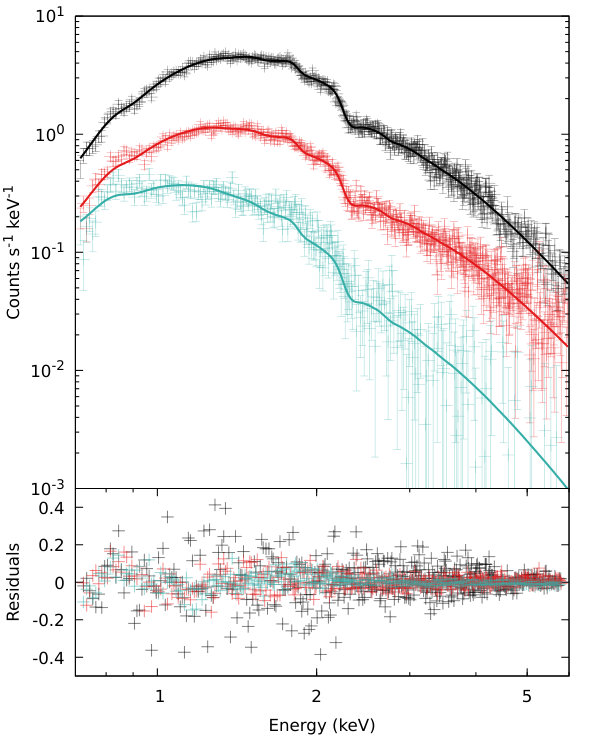 Figure 10
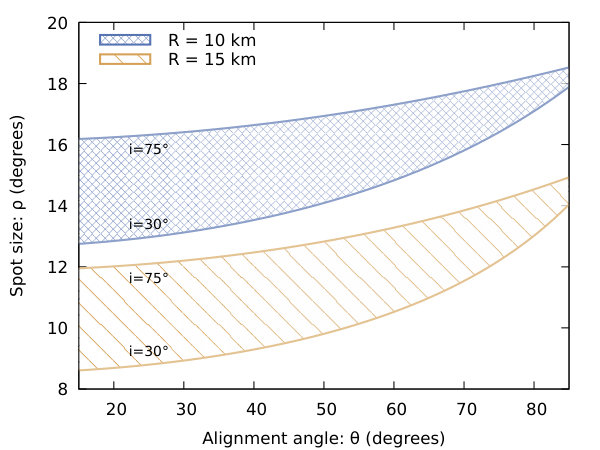 Figure 11
| tbabs | bbodyrad | bbodyrad | nthcomp | |||||
| norm | norm | norm | ||||||
| Group | ( cm-2) | (keV) | () | (keV) | (keV) | |||
| 1 | - | - | ||||||
| 2 | - | - | ||||||
| 3 | - | - | - | |||||
| Parameter | Value | Uncertainty |
|---|---|---|
| (Hz) | 468.083266605 | 7 |
| (Hz s-1) | ||
| (lt-ms) | 76.979 | 1.4 |
| (s) | 6765.8388 | 1.7 |
| (MJD) | 58208.966409 | 4 |
| /dof | 192 / 119 |
| Group | Parameter | Fr. Amp. | Phase |
|---|---|---|---|
| 1 | modbb norm | ||
| modbb kT | |||
| nthcomp Gamma | |||
| nthcomp flux 1 | |||
| nthcomp flux 2 | |||
| 2 | modbb norm 1 | ||
| modbb norm 2 | |||
| modbb kT | |||
| nthcomp Gamma | |||
| nthcomp flux 1 | |||
| nthcomp flux 2 | |||
| 3 | modbblow norm | ||
| modbblow kT | |||
| modbb norm | |||
| modbb kT |
Peer Reviews
No public reviews on file for this paper yet. If you reviewed it on a platform where reviews are public (OpenReview, ICLR, NeurIPS, ICML), you can paste yours below so the community can read it here.
Videos
No videos yet. Explain this paper in a talk, walkthrough, or lecture? Add one.
On the curious pulsation properties of the accreting millisecond pulsar IGR J17379–3747
Peter Bult
Astrophysics Science Division, NASA’s Goddard Space Flight Center, Greenbelt, MD 20771, USA
Craig B. Markwardt
Astrophysics Science Division, NASA’s Goddard Space Flight Center, Greenbelt, MD 20771, USA
Diego Altamirano
Physics & Astronomy, University of Southampton, Southampton, Hampshire SO17 1BJ, UK
Zaven Arzoumanian
Astrophysics Science Division, NASA’s Goddard Space Flight Center, Greenbelt, MD 20771, USA
Deepto Chakrabarty
MIT Kavli Institute for Astrophysics and Space Research, Massachusetts Institute of Technology, Cambridge, MA 02139, USA
Keith C. Gendreau
Astrophysics Science Division, NASA’s Goddard Space Flight Center, Greenbelt, MD 20771, USA
Sebastien Guillot
CNRS, IRAP, 9 avenue du Colonel Roche, BP 44346, F-31028 Toulouse Cedex 4, France
Université de Toulouse, CNES, UPS-OMP, F-31028 Toulouse, France
Gaurava K. Jaisawal
National Space Institute, Technical University of Denmark, Elektrovej 327-328, DK-2800 Lyngby, Denmark
Paul. S. Ray
Space Science Division, Naval Research Laboratory, Washington, DC 20375-5352, USA
Tod E. Strohmayer
Astrophysics Science Division and Joint Space-Science Institute, NASA’s Goddard Space Flight Center, Greenbelt, MD 20771, USA
Abstract
We report on the Neutron Star Interior Composition Explorer (NICER) monitoring campaign of the 468 Hz accreting millisecond X-ray pulsar IGR J17379–3747. From a detailed spectral and timing analysis of the coherent pulsations we find that they show a strong energy dependence, with soft thermal emission lagging about 640 s behind the hard, Comptonized emission. Additionally, we observe uncommonly large pulse fractions, with measured amplitudes in excess of 20% sinusoidal fractional amplitude across the NICER passband and fluctuations of up to . Based on a phase-resolved spectral analysis, we suggest that these extreme properties might be explained if the source has an unusually favorable viewing geometry with a large magnetic misalignment angle. Due to these large pulse fractions, we were able to detect pulsations down to quiescent luminosities ( erg s*-1*). We discuss these low-luminosity pulsations in the context of transitional millisecond pulsars.
stars: neutron – X-rays: binaries – X-rays: individual (IGR J17379–3747)
††facilities: ADS, HEASARC, NICER††software: heasoft (v6.24), nicerdas (v004), tempo2 (Hobbs et al., 2006)
1 Introduction
The X-ray transient IGR J17379–3747 (hereafter IGR J17379) harbors an accreting neutron star in a low-mass X-binary system (LMXB). It was first discovered through the detection of a type I X-ray burst with IBIS/ISGRI aboard the International Gamma-Ray Astrophysics Laboratory (INTEGRAL) on February 17, 2004 (Chelovekov et al., 2006). At the time, the source coordinates could not be precisely determined, leading to shifting source designations (Chelovekov et al., 2006; Chelovekov & Grebenev, 2010) and a separate classification in the Rossi X-ray Timing Explorer (RXTE) archive (Markwardt et al., 2008). The source was ultimately cataloged as IGR J17379 (Bird et al., 2007; Krivonos et al., 2007), with the X-ray localization determined with Swift/XRT (Krimm et al., 2008). The source distance is not precisely known. Based on its location in the direction of the Galactic center an assumed distance of 8.5 kpc is typically adopted.
The analysis of archival INTEGRAL and RXTE observations showed that the 2004 X-ray burst of IGR J17379 occurred during a 40 day outburst (Markwardt et al., 2008; Chelovekov & Grebenev, 2010). The earliest source detection was on 2014 February 14, shortly before the source reached a peak X-ray luminosity of erg s*-1* (assuming an 8.5 kpc distance). During the outburst, IGR J17379 was not persistently visible, rather it cycled through a series of reflares, each lasting about a week.
On September 2, 2008, routine monitoring with RXTE revealed renewed activity from IGR J17379 (Markwardt et al., 2008; Shaw et al., 2008). Slightly brighter, with a peak X-ray luminosity of erg s*-1*, this second outburst did not show the reflaring pattern observed previously. Instead, it followed a more regular and gradual decline in flux, with the total outburst lasting roughly weeks.
It was not until March 19, 2018 that MAXI/GSC reported the source had returned to outburst (Negoro et al., 2018). Subsequent follow-up with the Neutron Star Interior Composition Explorer (NICER) enabled the discovery of 468 Hz coherent X-ray pulsations (Strohmayer et al., 2018), marking IGR J17379 as an accreting millisecond X-ray pulsar (AMXP) in a 1.88 hour binary orbit. Sanna et al. (2018) then reinvestigated the archival RXTE data and were able to recover pulse detections in both previous outbursts.
Following an initial decline in luminosity, the source was observed to re-brighten around April 9, 2018 (van den Eijnden et al., 2018b), based on which we triggered more extensive follow-up observations with NICER. In this work, we report on the resulting 40 day NICER monitoring campaign of IGR J17379 during its 2018 outburst. In section 2 we describe characteristics of these data. In section 3 we present our spectral and timing analysis of the averaged and pulsed emission, and, finally, in section 4 we offer an interpretation of our results and a discussion of the implications for this source.
2 Observations
NICER is a non-imaging X-ray telescope mounted on the International Space Station (ISS; Gendreau et al. 2016). Its X-ray Timing Instrument (XTI) is a collection of 56 co-aligned X-ray concentrator optics and silicon drift detector pairs. These detectors are sensitive in the keV energy band (Prigozhin et al., 2012), providing a time resolution of ns (rms) and an energy resolution of eV. With 52 active detectors, NICER has a collecting area of cm2 at keV.
We used NICER to observe the X-ray transient IGR J17379 starting on 2018 March 29 (MJD 58206.7) and continued to monitor the source through 2018 May 10 (MJD 58248.3). These data are available under ObsID , where runs from through . All NICER data were processed using the nicerdas software (version V004), which is released as part of heasoft version 6.24. Initially, we applied standard cleaning and filtering criteria: we selected only those epochs where the pointing offset was , the dark Earth limb angle , the bright Earth limb angle , and the ISS location was outside of the South Atlantic Anomaly (SAA). Under these criteria, we obtained ks of useful exposure.
In order to account for flaring fluctuations in the X-ray background, we constructed a light curve in the keV energy band (see also Bult et al., 2018). At these energies, the performance of the XTI is such that essentially no astrophysical signal is expected. Hence, we used this light curve as a tracer for increased background activity. Specifically, we binned the light curve using an -s resolution and removed all epochs where the count-rate was greater than ct s*-1*. Approximately ks of exposure was filtered out with this method.
Finally, we used the ftool barycorr to apply barycentric corrections to the cleaned data. We used the JPL DE405 Solar System ephemeris (Standish, 1998) and the radio source coordinates of van den Eijnden et al. (2018a). We estimated the background contribution from NICER observations of the RXTE blank field regions (Jahoda et al., 2006). No X-ray bursts were detected.
3 Analysis & Results
3.1 Light Curve
Because IGR J17379 is a faint source in the NICER band, we limit our analysis to the keV energy band, where the instrument is most sensitive. The day NICER light curve for this energy range is shown in the top panel of Figure 1. Over the first days of our NICER campaign, the source flux decayed from about ct s*-1* to below the background level of about 0.5 ct s*-1* on MJD 58213. In follow-up observations collected four days later, however, we could again detect the source. Over the following 5 days, IGR J17379 showed a reflare that peaked at 4 ct s*-1* and lasted until MJD 58218.6, when the source again dropped below our background level. Continued monitoring of IGR J17379 gave positive source detections from MJD 58236 onwards, with a notable short term increase in emission on MJD 58245.8. Further monitoring was limited by pointing constraints.
3.2 Swift/BAT light curve
In order to place the NICER observations in a historic context, we analysed the Swift/BAT daily monitoring light curve (Krimm et al., 2013) to establish the past outburst behavior of IGR J17379. Hence, we applied a moving average to the daily light curve, using a window width of 3 days and a stride of 1 day. We then searched for all epochs where the averaged flux had a greater than deviation from zero and considered those epochs as candidate outburst detections. This approach correctly identified both the 2008 and 2018 outbursts. Additionally, we found there were two other epochs where IGR J17379 appears to have been active; March 2005 and February 2014. The light curves of all four events are shown in Figure 2. In the bottom panel of this figure, showing the 2018 outburst, we have further overlaid the outburst progression as observed with NICER and indicated the date at which MAXI/GSC first reported on the 2018 outburst. The flux evolution of all four events is phenomenologically similar: they show a week-long main outburst cycle whose peak luminosity is clearly detected (), followed by a week long reflare with a peak flux that is only marginally detected (). Since this is the same outburst pattern that was reported for the 2004 outburst (Chelovekov et al., 2006; Markwardt et al., 2008), we argue that all candidates are in fact real outbursts.
The comparison of the NICER and Swift/BAT light curves for the 2018 data indicates that the initial flux decay observed with NICER was likely associated with a reflare and not the first flux cycle of the outburst. Additionally, we see that much of the NICER light curve samples source luminosities that are well below the detection threshold of an all-sky monitor such as Swift/BAT. These results indicate that IGR J17379 is a much more prolific transient than previously believed.
3.3 Spectroscopy
We performed a spectroscopic analysis of our data by splitting the observations into three chronological groups: the first group covers the initial flux decay (up to MJD 58215), the second group encapsulates the reflare (up to MJD 58226), and the third group captures the remaining data (see also Figure 1).
We extracted a keV energy spectrum for each data grouping and modelled those spectra using xspec version 12.10 (Arnaud, 1996). We found that an absorbed Comptonized power law model provided a statistically adequate description of the initial flux decay spectrum (dof). Furthermore, this model did significantly better than a single- or multi-temperature blackbody (dof). Due to the presence of coherent pulsations, however, we may expect the source to show both thermal and Comptonized emission (see, e.g. Sanna et al., 2018). Indeed, we found that such a two-component model provided a statistically equivalent fit of the data (dof). We therefore quantified the spectrum in terms of the xspec model
tbabs (bbodyrad + nthcomp),
using the abundances of Wilms et al. (2000) and cross-sections from Verner et al. (1996) and give the best-fit parameters in Table 1. Additionally, we extracted a separate spectrum at the highest observed count-rate (ObsID ), and added the cflux component to the above model to measure the keV source X-ray flux (all flux measurements henceforth will refer to this same keV range). We found the highest flux to be erg s*-1* cm*-2*, which translates to a source X-ray luminosity of erg s*-1*, presuming a kpc distance.
The spectral group covering the reflare had a similar, but slightly harder, continuum shape as the first group. It could also be adequately described as either a single Comptonized power law, or using a Comptonization plus blackbody model. We again quantified the spectrum in terms of the two-component model, with the best-fit parameters listed in Table 1. We further measured the source flux at the highest observed count-rate during the reflare (ObsID ), finding a source flux of erg s*-1* cm*-2*, which gives an approximate source luminosity of erg s*-1*.
Finally, we considered the third spectral group, which covers the remaining data. During this period IGR J17379 mostly hovered just above the background level (see Figure 1). The source was very soft, and could not be significantly detected above keV (Figure 3). Comptonization models (powerlaw or nthcomp) gave a poor description of this spectrum and yielded unreasonably large photon indices (). Instead we found that the spectrum was best described by two blackbodies: the first at a temperature of keV - as seen in the other groups - and the second at a temperature of keV (see Table 1 for the full model). We also measured the X-ray flux during this phase of prolonged low-level activity, finding a flux of erg s*-1* cm*-2*, with an associated luminosity of erg s*-1*.
3.4 Timing
For our timing analysis, we initially divided the keV light curve into 32-s segments and computed a Leahy-normalized power spectrum for each of them. We then averaged all segments to a single power spectrum and renormalized the powers in terms of fractional rms amplitude with respect to the source flux (van der Klis, 1995). The resulting power spectrum showed a band-limited noise component at low frequencies and a distinct pulse spike at Hz.
To further characterize the stochastic noise, we modelled the power spectrum using a zero-centered Lorentzian profile (Belloni et al., 2002). We find a goodness of fit statistic of for degrees of freedom, giving best fit characteristic frequency Hz, and a fractional rms amplitude of . No other band-limited noise or quasi-periodic variability was observed at either higher or lower frequencies.
In order to characterize the coherent pulsation, we initially analyzed the first five ObsIDs with the aim of recovering the Keplerian parameters of the binary orbit. To that end, we divided our keV light curve into segments of continuous exposure (typically 600 to 1100 seconds) and applied an acceleration search to each individual segment (Ransom et al., 2002). We detected the pulsation in 11 of 18 segments, each giving a different centroid frequency and acceleration measurement. The observed frequency modulation could be described by a Hz centroid frequency pulsation that is shifted due to a circular orbit with period s, projected semi-major axis lt-s, and time of ascending node . This, and all reference times going forward, are expressed in MJD (TDB).
3.4.1 Coherent Timing
To investigate the pulse and its evolution, we performed a coherent timing analysis of the pulsations. For any of the data selections considered, we first assumed a binary ephemeris and adjusted the photon arrival times to the binary barycenter. Then we folded the data on the pulse period to construct a pulse profile. This profile was modeled with a constant for the non-pulsed contribution, and sinusoids, each with fixed frequency . Hence, described the fundamental pulsation, the second harmonic, and so forth. An harmonic was considered to be significantly detected if its measured amplitude exceeded the -confidence amplitude threshold of the noise distribution. If so, the pulse amplitude is expressed in terms of its sinusoidal fractional amplitude. That is,
[TABLE]
where is the measured amplitude of the -th harmonic, the number of photons in the dataset, and the number of photons contributed by the background emission. If an harmonic amplitude was not significantly detected, we calculated an upper limit as the minimum signal amplitude that would have produced a measurement in excess of the noise threshold of the time.
Next, we further refined our model parameters by applying a phase coherent analysis to the binary period. For each segment we optimized the time of ascending node through a grid search method: we constructed a grid with varying around its preliminary value, propagated to be near to the observational time window. This grid spanned one orbital period using 1000 steps. For each trial on the grid, we then measured the pulse amplitude, and picked the trial with the largest amplitude as the best timing solution. This method gave us 16 measurements of successive ascending node passages, which we modeled as
[TABLE]
where gives the number of orbital cycles between the reference epoch and the -th measurement. The resulting best-fit parameters were111The semi-major axis estimate obtained in the previous subsection is covariant with the binary period. Hence, the improved measurement, implies an improved .
, s, with lt-s. This solution proved to be sufficiently accurate to allow for a coherent analysis of the pulsations.
Finally we considered all ObsIDs. For each segment of continuous exposure we constructed a pulse profile and measured the pulse time of arrival. We fit these arrival times with a constant frequency and a circular orbital model using tempo2 (Hobbs et al., 2006) and refold the data using the improved ephemerides. We iterated through this procedure until the timing solution had converged. The best-fit parameters are listed in Table 2 and the resulting pulse amplitudes and phase residuals are shown in Figure 1. We note that our timing solution is statistically consistent with the long term timing solution reported by Sanna et al. (2018).
3.5 Energy dependence
We investigated the pulse profile energy dependence by splitting the keV energy range into smaller bands. For each band, we folded all available data on the timing solution in Table 2 and measured the pulse significance. The widths of the energy bands were determined dynamically. Starting at the low-energy bound, we set a minimum channel width of 0.25 keV. We then iteratively increased the upper bound by 0.25 keV until the fundamental pulse amplitude was detected at a significance greater than , before moving on to the next band until the full energy range was covered. The energy-dependent fractional amplitudes and pulse phases resulting from this procedure are shown in Figure 4.
The fractional pulse amplitude of IGR J17379 demonstrates clear energy dependence: below keV the fractional amplitude is roughly constant at . Above keV the fractional amplitude increases rapidly to at 4 keV.
The pulse phase of IGR J17379 also shows a clear energy dependence. At keV the pulsations lag 0.15 cycles behind the averaged profile. At keV, on the other hand, the pulsations lead the averaged profile by about 0.15 cycles. Hence, over the NICER passband, we observed a soft lag of about s, or, equivalently, of about .
3.6 Phase-resolved spectroscopy
We investigated the energy dependence of the pulsations in more detail by performing a pulse-phase-resolved spectral analysis. We divided the pulse period into phase bins of equal width and extracted an energy spectrum for each of these bins. For this procedure, we used the same data grouping as described in section 3.3.
Each set of phase-resolved spectra was fit using the model described in section 3.3, keeping the absorption column fixed at the value reported in Table 1 and letting the remaining parameters vary. In our initial analysis, we found that the phase-dependent variations in the blackbody parameters (temperature and normalization) were covariant with the photon index, which prevented us from accurately determining either in a completely free fit. Hence, in an attempt to improve the sensitivity of our parameter estimation, we chose to parameterize the blackbody normalization and temperature using sinusoidal functions. Specifically, we replaced the previously used bbodyrad component with a modulated counterpart that was defined as
modbb = bbodyrad(kT mod(i,r_kt,phi_kt))
modbb mod(i,r_norm,phi_norm),
where kt was fixed to the phase-averaged value and
mod(i,r,phi) = 1 + rcos((i()+phi)),
with r the fractional amplitude of the oscillation, i fixed to the respective phase bin of the phase-resolved spectrum, and the bin offset was added to align each spectrum with the center of the pulse phase bin. Finally, the parameter phi gives the phase offset relative to the broad-band averaged pulse. It is defined between bin, such that a negative phase indicates a lag with respect to the average pulsation, and a positive phase represents a lead. The photon index of the nthcomp component was left free to vary with pulse phase. Because such potential variations affect the component spectral shape, we further chose to use a cflux component to measure variations in the integrated flux, rather than the normalization for the Comptonized emission.
Fitting our model to the phase-resolved spectra of the first spectral group (dof), we found that the blackbody component showed an oscillation in normalization (), while variations in temperature were not significant. The Comptonized power law, meanwhile, was similarly found to oscillate in normalization but not in photon index. Additionally, the flux contribution of the power law showed a significant second harmonic. The measured oscillation in flux is shown in Figure 5, and the detailed best-fit parameters are listed in Table 3.
Applying the same model to the phase-resolved energy spectra of the second spectral group (dof), we found that both the temperature and the normalization of the blackbody component showed significant oscillations at the pulse period. The temperature oscillation was modest () and compatible with the upper limit found previously. The normalization, on the other hand, was found to be consistent with being entirely pulsed (). Because a pulse fraction this large suggests that the profile might be deviating from its sinusoidal shape, we further added a second harmonic to the modulating blackbody. We found marginal evidence for the presence of such an harmonic (), suggesting that the profile is slightly asymmetric. The Comptonized power law, meanwhile, again showed harmonic content in its flux oscillation, and a small oscillation in photon index could also be measured (see Table 3).
Finally, for the third spectral group, we considered a spectral model that consisted of two modulated blackbody components (dof). The higher temperature blackbody (i.e., the one that is similar to the blackbody seen in the previous spectral groups) was again found to be oscillating, albeit at a smaller pulse fraction (). The temperature was still seen to oscillate, with similar parameters as found earlier. The lower temperature blackbody, meanwhile, appeared to be insensitive to rotational phase, although we note that our upper limit on the fractional amplitude is not especially constraining.
4 Discussion
We have presented the results of a coherent timing and spectral analysis of the AMXP IGR J17379 during its 2018 outburst as observed with NICER. Our monitoring campaign spanned 40 days and showed a three-stage progression in the light curve: a linear flux decay, a reflare, and a very low-flux state during which the source luminosity ( erg s*-1*) was on par with quiescence. We found that the source showed significant 468 Hz pulsations throughout all three stages and that the character of those pulsations was highly variable. The fractional pulse amplitude was found to change with time from as low as to as high as , with the bulk of our observations yielding amplitudes in the range. In addition to variations with time, the pulsations were also found to vary as a function of energy. Taken on average, the pulse amplitude increased with energy and exhibited a strong soft lag, with the keV emission lagging behind the keV emission by s.
In the following, we interpret our findings in terms of the source properties and accretion geometry, and explore their wider implications for the population of accreting millisecond pulsars. We first consider the pulse properties and the results of our phase-resolved analysis and then move on to discuss system properties and the accretion process in this source and the wider population.
4.1 Pulse properties
Most AMXPs have fractional pulse amplitudes on the order of and show amplitude variations with time and energy (Patruno & Watts, 2012). While some sources have shown pulse fractions up to around (Chou et al., 2008; Papitto et al., 2010), the systematically large fractional amplitudes observed in IGR J17379 are highly unusual. This suggests to us that the viewing geometry of this pulsar (the particular combination of its beaming pattern, observer inclination222The inclination angle of the neutron star spin axis. , , and magnetic alignment333 The alignment angle, or magnetic colatitude, gives the angle between the neutron star magnetic and rotational axes. , ) is uncommonly favourable. For instance, the magnetic alignment angle might be large, while its offset from the inclination angle () might be small. These two conditions would create a large amplitude aspect variation of the hot spot as the star rotates.
A second feature of the pulse amplitude behavior is the large range of their fluctuations with time (see Figure 1). Our earliest observations yielded pulse fractions on the order of , but the pulsations increased in amplitude and variability as the mass accretion rate declined, and subsequently as the source showed its reflare. Such fluctuations in the pulse amplitude can arise in two ways. First, there may be a non-pulsed source of emission contributing to the total flux, such as direct disk emission or perhaps due to lateral accretion onto the star through interchange instabilities (Arons & Lea, 1976). Both of these emission mechanisms are sensitive to the mass accretion rate and would cause a smaller non-pulsed contribution as the accretion rate drops, qualitatively matching our data. Second, fluctuations in the mass accretion rate could influence the size and position of the hot spot (Patruno et al., 2009b; Kulkarni & Romanova, 2013), which manifests as a shift in pulse amplitude and phase. Some evidence for this second scenario can be found in the correlation between pulse amplitude and phase residuals (Lamb et al., 2009) and in the excess timing noise found in our coherent timing analysis (section 3.4.1). In this interpretation, the large shifts in pulse fractions suggest that the inclination is likely large, so that small changes in the hot spot position cause large changes in the observed pulse properties.
The energy-dependent pulse-phase lags are also unusual. While soft lags are ubiquitous in AMXPs (Gierliński et al., 2002; Falanga et al., 2005b; Gierliński & Poutanen, 2005; Falanga et al., 2005a, 2012; Sanna et al., 2017), the magnitude of these lags are much larger in IGR J17379 than in other AMXPs. The pulse properties of AMXPs are generally interpreted in terms of a two-component model, with blackbody emission originating from a thermal hot spot on the stellar surface, and Comptonized emission emerging from a shock in the accretion column above the surface (Gierliński et al., 2002). Each component has a separate aspect variation and beaming pattern, which, together, naturally explains both the soft-lag and the difference in harmonic content as a function of energy (Poutanen & Gierliński, 2003). A very large soft lag can then be explained if the Comptonized emission originates from a radially extended region above the hot spot (Wilkinson et al., 2011). In such a geometry, the effective area of the soft emission peaks when the hot spot is pointed toward the observer. The effective area of the hard emission, however, peaks when the hot spot is furthest away from the observer and the solid angle of the accretion column is maximized. Because the rotational Doppler boost is maximized as the hot spot rotates into view, its effect on the phase of each spectral component is opposite: the soft emission is shifted to an earlier phase, whereas the hard emission is shifted toward a later phase. Hence, the combination of aspect variations and Doppler boosting can plausibly explain a offset between the softest and hardest pulsed emission.
4.1.1 Accretion geometry
A robust analysis of the accretion geometry implied by the observed pulse shapes requires a numerical treatment of beaming, light bending and other relativistic effects (see, e.g., Salmi et al., 2018, and references therein), which is well beyond the scope of this work. Nonetheless, we may still obtain some first-order constraints on the viewing geometry from the results of our pulse-phase-resolved spectral analysis.
All three of our spectral groups indicate a thermal component that oscillates in normalization. While the fractional amplitude of the oscillation varies wildly between the groups, the absolute amplitudes of modulation imply that the emission area shows a gradual evolution. From the first to third group, we find that the apparent area of modulation seen at infinity is km. Following Poutanen & Gierliński (2003), we can then estimate the angular size of the hot spot as
[TABLE]
where
[TABLE]
and is the gravitational Schwarzschild radius, with the gravitational constant, the neutron star mass, and its radius. In Figure 6, we show the regions of allowed spot sizes as a function of for a choice of inclinations and radii, and a canonical neutron star of . The inclination of IGR J17379 is only weakly constrained. All we know is that the source does not exhibit eclipses, hence the system is not viewed edge on (Sanna et al., 2018). Presuming that the neutron star rotation is aligned with the orbital plane this implies . Due to the large pulse fraction, we suggest the inclination is unlikely to be small, so we choose a lower bound of . Based on these weak limits, we find that the spot size is likely constrained to , independent of the alignment angle, but we note that larger inclinations favor larger spot sizes.
Two of three spectral groups also show an oscillation in blackbody temperature. In both cases, the oscillation fractional amplitude is on the order of , which we note is consistent with the upper limit derived for the other spectral group. We further found that in both our measurements, the temperature oscillation leads the maximum in blackbody area by about . This implies that the apparent temperature is largest as the hot spot starts to rotate toward the observer, which immediately suggests an origin in a rotational Doppler boost. We note that the largest Doppler boost achievable is observed when the system is viewed edge on and the spot is located at the equator, with the boosting factor given by
[TABLE]
Accounting for the alignment angle and system inclination, we can relate this boosting factor to the observed change in blackbody temperature as (Gierliński et al., 2002)
[TABLE]
so that we obtain an approximate relation between the viewing angles ( and ) and the neutron star radius. In Figure 7 we plot this relation for two assumed inclinations and a temperature variation of . While these trends are approximate and have substantial uncertainty regions, they still demonstrate that for realistic radii ( km), IGR J17379 strongly favors large inclination () and alignment angles ().
In addition to a modulation of the blackbody emission parameters, we find that the Comptonized emission independently oscillates at the pulse period. Comparing the two spectral groups where this power law emission is present, we see that both fractional amplitude and hard emission emission phase remain practically unchanged. The main differences are that the mean intensity goes down and that the second harmonic shows a phase shift, thus increasing the asymmetry of the hard pulse profile. Both the stability of the hard emission and the presence of a second harmonic support our interpretation that this emission originates in a radially extended region, as such a region would be far less sensitive to small changes in the hot spot location or shape. Also, different heights above the surface would experience slightly different Doppler boosts, which would naturally produce an asymmetric pulse profile (Gierliński & Poutanen, 2005). A rather interesting property of our measurements is the apparent oscillation in photon index, which is nearly out of phase with the power law flux. Qualitatively, this relation might also be explained by the viewing geometry: the effective area of the accretion column is smallest when the hot spot points toward the observer, yet that is the phase at which the optical depth is maximized, thus the photon index should be out of phase.
Perhaps the most striking result of our pulse-phase-resolved analysis comes from the second spectral group, where we find a fractional amplitude for the blackbody normalization, and an apparently asymmetric profile (from the evidence for a second harmonic). While we caution that this measurement has substantial statistical and modeling uncertainty (see Table 3 and section 3.6), this apparent deviation of the pulse profile could indicate that the hot spot is being partially obscured by the neutron star. According to Beloborodov (2002), such partial obscuration occurs when
[TABLE]
which we have drawn as dashed-dotted lines in Figure 7. We find that the condition to partial obscuration of the hot spot are indeed broadly consistent with the geometry requirements obtained from the blackbody temperature variation, and again prefer a system with a large magnetic misalignment angle.
4.2 Outburst evolution
The NICER X-ray light curve showed three stages: an initial linear flux decay, a reflare, and a period of low activity. Comparing this progression with the Swift/BAT daily monitoring light curve, we found that the observed linear flux decay was likely associated with a reflare rather than the initial outburst cycle. The initial outburst cycle, instead, appears to have peaked about 10 days prior (around the time of the MAXI/GSC alert, see Figure 2) and was over before the first NICER observations were collected.
4.2.1 Reflares
The halting outburst progression we observed in IGR J17379 is not unique to this source. Similar reflares have been reported in other sources under various names, including: “rebrightenings,” “echo-outbursts,” “mini-outbursts,” and “flaring-tails”. This behavior has been reported for dwarf novae (e.g., Robertson et al., 1995; Kuulkers et al., 1996; Patterson et al., 2002), Galactic black hole binary systems (e.g., Bailyn & Orosz, 1995; Kuulkers et al., 1996; Tomsick et al., 2004), and non-pulsating accreting neutron stars (e.g., Šimon, 2010; Allen et al., 2015). Perhaps the most pertinent example of such reflaring behavior, however, may be found in the canonical AMXP SAX J1808.4–3658 (Wijnands et al., 2001; Patruno et al., 2009a).
As in SAX J1808.4–3658, the reflares observed in IGR J17379 have a roughly week-long duration, and peak at luminosities of erg s*-1*. This similarity may reflect the fact that these two AMXPs are also very similar in terms of their orbital parameters and their respective stellar companions (Chakrabarty et al., 2003; Sanna et al., 2018). Important differences, however, exist also: the main outbursts of SAX J1808.4–3658 are longer than those of IGR J17379 (Bult & van der Klis, 2015). Additionally, SAX J1808.4–3658 is known to show a prominent aperiodic 1-Hz modulation (van der Klis et al., 2000; Patruno et al., 2009b) which is absent in IGR J17379. A very similar aperiodic 1-Hz modulation has been reported in the outburst of NGC 6440 X-2 (Patruno & D’Angelo, 2013), a different AMXP whose outbursts are reminiscent of reflares in terms of duration and peak luminosity (Altamirano et al., 2010; Heinke et al., 2010). This 1-Hz modulation has been attributed to episodic accretion onto the neutron star (D’Angelo & Spruit, 2010, 2012), and hence is likely a signature of the magnetosphere/disk interaction, rather than being a signature of the reflare itself. Furthermore, the 1-Hz modulation has also been reported to occur in the main outburst (Bult & van der Klis, 2014), suggesting that the underlying instability has two mutually exclusive branches: it occurs either around erg s*-1* during the reflares, or around erg s*-1* during the main outburst. Hence the absence of such a 1-Hz modulation in IGR J17379 may not be meaningful.
It is not clear what causes some X-ray transients to show reflares toward the end of their outbursts. Nonetheless, as this phenomenon has been observed across source types, it is likely caused by the same ionization instability (Osaki, 1974; Lasota, 2001) that is generally assumed to cause the X-ray outbursts themselves. This common interpretation essentially views each reflare as a separate mini-outburst: a small change in the disk temperature causes hydrogen to partially ionize. This, in turn, increases the disk opacity, which further increases its temperature. As this instability grows, the mass accretion rate through the disk increases rapidly, and hence the source is observed to brighten in X-rays. The reason why this instability can be triggered several times in a row is unclear, both from an observational and theoretical perspective (Dubus et al., 2001; Lasota, 2001; Kotko et al., 2012). The NICER X-ray data alone are not especially informative on the matter. Constraints on the origin of these reflares should either come from a population study or a multi-wavelength observing effort (see e.g. Patruno et al., 2016). In this light, however, we point out that IGR J17379 appears to have a comparatively short and stable recurrence time and has reported counterparts in both radio (van den Eijnden et al., 2018a) and the optical/near-infrared (Curran et al., 2011). Hence we suggest that this source might make a compelling target for future multi-wavelength investigations.
4.2.2 Low-activity/Quiescence
Following the reflares, we observed IGR J17379 to transition into a prolonged low-activity state. In this state the source X-ray luminosity was about erg s*-1*, placing it in the erg s*-1* luminosity regime in which accreting neutron stars are usually considered to be in quiescence (Verbunt et al., 1984). In tandem with the decrease in luminosity, the source spectrum was observed to soften. Such late outburst spectral softening is commonly observed in both black hole (Wu & Gu, 2008; Plotkin et al., 2013) and neutron star binaries (Wijnands et al., 2015, and references therein). The soft spectrum of a quiescent neutron star can be attributed to either residual low-level accretion or to the gradual cooling of the stellar surface. It is often difficult to disentangle which of these two mechanisms applies, or at least, which one dominates the observed emission (see, e.g., Fridriksson et al., 2011). In IGR J17379, however, we continue to detect coherent pulsations, which is a clear indication that at least some channeled accretion continues even at the lowest luminosities.
Interestingly, very similar behavior has been reported for two of the three confirmed transitional millisecond pulsars (tMSPs Archibald et al., 2015; Papitto et al., 2015), the class of millisecond pulsars that bridge the gap between traditional AMXPs and rotationally powered millisecond pulsars observed in the radio (Papitto et al., 2013). Both PSR J1023+0038 and XSS J12270–4859 have shown coherent X-ray pulsations at luminosities of order erg s*-1*. In both cases, the X-ray pulsations were highly sinusoidal and had pulse fractions of %, similar to the X-ray pulsations seen in AMXPs. Neither of these two tMSPs, however, has shown the erg s*-1* X-ray outburst cycle of an AMXP, so the link between these two populations of pulsars has always been based on the similarity of their pulse profiles. The third confirmed transitional millisecond pulsar, IGR J18245–2452, did show a high luminosity outburst (Papitto et al., 2013), but that outburst was highly atypical for an LMXB, and no X-ray pulsations have been detected at quiescent luminosities (Linares et al., 2014). In IGR J17379, however, we observed both the outburst cycle and the low-activity state, and our pulse-phase-resolved spectroscopy demonstrates that the character of the pulsations does not change substantially with luminosity. Hence, IGR J17379 gives us strong evidence that the X-ray pulsations in the low-activity state are indeed accretion powered.
A second characteristic property that transitional pulsars show in their low activity regime, is a step-wise mode switching between a “low” and “high” luminosity state that differs in observed flux by a factor of 10 (Archibald et al., 2015; Bogdanov et al., 2015; Papitto et al., 2015). Unlike the transitional pulsars, IGR J17379 does not appear to be showing this characteristic mode switching. Indeed, if we construct a histogram of count-rates measured in 10-s bins (Figure 8), then we see no evidence of a bimodal population.
A caveat to this discussion is that the distance to IGR J17379 is not well constrained. If the source were substantially further away than the presumed 8.5 kpc, then we may be underestimating the luminosity by up to a factor of a few. We note, however, that the one X-ray burst observed from IGR J17379 had a double peaked profile and an estimated maximum luminosity near the Eddington limit (Chelovekov & Grebenev, 2010). If one assumes that this burst was Eddington limited (Kuulkers et al., 2003), then the inferred distance would place IGR J17379 at kpc (van den Eijnden et al., 2018a). Hence, while the source distance used in this work is uncertain, it is probably not too far off.
4.2.3 Accretion disk configuration
While the detection of X-ray pulsations at low luminosity in IGR J17379 (and likewise in the transitional pulsars) indicates that magnetically channeled accretion is taking place, it is not at all clear how to reconcile these observations with accretion theory. In the standard view of disk accretion the rotating magnetosphere of the neutron star imposes a centrifugal barrier (Illarionov & Sunyaev, 1975), such that accretion onto the star can proceed only while the disk is truncated inside the co-rotation radius
[TABLE]
If the disk is truncated outside this co-rotation radius, then the propeller effect should inhibit accretion and instead drive a mass outflow. We can consider the radius of the magnetosphere as the distance at which the magnetic field is strong enough to force the orbiting material of a Keplerian disk into co-rotation (Spruit & Taam, 1993; D’Angelo & Spruit, 2010)
[TABLE]
where gives the stellar magnetic field strength and the mass accretion rate onto the neutron star. If the observed erg s*-1* luminosity is entirely due to accretion, we can estimate the mass accretion rate at , which places the disk truncation outside the light-cylinder radius km. Hence, one would expect this system to be well inside the propeller regime, such that channeled accretion is not expected. There are three scenarios proposed in the literature that could resolve this issue (see, e.g., Archibald et al., 2015; Papitto et al., 2015; Patruno et al., 2016):
- •
As the accretion rate drops, the innermost region of the disk may transition into a radiatively inefficient accretion flow, allowing the formation of an optically thin, geometrically thick disk (Rees et al., 1982). Such a disk would convert less energy into radiation, so that the accretion rate may be much higher than inferred from the X-ray flux. A similar transition has been proposed to explain the late-outburst spectral softening in black hole binaries (Plotkin et al., 2013). However, it is not clear that this interpretation extends to neutron stars as well (Wijnands et al., 2015). Additionally, there is considerable theoretical uncertainty surrounding the properties of such a flow and how it might interact with the stellar magnetic field (Menou & McClintock, 2001; Dall’Osso et al., 2015), which makes it difficult to explore this scenario in depth.
- •
If the propeller ejects a very large fraction of the inflowing disk material, then it is possible that the neutron star magnetosphere is experiencing a much greater inward pressure from the disk than what is inferred from the X-ray flux (Lasota et al., 1999). Plausibly, this disparity may be large enough to place the inner edge of the disk near co-rotation, thus allowing channeled accretion to proceed. In practice, the outflow rate would have to be roughly two orders of magnitude larger than the rate obtained from the X-ray flux, which again implies that the accretion flow must be radiatively inefficient, since otherwise direct emission from the disk would have dominated our spectrum.
- •
Depending on the detailed microphysics governing the magnetosphere/disk interaction, the magnetosphere may not be able to drive an outflow (Spruit & Taam, 1993). Instead, the disk truncation radius could be “trapped” near co-rotation (Sunyaev & Shakura, 1977; D’Angelo & Spruit, 2010). Indeed this is the scenario invoked to explain the 1-Hz modulation in SAX J1808.4–3658 and NGC 6440 X-2 (Patruno et al., 2009a; Patruno & D’Angelo, 2013).
All three scenarios imply in one way or another that the X-ray flux is a poor estimate of the accretion rate onto the neutron star. Some independent evidence for this argument can be found in the parallel track phenomenon of LMXBs (van der Klis, 2001), and in the structured relation between the kHz QPOs and pulse amplitude of SAX J1808.4–3658 (Bult & van der Klis, 2015). However, there are also secondary consequences to this argument.
First, if there is a large mass outflow, one might expect an observational signature of that outflow in the radio data. The detection of a flat-spectrum radio counter-part (van den Eijnden et al., 2018a) supports this scenario, although we note that the radio data were not contemporaneous with the low-activity state, and detailed modeling would be required to determine if the observed radio flux is consistent with the mass ejection rate required by our X-ray data.
Second, for the magnetosphere to drive an outflow, a significant spin-down torque would have to applied to the neutron star. The magnitude of this torque would have to be consistent with the long term spin evolution of the pulsar. The rate at which the neutron star spin changes due to an outflow can be estimated as (Hartman et al., 2008)
[TABLE]
where gives a scaling parameter capturing the detailed physics and is the neutron star moment of inertia. Roughly, we can assume when the disk edge is inside , and when the disk edge is in the propeller regime (Ekşi et al., 2005). Since Sanna et al. (2018) report a lower limit on the long term spin frequency derivative of Hz s*-1* it follows that even if only of the accretion flow passes through the barrier imposed by the propeller effect, the resulting spin-down torque is still sufficiently small to be consistent with the observed long term spin evolution limits. We note, however, that the spin frequency derivative measurement for IGR J17379 is currently limited by the relatively poor spin frequency measurement during the 2004 outburst (see Sanna et al., 2018). If a future outburst were well sampled with NICER or a similarly capable timing instrument, the sensitivity to the spin frequency change would improve by 3 orders of magnitude. This, in turn, would allow for a physically interesting constraint on the ratio of accreted to ejected material.
Finally, we note that Archibald et al. (2015) hypothesize that the mode switching seen in tMSPs may be a result of the disk transitioning between a propeller and trapped disk state. If so, then the absence of mode-switching in IGR J17379 may simply mean that this source is in a more stable trapped disk state during our observations. Similar to a propeller, a trapped disk must also applies a spin-down torque on the neutron star in order to remain stable (D’Angelo & Spruit, 2010). However, the loss in angular momentum for this mechanism is smaller compared to that predicted by mass ejection (D’Angelo & Spruit, 2012).
4.2.4 Low-activity/Quiescent spectrum
The X-ray spectrum of IGR J17379 during the low-activity state is softer than the spectra observed in the transitional millisecond pulsars at similar luminosities (Coti Zelati et al., 2014; Bogdanov et al., 2015; Papitto et al., 2015) and shows an additional blackbody component at the lowest energies. The origin of this blackbody is not immediately clear, although any thermal emission can generally be attributed to either the stellar surface or the accretion disk. If we interpret this low-temperature component as coming from the disk, then the normalization gives us an implied inner disk radius of km at () inclination. Alternatively, if the emission is originating from the neutron star, its non-pulsed nature suggests it has an isotropic temperature profile. It could possibly be generated from radiative cooling of the neutron star crust if the crust was heated out of equilibrium during the outburst (Brown et al., 1998). While the expected crust temperature depends on the outburst light curve, the temperature and luminosity of this blackbody component matches the emission one might expect from a cooling neutron star crust (Ootes et al., 2016). Some of this uncertainty might be resolved if future outbursts could be followed further into quiescence to see if the source luminosity decreases over time. In order to determine the neutron star luminosity after cooling down from an accretion episode, we must first estimate the long term averaged mass accretion rate for this system.
4.2.5 Long-term averaged accretion rate
Integrating the 2018 outburst count-rate observed with Swift/BAT, we find that NICER observed roughly of the total outburst fluence. The NICER data, in turn, can be approximated as a linear decay, allowing us to measure the observed fluence as erg cm*-2*. Hence, we can roughly estimate the total fluence for this outburst at erg cm*-2*. If we assume this fluence to be typical for all outbursts of IGR J17379 and we consider a recurrence time of years, we can then estimate the long-term averaged mass accretion rate onto the neutron star to be
[TABLE]
This long-term averaged accretion rate is substantially lower than those estimated for other neutron star binaries (Heinke et al., 2010). If this estimate reflects the real accretion rate onto the neutron star, then we may expect the source to show a quiescent luminosity of erg s*-1* through deep-crustal heating (Brown et al., 1998).
Our estimate of the long-term mass accretion rate is subject to a number of systematic uncertainties. For one, the distance to the source may be larger than assumed, which would cause us to underestimate . Additionally, IGR J17379 is a faint source, so it is conceivable that a number of its outbursts have not been recorded (as evidenced by our Swift/BAT analysis, see section 3.2). Since scales linearly with the recurrence time, a shorter-than-assumed recurrence would again imply that we are underestimating the mean accretion rate.
Finally, if the neutron star is less compact than assumed, e.g., if its radius is 15 km rather than the canonical 10 km used in our calculations, then again the mass accretion rate is underestimated.
However, even if we take all these uncertainties in aggregate, we can increase by no more than one order of magnitude. Under such fine-tuning IGR J17379 would still be on par with the low-end of the population, and have an implied quiescent luminosity of erg s*-1*.
5 Conclusions
Our coherent timing and spectral analysis of the AMXP IGR J17379 has demonstrated that this source exhibits unusually large pulse fractions and soft phase lags. We interpreted these properties to mean that the source has an uncommonly favourable viewing geometry, in which the magnetic alignment angle is likely relatively large (), and close to the inclination angle. The large pulse fraction of IGR J17379 further allowed us to detect pulsations even at quiescent luminosities. We argued that this low luminosity state may be similar to the common X-ray emission state of transitional millisecond pulsars. Because of its strange pulse properties and connection to the tMSP population, we suggest IGR J17379 is an interesting source for more detailed study.
This work was supported by NASA through the NICER mission and the Astrophysics Explorers Program, and made use of data and software provided by the High Energy Astrophysics Science Archive Research Center (HEASARC). P.B. was supported by an NPP fellowship at NASA Goddard Space Flight Center. D.A. acknowledges support from the Royal Society.
The reference list from the paper itself. Each links out to its DOI / PubMed record.
- 1Allen et al. (2015) Allen, J. L., Linares, M., Homan, J., & Chakrabarty, D. 2015, Ap J , 801, 10 · doi ↗
- 2Altamirano et al. (2010) Altamirano, D., Patruno, A., Heinke, C. O., et al. 2010, Ap J , 712, L 58 · doi ↗
- 3Archibald et al. (2015) Archibald, A. M., Bogdanov, S., Patruno, A., et al. 2015, Ap J , 807, 62 · doi ↗
- 4Arnaud (1996) Arnaud, K. A. 1996, in Astronomical Society of the Pacific Conference Series, Vol. 101, Astronomical Data Analysis Software and Systems V, ed. G. H. Jacoby & J. Barnes, 17
- 5Arons & Lea (1976) Arons, J., & Lea, S. M. 1976, Ap J , 207, 914 · doi ↗
- 6Bailyn & Orosz (1995) Bailyn, C. D., & Orosz, J. A. 1995, Ap J , 440, L 73 · doi ↗
- 7Belloni et al. (2002) Belloni, T., Psaltis, D., & van der Klis, M. 2002, Ap J , 572, 392 · doi ↗
- 8Beloborodov (2002) Beloborodov, A. M. 2002, Ap J , 566, L 85 · doi ↗