MIND THE GAP: Is The Too Big To Fail Problem Resolved?
Jeremiah P. Ostriker, Ena Choi, Anthony Chow, Kundan Guha

TL;DR
This paper investigates the 'too big to fail' problem in galaxy groups, showing that large luminosity gaps are consistent with gravitational merging effects and are not indicative of a failure in the $ ext{Lambda}$CDM model.
Contribution
It demonstrates that large luminosity gaps are expected in $ ext{Lambda}$CDM simulations due to dynamical friction, resolving the 'too big to fail' issue.
Findings
Large luminosity gaps are consistent with simulations and observations.
Dynamical friction causes merging, explaining the gaps.
No fundamental problem with $ ext{Lambda}$CDM regarding galaxy luminosity gaps.
Abstract
The faintness of satellite systems in galaxy groups has contributed to the widely discussed "missing satellite" and "too big to fail" issues. Using techniques based on Tremaine & Richstone (1977), we show that there is no problem with the luminosity function computed from modern codes per se, but that the gap between first and second brightest systems is too big {\it given} the luminosity function, that the same large gap is found in modern, large scale baryonic CDM simulations such as EAGLE and IllustrisTNG, is even greater in dark matter only simulations, and finally, that this is most likely due to gravitationally induced merging caused by classical dynamical friction. Quantitatively the gap is larger in the computed simulations than in the randomized ones by , , and magnitudes in the EAGLE, IllustrisTNG, and dark…
Click any figure to enlarge with its caption.
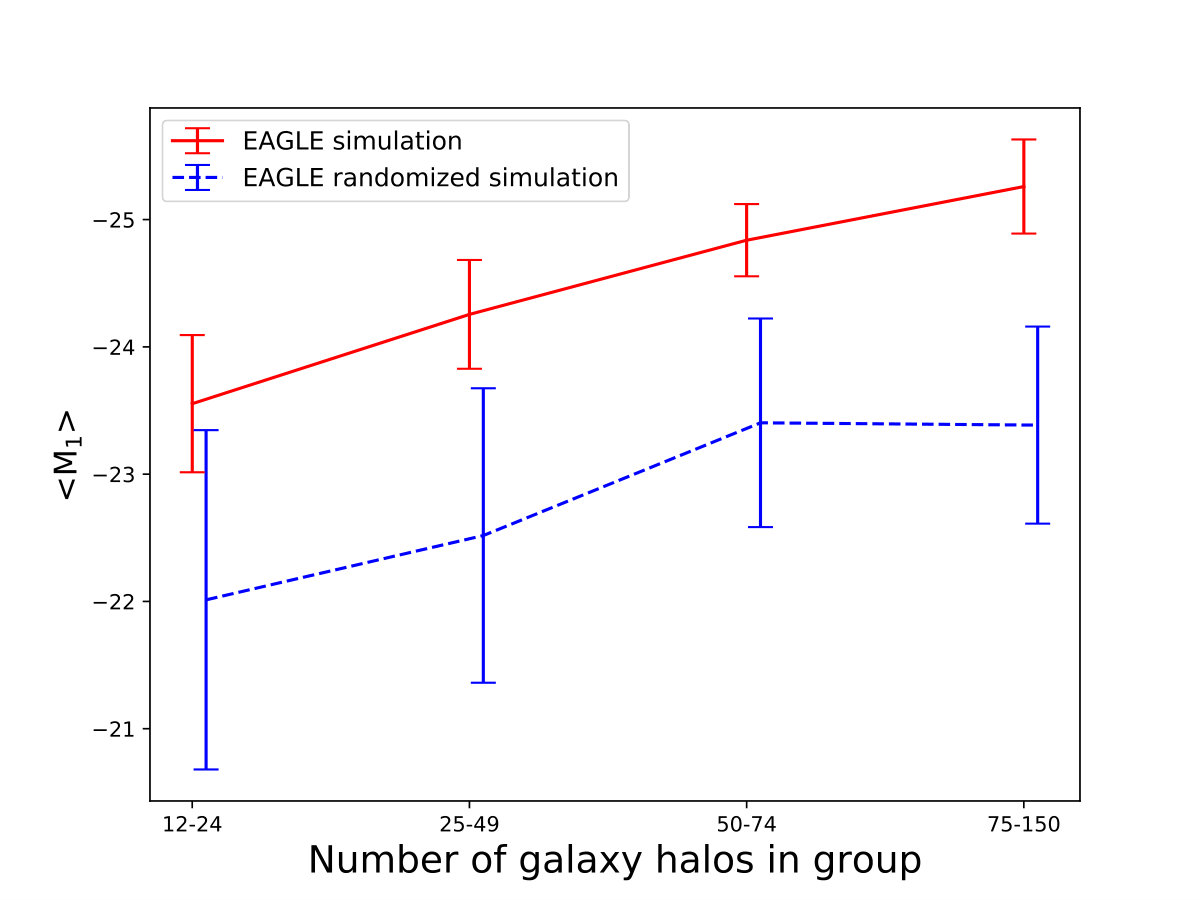 Figure 1
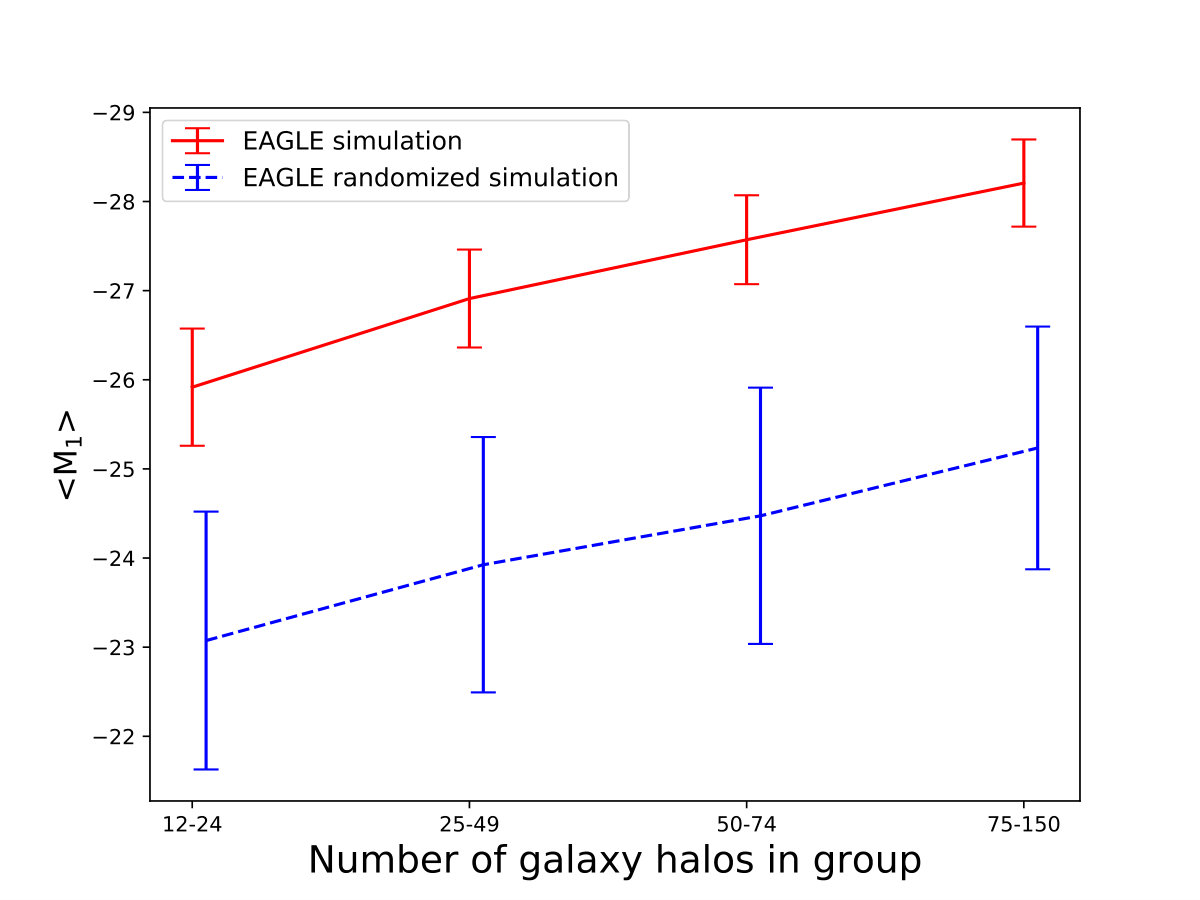 Figure 2
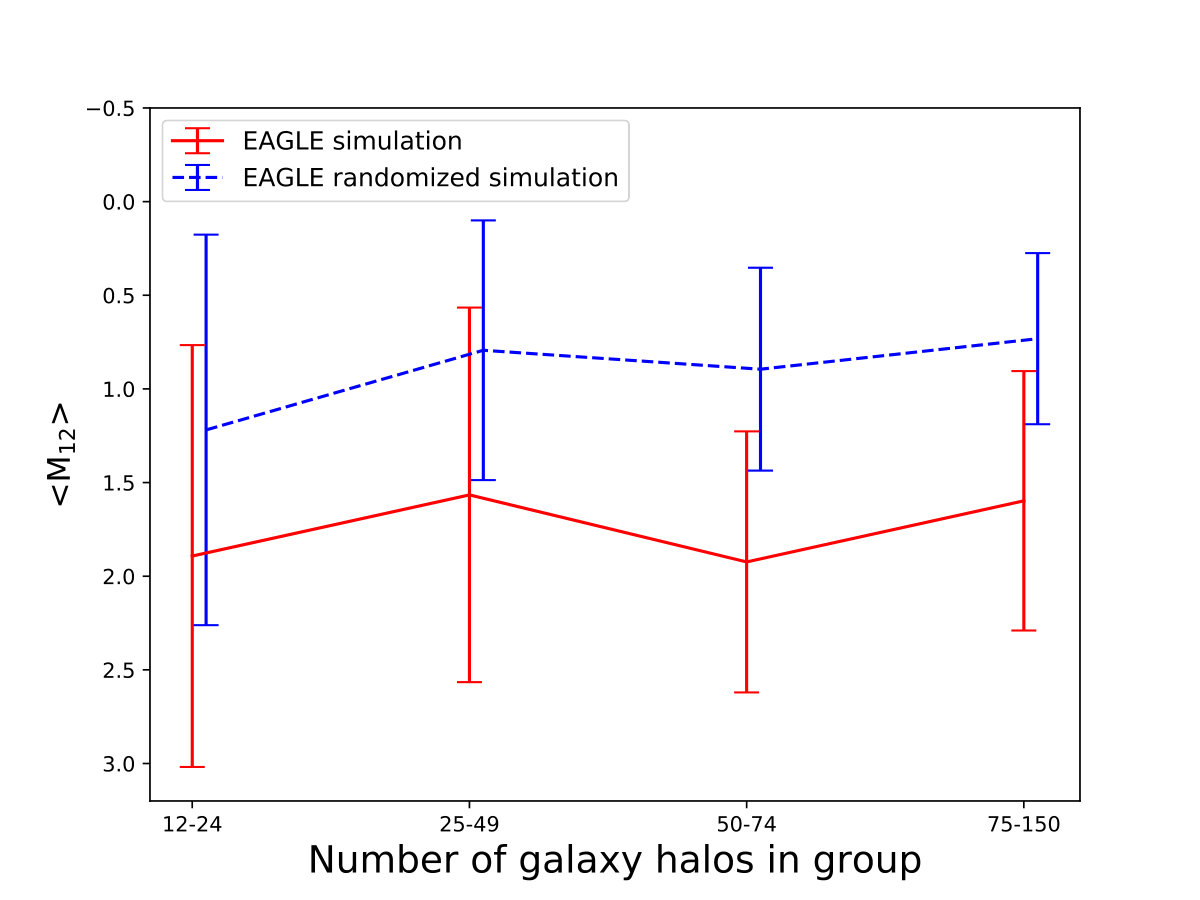 Figure 3
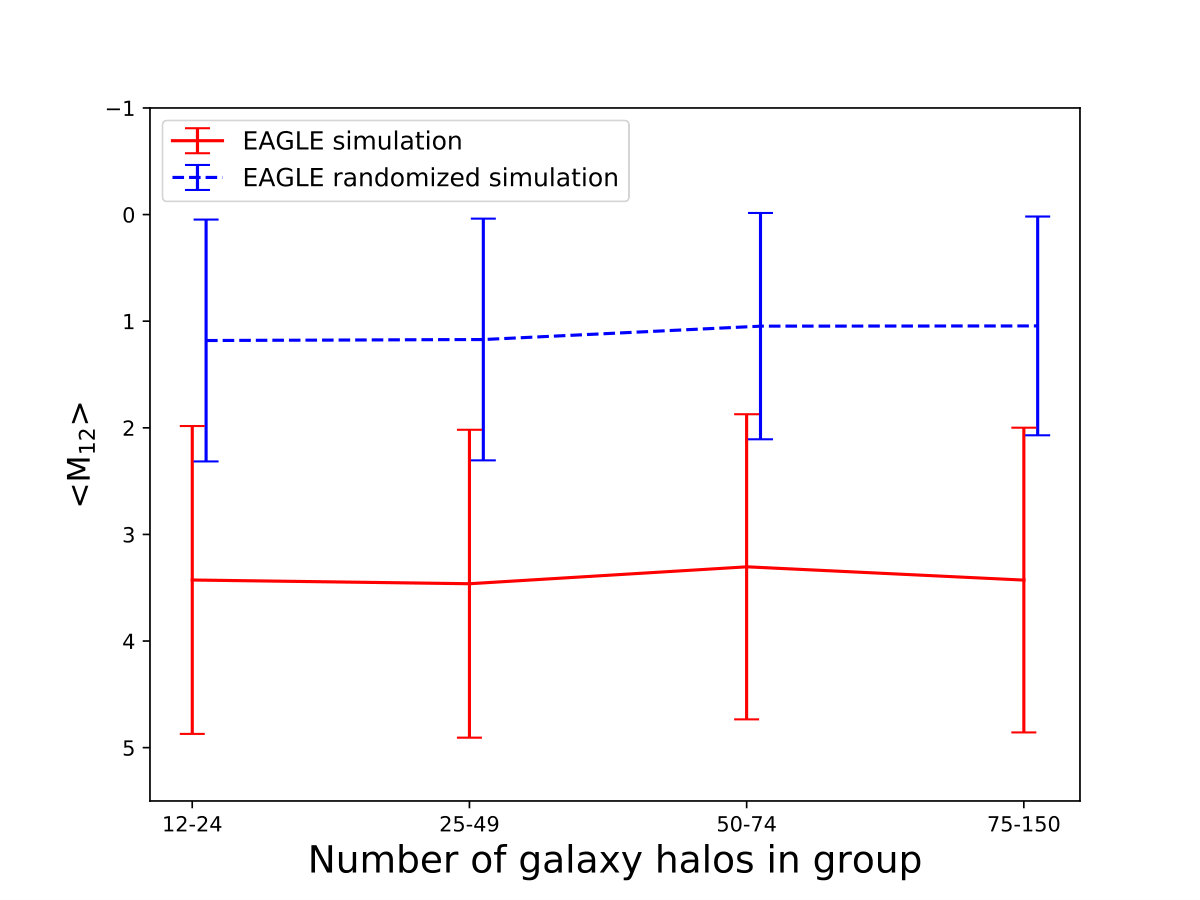 Figure 4
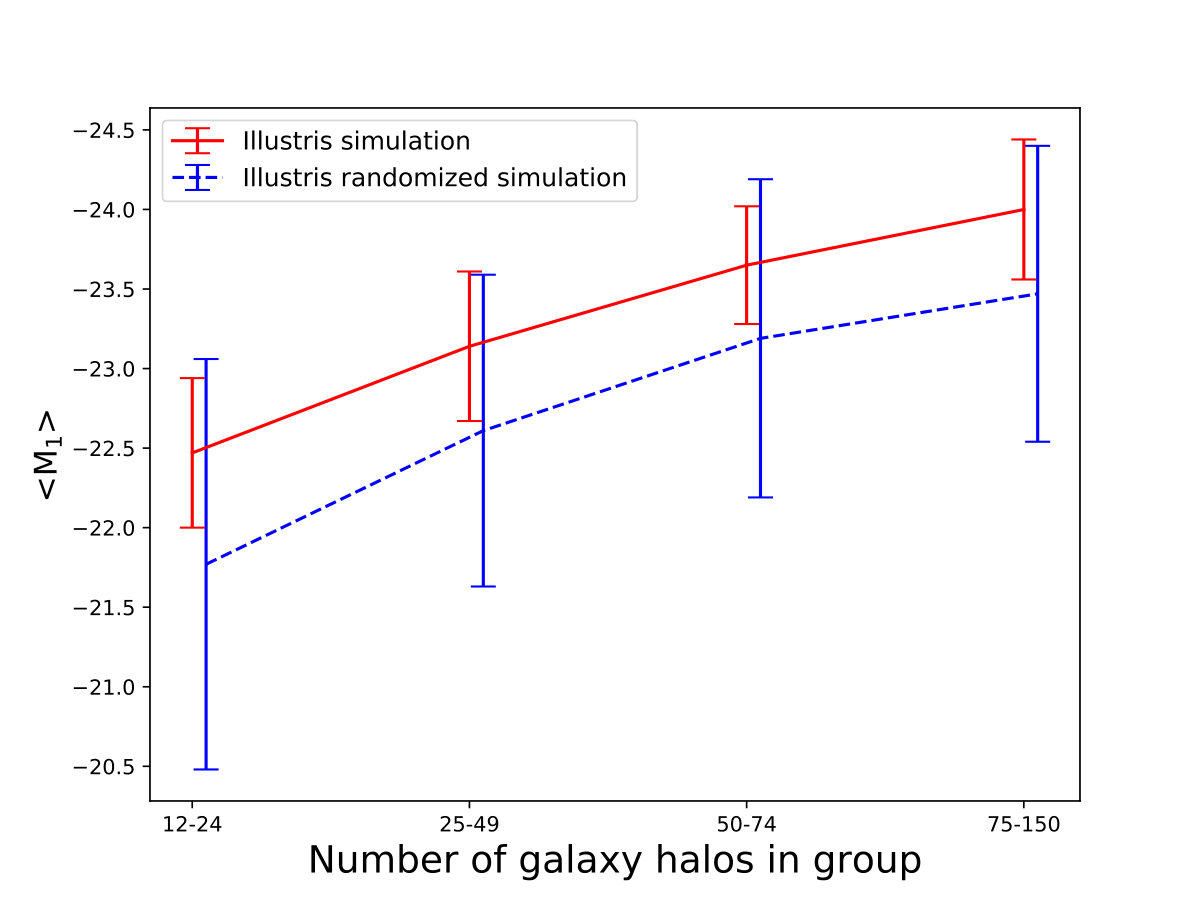 Figure 5
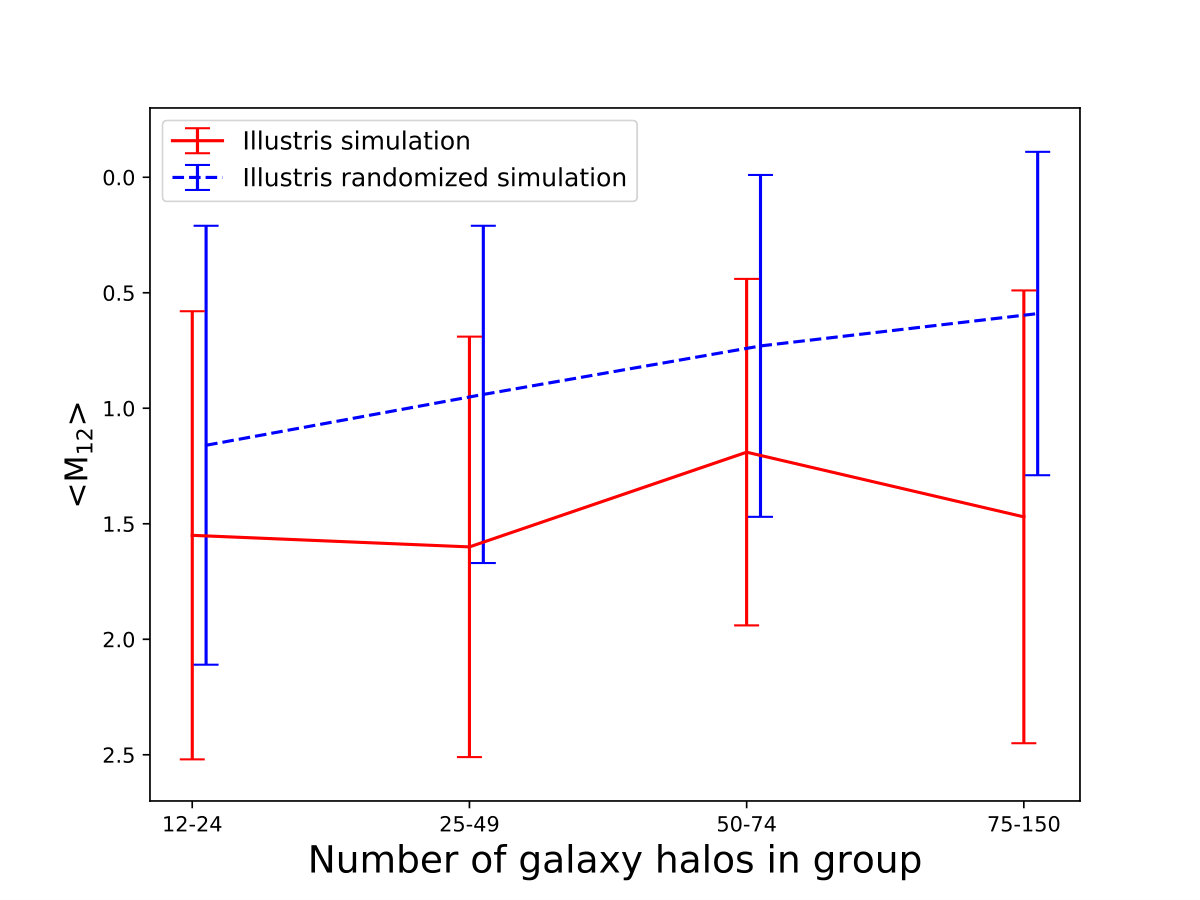 Figure 6
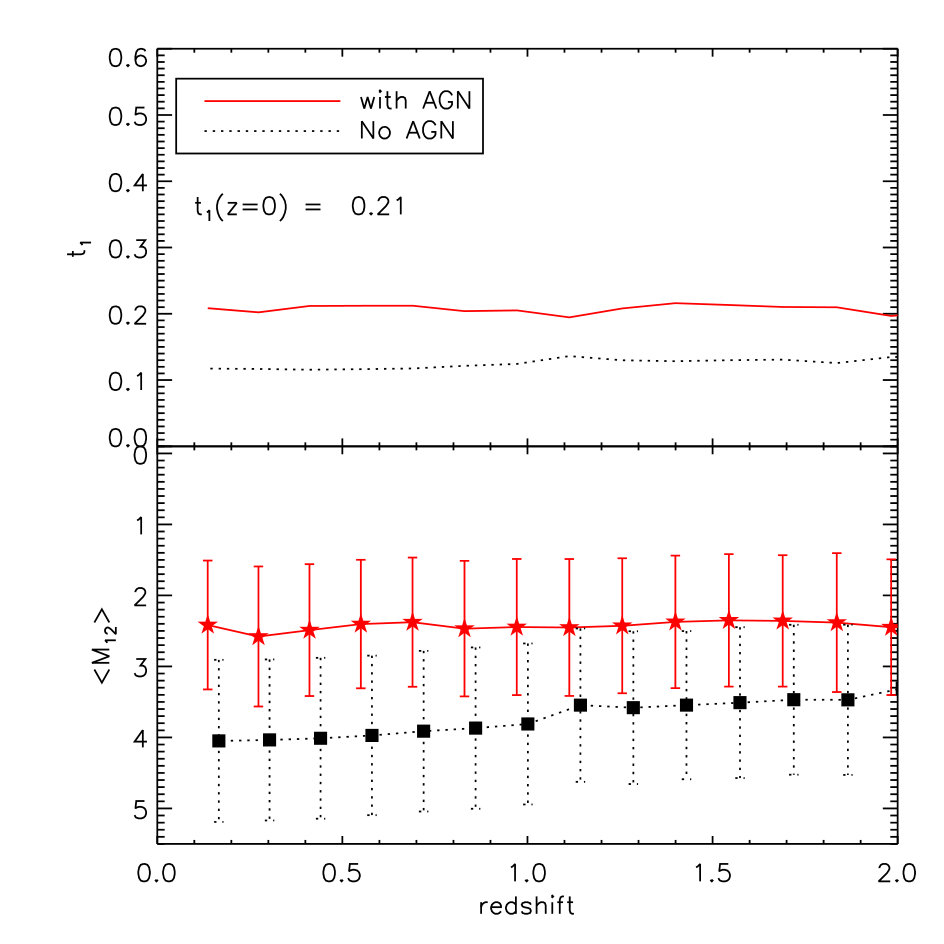 Figure 7
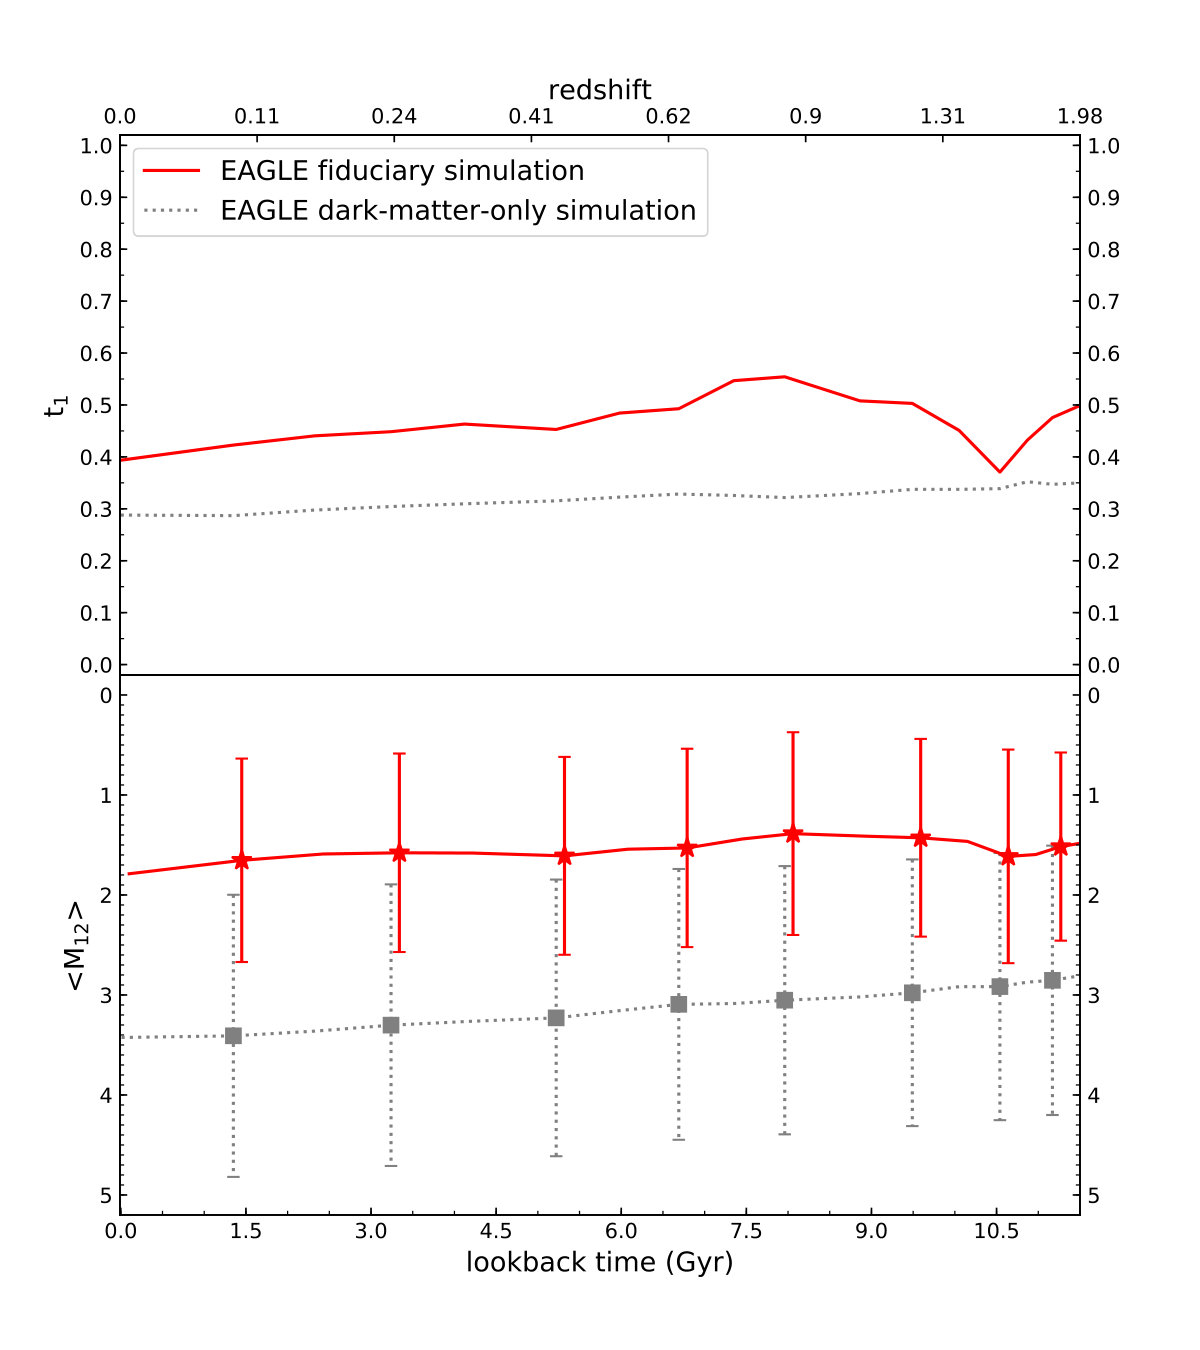 Figure 8
| galaxy number | aafootnotemark: | Number of groups | |||||
|---|---|---|---|---|---|---|---|
| 12-24 | -23.55 | 0.54 | 1.89 | 1.13 | 0.28 | 152 | |
| 25-49 | -24.26 | 0.43 | 1.57 | 1.00 | 0.27 | 73 | |
| 50-74 | -24.84 | 0.28 | 1.92 | 0.70 | 0.15 | 19 | |
| 75-150 | -25.26 | 0.37 | 1.60 | 0.69 | 0.23 | 12 | |
| Mean | -23.93 | 0.48 | 1.79 | 1.04 | 256 |
| galaxy number | Number of groups | ||||||
|---|---|---|---|---|---|---|---|
| 12-24 | -22.01 | 1.33 | 1.22 | 1.04 | 1.09 | 152 | |
| 25-49 | -22.52 | 1.16 | 0.79 | 0.69 | 1.46 | 73 | |
| 50-74 | -22.40 | 0.82 | 0.89 | 0.54 | 0.92 | 19 | |
| 75-150 | -23.39 | 0.77 | 0.73 | 0.46 | 1.06 | 12 | |
| Mean | -22.38 | 1.15 | 1.10 | 0.86 | 256 |
| galaxy number | Number of groups | ||||||
|---|---|---|---|---|---|---|---|
| 12-24 | -22.47 | 0.47 | 1.55 | 0.97 | 0.30 | 187 | |
| 25-49 | -23.14 | 0.47 | 1.60 | 0.91 | 0.30 | 82 | |
| 50-74 | -23.65 | 0.37 | 1.19 | 0.75 | 0.31 | 23 | |
| 75-149 | -24.00 | 0.44 | 1.47 | 0.98 | 0.30 | 26 | |
| 150 | -24.76 | 0.44 | 1.04 | 0.81 | 0.42 | 14 | |
| Mean | -22.93 | 0.46 | 1.51 | 0.93 | 332 |
| galaxy number | Number of groups | ||||||
|---|---|---|---|---|---|---|---|
| 12-24 | -21.77 | 1.29 | 1.16 | 0.95 | 1.12 | 187 | |
| 25-49 | -22.61 | 0.98 | 0.94 | 0.73 | 1.04 | 82 | |
| 50-74 | -23.19 | 1.00 | 0.73 | 0.74 | 1.36 | 23 | |
| 75-149 | -23.47 | 0.93 | 0.59 | 0.70 | 1.58 | 26 | |
| 150 | -23.84 | 0.65 | 0.45 | 0.34 | 1.45 | 14 | |
| Mean | -22.30 | 1.14 | 1.00 | 0.84 | 332 |
| galaxy number | Number of groups | ||||||
|---|---|---|---|---|---|---|---|
| 12-24 | -25.92 | 0.66 | 3.43 | 1.44 | 0.19 | 1111 | |
| 25-49 | -26.91 | 0.55 | 3.46 | 1.44 | 0.16 | 485 | |
| 50-74 | -27.57 | 0.50 | 3.30 | 1.43 | 0.15 | 172 | |
| 75-150 | -28.21 | 0.49 | 3.43 | 1.43 | 0.14 | 181 | |
| Mean | -26.52 | 0.60 | 3.43 | 1.44 | 1949 |
| galaxy number | Number of groups | ||||||
|---|---|---|---|---|---|---|---|
| 12-24 | -23.08 | 1.44 | 1.15 | 1.13 | 1.24 | 1111 | |
| 25-49 | -24.96 | 1.43 | 1.18 | 1.11 | 1.21 | 485 | |
| 50-74 | -24.53 | 1.41 | 1.11 | 1.09 | 1.27 | 172 | |
| 75-150 | -25.27 | 1.35 | 1.12 | 1.04 | 1.20 | 181 | |
| Mean | -23.77 | 1.58 | 1.34 | 1.24 | 1949 |
| galaxy number | Number of groups | ||||||
|---|---|---|---|---|---|---|---|
| 12-24 | -25.69 | 0.67 | 3.36 | 1.36 | 0.20 | 840 | |
| 25-49 | -26.63 | 0.56 | 3.27 | 1.37 | 0.17 | 388 | |
| 50-74 | -27.37 | 0.44 | 3.47 | 1.19 | 0.13 | 145 | |
| 75-149 | -28.03 | 0.42 | 3.49 | 1.34 | 0.12 | 118 | |
| 150 | -29.33 | 0.88 | 2.95 | 1.40 | 0.30 | 106 | |
| Mean | -26.49 | 0.62 | 3.33 | 1.35 | 0.19 0.04 | 1597 |
| galaxy number | Number of groups | ||||||
|---|---|---|---|---|---|---|---|
| 12-24 | -23.45 | 2.10 | 1.71 | 1.66 | 1.23 | 840 | |
| 25-49 | -24.92 | 2.06 | 1.89 | 1.70 | 1.09 | 388 | |
| 50-74 | -25.67 | 1.80 | 1.59 | 1.46 | 1.14 | 145 | |
| 75-149 | -26.58 | 1.61 | 1.49 | 1.20 | 1.08 | 118 | |
| 150 | -28.24 | 1.49 | 1.06 | 1.00 | 1.40 | 106 | |
| Mean | -24.56 | 1.99 | 1.68 | 1.57 | 1.19 0.09 | 1597 |
Peer Reviews
No public reviews on file for this paper yet. If you reviewed it on a platform where reviews are public (OpenReview, ICLR, NeurIPS, ICML), you can paste yours below so the community can read it here.
Videos
No videos yet. Explain this paper in a talk, walkthrough, or lecture? Add one.
MIND THE GAP: Is The Too Big To Fail Problem Resolved?
Jeremiah P. Ostriker11affiliationmark: 22affiliationmark: , Ena Choi11affiliationmark: , Anthony Chow11affiliationmark: , Kundan Guha11affiliationmark:
1Department of Astronomy, Columbia University, New York, NY 10027, USA
2 Department of Astrophysical Sciences, Princeton University, Princeton, NJ 08544, USA
Abstract
The faintness of satellite systems in galaxy groups has contributed to the widely discussed “missing satellite” and “too big to fail” issues. Using techniques based on Tremaine & Richstone (1977), we show that there is no problem with the luminosity function computed from modern codes per se, but that the gap between first and second brightest systems is too big given the luminosity function, that the same large gap is found in modern, large scale baryonic CDM simulations such as EAGLE and IllustrisTNG, is even greater in dark matter only simulations, and finally, that this is most likely due to gravitationally induced merging caused by classical dynamical friction. Quantitatively the gap is larger in the computed simulations than in the randomized ones by , , and magnitudes in the EAGLE, IllustrisTNG, and dark matter only simulations of EAGLE and IllustrisTNG respectively. Furthermore the anomalous gaps in the simulated systems are even larger than in the real data by over half a magnitude and are still larger in the dark matter only simulations. Briefly stated, CDM does not have a problem with an absence of “too big to fail” galaxies. Statistically significant large gaps between first and second brightest galaxies are to be expected.
1. Introduction
There are two frequently discussed “problems” found in galaxy statistics which are sometimes considered arguments against the standard CDM model of cosmology. Both are related to the apparent under-abundance of faint, low mass galaxies in local groups. One, “the missing satellite problem” (Kauffmann et al., 1993; Klypin et al., 1999; Moore et al., 1999) notes that the CDM subhalo stellar mass function is steeper than the observed satellite mass function. The second, “the too big to fail problem (TBTF)” (e.g. Boylan-Kolchin et al., 2011, 2012; Garrison-Kimmel et al., 2014) notes that given the observed stellar mass function, there should be many intermediate mass systems in the local group and other nearby systems that are missing. The original paper, which introduced the TBTF issue, focused primarily on the gap between the third and forth brightest galaxies in the local group but most subsequent work has focussed on how much brighter the first brightest galaxy is than its companions. A recent paper entitled “A Lonely Giant” (Smercina et al., 2018) focusses on the under-abundance of moderate mass satellite galaxies in the nearby M94 system.
Both the nature and the significance of the two “problems” are often confused. The “missing satellite problem” is an expression of our surprise that the mass function for galaxies at the faint end is significantly less steep than the mass function expected for dark matter halos – if the CDM model is correct. It also implies that either CDM produces too many low mass halos/subhalos or galaxies form in these halos with lower and lower efficiency as the halo mass declines. Prevailing expert views at present seem to prefer the second explanation, and current high quality simulations based on the CDM paradigm do, in fact, produce the correct luminosity function (e.g. Schaye et al., 2015; Pillepich et al., 2018b; Davé et al., 2019).
However, using the observed luminosity function (or the one computed with appropriate baryonic physics) it is hard to understand the faintness of satellite systems in well observed groups and clusters in comparison to the first brightest system; that is the “too big to fail problem”: there are relatively bright galaxies that are expected to be present which are among the missing.
What are missing here are moderate mass galaxies roughly one or two magnitudes fainter than the brightest central galaxy. The problem shows up to observers as a large gap between the brightness of first and second brightest galaxies in groups and clusters. These anomalously large gaps were noticed as far back as Sandage & Hardy (1973) and Dressler (1978a).
However, there is a brilliant paper by Tremaine & Richstone (1977) which sheds a blazing light on the issues and makes clear that there must be interactions amongst the group galaxies to be considered and that the gap between first and second brightest galaxies is too big given the luminosity function. The problems are not with the luminosity function per se, or, in current nomenclative, they are not with the general, subhalo mass – stellar mass relation. We will attempt to show in this paper that this unexpectedly large gap is also found in current simulations of galaxy formation such as EAGLE (Schaye et al., 2015), Illustris (Genel et al., 2014), and our own work (Choi et al., 2017), that it is probably not due to feedback and most likely arises from gravitationally induced merging processes in groups and clusters and to some extent from tidal stripping of gas from satellite systems. A possible explanation of the physical basis for the effects was proposed in Ostriker & Hausman (1977): merging among bright galaxies makes the first brightest galaxy brighter (and with less variance) and makes the (new) second brightest galaxy fainter. These gravitational processes increase the ratio defined by the Tremaine & Richstone (1977) parameter,
[TABLE]
which compares the variance in the brightness of the first brightest galaxy , to the mean gap between first and second brightest systems helping to explain “too big to fail” and systems such as the “lonely giant”, M94 group. A very careful recent study of the gap statistics by Trevisan & Mamon (2017) presents a review of recent statistical studies and their implications.
We will show that modern data confirm the observational data presented in Tremaine & Richstone (1977) from Sandage & Hardy (1973), that CDM simulations show the same large gap and that it is likely due to gravitational effects, since it also appears in dark matter only sims and is not altered by changes in feedback physics (c.f. Garrison-Kimmel et al., 2013; Sawala et al., 2016).
But there is one additional effect. The dimensionless quantity , statistically expected (c.f. Tremaine & Richstone, 1977) to be greater than unity, is even smaller in dark matter only simulations than it is in those including baryonic physics. And the explanation for this is partly due to definitions, rather than physics, in hierarchical cosmologies. When subunits (e.g. subhalos) merge, the material stripped off the satellite systems is summed up and included in our definition of the parent halo, thus increasing the gap between the parent and the largest subunit. This effect is less extreme for the stellar than the dark matter component, since tidal stripping is strongest for the latter subunits.
In section 2 we remind readers of the conclusions of the two 1977 papers quoted earlier concerning apparently anomalous gaps found in galaxy group statistics, and present an update of the observational results. In section 3 we analyze current simulations both with and without baryonic physics and in Section 4 we present our conclusions.
2. Abbreviated History of the Observed Gaps
The overall luminosity function of galaxies fits well to the Schechter (1976) function which, at the bright end, is roughly exponential. Picking randomly from that distribution one could populate synthetic galaxy groups and clusters and check if the resulting distributions matched observations. The resulting comparison would show dramatic failure even though – by construction – the total luminosity function would match the total observed luminosity function. Observed first brightest galaxies would be too massive compared to expectations, with the deviation from expectations greatest in the smallest groups and the variance amongst groups would be less than expected. Stated differently the zeroth order expectation would be that the brightest system had a mass proportional to the logarithm of the total mass of the group or cluster, but the variance in first brightest galaxy luminosities is significantly less than predicted. A dynamical explanation was proposed in Ostriker & Hausman (1977) in a very simplified treatment that has been confirmed by detailed work done subsequently (e.g. Laporte et al., 2013; Liu et al., 2015; Zhao et al., 2015; Golden-Marx & Miller, 2018). The first brightest system will grow via mergers and the effect is greatest in the smallest systems, since at fixed density the merger time scales inversely with the total cluster mass. This tends to balance the statistical expectation of more massive first brightest galaxies in more massive systems and produces a smaller variance in the magnitude of first brightest galaxies than was expected.
But the same merger process is most likely to consume the second brightest galaxy increasing the gap between the now brighter first brightest and the now fainter second brightest system. On average the gap would thus grow as mergers proceeded and that growth was demonstrated in Ostriker & Hausman (1977) quantitatively.
Sandage & Hardy (1973) commented that “The brighter the dominant galaxy becomes, the absolutely fainter will be the second and third ranked members. The rich are rich at the expense of the poor, progressively.”
Tremaine & Richstone (1977) invented the ingenious statistic, (Equation 1), which quantified both changes described above and then showed mathematically that for galaxies picked randomly from general distribution functions the quantity would be expected to be greater than unity. However, when they compared expectations with reality, using the data compiled by Sandage & Hardy (1973), they found the opposite to be true. In general and discrepancy was greatest in the smallest groups.
As early as Dressler (1978b), it was pointed out that “the statistical model, regardless of the form of the luminosity function cannot fulfill all requirements, hence a special process model seems required.” He based his conclusion on the magnitudes of the , gap, the small value of and the weak correlation between and cluster richness.
Tremaine & Richstone (1977), basing their analysis on the Sandage & Hardy (1973) cluster data, looking at groups with over 30 members found a variance in the V magnitude of first brightest systems which was only and a value for for these same systems far below the expectation (given the luminosity function) of . For Gamma function, Schechter function and even double exponential functions the expected value is . Loh & Strauss (2006) examined 2099 of Sloan Digital Sky Survey (SDSS) data again looking for bright galaxies and searching in the redshift range using the band best for detecting luminous red galaxies. Again they found large gaps between first and second brightest systems with a characteristic value of mag, very similar to the value obtained by Tremaine & Richstone (1977), from the Sandage & Hardy (1973) data.
Loh & Strauss (2006) data give a value for for the richer clusters and for the poorer systems consistent with Tremaine & Richstone (1977) and grossly inconsistent with the statistical expectation of . They again formed a gap of magnitude. Clearly the observed gaps are far bigger than what we would have expected from the luminosity function, i.e., intermediate mass galaxies are missing, and the first brightest systems are more standardized than expected.
There is a very relevant later paper by Shen et al. (2014) entitled “The Statistical Nature of the Brightest Group Galaxies” which examines the problem from a different angle. They also compute the Tremaine-Richstone statistic and again find significantly less than unity for the large sample of groups that they study with typical observed values being . They attribute this to their finding that the first brightest galaxies are ‘too bright’ and, when they correct down the brightness of these systems, they conclude that the gaps are close to expectations. But there is however a bit of circular reasoning involved in this explanation. They use the total luminosity of the systems to estimate the halo masses and then ask what is the expected luminosity of the first brightest system given that halo mass. But of course if the satellite systems are too faint, then the halo mass is underestimated and then the ‘expected’ luminosity of the first brightest system is found to be low and the observed BCG is consequently ‘too bright’. The Tremaine-Richstone criterion itself is not subject to this criticism. So, in sum, the Shen et al. (2014) paper agrees that the observed gaps are larger than statistically expected but can not make a clean argument as to how much of this is due to the BCG being brighter than expected or to the satellites being fainter than expected.
In a related paper Lin et al. (2010) studying more massive groups had found the value , but do not draw a firm conclusion as to the origin of the statistical anomaly.
Notice that we have not discussed galaxy formation, feedback or any of the factors that determine the halo mass – galaxy mass relation. All of the discussion concerns the expectations of the properties of the two most massive systems in a group, given the luminosity (or mass) function. Thus, the too big gap – which can contribute to the “too big to fail” problems must be understood quite separately from the processes such as efficiency of star formation, feedback etc, that determine the overall luminosity function.
3. Cosmological simulations
These anomalies in the real world were observed long before there were detailed, physically based numerical simulations of galaxy formation with which to compare the strange results. The papers which have pointed out the “too big to fail” problem have not – so far as we are aware – compared expectations with cosmological simulations. Rather, they have asked, given the brightest galaxy in a group and its expected dark matter halo, what are the expected lower mass halos in the group and what galaxies are expected to live within them. For this they use the Schechter (1976) function giving the average mass distribution of dark matter halos on an equivalent statistical model. And the authors universally find that many intermediate mass galaxies are expected in the groups which are not there at a statistically significant level: the missing systems are “too big to fail”.
Let us see what the simulations tell us. We have looked at three sets: EAGLE simulation (Schaye et al., 2015), IllustrisTNG simulation (Pillepich et al., 2018b; Springel et al., 2018), and our own (Choi et al., 2017). The first two sets of simulations have had enough statistical power to determine if they can match the observed luminosity function for bright galaxies and numerous papers (e.g. Vogelsberger et al., 2014; Crain et al., 2015) detail their success. So, whether the CDM paradigm is right or wrong, the physical processes that they implement give them a luminosity function, above and below the break, which matches real data.
We have looked at the publicly available output from these groups to see if their results do or do not match observations on statistical expectations with regard to the Tremaine & Richstone (1977) statistics. We use -band magnitudes throughout this study.
3.1. EAGLE simulation
The EAGLE simulation is a publicly available (McAlpine et al., 2016) suite of cosmological hydrodynamical simulation (Schaye et al., 2015; Crain et al., 2015) It assumes a standard cold dark matter cosmology from the Planck-1 (Planck Collaboration et al., 2014), , , , , and . The simulation suite is run with a modified version of the GADGET-3 -body Tree-PM smoothed particle hydrodynamics (SPH) code (Springel, 2005), and includes an updated formulation of SPH, new time stepping, and sub-grid physics (see Schaye et al., 2015, for details). In this study, we use RefL0100, which has a cosmological volume of and a baryonic mass resolution of 1.81\times 10^{6}\hbox{\thinspace\rm M_{\odot}}. We refer the readers to the introductory papers (Schaye et al., 2015; Crain et al., 2015) for a complete descriptions of sub-grid physics models.
We bin EAGLE simulation results into different size galaxy groups from smallest (12–24 objects) with stellar mass greater than 10^{8}\hbox{\thinspace\rm M_{\odot}} to more massive systems with 75–150 galaxies (See Table 1). The red lines in Figures 1 and 2 show the average magnitude gap between first-brightest and second-brightest galaxies, , in each group and brightness of the first brightest galaxy . Overall, simulated galaxies in EAGLE show magnitude gap between first and second brightest galaxies, which is similar to the gap reported by van den Bosch et al. (2007) with 2-degree Field Galaxy Redshift Survey data.
Next, we put all groups in one bin and randomly repopulate each group from the collective bin, keeping the same number of galaxies, in each galaxy group or cluster (See Table 2). By construction, this keeps the overall luminosity function invariant. Then we recompute , and for each of Figure 1 and 2.
Note how the gap is systematically larger in the original () than in the randomized groups () and the first brightest galaxy is brighter by over a magnitudes in each original set of galaxy groups than in the randomized versions of the same objects. Somehow in each system the dominant member “knows” it is first and becomes more dominant.
In Tables 1 and 2, we summarize these results and compute the Tremaine-Richstone parameter , statistic via Equation 1. We note that the simulated data in Table 1 shows very low values of , typically around 1/4, even lower than the real data analyzed by Tremaine & Richstone (1977) and Loh & Strauss (2006). So this “anomalous” behavior is reproduced by the simulations which have larger than expected gaps and consequently could be accused of not having the expected second brightest galaxies.
Then Table 2 shows the statistic for the randomized data and – lo and behold – it exactly follows the statistical expectations with .
3.2. IllustrisTNG simulation
The IllustrisTNG simulation (Pillepich et al., 2018b; Nelson et al., 2018; Springel et al., 2018) is a publicly available suite of cosmological simulation (Nelson et al., 2015), an extension of the Illustris simulation (Genel et al., 2014; Vogelsberger et al., 2014; Sijacki et al., 2015). It adopts the Planck Collaboration XIII cosmological parameters (Planck Collaboration et al., 2016), with , , , , and . The simulation is evolved with the AREPO moving-mesh code (Springel, 2010), and employs a number of improvements of sub-grid physics models for stellar and AGN feedback, and black hole growth (Pillepich et al., 2018a; Weinberger et al., 2018). The adopted fiducial simulation we use in this paper (TNG-100) has a cosmological volume of and a baryonic mass resolution of 1.4\times 10^{6}\hbox{\thinspace\rm M_{\odot}}. We refer the readers to the introductory papers of original Illustris (e.g. Genel et al., 2014) and IllustrisTNG (e.g. Pillepich et al., 2018b) for further details.
Now we repeat the same exercise done previously with the EAGLE simulations using now the IllustrisTNG simulations, for the galaxies with stellar mass greater than 10^{8}\hbox{\thinspace\rm M_{\odot}}. The results are shown in Figure 3 and 4 and summarized in Table 3 and 4. Again the published simulations show “too big” a gap and “too bright” first brightest galaxies and – correspondingly – the statistic is smaller () than statistically expected. In the randomized data is again much higher () and larger than unity. The gap is again larger by in the initial fiducial data than in the randomized data.
What is the cause of these fascinating results? We mentioned in the Introduction several possible physical effects that could do it: tidal stripping of satellites, feedback from the central galaxies removing cold gas from the environments of satellite systems, ram pressure stripping and finally merging. One could imagine complicated simulation tests where each of these effects was switched on or off to determine its consequences for the statistical tests, but there is a far simpler approach that can be taken. All these – and many other “baryonic” effects are missing in the preliminary dark matter only simulations that the EAGLE and Illustris group have performed. We will discuss this in Section 3.4.
3.3. Zoom-in simulation of galaxy-group size halos
This time we study the evolution of the magnitude gap and parameter in 30 massive halos with present-day halo masses of 1.4\times 10^{12}\hbox{\thinspace\rm M_{\odot}}\leq M_{\mathrm{vir}}\leq 2.3\times 10^{13}\hbox{\thinspace\rm M_{\odot}} in cosmological zoom-in hydrodynamic simulations. We used two sets of 30 high-resolution zoom-in simulations from Choi et al. (2017) simulated with and without AGN feedback. The most massive and brightest central galaxies in these zoom-in simulations have stellar masses of 8.2\times 10^{10}\hbox{\thinspace\rm M_{\odot}}\leq M_{\ast}\leq 1.5\times 10^{12}\hbox{\thinspace\rm M_{\odot}} at .
The physics implemented in the simulations includes star formation, mechanical supernova feedback, wind feedback from massive stars, AGB stars and metal cooling and diffusion. The AGN feedback model is adopted from (Choi et al., 2012, 2014) and consists of two main components: (1) mechanical feedback via high velocity broad absorption line winds, which deposits energy, mass and momentum into the adjacent gas, and (2) radiative feedback from X-ray radiation of the accreting black holes via the photoionization and the Compton heating following Sazonov et al. (2004). The simulation set used in this section is presented in Choi et al. (2017), and we refer the reader to this paper for further details.
In Figure 5, we show the evolution of parameter and the -band magnitude gap between first- and second- brightest galaxies from to for two sets of zoom-in simulations, run with and without the AGN feedback. We have almost constant parameter from to , in both simulations with and without AGN feedback, and a mild increase of with time from to in simulations without AGN feedback, implying some brightening of the first ranked galaxy compared with the second ranked galaxy over time.
Also, as expected AGN activity does tend to strip satellite systems (Dashyan et al., 2019; Shen et al., 2019) increasing the gap and further decreasing , but these real effects are not the dominant ones. Instead, an excess and prolonged star formation in first-ranked galaxies shows a dominant effect, showing an increase in with time. However, we see that for all three fiducial sets of simulations presented in 3.1, 3.2, and 3.3, the statistic is similar, , and it is even below the value found in the observational data.
3.4. Dark matter only simulation
We show in Figures 6 and 7 and in Tables 5 and 6 the results from the EAGLE dark matter only simulations. The results show that the typical gap in mass (expressed in magnitudes) even larger than in the far more complicated full baryonic simulations and the values of even smaller (). As noted earlier a piece of this effect is due to definitions, not physics: matter tidally torn off subhalos is, by definition, added to the parent halos, increasing the gaps. But it is unlikely that this accounts for the whole effect. Therefore whatever physical processes produce the large gaps seem to be even stronger in purely gravitational simulations. We also show the randomized dark matter simulations as red lines in Figure 6 and 7, giving the value of in Table 6. These completely match the Tremaine & Richstone (1977) statistical expectations. The gap is larger in the original data than in the randomized data in these dark matter simulations by magnitudes, even larger than in the galaxy simulations.
The results from IllustrisTNG dark matter only simulations are summarized in Tables 7 and 8. Again, we have a large gap between first and second massive systems, and the gap is much larger in the original data than in the randomized data.
These results provide dramatic evidence that whatever causes the large gap (“too big to fail”) in observed phenomenon is gravitational/dynamical in origin, since it is stronger in the dark matter only simulations than in either the real or simulated works. Merging is a plausible explanation but more work would need to be done to prove this.
4. Conclusion
We summarize the real data and the CDM simulations in Table LABEL:tab:summary. We see that the gaps are actually larger in the CDM simulations than in observed data and the anomalous statistic is as low in the simulated data as in the real data. The dark matter only simulations are even more extreme.
First it is clear that modern simulations by active groups do not have a “too big to fail” problem. The gaps in their simulated groups are large and the statistics derived from their simulations can be even lower than those seen in real observational data. This is good news. Standard CDM simulations do not have a too big to fail problem.
Second, when their data in randomized – keeping the luminosity function constant – the gaps disappear and the data satisfies the statistical expectations with . Therefore, solving the problem was not based on particular feedback schemes which alter the luminosity function, but rather it must be due to physical interactions in the groups and clusters. We noted several physical interactions which would tend to produce the observed gaps and the additional experiments that we did help to pick the winner.
In addition satellites moving through the gas in groups and clusters can be seen to be losing material by ram pressure stripping and this effect, which we cannot easily quantify, must also lead to an increase in the gap and a lowering of .
But one experiment that we performed in Section 3.4 showed us the dominant physical mechanisms. We looked at dark matter only simulations from EAGLE and IllustrisTNG and found the gap (expressed in magnitudes) to be and much larger than in randomized dark matter systems and the statistic was and , even lower than in the baryonic simulations or the real data.
Since the sole physics acting in the dark matter experiments was based on gravity and dynamics, it is clear that none of the complicated “baryonic” effects – including the first two mentioned in this section – can be dominant in causing the large gaps and low value of .
Dynamical friction and the induced “cannibalism” can certainly produce the effects seen in the dark matter simulations so it is tempting to consider “mergers” to be the driving force in groups and clusters leading to the big gaps and small values of seen in both the baryonic and dark matter only simulations. A primitive numerical test of this was performed by Ostriker & Hausman (1977) with promising results, but there is a strong argument on the other side.
The total halo mass in solar type stars in our Milky Way (MW) is estimated by GAIA (and others) observations not to exceed 1-2 percent of the mass in the MW disk (Gaia Collaboration et al., 2018). Since a large fraction of the stars in any merging system would ultimately be found in the halo of a disk galaxy, that tells us that whatever systems merged with our galaxy must not have weighed, more than a few percent of MW system. Here of course we are only considering the stellar component. This is true for other edge-on similar observed galaxies such as NGC 4565 and for simulations as well. Using Illustris simulations Rodriguez-Gomez et al. (2016) estimate the fraction of ex-situ stars and they find roughly 10 percent for MW size systems in other published work with perhaps half that much in their own simulations.
Thus both observations and simulations indicate that major mergers of stellar systems of MW scale are rare. Hence explaining the group properties of these systems in terms of merging stellar systems seems misguided. This argument applies to systems with total halo mass less than 10^{12.5}\hbox{\thinspace\rm M_{\odot}}. There are multiple lines of evidence, however in systems with total mass larger than 10^{13}\hbox{\thinspace\rm M_{\odot}} that mergers can be significant. The possibility remains, however, that mergers before significant star formation has occurred could be important and could explain the well established gaps in the luminosity functions seen in normal groups and clusters – both in the real and simulated worlds. Further work must be done to test this possibility.
But what is clear from the analysis presented in this paper is that “too big to fail” is not a problem in the CDM scenario (nor, in all probability in the variant competitors) because normal gravitational interactions within groups increase the mass of the most massive galaxy, decrease the mass of the second ranked system and tend to produce large gaps.
We thank the anonymous referee for very helpful comments on the manuscript. We thank Gohar Dashyan, Daniel DeFelippis and Scott Tremaine for helpful discussions. Numerical simulations were run on the computer clusters of the Princeton Institute of Computational Science and engineering.
The reference list from the paper itself. Each links out to its DOI / PubMed record.
- 1Abazajian et al. (2003) Abazajian, K., Adelman-Mc Carthy, J. K., Agüeros, M. A., et al. 2003, AJ, 126, 2081
- 2Boylan-Kolchin et al. (2011) Boylan-Kolchin, M., Bullock, J. S., & Kaplinghat, M. 2011, MNRAS, 415, L 40
- 3Boylan-Kolchin et al. (2012) —. 2012, MNRAS, 422, 1203
- 4Choi et al. (2014) Choi, E., Naab, T., Ostriker, J. P., Johansson, P. H., & Moster, B. P. 2014, MNRAS, 442, 440
- 5Choi et al. (2012) Choi, E., Ostriker, J. P., Naab, T., & Johansson, P. H. 2012, Ap J, 754, 125
- 6Choi et al. (2017) Choi, E., Ostriker, J. P., Naab, T., et al. 2017, Ap J, 844, 31
- 7Crain et al. (2015) Crain, R. A., Schaye, J., Bower, R. G., et al. 2015, MNRAS, 450, 1937
- 8Dashyan et al. (2019) Dashyan, G., Choi, E., Somerville, R. S., et al. 2019, MNRAS, submitted