Background Model of the CUPID-0 Experiment
O. Azzolini, J. W. Beeman, F. Bellini, M. Beretta, M. Biassoni, C., Brofferio, C. Bucci, S. Capelli, L. Cardani, P. Carniti, N. Casali, D., Chiesa, M. Clemenza, O. Cremonesi, A. Cruciani, I. Dafinei, S. Di Domizio, F., Ferroni, L. Gironi, A. Giuliani, P. Gorla, C. Gotti
TL;DR
This paper develops a detailed background model for the CUPID-0 experiment, achieving the lowest background levels in the search for neutrinoless double beta decay, which is vital for future low-background experiments.
Contribution
It introduces a comprehensive background reconstruction model for CUPID-0, identifying and quantifying background sources across the entire energy spectrum.
Findings
Achieved background levels as low as ~10^{-4} counts/(keV kg yr) in the ROI.
Successfully identified and characterized background sources.
Demonstrated the model's importance for future scintillating calorimeter experiments.
Abstract
CUPID-0 is the first large mass array of enriched ZnSe scintillating low temperature calorimeters, operated at LNGS since 2017. During its first scientific runs, CUPID-0 collected an exposure of 9.95 kg yr. Thanks to the excellent rejection of particles, we attained the lowest background ever measured with thermal detectors in the energy region where we search for the signature of Se neutrinoless double beta decay. In this work we develop a model to reconstruct the CUPID-0 background over the whole energy range of experimental data. We identify the background sources exploiting their distinctive signatures and we assess their extremely low contribution (down to counts/(keV kg yr)) in the region of interest for Se neutrinoless double beta decay search. This result represents a crucial step towards the comprehension of the background in…
Click any figure to enlarge with its caption.
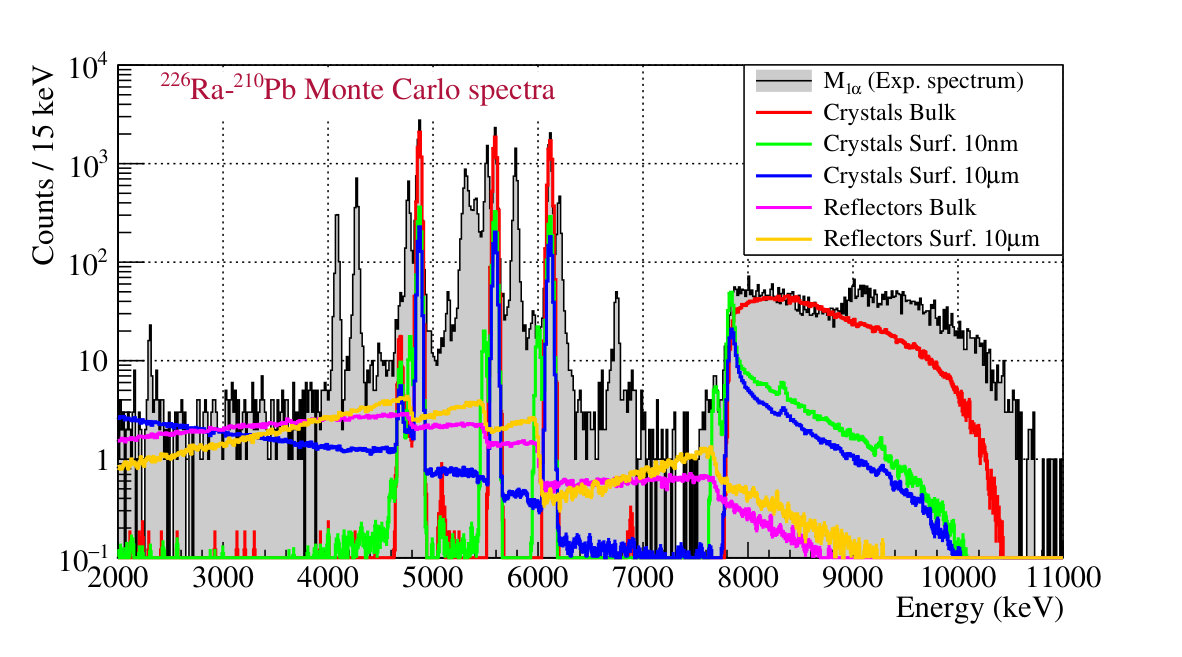 Figure 1
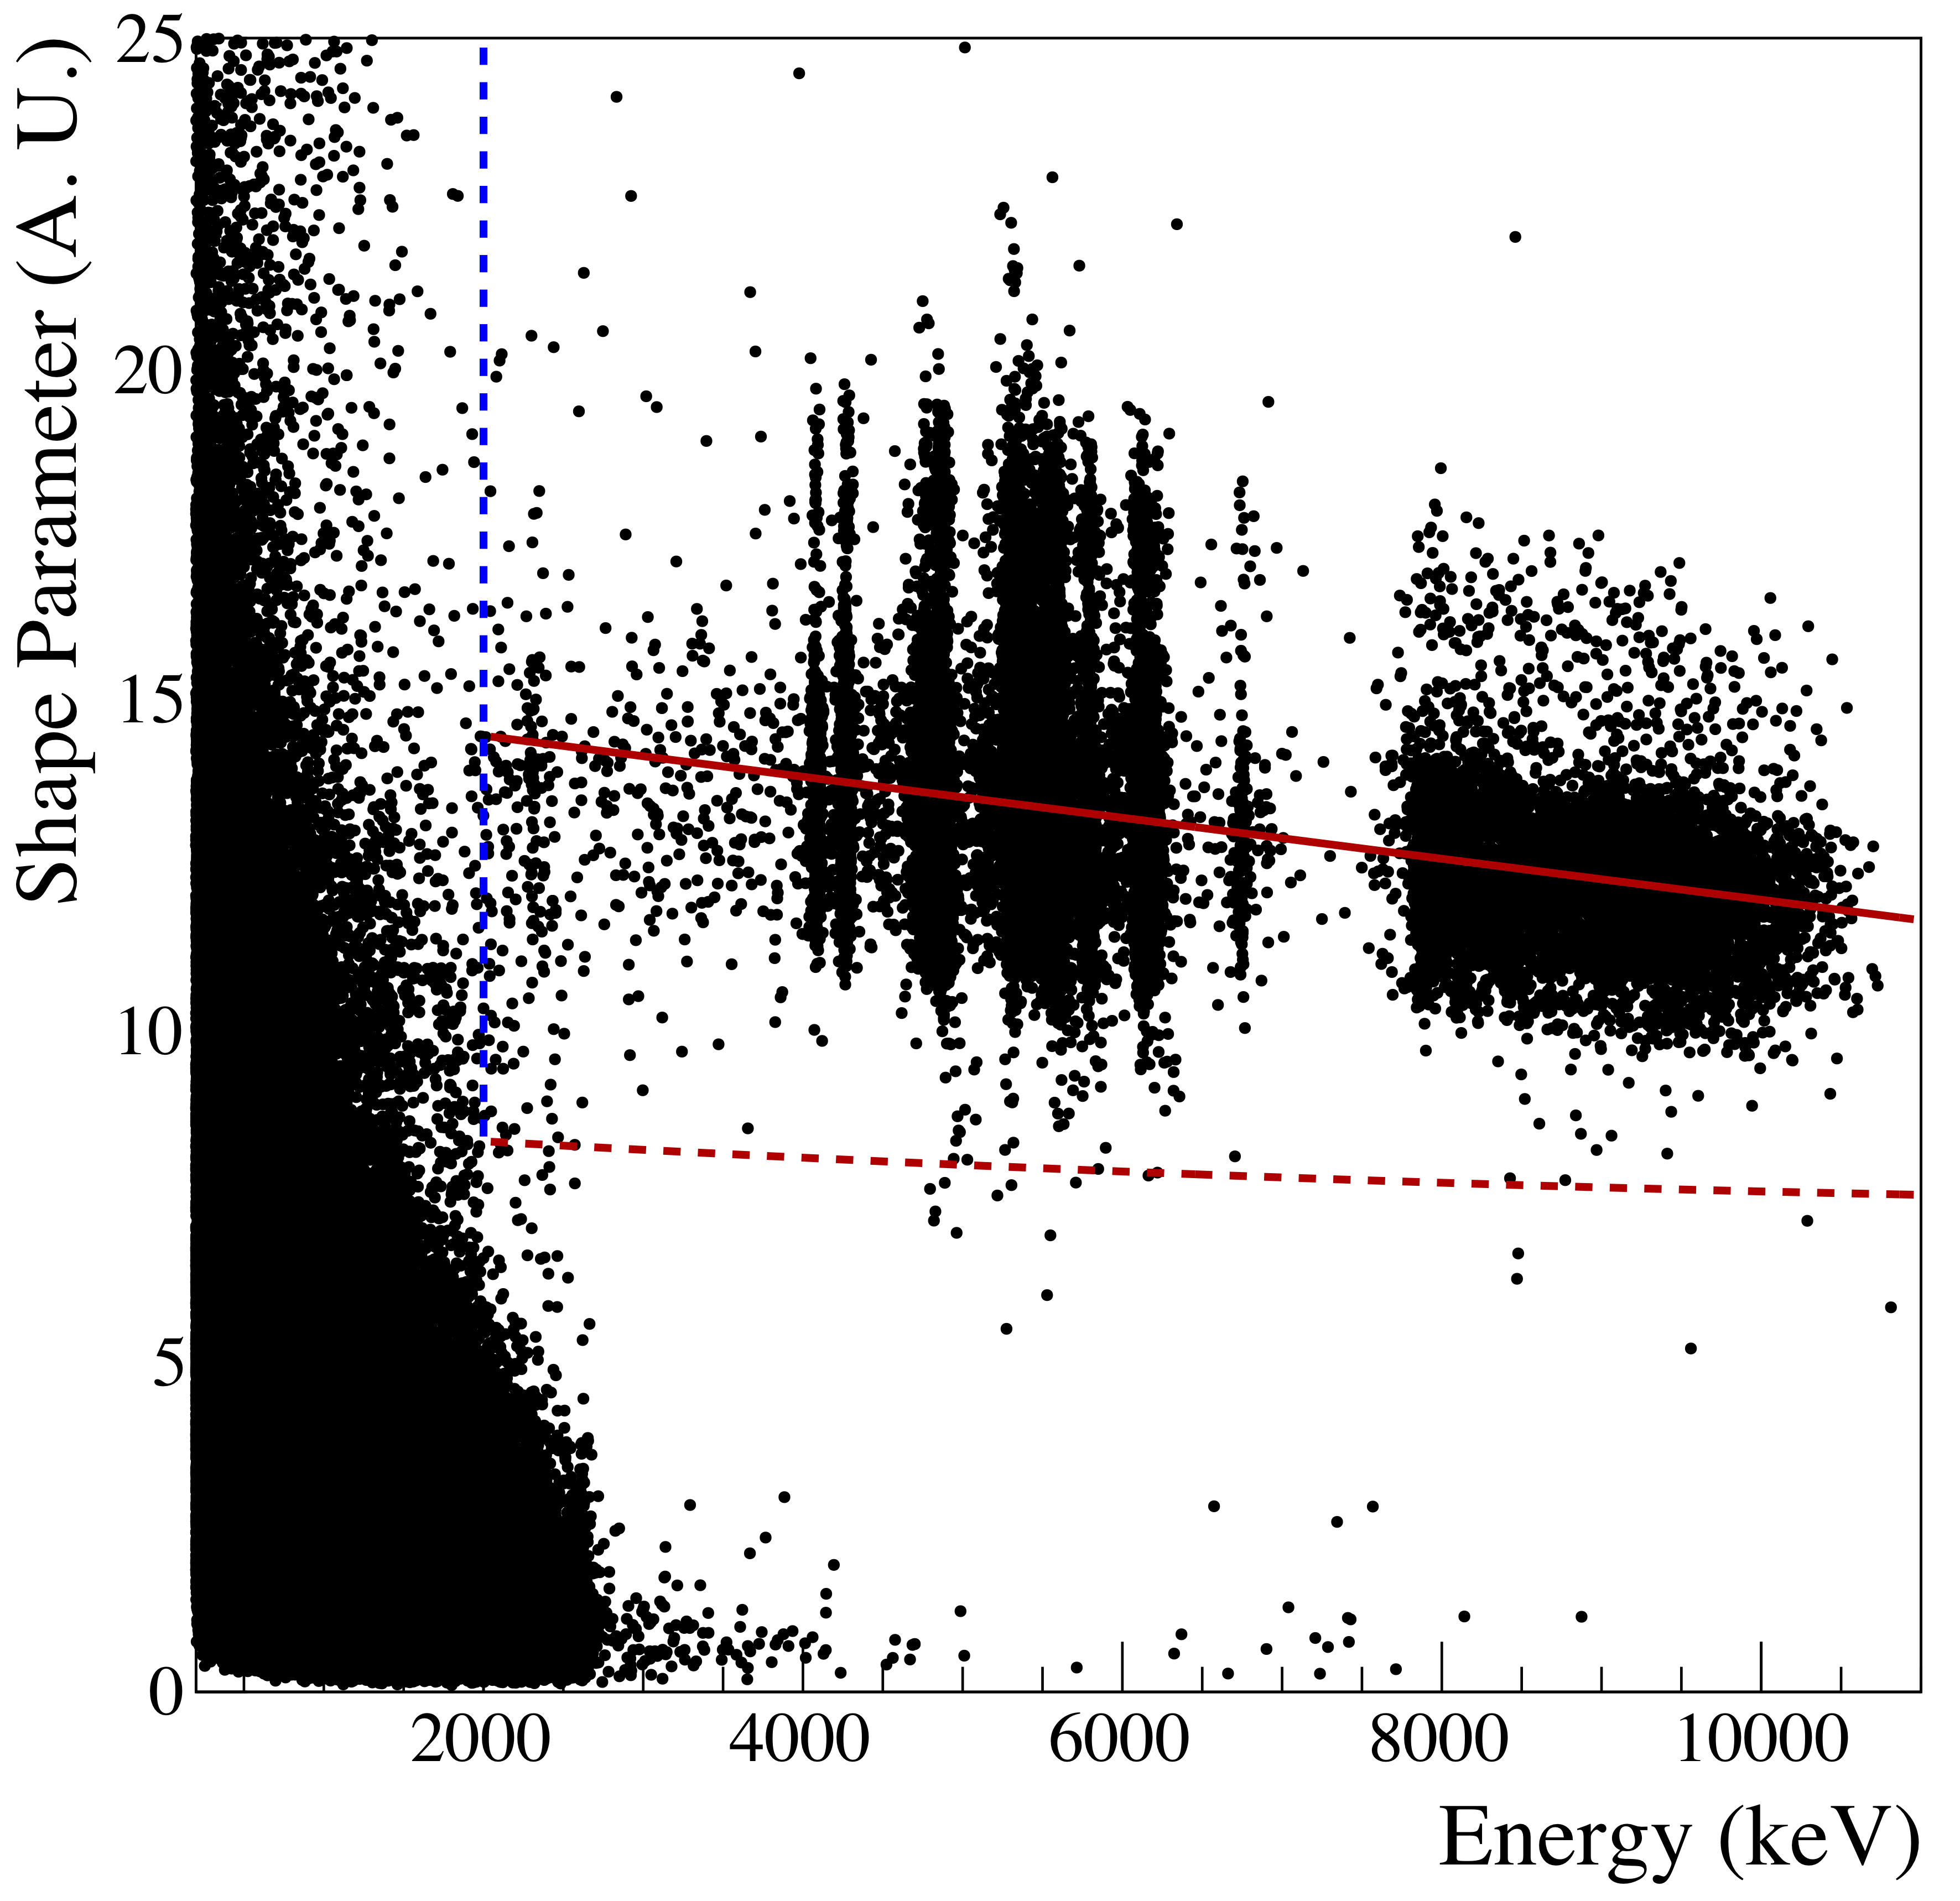 Figure 2
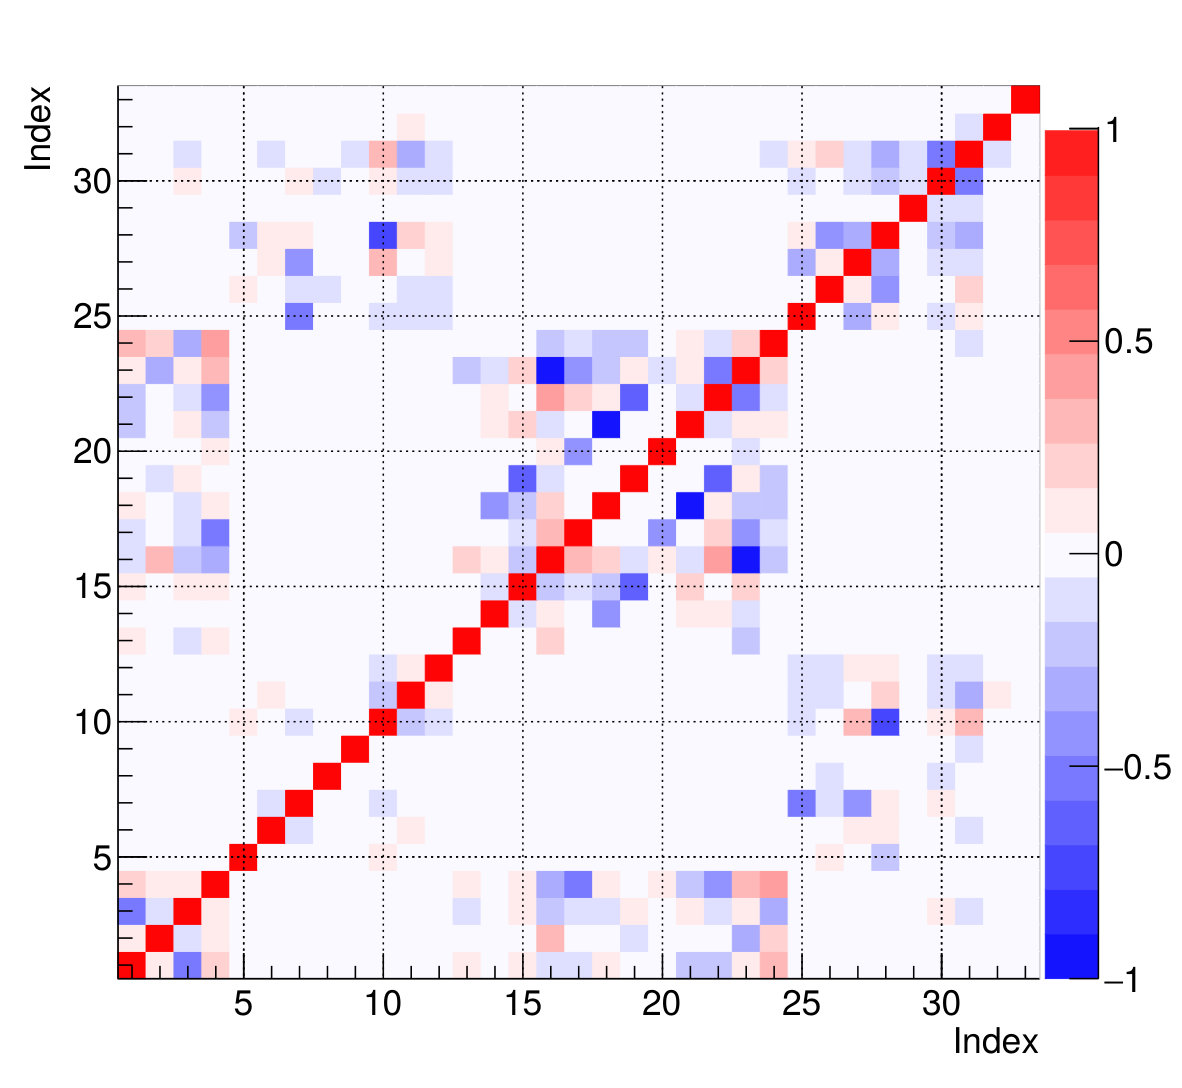 Figure 3
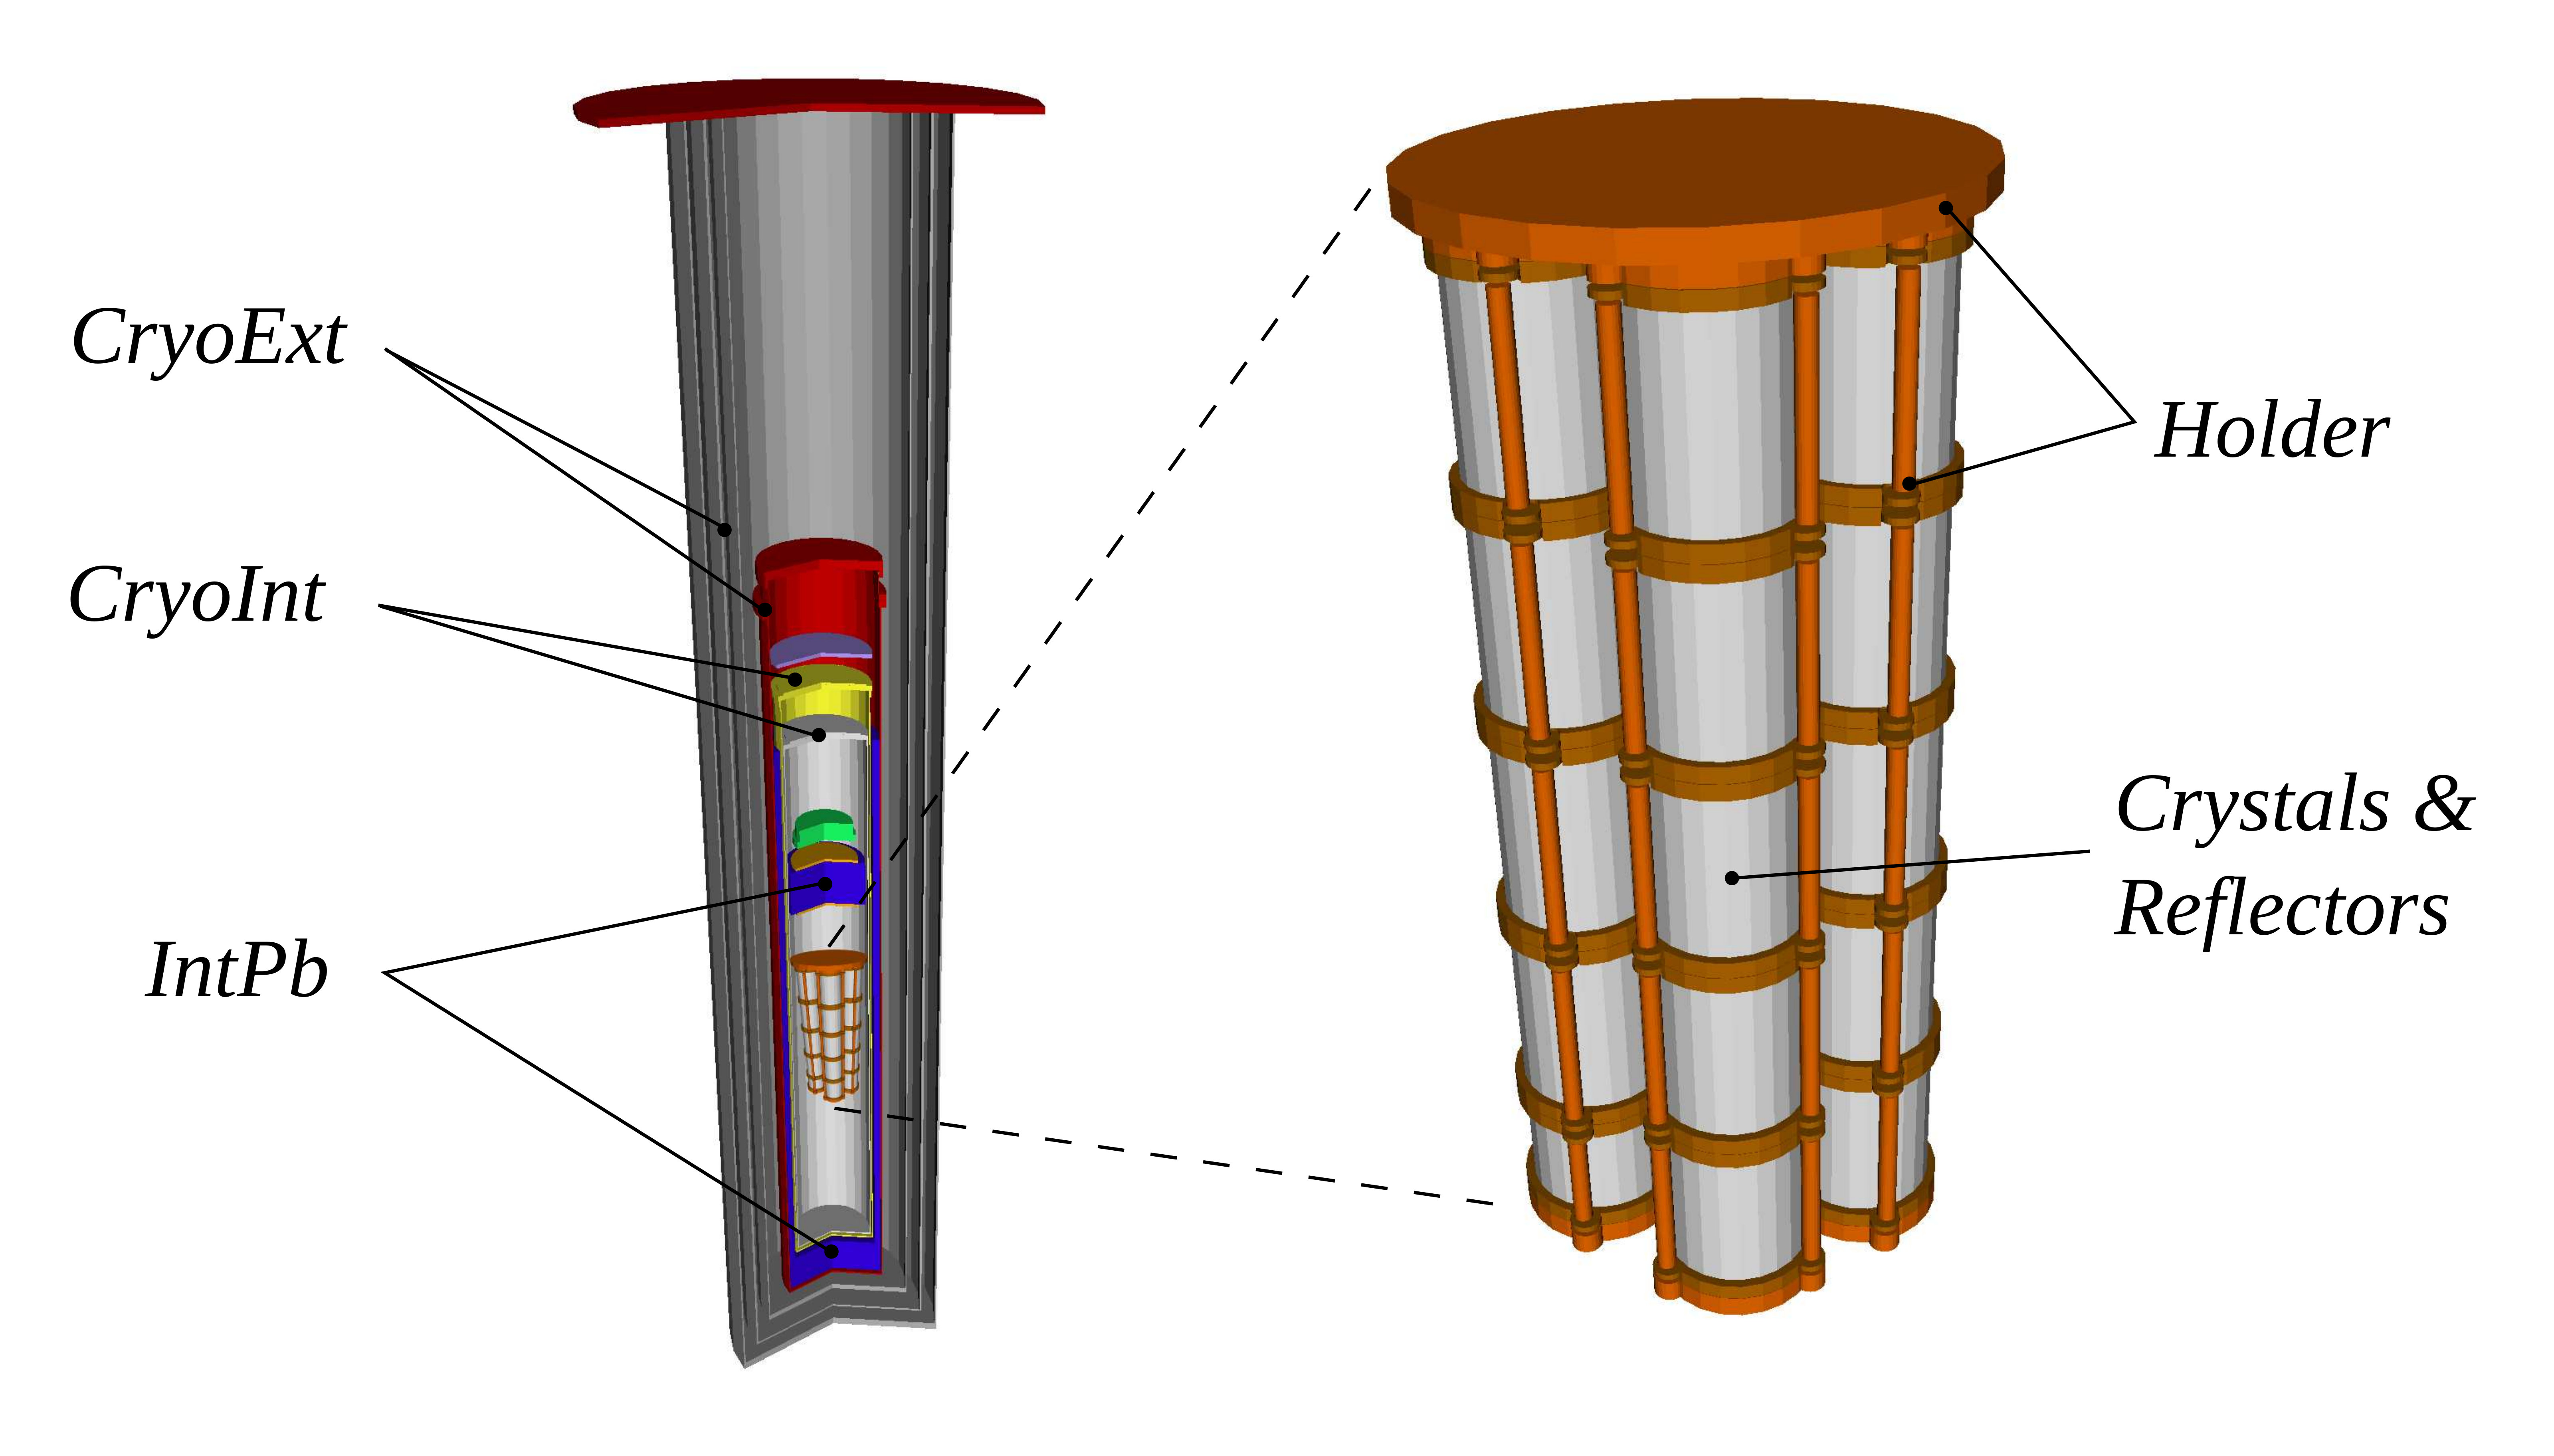 Figure 4
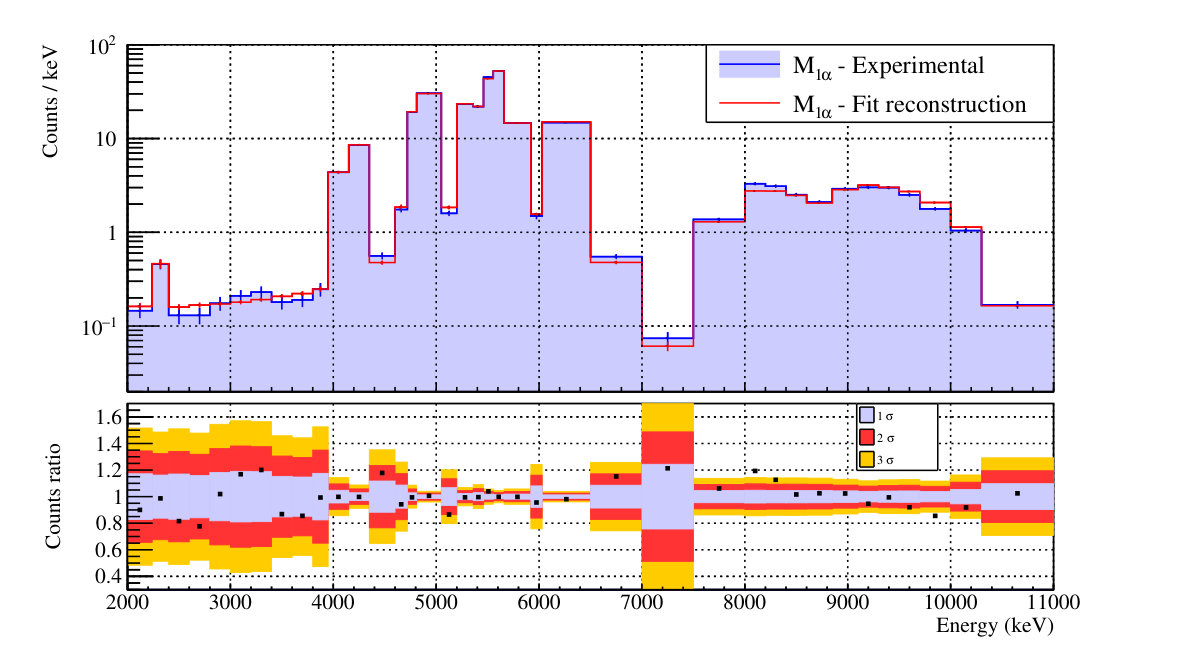 Figure 5
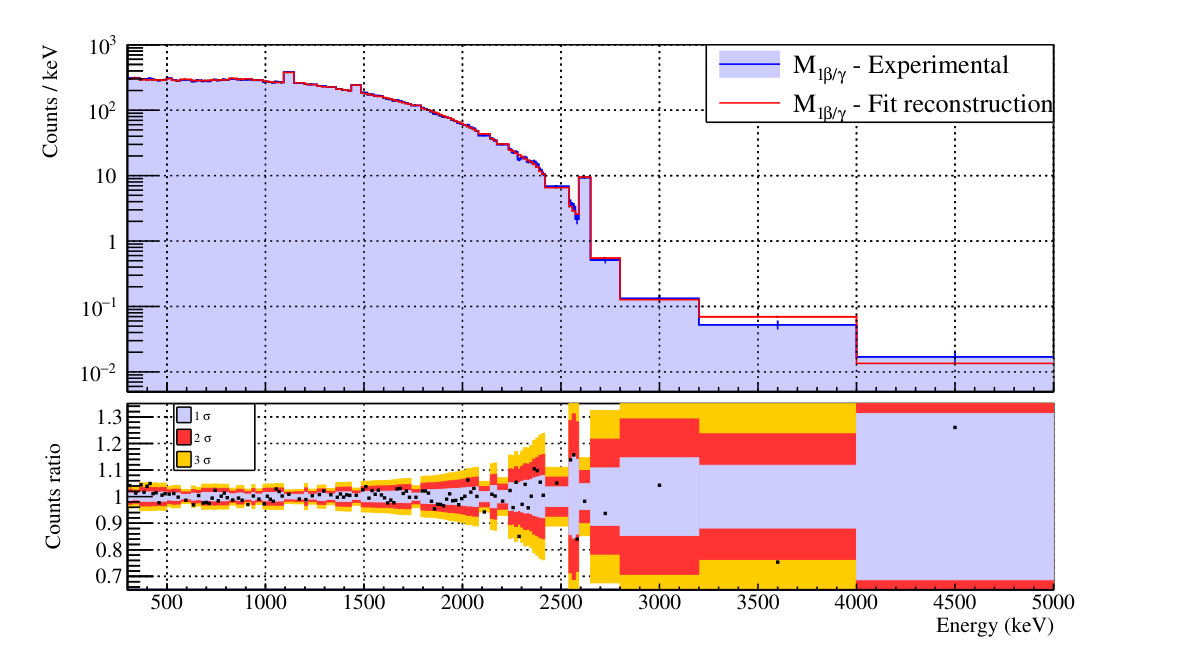 Figure 6
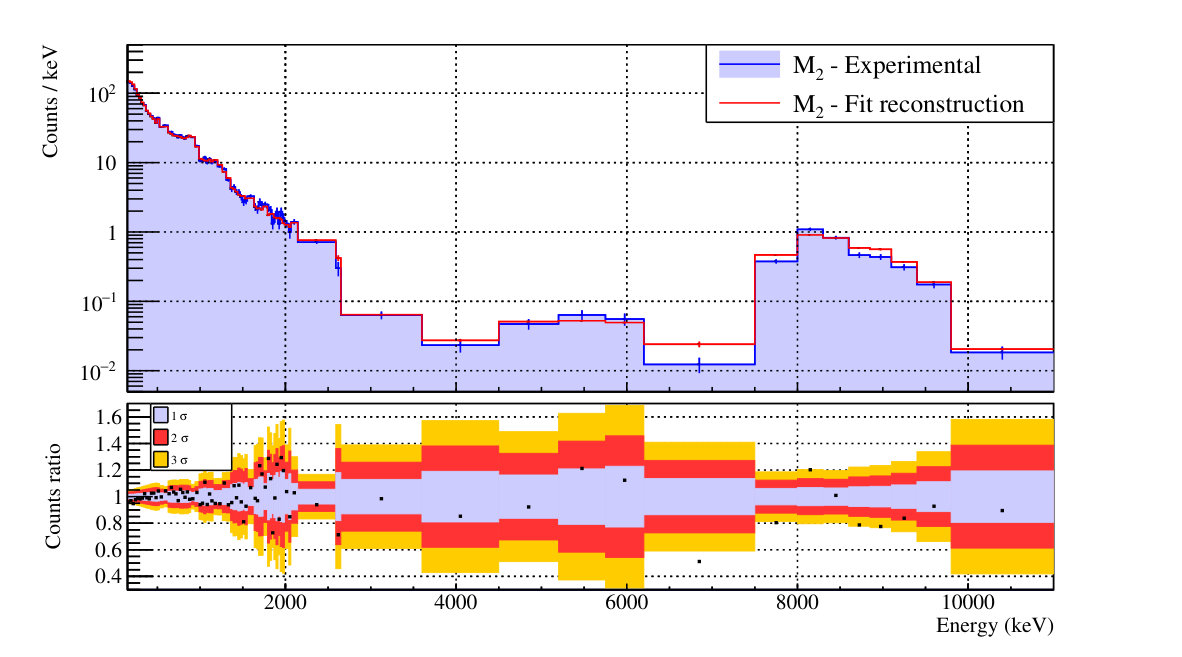 Figure 7
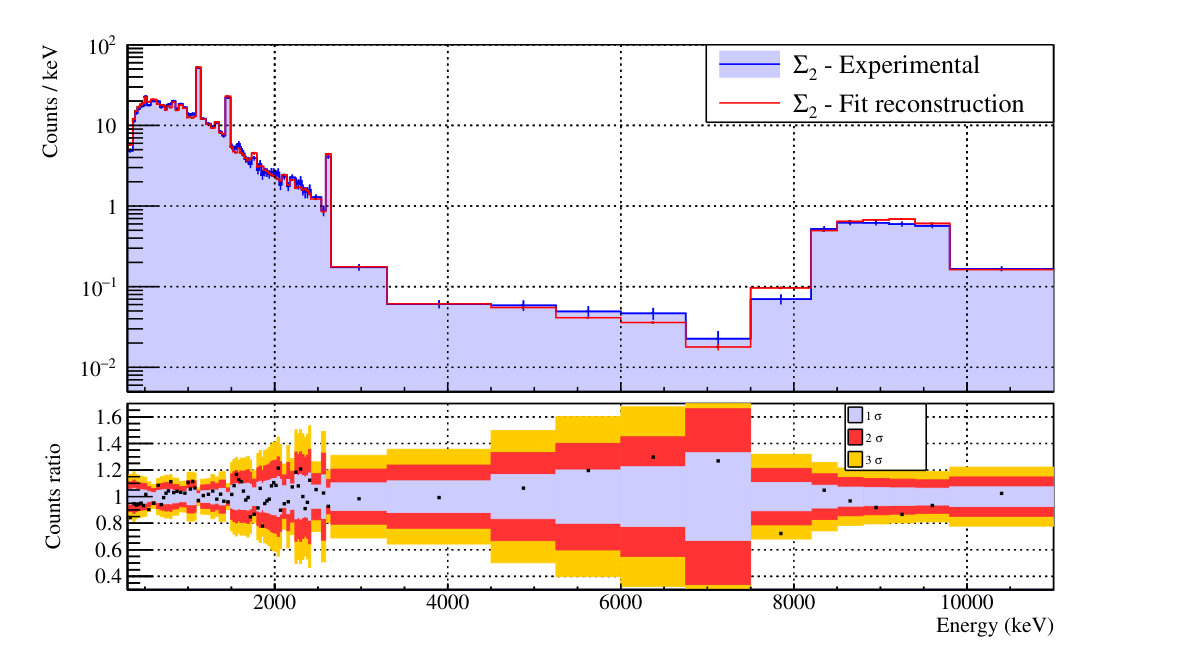 Figure 8
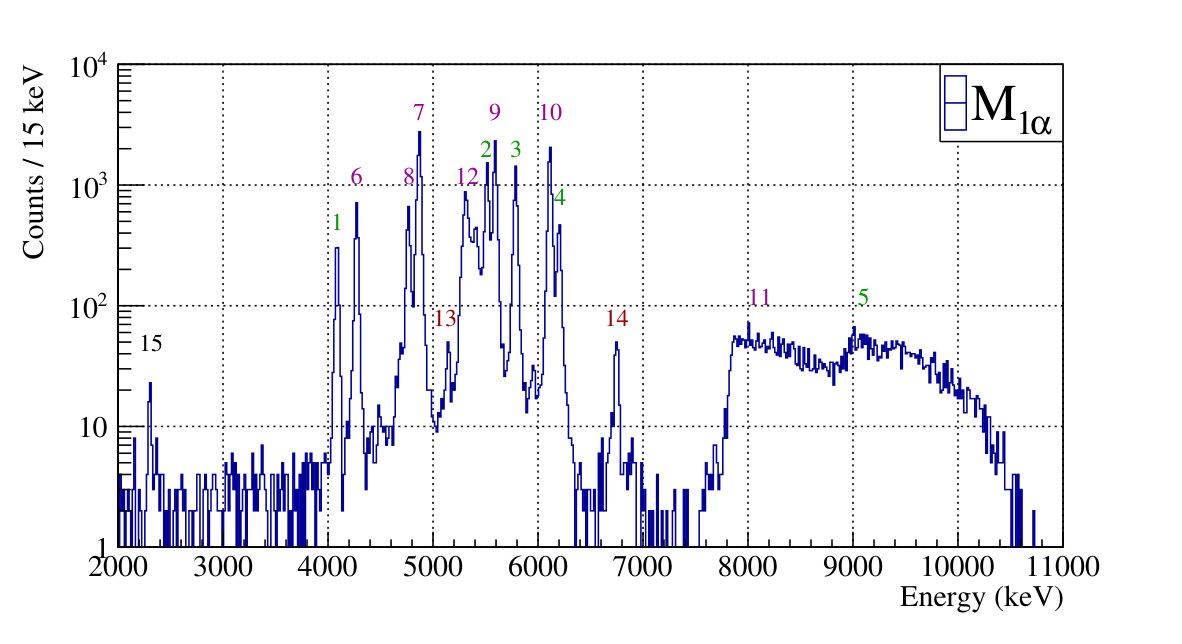 Figure 9
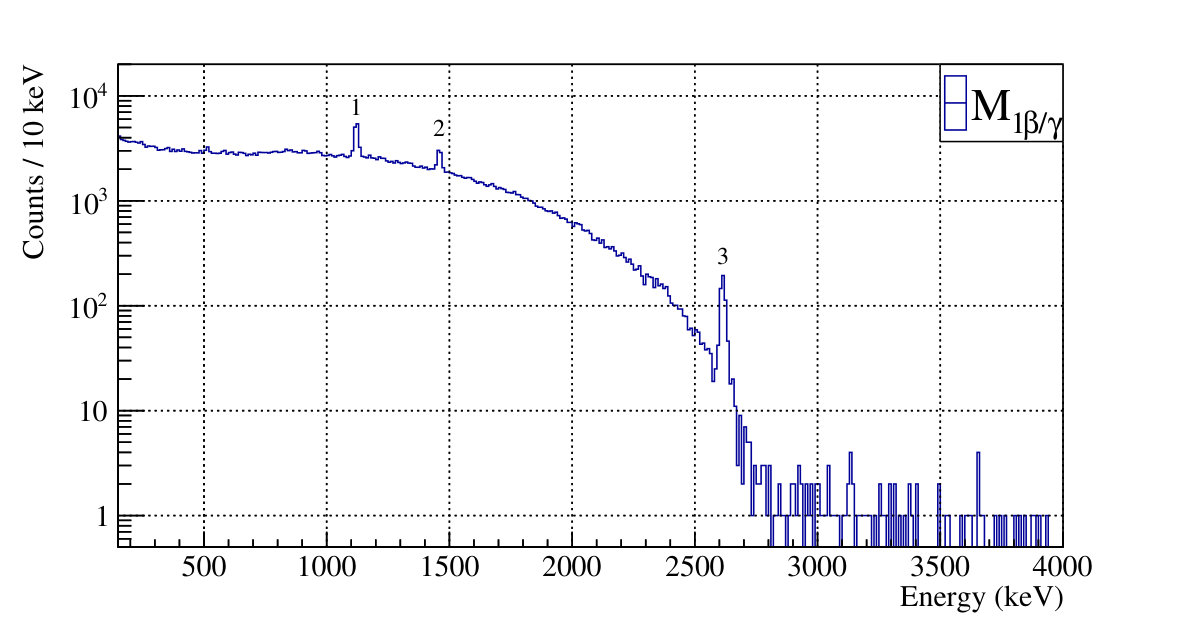 Figure 10
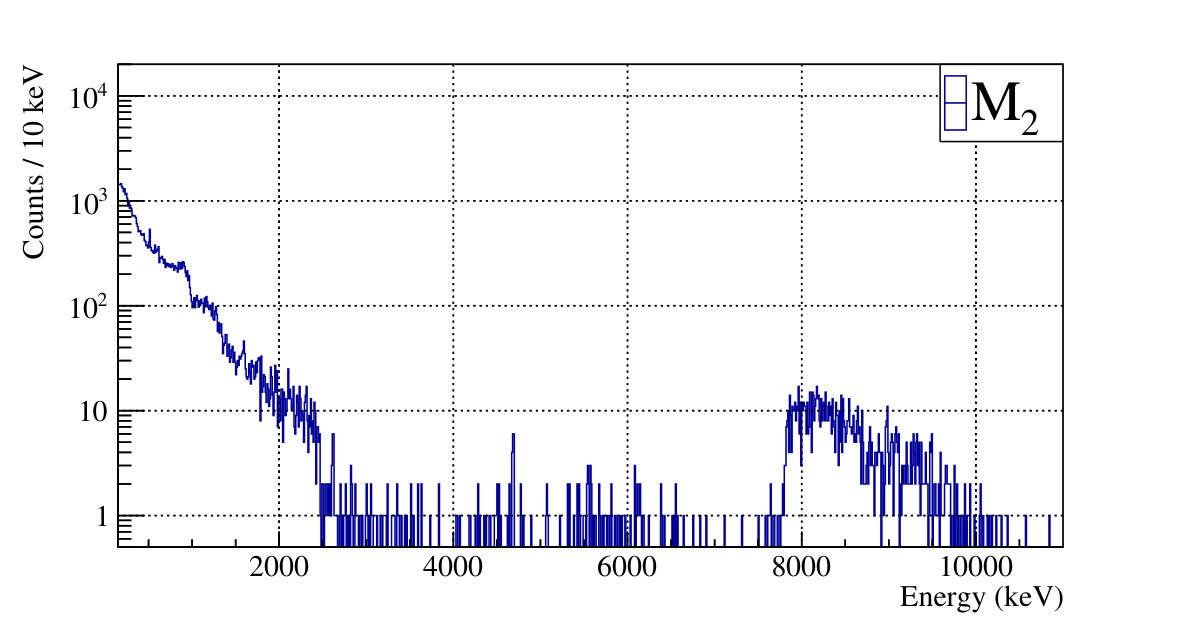 Figure 11
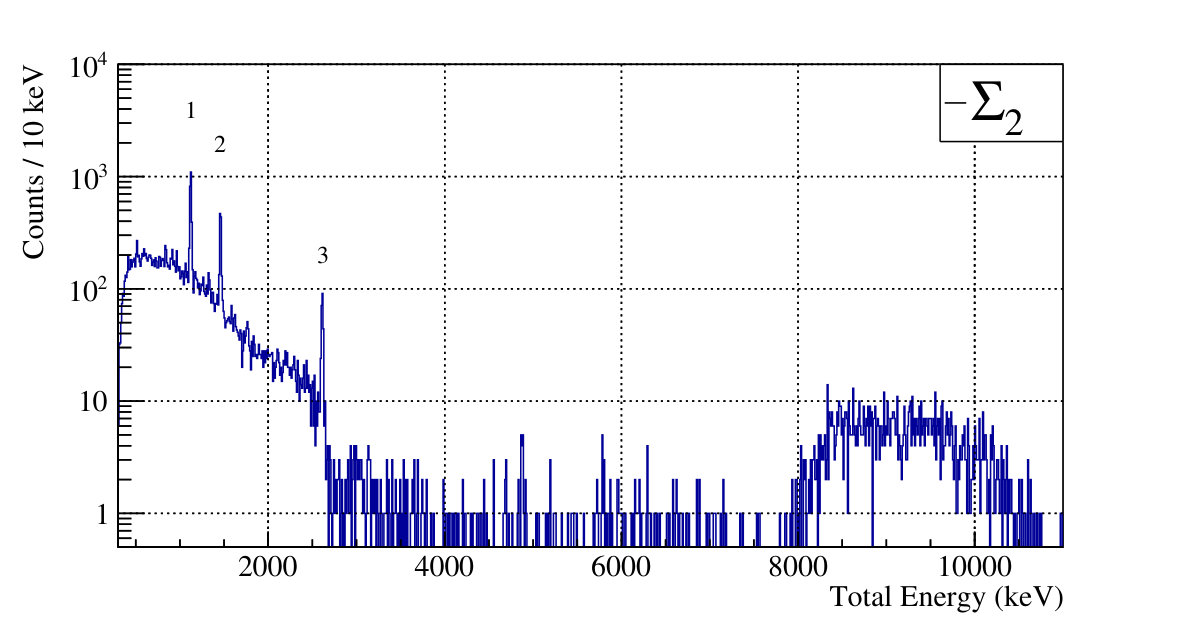 Figure 12
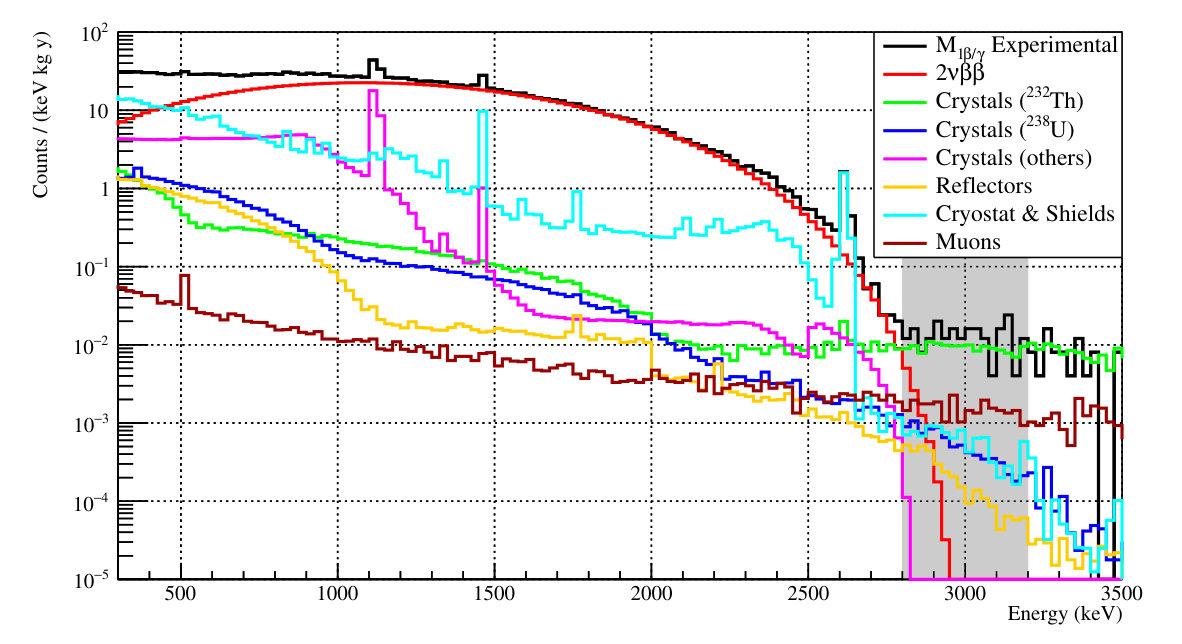 Figure 13
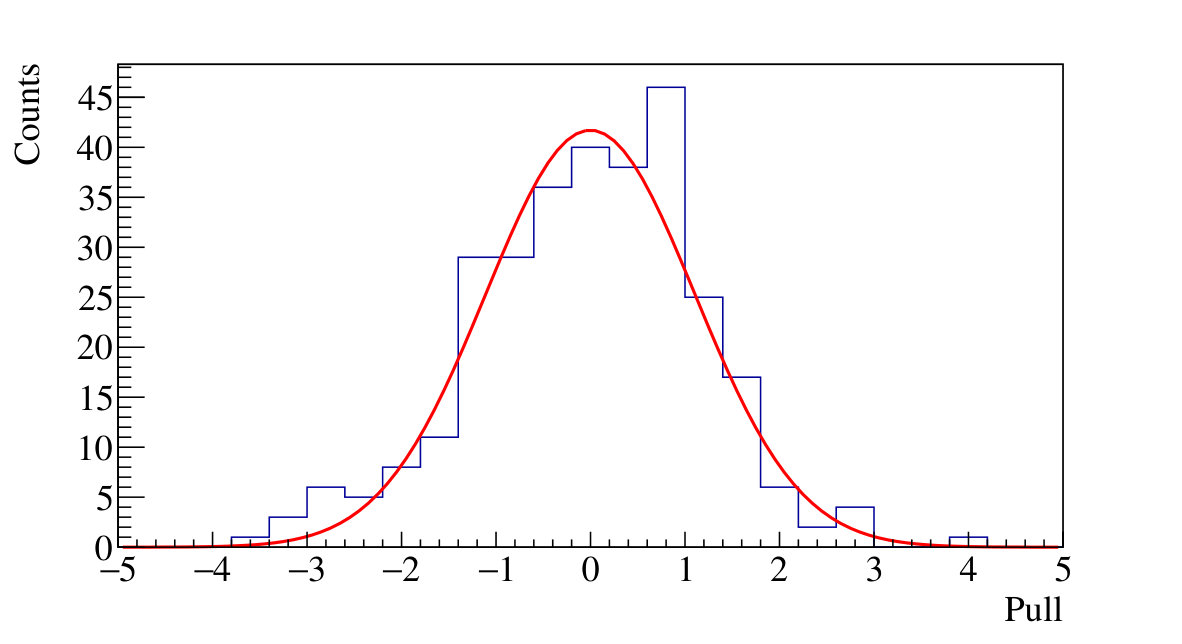 Figure 14
| Component | 232Th | 238U |
|---|---|---|
| [Bq/kg] | [Bq/kg] | |
| Ge-LD | 610-6 | 1.910-5 |
| VIKUITITM | (4.9 1.210-5 | (1.70.5)10-4 |
| 8.4 10-5 (a) | - | |
| Epoxy Glue | 8.910-4 | 1.010-2 |
| Au bonding wires | 4.110-2 | 1.210-2 |
| Si heaters | 3.310-4 | 2.110-3 |
| Ge thermistors | 4.110-3 | 1.210-2 |
| PTFE supports | 6.110-6 | 2.210-5 |
| Cu NOSV | 2.010-6 | 6.510-5 |
| (a) Limit on 212Bi–212Po contamination. | ||
| Energy | Isotope | Rate | Rate |
|---|---|---|---|
| (keV) | (counts/(kg yr)) | (counts/(kg yr)) | |
| 835 | 54Mn | 46 11 | 20 3 |
| 911 | 228Ac | 57 10 | 15 3 |
| 969 | 228Ac | 39 10 | 14 3 |
| 1116 | 65Zn | 639 17 | 234 6 |
| 1173 | 60Co | 35 9 | 7 4 |
| 1332 | 60Co | 28 8 | 11 2 |
| 1461 | 40K | 230 12 | 100 4 |
| 1765 | 214Bi | 15 6 | 5.7 1.4 |
| 2615 | 208Tl | 45 3 | 23.1 1.7 |
| Isotope | Energy | Rate | |
| (MeV) | (counts/(kg yr)) | ||
| 232Th | 4.08 | Q | 80 3 |
| 228Th | 5.52 | Q | 384 7 |
| 224Ra | 5.79 | Q | 332 7 |
| 220Rn + 216Po | – | – | pile up: + |
| 212Bi (B.R. 36%) | 6.21 | Q | 140 4 |
| 212Bi + 212Po | Eβ + 7.83 | – | pile up: + |
| 238U | 4.27 | Q | 160 4 |
| 234U + 226Ra | 4.87 | Q | 716 11 |
| 230Th | 4.77 | Q | 161 4 |
| 222Rn | 5.59 | Q | 531 8 |
| 218Po | 6.12 | Q | 536 7 |
| 214Bi + 214Po | Eβ + 8.95 | – | pile up: + |
| 210Po | 5.41 | Q | 174 5 |
| 210Po | 5.30 | 392 10 | |
| 231Pa | 5.15 | Q | 8.8 1.3 |
| 211Bi | 6.75 | Q | 14.3 1.4 |
| 147Sm | 2.31 | Q | 4.2 0.7 |
| Component | Mass (kg) | Source | Index | Activity (Bq/kg) |
|---|---|---|---|---|
| Crystals | 10.5 | 1 | ||
| 65Zn | 2 | |||
| 40K | 3 | |||
| 60Co | 4 | |||
| 147Sm | 5 | |||
| 238U–226Ra | 6 | |||
| 226Ra–210Pb | 7 | |||
| 210Pb–206Pb | 8 | |||
| 232Th–228Ra | 9 | |||
| 228Ra–208Pb | 10 | |||
| 235U–231Pa | 11 | |||
| 231Pa–207Pb | 12 | |||
| Holder | 3.10 | 54Mn | 13 | |
| CryoInt (a) | 36.9 | 232Th | 14 | |
| 238U | 15 | |||
| 40K | 16 | |||
| 60Co | 17 | |||
| IntPb | 202 | 232Th | 18 | |
| 238U | 19 | |||
| CryoExt | 832 | 60Co | 20 | |
| ExtPb (b) | 24694 | 232Th | 21 | |
| 238U | 22 | |||
| 40K | 23 | |||
| 210Pb | 24 | |||
| Component | Surface (cm2) | Source | Index | Activity (Bq/cm2) |
| Crystals | 2574 | 226Ra–210Pb–0.01m | 25 | |
| 228Ra–208Pb–0.01m | 26 | |||
| 226Ra–210Pb–10m | 27 | |||
| 228Ra–208Pb–10m | 28 | |||
| Reflectors (c) | 2100 | 232Th–10m | 29 | |
| 226Ra–210Pb–10m | 30 | |||
| 210Pb–206Pb–10m | 31 | |||
| 210Pb–206Pb–0.01m | 32 | |||
| Muons | Flux in units of /(cm2s) | 33 | ||
| (a) CryoInt sources include also a minor contribution from Holder bulk contaminations. | ||||
| (b) ExtPb is used to represent also the CryoExt sources, that exhibit degenerate spectra. | ||||
| (c) Reflectors include also a contribution from light detectors, and from copper surface | ||||
| and other parts directly facing the ZnSe crystals. | ||||
| Component | ROIbkg rate | Source | ROIbkg rate |
|---|---|---|---|
| (counts/(keV kg yr)) | (counts/(keV kg yr)) | ||
| Crystals | 232Th– bulk | ||
| 232Th–surf | |||
| 238U–surf | |||
| Reflectors & Holder | 232Th | ||
| 238U | |||
| Cryostat & Shields | 232Th | ||
| 238U | |||
| Subtotal | |||
| Muons | |||
| ( counts/(keV kg yr) in [2.95–3.05] MeV range) | |||
| Total | |||
| Experimental | |||
Peer Reviews
No public reviews on file for this paper yet. If you reviewed it on a platform where reviews are public (OpenReview, ICLR, NeurIPS, ICML), you can paste yours below so the community can read it here.
Videos
No videos yet. Explain this paper in a talk, walkthrough, or lecture? Add one.
∎
11institutetext: INFN - Laboratori Nazionali di Legnaro, Legnaro (Padova) I-35020 - Italy 22institutetext: Materials Science Division, Lawrence Berkeley National Laboratory, Berkeley, CA 94720 - USA 33institutetext: Dipartimento di Fisica, Sapienza Università di Roma, Roma I-00185 - Italy 44institutetext: INFN - Sezione di Roma, Roma I-00185 - Italy 55institutetext: Dipartimento di Fisica, Università di Milano - Bicocca, Milano I-20126 - Italy 66institutetext: INFN - Sezione di Milano - Bicocca, Milano I-20126 - Italy 77institutetext: INFN - Laboratori Nazionali del Gran Sasso, Assergi (L’Aquila) I-67100 - Italy 88institutetext: Gran Sasso Science Institute, 67100, L’Aquila - Italy 99institutetext: Dipartimento di Fisica, Università di Genova, Genova I-16146 - Italy 1010institutetext: INFN - Sezione di Genova, Genova I-16146 - Italy 1111institutetext: CSNSM, Univ. Paris-Sud, CNRS/IN2P3, Université Paris-Saclay, 91405 Orsay - France 1212institutetext: IRFU, CEA, Université Paris-Saclay, F-91191 Gif-sur-Yvette, France 1313institutetext: Department of Physics and Astronomy, University of South Carolina, Columbia, SC 29208 - USA
\thankstexte1Corresponding Author: [email protected] \thankstexte4Present Address: Fundación ARAID and Laboratorio de Física Nuclear y Astropartículas, Universidad de Zaragoza, C/ Pedro Cerbuna 12, 50009 Zaragoza, Spain \thankstexte2Present Address: Queen’s University, Physics Department, K7L 3N6, Kingston (ON), Canada \thankstexte3Present Address: CSNSM, Univ. Paris-Sud, CNRS/IN2P3, Université Paris-Saclay, 91405 Orsay, France
Background Model of the CUPID-0 Experiment
O. Azzolini\thanksrefLegnaro
J. W. Beeman\thanksrefLBNL
F. Bellini\thanksrefRoma,INFNRoma
M. Beretta\thanksrefMIB,INFNMiB
M. Biassoni\thanksrefINFNMiB
C. Brofferio\thanksrefMIB,INFNMiB
C. Bucci\thanksrefLNGS
S. Capelli\thanksrefMIB,INFNMiB
L. Cardani\thanksrefINFNRoma
P. Carniti\thanksrefMIB,INFNMiB
N. Casali\thanksrefINFNRoma
D. Chiesa\thanksrefMIB,INFNMiB,e1
M. Clemenza\thanksrefMIB,INFNMiB
O. Cremonesi\thanksrefINFNMiB
A. Cruciani\thanksrefRoma,INFNRoma
I. Dafinei\thanksrefINFNRoma
S. Di Domizio\thanksrefGenova,INFNGenova
F. Ferroni\thanksrefINFNRoma,GSSI
L. Gironi\thanksrefMIB,INFNMiB
A. Giuliani\thanksrefCNRS
P. Gorla\thanksrefLNGS
C. Gotti\thanksrefMIB,INFNMiB
G. Keppel\thanksrefLegnaro
M. Martinez\thanksrefRoma,INFNRoma,e4
S. Nagorny\thanksrefLNGS,GSSI,e2
M. Nastasi\thanksrefMIB,INFNMiB
S. Nisi\thanksrefLNGS
C. Nones\thanksrefCEA
D. Orlandi\thanksrefLNGS
L. Pagnanini\thanksrefMIB,INFNMiB
M. Pallavicini\thanksrefGenova,INFNGenova
L. Pattavina\thanksrefLNGS
M. Pavan\thanksrefMIB,INFNMiB
G. Pessina\thanksrefINFNMiB
V. Pettinacci\thanksrefINFNRoma
S. Pirro\thanksrefLNGS
S. Pozzi\thanksrefMIB,INFNMiB
E. Previtali\thanksrefMIB,INFNMiB
A. Puiu\thanksrefMIB,INFNMiB
C. Rusconi\thanksrefLNGS,USC
K. Schäffner\thanksrefLNGS,GSSI
C. Tomei\thanksrefINFNRoma
M. Vignati\thanksrefINFNRoma
A. Zolotarova\thanksrefCEA, e3
(Received: 24 April 2019 / Accepted: 27 June 2019)
Abstract
CUPID-0 is the first large mass array of enriched Zn82Se scintillating low temperature calorimeters, operated at LNGS since 2017. During its first scientific runs, CUPID-0 collected an exposure of 9.95 kg yr. Thanks to the excellent rejection of particles, we attained the lowest background ever measured with thermal detectors in the energy region where we search for the signature of 82Se neutrinoless double beta decay. In this work we develop a model to reconstruct the CUPID-0 background over the whole energy range of experimental data. We identify the background sources exploiting their distinctive signatures and we assess their extremely low contribution (down to counts/ (keV kg yr)) in the region of interest for 82Se neutrinoless double beta decay search. This result represents a crucial step towards the comprehension of the background in experiments based on scintillating calorimeters and in next generation projects such as CUPID.
Keywords:
double beta decay scintillating calorimeters background model
pacs:
23.40.-s decay; double decay; electron and muon capture 27.50.+e mass 59 A 89 29.30.Kv X- and -ray spectroscopy
††journal: Eur. Phys. J. C
1 Introduction
The postulated neutrinoless double beta decay () consists of two neutrons of an atomic nucleus simultaneously decaying to two protons and two electrons, without the accompanying emission of electron antineutrinos Furry:1939qr . If observed, would provide crucial evidence for lepton number violation and it is one of the most sensitive methods to study neutrino properties such as its nature (Dirac or Majorana) and the absolute value of its mass DellOro:2016tmg . The experimental signature of is a peak at the end of the continuous spectrum produced by the electrons emitted in two-neutrino double beta decay, an allowed, although extremely rare, second order nuclear transition. Detectors with excellent energy resolution, such as low temperature calorimeters (historically also called bolometers), are the best candidates to study this process, being able to disentangle the searched peak from the continuous background. However, the energy resolution is only one of the parameters that concur to determine the sensitivity of an experiment for the search of decay. Others are the number of isotopes under study, the live time, the detection efficiency and the background rate in the energy region of interest (ROI) Alduino:2017pni_Sensitivity .
The goal of the background model described in this work is to identify the sources of the CUPID-0 background and evaluate their contribution to the ROI around the 82Se Q-value (2997.90.3 keV Lincoln:2012fq ). This study is, in particular, fundamental for the design of next generation experiments, because the conventional techniques applied to measure radioactivity in materials are not able to probe levels of contamination as low as those required for future experiments. Therefore the required information must be extrapolated from current rare event experiments.
In this paper, after introducing the CUPID-0 detector and the data production (Section 2), we analyze the experimental spectra in wide energy ranges, from a few hundred keV to 10 MeV, to find signatures of background sources (Section 3). The energy spectra produced in the detector by each source are then simulated by means of a Monte Carlo code (Section 4). The background model (Section 5) is constructed by selecting a representative list of sources whose spectra are combined in a Bayesian fit to the experimental data. Information about contaminant activities available from independent measurements or analyses are included through apposite prior distributions. Finally (Section 6), we present the fit results, i.e. the activities obtained for the background sources and their contribution to the ROI, as well as a discussion of systematic uncertainties.
2 CUPID-0: detector and data production
2.1 The CUPID-0 detector
The detection technique used in CUPID-0 experiment Azzolini:2018dyb_C0PRL is based on cryogenic scintillating calorimeters. These devices allow a simultaneous detection of energy released as heat and light. We exploit both signals to identify different types of interacting particles. The CUPID-0 detector is a five tower array of 26 ZnSe scintillating crystals, 24 enriched in 82Se at 95% level and 2 with 82Se natural isotopic abundance. The total detector mass is 10.5 kg of ZnSe, equivalent to 5.17 kg of 82Se. The crystals are interleaved with Germanium Light Detectors (Ge-LDs), that are used to measure the scintillation signal produced in ZnSe by interacting particles. Both ZnSe crystals and Ge-LDs are held in position by means of PTFE clamps and are thermally coupled to a heat bath at 10 mK by means of a copper structure. In order to increase the light collection, each ZnSe crystal is surrounded by a VIKUITITM multi-layers reflecting foil produced by 3M. CUPID-0 is hosted in Hall A of Laboratori Nazionali del Gran Sasso (LNGS), inside the cryostat previously used for the CUORICINO and CUORE-0 experiments Andreotti:2010vj ; Alfonso:2015wka_Q0PRL . The shielding infrastructure is identical to the CUORE-0 one, with the only difference that the 10 mK thermal shield has not been installed, and that the masses of 50 mK and 600 mK shields have been reduced via electrical discharge machining (EDM). The radio-purity of materials used in CUPID-0 experimental setup has been measured with different techniques Beeman:2015xjv ; Azzolini:2018tum_C0det ; Alduino:2016vtd_Q02nbb ; Alduino:2016vjd_Q0det ; BiPoDetector , obtaining the results reported in Tab. 1.
Both ZnSe crystals and Ge-LDs are equipped with a Neutron Transmutation Doped (NTD) Ge thermistor Wang:1989vk , working as temperature-voltage transducer. A P-doped Si Joule heater Andreotti:2012zz ; Carniti:2017zkr , glued to each device, periodically injects a constant energy reference pulse used to measure gain variations induced by temperature fluctuations. The front-end electronics comprises an amplification stage, a six-pole anti-aliasing active Bessel filter and an 18 bits ADC board Arnaboldi:2015wvc ; Arnaboldi:2017aek . The complete data-stream is digitized with a frequency of 1 kHz (2 kHz) for ZnSe (Ge-LD) and saved on disk in NTuples based on the ROOT software framework DiDomizio:2018ldc . A software derivative trigger with channel dependent threshold is implemented online. When a trigger fires on a crystal, the waveforms of the corresponding Ge-LDs are also flagged as signals. For each event on ZnSe we analyze a window of 5 s (1 s before the trigger and 4 s after it). The analysis window of signals on Ge-LDs is 500 ms long (100 ms before the trigger and 400 ms after it). The samples before the trigger provide the baseline temperature of the detector, while the remaining samples are used to determine the pulse amplitude and shape, for evaluating the deposited energy. More details about the CUPID-0 detector construction and performance can be found in Ref. Azzolini:2018tum_C0det and references therein.
2.2 Data production
This work is based on data collected with CUPID-0 between June 2017 and December 2018, for a total exposure of 9.95 kg yr (Zn82Se). Two of the enriched crystals, not properly working, and the two with natural Se are not included in this analysis.
The collected data are processed offline using a C++ based analysis framework originally developed by the CUORE-0 and CUORE collaborations Alduino:2016zrl_Q0Analysis . The specific analysis tools developed for scintillating calorimeters in the framework of CUPID-0 are presented in Ref. Azzolini:2018yye_C0Analysis ; Azzolini:2018oph_C0ExcitedStates .
The aim of the data production sequence is to extract from each triggered waveform the corresponding energy release and interaction time. To improve the signal-to-noise ratio, the data are filtered with a software matched-filter algorithm Gatti:1986cw ; Radeka:1966 . The filtered amplitude is then corrected for gain instabilities using the reference pulses periodically injected through Si heaters Carniti:2017zkr . The corrected amplitude is converted into energy by fitting a parabolic function with zero intercept to the energy of the most intense peaks produced by a 232Th source periodically positioned close to the cryostat external shield Azzolini:2018yye_C0Analysis . The heat released by and of the same energy is slightly different because of the different energy spent in the light channel. To re-calibrate the events, we identify the most intense peaks produced by 238U and 232Th internal contaminations (see Fig. 2), and convert the amplitude to energy using a parabolic function. Data acquired between two calibrations are grouped in a DataSet and processed together through the analysis chain.
We compute time coincidences between detectors within a 20 ms window, optimized by studying the time distribution of physical coincident events collected during calibrations. Time coincident events are organized in a multiplet structure, which includes information about the triggered crystals and the total energy released in the detector. Since the total event rate is approximately 50 mHz, the probability of accidental (i.e. causally unrelated) coincidences is relatively small ().
Finally, we implement a series of event selection cuts in order to maximize our sensitivity to physics events Azzolini:2018yye_C0Analysis . Periods of cryostat instability and malfunction are excluded on a crystal-by-crystal basis. A time veto around each event (4 s before and 4 s after) is applied to remove piled up events. We exploit heater pulses to calculate the trigger efficiency (i.e. the probability that an event is detected and reconstructed at the right energy) and the pile-up cut efficiency Alduino:2016zrl_Q0Analysis . We select particle events by requiring a non-zero light signal simultaneously recorded by Ge-LDs. The efficiency of this cut is evaluated by analyzing time coincident events in two crystals, providing a pure sample of particle events, given the negligible probability of random coincidences Alduino:2016vtd_Q02nbb . The combined efficiency has a constant value of (95.7 0.5) % above 150 keV.
2.3 Tagging of particles
The events generated by particle interaction are identified relying on the different time development of their light pulses with respect to the ones produced by / interactions Artusa:2016maw . Such different pulse shape is quantified by the Shape Parameter (SP):
[TABLE]
where are the samples of the filtered light pulse, is its maximum amplitude, and are the samples of the filtered average pulse scaled to unitary amplitude and aligned to . The summation starts from the index iM corresponding to the position of the maximum and runs for wr points ( 50) corresponding to the right width at half maximum of Si. The average pulse is made selecting only events in the energy range 1.82.64 MeV of 232Th calibration measurements, with the method described in Ref. Azzolini:2018yye_C0Analysis . As a consequence, the SP of events is much higher than the SP of events. Fig. 1 shows the values of SP as a function of energy in CUPID-0 data. Particle identification is difficult below 2 MeV and, thus, it is exploited only above this energy.
To discriminate from events, we calculate the mean and the standard deviation of the particle SP as a function of energy and we set a boundary at . The and values of SP are calculated excluding the events with SP (i.e. the cut used in Ref. Azzolini:2018dyb_C0PRL to select the events). The discrimination boundary adopted in this analysis allows to correctly identify energy depositions by particles with a probability of 99.9% at all energies greater than MeV. This boundary is higher than the contour of SP distribution, thus we select events with unitary efficiency. The expected number of wrongly identified events introduces a negligible contamination in the spectrum up to MeV.
3 Background Analysis
Based on the results from previous experiments Alduino:2016vtd_Q02nbb ; Alduino:2017qet_BkgBudget ; Arnold:2018tmo , the sources of background expected in CUPID-0 are:
- •
the decay of 82Se;
- •
contaminations of the experimental setup (including the detector itself, the cryostat and the shielding) due to ubiquitous natural radioisotopes of 232Th, 238U and 235U decay chains, and 40K;
- •
isotopes produced by cosmogenic activation of detector materials, such as 60Co and 54Mn in copper and 65Zn in ZnSe;
- •
cosmic muons, environmental -rays and neutrons.
For a better disentanglement of background sources, we exploit the discrimination of versus events and the detector modular design, that allows to tag events producing simultaneous energy depositions in different ZnSe crystals. We then build the following energy spectra:
- •
is the energy spectrum of events that triggered only one bolometer (multiplicity 1 events); this spectrum includes also events with E2 MeV that, however, provide a minor contribution;
- •
is the energy spectrum of multiplicity 1 events produced by particle interactions;
- •
is the energy spectrum of events that simultaneously triggered two bolometers (multiplicity 2 events), built with the energies detected in each crystal;
- •
is the energy spectrum associated to multiplicity 2 events that contains, for each couple of time coincident events, the total energy released in both crystals.
Events with higher order multiplicity are used to evaluate the contribution of muons, that generate electromagnetic showers triggering several bolometers at the same time.
In Figure 2 we show the , , and experimental spectra, with labels on the signatures used to identify the background sources.
The main component of the spectrum is the continuum produced by the decay of 82Se. The most intense lines exceeding this continuum are produced by the decays of 65Zn, 40K, and 208Tl and are clearly visible also in the spectrum. In Table 2 we report the counting rates of these lines and of other smaller peaks attributable to the decays of 60Co, 54Mn, 228Ac, and 214Bi.
The peaks observed in the spectrum are due to decays occurring in ZnSe crystals or in the detector components directly facing them. These peaks are produced by isotopes belonging to 232Th, 238U and 235U decay chains, and by 147Sm, a natural long lived isotope with half-life equal to 1.061011 yr Sm147 .
In Table 3, we report the counting rates and the energies of the peaks. All the main peaks in the spectrum (except the 5.3 MeV line of 210Po) are centered at the Q-value of the decays. This means that the corresponding radioisotopes are located in the bulk or near the surface of ZnSe crystals, because the energy of both and nuclear recoil is detected. The counts in the peaks have been evaluated by means of Gaussian fits with linear background subtraction. Taking into account that the line shape is not perfectly Gaussian and that some peaks are partially overlapped, the rates in Table 3 are affected by systematic error up to 10%. By analyzing the counting rates of the isotopes in each decay chain, we identify the breaking points of secular equilibrium. In 232Th chain, the progenitor 232Th has a lower rate with respect to the daughters isotopes, thus we can infer a breaking point at 228Th (that can also be at 228Ra, since there is no signature for this isotope). In 238U chain, data interpretation is complicated by the fact that the peak at 4.87 MeV includes counts from both 234U and 226Ra. However, the 226Ra activity is constrained to be the same of its daughters 222Rn and 218Po, which have relatively short half-life. Therefore, we can infer that the first part of the chain from 238U to 230Th is at equilibrium and that there are two breaking points: the first at 226Ra and the second at 210Pb.
At energies greater than 7.8 MeV, we observe a continuum spectrum with a double bump shape. The first bump is produced by the 214Bi–214Po decay sequence in 238U chain, while the second, starting at 8.9 MeV, is due to the 212Bi–212Po decay sequence of 232Th chain. In both Bi–Po sequences, the Po half-life is much shorter than the characteristic rise time of thermal pulses (few ms) produced in bolometers, therefore the energy released by Po decays sums up with the energy deposited by Bi decays. In data production, these events are tagged and calibrated as , because most of the energy is released by the particle interaction. As a consequence, the energy of component of these events is underestimated by approximately 20%, due to the different calibration of and energy depositions. The Bi–Po signature is present also in the and spectra, because particles and the associated can cross the reflecting foils around ZnSe crystals and produce events. On the contrary, since the range of particles is lower than reflecting foil thickness, the and spectra have a small number of events in the range of -lines from 4 to 7 MeV.
4 Monte Carlo simulations
The background sources identified through data analysis are simulated with a Monte Carlo toolkit, called Arby, based on the Geant4 toolkit Geant4 , version 4.10.02. The radioactive decays from the various background sources can be generated in any volume or surface of the CUPID-0 detector, cryostat and shielding implemented in Arby. The primary and any secondary particles are then propagated through the CUPID-0 geometry using the Livermore physics list. The energy deposited in ZnSe crystals is recorded in the Monte Carlo output together with the time at which the interaction occurred. The fraction of energy released by any particle type is also recorded to allow particle identification. Radioactive decays are implemented using the G4RadioactiveDecay database. The decay chains of 232Th, 238U, and 235U can be simulated completely or in part, to reproduce breaks of secular equilibrium. The simulation is generated under the single-state dominance hypothesis (SSD) in the framework of the Interacting Boson Model (IBM) Kotila:2012zza , while the generation of external muons is described in Ref. Andreotti:2009dk .
In order to implement the detector response function and data production features in the Monte Carlo data, we reprocess the Arby output with a dedicated code. In particular, to account for detector time resolution, we sum energy depositions that occur in the same crystal within a 5 ms window. The experimental energy resolution is reproduced by applying a Gaussian smearing function with linearly variable width based on measured FWHM of and lines. The energy threshold of each detector is modeled with an error function that interpolates the experimental data of trigger efficiency versus energy. These data are collected in dedicated runs in which the heater is used to generate pulses with variable amplitudes (then converted into particle equivalent energies) and the efficiency is calculated, for each pulse amplitude, as the ratio between triggered and generated pulses. Exactly as done in experimental data production, events depositing energy in different crystals within 20 ms window are combined into multiplets and pile-up events (see Section 2) in the same crystal are discarded. Finally, exploiting the information about the type of particle depositing energy, we reproduce in the Monte Carlo data the same event selection applied in the experimental data to produce the and spectra. Particularly, we include in the spectrum (with efficiency at E MeV) not only the events, but also the heterogeneous events due to Bi–Po decay sequences, that in the experimental data are tagged as events (see Fig. 1).
To model the cryostat and its shielding we take as reference the scheme developed for the CUORE-0 background model Alduino:2016vtd_Q02nbb , implementing the geometry changes made in CUPID-0. Concerning particle generation, we group together the components that are made of the same material (and thus share equal contaminant concentration) or that cannot be disentangled as they produce degenerate spectra, given the counting statistics of the experimental data. In Fig. 3 we show the geometry of CUPID-0 cryostat and detector as implemented in Arby. The neutron and modern lead (ExtPb) external shields, even if not represented in the figure, are implemented in MC simulations as well (for a detailed scheme and description of these shields see Ref. Alduino:2016vtd_Q02nbb ). The cryostat components where the background sources are generated are the following:
- •
the Cryostat External Shields (CryoExt) include the Inner Vacuum Chamber (IVC), the super-insulation layers, the Outer Vacuum Chamber (OVC), and the main bath, whose spectra are degenerate;
- •
the Cryostat Internal Shields (CryoInt) group the 600 mK and the 50 mK shields, that are made of the same copper;
- •
the Internal Lead Shield (IntPb) is inserted between the IVC and the 600 mK shield and is made of low background ancient Roman lead.
The CUPID-0 detector itself, reconstructed with high detail in MC simulations, is made of three main components where the background sources are generated:
- •
the Holder is the supporting structure for the detectors and is made of a special copper alloy (NOSV copper produced by Aurubis company) suitable for cryogenic use and cleaned according to protocols developed in CUORE Alessandria:2012zp ;
- •
the Crystals are ZnSe cylinders with heights and positions mirroring the real experimental setup;
- •
the Reflectors are the foils laterally surrounding the crystals. This component is also used to account for the minor contribution from light detectors (see Tab. 1), from the amount ( 15 cm2/crystal) of copper surface directly facing the edges of ZnSe crystals, and from the other small parts close to the crystals (PTFE spacers, NTDs, and wires), whose spectra are degenerate with those of reflecting foils.
5 Background model
In the construction of a background model, the crucial step is selecting a representative list of sources for fitting the experimental spectra. The analysis of and lines presented in Section 3 allows to identify the most relevant sources to be included in the model. Alongside these sources, there are other contaminations not producing prominent signatures and whose location (or even emitting isotope) cannot be determined with certainty. In this case, the use of all possible sources introduces too many degrees of freedom in the fit and produces highly correlated results. To avoid this drawback, that would mask the precision of the results, we identify the so-called reference model, a well balanced set of sources, selected according to the above criteria. We then perform some tests in which the source list is modified to investigate the uncertainties related to the choice of background sources.
In the following subsections, we describe the sources used for background model. We distinguish among internal/near and external sources. In the first category, radiation is not shielded and we must model bulk and surface contamination separately, since they are characterized by different signatures and can produce different counting rates in the ROI. Conversely, bulk and surface contaminations of external sources produce degenerate spectra and cannot be disentangled.
5.1 Internal/near sources
The internal/near sources are located in Crystals and in detector components directly facing them, modeled by Reflectors. Natural radiation cannot cross the thickness of reflecting foils and light detectors surrounding the crystals. As a consequence, the spectrum is made up of events from internal/near sources only.
The breaks of secular equilibrium identified in Section 3 are modeled by producing separate Monte Carlo simulations for the different parts of the decay chains, to leave them free to converge on different normalizations when performing the fit.
In Fig. 4 we provide an insight of some spectra obtained by simulating the decay sequence from 226Ra to 210Pb in different positions of Crystals and Reflectors. Bulk simulations are obtained by randomly generating the decays inside a volume. Surface contaminations are simulated with exponential density profiles (where is a changeable depth parameter), used to model not perfectly smooth surfaces and diffusion processes of contaminants.
In the background model, we use three types of simulations for modeling the events produced by contaminations of Crystals:
- •
bulk, characterized by sharp peaks at Q-value of decays;
- •
very shallow with nm, that in addition to the prominent Q-value peaks, exhibit smaller peaks at energies due to nuclear recoil escapes;
- •
deep surface with m (which is approximately the range of natural particles in ZnSe), that produce the Q-value peaks over a continuum due to degraded escapes;
Unlike what was possible to do in CUORE-0 background model Alduino:2016vtd_Q02nbb , it is not straightforward to disentangle surface versus bulk contaminations of Crystals, because events produced by -escapes from crystal surfaces are completely absent in CUPID-0 data due to the interposition of reflecting foils. To compensate for the lack of this signature, we developed a new technique based on the time analysis of consecutive decays. The ratio between the number of parent and time-correlated daughter events releasing all the decay energy in the same crystal depends on the contaminant location. Indeed, given a parent event at the Q-value, the probability to detect a time-correlated event at the daughter Q-value is nearly one in case of bulk contaminations, whereas it is approximately half in case of surface contaminations, because of -escapes from detector surfaces. In particular, for 238U chain, we count the number of parent events at 5.59 MeV peak of 222Rn, followed by 6.12 MeV daughter events produced in the same crystal by 218Po decay within 3\times$$T_{1/2} time window (decay scheme in Eq. 2).
[TABLE]
Similarly, for 232Th chain, we look for time correlated events generated by 224Ra (Q=5.79 MeV) and 220Rn decays (scheme in Eq. 3). In the latter case, we developed a dedicated tool to recover and count the 220Rn events which are rejected by standard analysis cuts due to pile-up with 216Po decay ( = 0.145 s).
[TABLE]
By combining the experimental data of these time coincidences with Monte Carlo simulations, we constrain the ratio of surface versus bulk contaminations of the middle (226Ra–210Pb) and lower (228Ra–208Pb) parts of 238U and 232Th decay chains, respectively. The results of this analysis prove that bulk contaminations have higher activity than surface ones. In particular, we obtain that only 15% (5%) of the parent events at the Q-value of 222Rn (224Ra) are produced by surface contaminations. In the background model we exploit this information by setting specific priors to constrain the activity of 226Ra–210Pb and 228Ra–208Pb surface contaminations relative to the bulk ones.
The other contamination of Crystals (see Table 4 for the complete list) cannot be constrained with this method and, to avoid getting too much correlated results, are modeled as bulk. This choice does not affect the reconstruction of the background at the ROI.
The simulations we use for modeling the contaminations of Reflectors are:
- •
very shallow with nm, producing a sharp peak at energy;
- •
bulk or deep surface with m, both characterized by a continuum spectrum due to degraded particles.
As shown in Figure 2 and Table 3, the only line clearly visible in the spectrum results from 210Po decay. Therefore, the only very shallow contamination of Reflectors included in the reference model is the 210Pb one. Given the thickness (70 m) and low density (0.6 g/cm3) of reflecting foils, bulk and 10 m surface contaminations produce nearly degenerate spectra. In the reference model we use the 10 m surface ones. Based on the measured contaminations of reflector foils reported in Table 1, we do not include the upper part of 238U decay chain (whose contribution is negligible), and we set a prior on 232Th chain using the the upper limit on 228Ra contamination. Therefore, the only unconstrained deep surface contamination of Reflectors is the lower part of 238U chain, which is split into 226Ra–210Pb and 210Pb–206Pb, to allow a break of equilibrium.
5.2 External sources
The external sources are contaminations in the holder, in the cryostat and in the shields. These sources produce events in the , , and spectra. The lines that can be used to identify these sources, besides being few, have limited statistics and, thus, cannot be exploited to directly extract information about the position of contaminations. For this reason, we take as reference the background model of the CUORE-0 experiment, that was operated in the same cryostat as CUPID-0. Given the lower statistics of CUPID-0 data and the higher rate, we have to apply further approximations with respect to the CUORE-0 model. Particularly, we cannot disentangle 232Th, 238U and 40K contaminations in CryoExt from the ones in ExtPb, because their spectra are degenerate. For the same reason, we merge Holder and CryoInt sources. The only exception is 54Mn, a cosmogenic-activated isotope with =312 d, that is mainly located in the most recently produced copper of the Holder structure. 60Co external sources are simulated only in copper components: CryoInt and CryoExt. We use the result from the CUORE-0 background model to set a prior for 60Co in CryoExt. Moreover, we do not include 40K contaminations in IntPb shield, since the CUORE-0 model sets an upper limit for this source. Finally, we simulate a 210Pb source in ExtPb, because the bremsstrahlung produced by 210Bi decay was found to produce a sizable amount of events in CUORE-0 experiment and, thus, is expected to provide a contribution also in CUPID-0.
5.3 Environmental sources
The muon flux, even if strongly suppressed by the Gran Sasso rock overburden, is expected to provide a not negligible contribution to the background in the ROI. Muons interacting in the detector components can produce several rays triggering high multiplicity events. We exploit this signature to determine the normalization of the simulated muon spectrum. With this method we determine the contribution from muons within a 15% systematic uncertainty, depending on the selection of experimental high multiplicity events used to calculate the normalization factor. The obtained result, which is compatible with measurements performed by other experiments Ambrosio:1995cx , is then used to set a prior for muons in the background model.
The contribution due to environmental neutrons and -rays is negligible, as stated in the CUORE-0 background model Alduino:2016vtd_Q02nbb .
6 Results
We perform a simultaneous Bayesian fit of , , and spectra with a linear combination of 33 background sources, to evaluate their activities. We use the JAGS (Just Another Gibbs Sampler) software JAGS to define the Bayesian statistical model and to sample the joint posterior Probability Density Function (PDF) of the fit parameters (i.e. the normalization coefficients of the Monte Carlo spectra). More details about the JAGS-based analysis tool for background model fit can be found in Ref. Alduino:2016vtd_Q02nbb . We use non-negative uniform priors for all fit parameters, with a few exceptions discussed in Section 5.
We choose a variable step size binning to minimize the effect of not ideal detector response which manifests itself in line shapes of complicated modeling, especially in the region. Practically, we define a binning that does not split the peaks in more than one bin. We set the minimum bin step to 15 keV in spectrum and to 25 keV in and spectra. We enlarge the binning in the regions with low density of events, in order to minimize the effects of statistical fluctuations.
The fit range extends from 300 keV to 5 MeV, and from 2 MeV to 11 MeV for and spectrum, respectively. The multiplicity 2 events used to fill and spectra are selected by requiring that both events in the multiplet have energy above a threshold set to 150 keV. Excluding the low energy events allows to bypass problems related to noise pulses that sometimes can be triggered and that are difficult to be discriminated from low energy physics events.
We label as reference the fit performed with the binning and energy range described in this section, using the sources of the reference background model. The effect of different choices is investigated in the systematic studies. The results of the reference fit to the experimental data collected with a 9.95 kg yr Zn82Se exposure are shown in Figures 5 and 6. In these plots, we show the comparison between the experimental and the fit-reconstructed spectra. The pull distribution, obtained from the fit residuals of all bins, is shown in Figure 7 and is compatible with a Gaussian with and .
We analyze the marginal posterior distributions of the fit parameters to evaluate the activities of background sources. Most of the marginal PDFs have a Gaussian shape and we calculate their mean and standard deviation to get the activity and its uncertainty. Differently, when the activity of a source is compatible with zero, we quote a 90% upper limit by integrating the posterior PDF.
From the sampling of the joint posterior PDF, we also extract the correlation matrix between the fit parameters, represented in Figure 8. As expected, the internal/near sources used to fit the spectrum are not correlated to the others, while the sources representing the same contaminant in different positions of the cryostat are highly (anti-)correlated.
The activities of the sources used in the reference fit are listed in Table 4. These numbers must be read and interpreted keeping in mind the approximations and the choices made in constructing the background model. Particularly, since the fit is performed on the full statistics collected by all CUPID-0 detectors, the activities evaluated for Crystals and Reflectors are average values of real contaminations, that could be not uniformly distributed. Moreover, the representation of the external sources is extremely simplified and does not aspire to establish with accuracy the activities of sources in cryostat and shields. Despite the above caveats, this method allows to constrain the background sources on their specific signatures in the experimental data, and to extrapolate their contribution to the ROI on a relative scale, independently of the absolute activity evaluated for each source.
6.1 Analysis of ROI and systematics
To analyze the background in the region of interest around the 82Se Q-value, we define a 400 keV interval from 2.8 MeV to 3.2 MeV (hereinafter referred to as ROIbkg). The energy range chosen for ROIbkg is much wider with respect to the () keV FWHM energy resolution at Q-value Azzolini:2018dyb_C0PRL , in order to include enough experimental counts to be used as a benchmark for background model predictions. In Figure 9, we show the reconstructed spectra of different groups of sources, and their contribution to the ROIbkg counting rate.
The counts predicted by the background model in the ROIbkg are 50.5 1.3. This is perfectly compatible with the 52 counts experimentally observed. Most part of ROIbkg events are due to 208Tl decays inside the Crystals. This radioisotope belongs to the lower part of 232Th chain and decays via with a Q-value of about 5 MeV. Based on the background model results, the 228Ra–208Pb source in the bulk of Crystals produces counts/(keV kg yr). The same contaminant on the surfaces of Crystals results in a rate of counts/(keV kg yr). These rates correspond to a total amount of 37 counts in the ROIbkg. Nevertheless, since the 208Tl half-life is relatively short (3.05 min), the 208Tl events can be rejected by exploiting the time coincidence with its parent, 212Bi Azzolini:2018yye_C0Analysis . For each event in the ROIbkg, we check if it is preceded by a 212Bi-like event in the same crystal. By applying a 7\times$$T_{1/2} window time veto to the simulations of 228Ra–208Pb sources, the predicted counting rates in the ROIbkg become counts/(keV kg yr) and counts/(keV kg yr) for bulk and surface contaminations of Crystals, respectively. Hence the model predicts the rejection of 34 1 counts. In the experimental data we observe the rejection of 38 events. We ascribe the higher event rejection in the experimental data to random coincidences in the time veto window.
Nonetheless, after applying the time veto, the background model predicts 16.5 0.8 counts in ROI, which is still well compatible with the 14 measured ones.
In Table 5, we report the counting rates reconstructed in the ROIbkg through the background model for the different sources after applying the time veto to reject 208Tl events. We sum the contributions from surface contaminations at different depths, and from the different components of cryostat and shields, thus reducing the effect of anti-correlation affecting these sources. As shown in Figure 9, the spectra of background sources in the ROIbkg exhibit either a flat or a decreasing trend, with no significant peaking structures. Since the ROIbkg is symmetrical around 82Se Q-value, the counting rate in the ROIbkg is a good approximation of the expected rate in the narrower region where the signature is searched. This is true for all background components except for the one, because its spectrum has the endpoint at the Q-value of 82Se decay. The contribution from source reported in Table 5 is produced exclusively by events with energy keV, while the expected counting rate from in a 100 keV range centered at 82Se Q-value is counts/(keV kg yr).
In order to study the systematic uncertainties of the background reconstruction in the ROIbkg, we perform some fits in which the sources are modeled in a different way with respect to the reference fit. Particularly, we performed the following tests:
a fit with a reduced list of sources in which we exclude the contaminations evaluated as upper limits in the reference fit; 2. 2.
a fit with Crystals surface contaminations simulated by setting the depth parameter at 0.1 m instead of 0.01 m ; 3. 3.
a fit in which the 226Ra–210Pb contamination in Reflectors is removed from the list of sources; 4. 4.
a fit in which the Reflectors sources simulated with 10 m depth parameter are replaced by uniformly distributed contaminations; 5. 5.
a fit in which we add 232Th and 238U contaminations on Holder surfaces (m), constrained by priors from CUORE-0 background model Alduino:2016vtd_Q02nbb ; 6. 6.
a fit in which we investigate the effect of 232Th and 238U surface contaminations on the 50 mK shield surrounding the CUPID-0 tower; 7. 7.
three fits in which the source list does not include 232Th and 238U contaminations in CryoInt, IntPb, and ExtPb, respectively;
In all of these tests, we obtain pull distributions compatible with a standard Gaussian. Therefore, we analyze the differences in the ROIbkg counting rates to get an estimate of systematic uncertainties, reported in Table 5. We do not quote a systematic uncertainty for contribution to the ROIbkg, because the results from all tests are within a range much smaller than the statistical uncertainty. Crystals surface contaminations are constrained by the time analysis of consecutive decays. Their counting rate in the ROIbkg has a maximum variation of 30% when fitting with the reduced list (that does not include 10 m surface contaminations of Crystals) and when performing the tests number 2 and 3.
The systematic uncertainties affecting the ROIbkg counting rate due to Reflectors and Holder contaminations are investigated through tests number 3, 4, and 5. The bulk/deep surface contaminations in Reflectors produce a continuum of degraded that allows to obtain a good fit to the spectrum in the [2–4] MeV range. Since 232Th in Reflectors is constrained by a prior which makes negligible its contribution, 226Ra–210Pb and 210Pb–206Pb are the only reflector sources which are left free to fit this continuum. In fit number 3, we investigate the scenario in which Reflectors are contaminated only by 210Pb–206Pb. The result is that the experimental counts in the [7–7.5] MeV range of spectrum are not reconstructed by the model and we get a 5 disagreement in that bin. We conclude that a contribution from the 226Ra–210Pb source in Reflectors is needed to preserve the fit quality and we estimate that its activity (and thus its counting rate in the ROI) must be at least half of that evaluated in the reference fit. On the other hand, the result of fit number 4, in which we choose an equally plausible model for the distribution of contaminants in Reflectors is that the ROIbkg counting rate from this source increases by 50%. The fit number 5 is aimed at investigating the effect of contaminations on Holder surfaces. This background source does not have a specific signature in the experimental data, because most of the particles generated at Holder surfaces are absorbed by Reflectors. However, some particles from 238U and 232Th chains can cross the reflector foils and produce events in the ROIbkg. Since the Holder is made of the same NOSV copper used in CUORE-0, we exploit the values of 232Th and 238U surface contaminations measured with CUORE-0 detector to constrain these sources. The result is that the reconstructed rate in the ROIbkg increases by counts/(keV kg yr). Particularly, the upper limit on the background due to 232Th in Reflectors and Holder becomes less stringent: counts/(keV kg yr). Similarly, in test number 6 we evaluate the systematic uncertainty affecting the ROIbkg reconstruction in the case that 232Th and 238U surface contaminations on the 50 mK shield surrounding CUPID-0 tower are not negligible with respect to the bulk contaminations of CryoInt. Also in this case, as expected, the fit predicts a higher rate in the ROIbkg, with an increase of counts/(keV kg yr) with respect to the reference one. The fits of test number 7 are used to investigate how the uncertainty on location and description of sources in cryostat and shields is propagated to the estimate of their contribution to the ROIbkg.
Finally, we performed some tests in which we varied the minimum bin size (from 5 to 50 keV) and the energy calibration (according to the residuals of a 56Co calibration measurement reported in Ref. Azzolini:2018yye_C0Analysis ). The changes in source activities and ROIbkg reconstruction are much smaller than the uncertainties quoted in Tables 4 and 5, thus the corresponding systematic errors are negligible.
7 Conclusion and perspectives
In this paper we fit the CUPID-0 data using 33 radioactive sources, modeled via Monte Carlo simulations. We identify the contribution of the various background sources to the ROIbkg counting rate and we perform an analysis of the corresponding systematic uncertainties. Excluding the decay contribution (which is negligible at the Q-value of 82Se decay), we obtain that 44% of background rate in the ROIbkg is produced by cosmic muon showers, while the remaining fraction is due to radioactive decays in Crystals (33%), in Reflectors & Holder (6%), and in Cryostat & Shields (17%).
Based on these results, an upgrade of the CUPID-0 detector has been scheduled in order to reduce the background level in the ROI and to further improve the comprehension of background sources. In CUPID-0 Phase-II we plan to install a muon veto, which will be implemented through a system of plastic scintillators in the external experimental setup. Moreover we will investigate the effect of removing reflecting foils. This will also allow us to get more information about surface contaminations of Crystals, through the analysis of and spectra, as performed in CUORE-0 Alduino:2016vjd_Q0det . Finally, we will add an ultra-pure copper vessel at 10 mK, acting as thermal and radioactive shield, that is expected to further reduce the counting rate due to contaminations of cryostat and shields.
The CUPID-0 results on -background rejection, further strengthened by the analysis presented here, are a founding pillar of the next-generation CUPID experiment Wang:2015raa ; Wang:2015taa , based on scintillating calorimeters.
8 Acknowledgments
This work was partially supported by the European Research Council (FP7/2007-2013) under contract LUCIFER no. 247115. We thank M. Iannone for his help in all the stages of the detector assembly, A. Pelosi for constructing the assembly line, M. Guetti for the assistance in the cryogenic operations, R. Gaigher for the mechanics of the calibration system, M. Lindozzi for the cryostat monitoring system, M. Perego for his invaluable help in many tasks, the mechanical workshop of LNGS (E. Tatananni, A. Rotilio, A. Corsi, and B. Romualdi) for the continuous help in the overall set-up design. We acknowledge the Dark Side Collaboration for the use of the low-radon clean room. This work makes use of the DIANA data analysis and APOLLO data acquisition software which has been developed by the CUORICINO, CUORE, LUCIFER and CUPID-0 collaborations. This work makes use of the Arby software for Geant4 based Monte Carlo simulations, that has been developed in the framework of the Milano – Bicocca R&D activities and that is maintained by O. Cremonesi and S. Pozzi.
The reference list from the paper itself. Each links out to its DOI / PubMed record.
- 1(1) W.H. Furry, Phys. Rev. 56 , 1184 (1939). doi: 10.1103/Phys Rev.56.1184 · doi ↗
- 2(2) S. Dell’Oro, S. Marcocci, M. Viel, F. Vissani, Adv. High Energy Phys. 2016 , 2162659 (2016). doi: 10.1155/2016/2162659 · doi ↗
- 3(3) C. Alduino, et al., Eur. Phys. J. C 77 (8), 532 (2017). doi: 10.1140/epjc/s 10052-017-5098-9 · doi ↗
- 4(4) D.L. Lincoln, J.D. Holt, G. Bollen, M. Brodeur, S. Bustabad, J. Engel, S.J. Novario, M. Redshaw, R. Ringle, S. Schwarz, Phys. Rev. Lett. 110 , 012501 (2013). doi: 10.1103/Phys Rev Lett.110.012501 · doi ↗
- 5(5) O. Azzolini, et al., Phys. Rev. Lett. 120 (23), 232502 (2018). doi: 10.1103/Phys Rev Lett.120.232502 · doi ↗
- 6(6) E. Andreotti, et al., Astropart. Phys. 34 , 822 (2011). doi: 10.1016/j.astropartphys.2011.02.002 · doi ↗
- 7(7) K. Alfonso, et al., Phys. Rev. Lett. 115 (10), 102502 (2015). doi: 10.1103/Phys Rev Lett.115.102502 · doi ↗
- 8(8) J.W. Beeman, et al., Eur. Phys. J. C 75 (12), 591 (2015). doi: 10.1140/epjc/s 10052-015-3822-x · doi ↗