Safety experiments for small robots investigating the potential of soft materials in mitigating the harm to the head due to impacts
Ahmad Yaser Alhaddad, John-John Cabibihan, Ahmad Hayek and, Andrea Bonarini
TL;DR
This study investigates the use of soft materials in small social robots to reduce head injury risk during impacts, using experimental testing and statistical analysis to identify optimal material properties.
Contribution
It provides empirical evidence on the effectiveness of soft materials in mitigating head impact forces in small robots, with specific optimal parameters identified.
Findings
Soft materials can reduce head impact acceleration.
Optimal thickness identified at 3 mm and 5 mm.
Control factors were not statistically significant in attenuation.
Abstract
There is a growing interest in social robots to be considered in the therapy of children with autism due to their effectiveness in improving the outcomes. However, children on the spectrum exhibit challenging behaviors that need to be considered when designing robots for them. A child could involuntarily throw a small social robot during meltdown and that could hit another person's head and cause harm (e.g. concussion). In this paper, the application of soft materials is investigated for its potential in attenuating head's linear acceleration upon impact. The thickness and storage modulus of three different soft materials were considered as the control factors while the noise factor was the impact velocity. The design of experiments was based on Taguchi method. A total of 27 experiments were conducted on a developed dummy head setup that reports the linear acceleration of the head.…
Click any figure to enlarge with its caption.
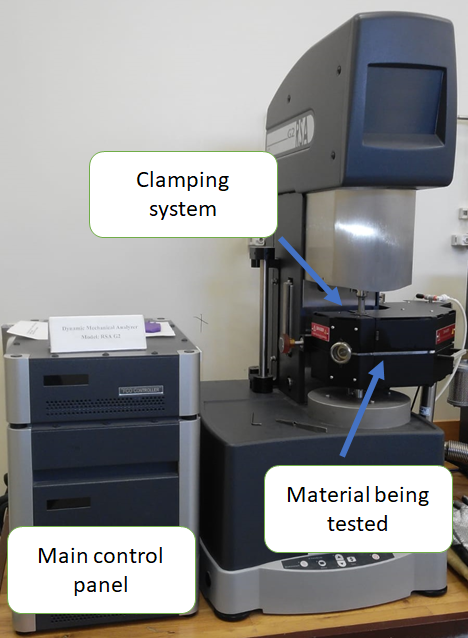 Figure 1
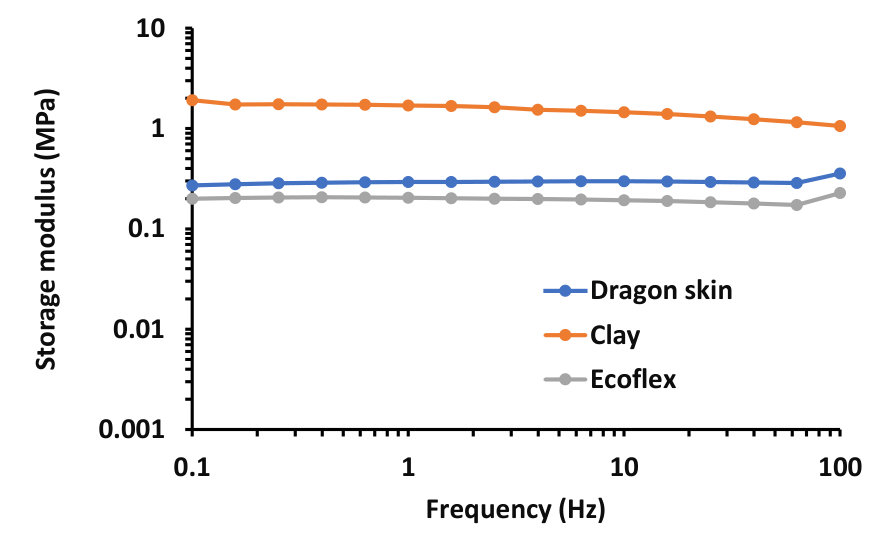 Figure 2
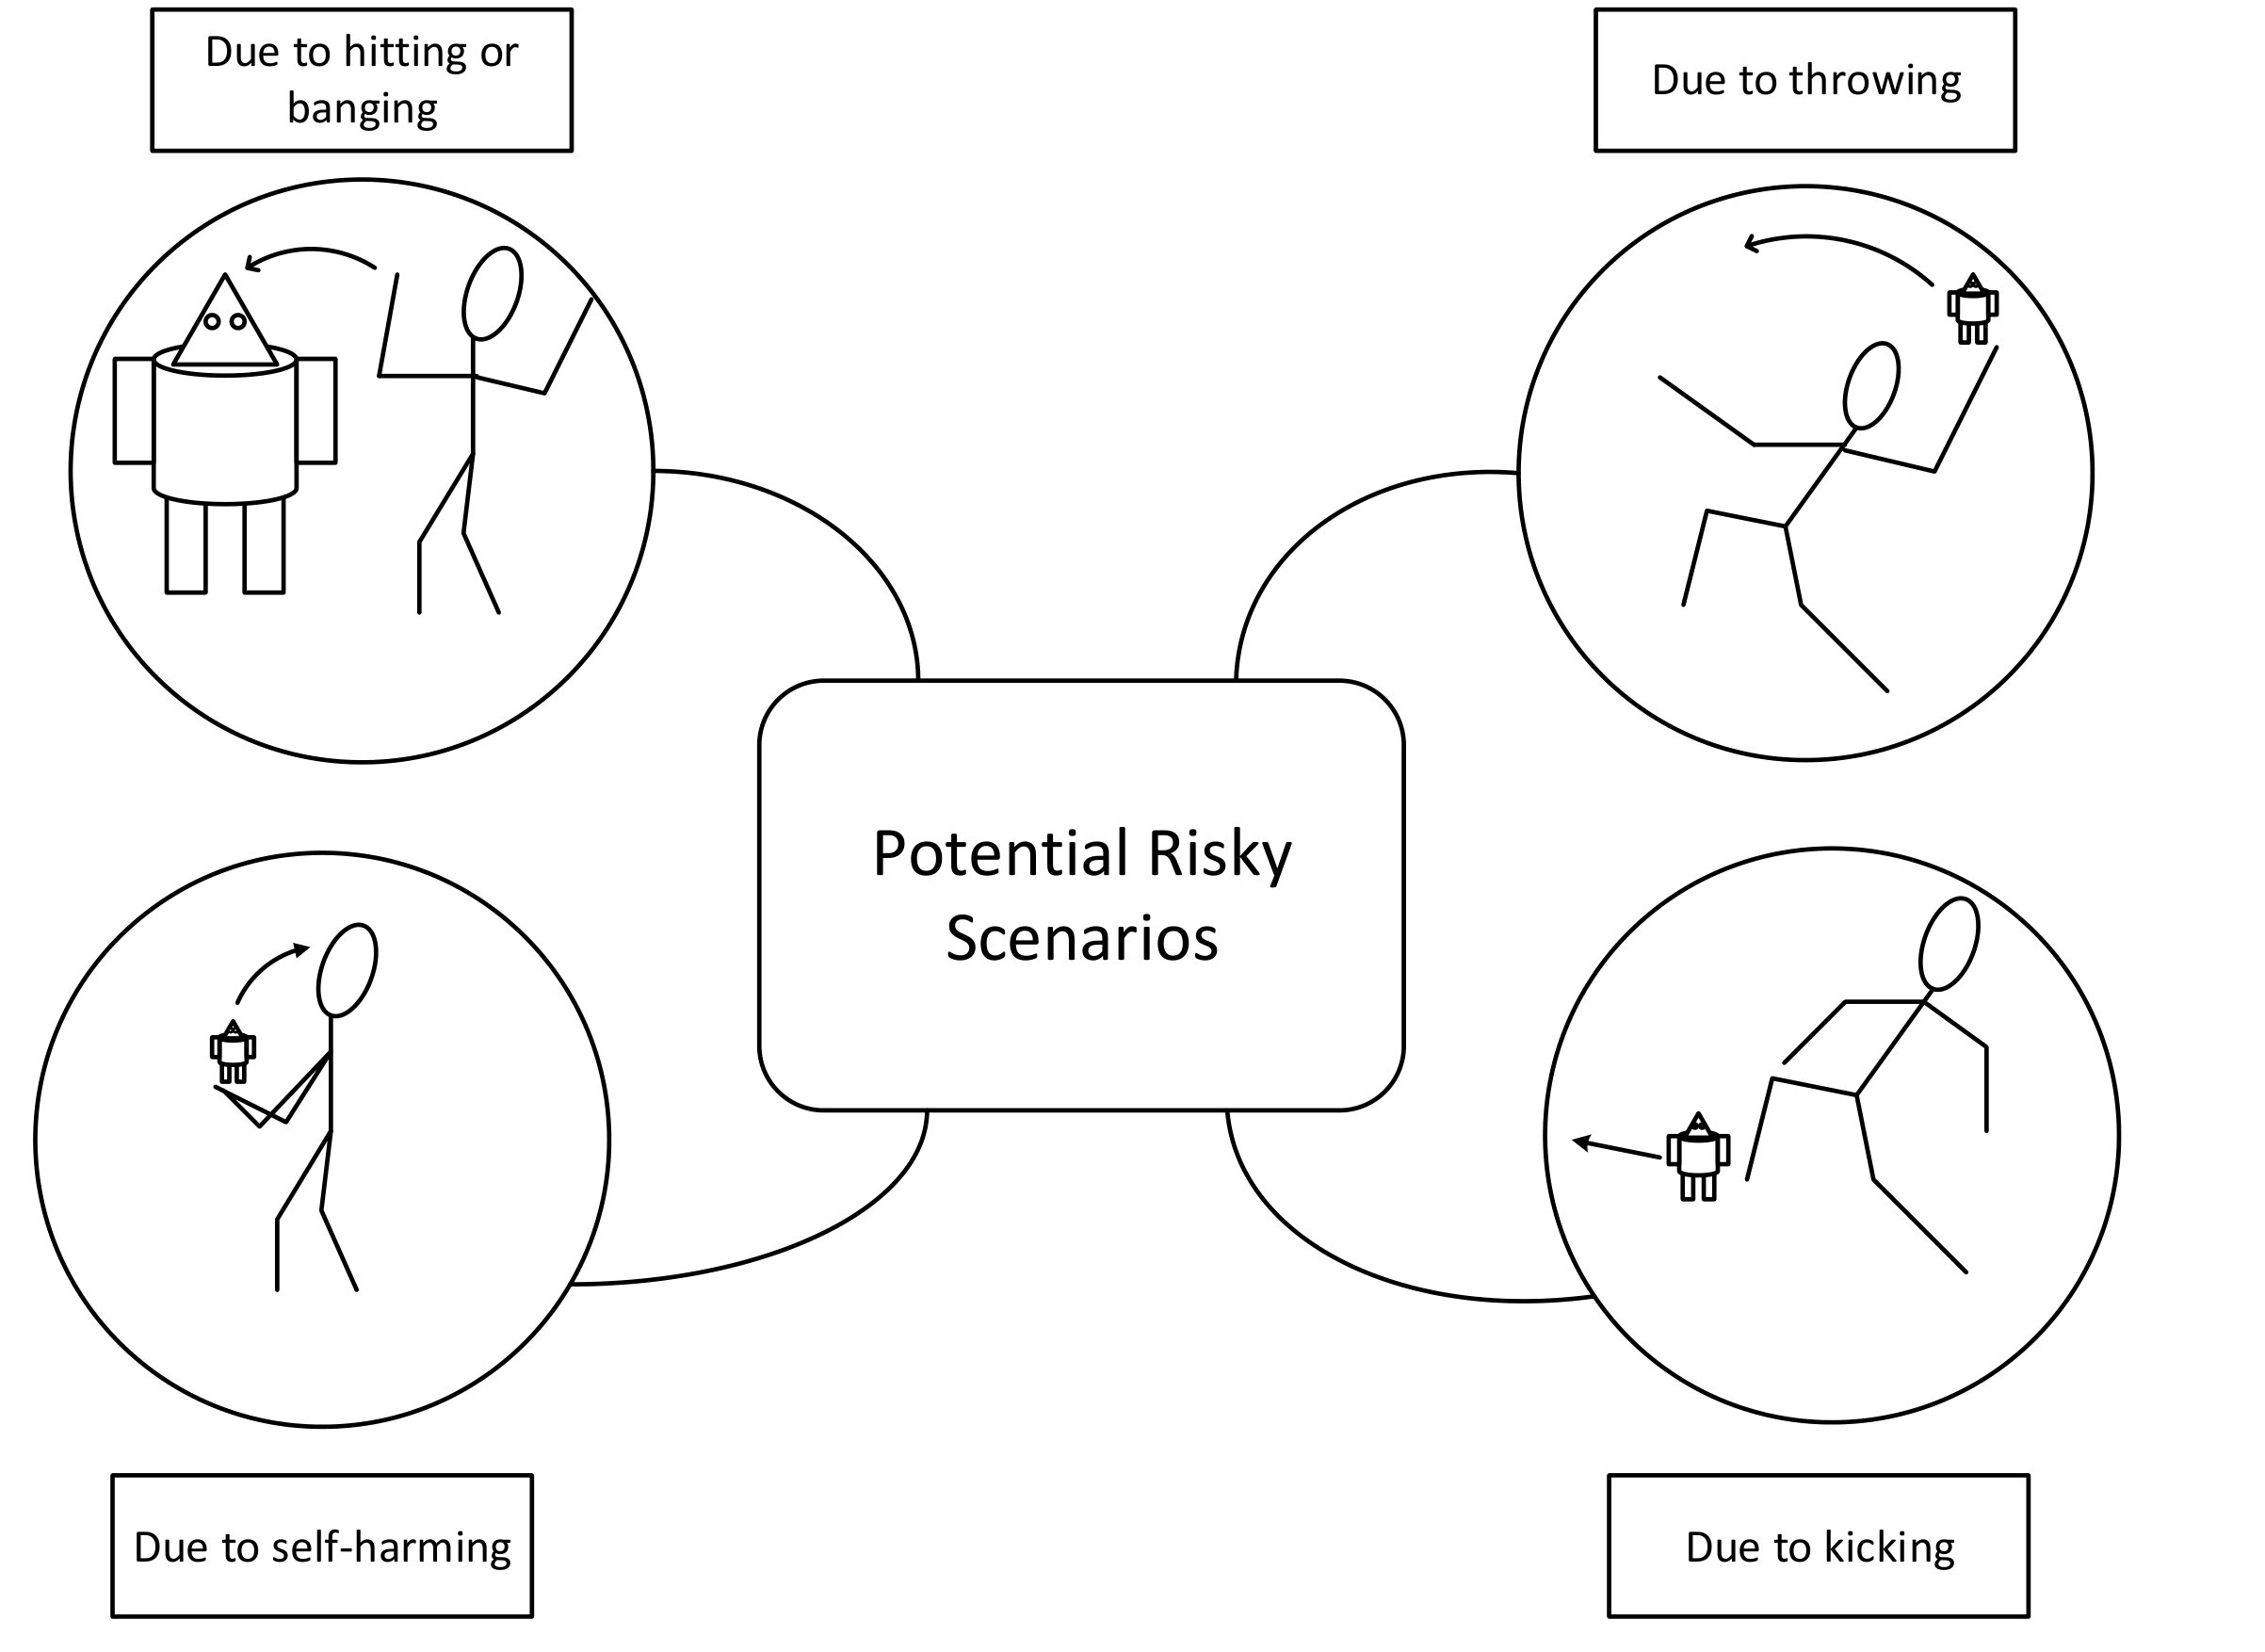 Figure 3
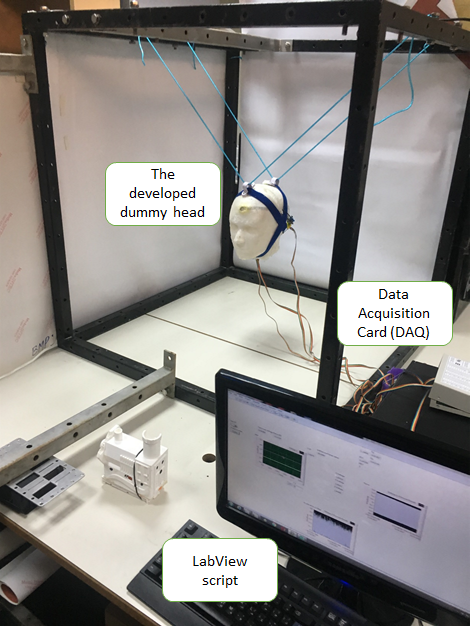 Figure 4
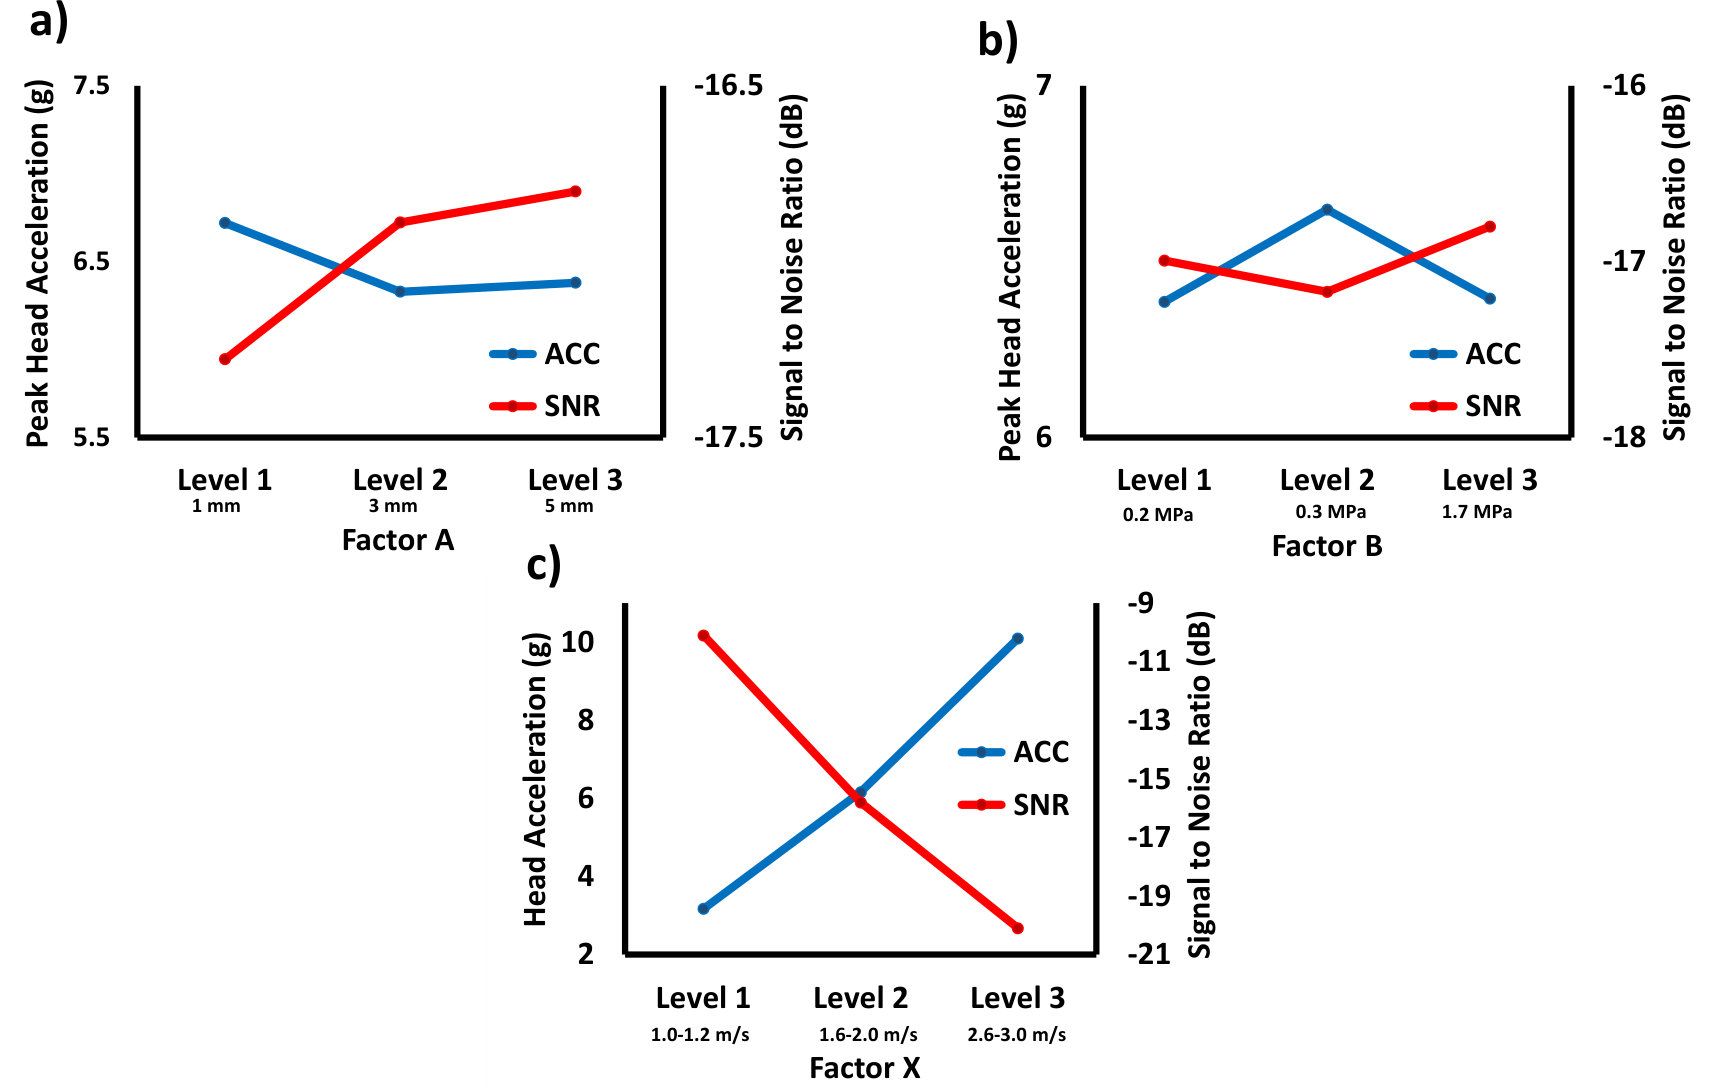 Figure 5
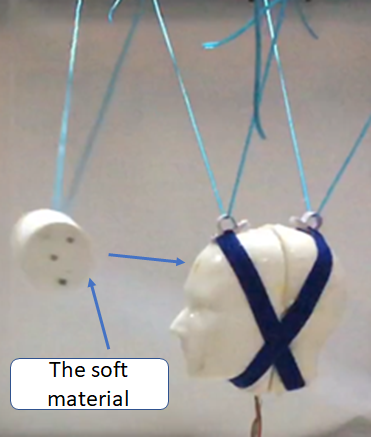 Figure 6
| Run | Control factors | |
|---|---|---|
| A | B | |
| 1 | 1 | 1 |
| 2 | 1 | 2 |
| 3 | 1 | 3 |
| 4 | 2 | 1 |
| 5 | 2 | 2 |
| 6 | 2 | 3 |
| 7 | 3 | 1 |
| 8 | 3 | 2 |
| 9 | 3 | 3 |
| Type | Parameter | Code | Level 1 | Level 2 | Level 3 |
|---|---|---|---|---|---|
| Control factor | Thickness (mm) | A | 1 | 3 | 5 |
| Control factor | Storage modulus (MPa) | B | 0.2 | 0.3 | 1.7 |
| Noise factor | Impact velocities (m/s) | X | Low | Medium | High |
| (1.0-1.2) | (1.6-2.0) | (2.6-3.0) | |||
| Response | Peak linear head | ||||
| acceleration (g) |
| Inner control | ||||||||
|---|---|---|---|---|---|---|---|---|
| Outer noise factor | ||||||||
| Average | ||||||||
| Standard | ||||||||
| Signal-to-noise | ||||||||
| ratio | ||||||||
| RUN | A | B | X1 | X2 | X3 | Mean | SD | S/N |
| 1 | 1 | 1 | 2.90 | 6.56 | 10.75 | 6.74 | 3.92 | -17.45 |
| 2 | 1 | 2 | 3.98 | 6.04 | 10.23 | 6.75 | 3.18 | -17.19 |
| 3 | 1 | 3 | 3.41 | 6.35 | 10.26 | 6.67 | 3.43 | -17.19 |
| 4 | 2 | 1 | 2.42 | 5.65 | 9.99 | 6.02 | 3.80 | -16.61 |
| 5 | 2 | 2 | 3.24 | 6.01 | 10.29 | 6.51 | 3.55 | -17.06 |
| 6 | 2 | 3 | 3.13 | 6.06 | 10.18 | 6.46 | 3.54 | -16.99 |
| 7 | 3 | 1 | 3.03 | 6.15 | 10.03 | 6.40 | 3.50 | -16.92 |
| 8 | 3 | 2 | 3.38 | 6.14 | 10.53 | 6.68 | 3.60 | -17.27 |
| 9 | 3 | 3 | 3.08 | 6.50 | 8.59 | 6.06 | 2.78 | -16.21 |
| A | B | X | |
|---|---|---|---|
| Level | Mean (SD) | Mean (SD) | Mean (SD) |
| 1 | 6.72 (0.04) | 6.39 (0.36) | 3.18 (0.42) |
| 2 | 6.33 (0.27) | 6.65 (0.12) | 6.16 (0.28) |
| 3 | 6.38 (0.31) | 6.40 (0.31) | 10.10 (0.61) |
| A | B | X | |
|---|---|---|---|
| Level | S/N | S/N | S/N |
| 1 | -17.28 | -16.99 | -10.10 |
| 2 | -16.89 | -17.17 | -15.80 |
| 3 | -16.8 | -16.80 | -20.09 |
| Source | df | Sum of squares | Mean square | F-Value | P-Value |
|---|---|---|---|---|---|
| Factor | 2 | 0.81 | 0.41 | 0.04 | 0.96 |
| Error | 24 | 220.854 | 9.20 | ||
| Total | 26 | 221.67 |
| Source | df | Sum of squares | Mean square | F-Value | P-Value |
|---|---|---|---|---|---|
| Factor | 2 | 0.39 | 0.20 | 0.02 | 0.98 |
| Error | 24 | 221.27 | 9.22 | ||
| Total | 26 | 221.67 |
| Source | df | Sum of squares | Mean square | F-Value | P-Value |
|---|---|---|---|---|---|
| Factor | 2 | 216.63 | 108.31 | 515.63 | 0.00 |
| Error | 24 | 5.04 | 0.21 | ||
| Total | 26 | 221.67 |
| Combination | X1 | X2 | X3 |
|---|---|---|---|
| A2-B1 | 2.17 | 5.11 | 10.18 |
| 3.17 | 6.74 | 9.45 | |
| 2.68 | 5.60 | 9.69 | |
| Mean (SD) | 2.67 (0.50) | 5.81 (0.83) | 9.78 (0.37) |
| A2-B3 | 2.12 | 5.04 | 9.18 |
| 3.43 | 6.59 | 10.60 | |
| 3.37 | 5.06 | 10.25 | |
| Mean (SD) | 2.97 (0.74) | 5.56 (0.89) | 10.01 (0.74) |
| A3-B1 | 3.06 | 6.27 | 10.25 |
| 2.27 | 6.13 | 9.71 | |
| 2.87 | 6.27 | 9.82 | |
| Mean (SD) | 2.74 (0.41) | 6.22 (0.08) | 9.93 (0.28) |
| A3-B3 | 3.34 | 7.08 | 8.54 |
| 2.99 | 6.38 | 8.76 | |
| 3.32 | 6.4 | 8.60 | |
| Mean (SD) | 3.22 (0.20) | 6.62 (0.40) | 8.63 (0.11) |
Peer Reviews
No public reviews on file for this paper yet. If you reviewed it on a platform where reviews are public (OpenReview, ICLR, NeurIPS, ICML), you can paste yours below so the community can read it here.
Videos
No videos yet. Explain this paper in a talk, walkthrough, or lecture? Add one.
Taxonomy
TopicsAutomotive and Human Injury Biomechanics · Agriculture and Farm Safety · Traumatic Brain Injury Research
Safety experiments for small robots investigating the potential of soft materials in mitigating the harm to the head due to impacts
Ahmad Yaser Alhaddad
Department of Mechanical and Industrial Engineering
Qatar University, Doha 2713, Qatar
Department of Electronics, Information and Bioengineering
Politecnico di Milano, Milano 20133, Italy
\AndJohn-John Cabibihan
Department of Mechanical and Industrial Engineering
Qatar University, Doha, Qatar
\AndAhmad Hayek
Department of Mechanical and Industrial Engineering
Qatar University, Doha, Qatar
\AndAndrea Bonarini
Department of Electronics, Information and Bioengineering
Politecnico di Milano, Milano 20133, Italy PLEASE CITE THIS ARTICLE IN PRESS AS: Ahmad Yaser Alhaddad, John-John Cabibihan, Ahmad Hayek, Andrea Bonarini, "Safety experiments for small robots investigating the potential of soft materials in mitigating the harm to the head due to impacts," SN applied Sciences, Springer Nature, 2019, 1: 476, doi 10.1007/s42452-019-0467-7
Abstract
There is a growing interest in social robots to be considered in the therapy of children with autism due to their effectiveness in improving the outcomes. However, children on the spectrum exhibit challenging behaviors that need to be considered when designing robots for them. A child could involuntarily throw a small social robot during meltdown and that could hit another person’s head and cause harm (e.g. concussion). In this paper, the application of soft materials is investigated for its potential in attenuating head’s linear acceleration upon impact. The thickness and storage modulus of three different soft materials were considered as the control factors while the noise factor was the impact velocity. The design of experiments was based on Taguchi method. A total of 27 experiments were conducted on a developed dummy head setup that reports the linear acceleration of the head. ANOVA tests were performed to analyze the data. The findings showed that the control factors are not statistically significant in attenuating the response. The optimal values of the control factors were identified using the signal-to-noise (S/N) ratio optimization technique. Confirmation runs at the optimal parameters (i.e. thickness of 3 mm and 5 mm) showed a better response as compared to other conditions. Designers of social robots should consider the application of soft materials to their designs as it help in reducing the potential harm to the head.
K****eywords Taguchi ANOVA Children with autism Safety Robots
1 Introduction
The interest in robots is increasing globally as estimated by the International Federation of Robotics (IFR) [1]. The application of robots is extending to new areas, such as that in healthcare. Most notably is the application of social robots in therapy sessions with children with autism, which has been reported to improve the overall outcomes [2]. However, such children exhibit a multitude of challenging behaviors that could raise some safety concerns when a robot is present in their vicinity [3]. The occurrence rates of challenging behaviors are high (e.g. 49% up to 69% [4][5][6]), and that have many consequences on the services and treatments provided to them [7].
The ability to convey emotions, exhibiting different personalities, employing communication cues, and forming social relationships are some of the traits that make social robots different from typical toys [8][9][10]. Introducing a new stimuli (e.g. a social robot) that is meant to elicit behaviors could provoke some unwanted behaviors among children with autism. For example, they might show some aggression toward the robots [11][12][13]. Kicking, throwing, hitting, and banging are some of the challenging behaviors that could potentially cause harm during the interactions with social robots (Fig. 1). For example, the throwing of a small social robot to the head could cause superficial injuries, subconcussion or even concussion in extreme cases [3]. The occurrence of such behaviors implies the need for safer robotic designs [11][14].
The establishment of safety standards in different fields of robotics is making a notably advances. However, the progress in establishing safety standards in relation to social robots and robotic toys is still lacking [15][16]. Some of the existing safety standards in toys can be readily imported to cover some fundamental design and safety aspects. For example, the ISO 8124 standard [17]. Safety aspects of the mechanical and physical properties of toys are covered in part one of this standard while part two and three covers flammability and migration of certain elements, respectively. More rigorous design considerations are needed that consider the unwanted behaviors exhibited by children with autism. For example, considering a scenario where the robotic toy is thrown to the head.
In this paper, we use Taguchi design of experiment (DOE) method to investigate a way to reduce the harm to the head by studying the influence of two control factors (i.e. soft material storage modulus and its thickness) and one noise factor (i.e. throwing velocity) of a small form factor toy on the resultant head’s acceleration. Furthermore, the optimal levels of the investigated control factors that help in reducing the response are identified. This paper is organized as follows. Section 2 describes the Taguchi method while Section 3 provides the materials and methods. Section 4 presents the results of the study. Section 5 provides discussion while Section 6 concludes the work.
2 Taguchi Method
2.1 Background
The understanding of a process is usually done through conducting a series of experiments that provide information about the processes, such as the most influential parameters, the optimal settings, and the overall performance [18]. To maximize the information obtained while minimizing the resources needed, design of experiment (DOE) approach is usually used to study processes. Taguchi’s method is one of the DOE techniques that was developed in 1979 to improve the quality of goods [19]. This technique has been considered in the optimization of different applications, such as strain measurements, wear studies, and turning parameters [20][21][22].
There are two types of process factors that are considered in Taguchi method. The first factor is controllable at the product design level and referred to as the control factor. The other factor is known as the noise factor that is uncontrollable during production and at product design level. However, noise factor can be simulated experimentally. Taguchi method aims to make products more robust by optimizing the control factors to reduce the sensitivity to noise factors. Furthermore, Taguchi method provides the quality loss function to measure losses in relation to product’s variation from the target performance. In Taguchi DOE, different Orthogonal Arrays (OAs) can be considered depending on the number of factors being investigated [23].
2.2 Experimental design
Taguchi design method has been considered in this study because it considers the noise variables and because it greatly reduces the number of experiments. Furthermore, the method provides a robust parameter design by finding the optimal values of the control variables to reduce the investigated problem sensitivity to noise variables [24]. The Orthogonal Arrays (OAs) of this method provides more information to understand the relationship between the control variables and the noise variables, which is essential for a robust design. Additionally, Taguchi method provides performance measures that are needed in this study to optimize the design, such as the signal-to-noise (S/N) ratio.
In this study, two control factors are investigated for their potential in reducing the linear acceleration of the head. Experiments are conducted based on an Taguchi OA (Table 1). A total of 27 (i.e. ) experiments have to be conducted that consider the three levels of the control and noise factors. The considered control factors can be adjusted at the product design level while the noise factor is dependent on the real life scenario (e.g. throwing). Finally, the selected factors are independent while the measured output (i.e. head’s acceleration) is dependent.
The levels of the two control factors (i.e. material thickness and storage modulus) and noise factor (i.e. impact velocity) have been defined (Table 2). To achieve consistency, the mass and the shape of the impactor were kept the same throughout the experiments. The mass of the impactor was kept at 0.4 kg, which is within the expected range of the targeted applications (i.e. small robotic toys). The shape of the impactor was cylindrical without any features on the surface. Finally, the impact velocities used were limited to low velocities to achieve more consistency in terms of the noise levels (i.e. less than 3 m/s) [25].
3 Materials and Methods
3.1 Experimental Setup
The experimental setup was based on a 3D printed dummy head situated with nylon coated wire ropes in a dedicated frame (Fig. 2). The head was embedded with an accelerometer that measures the linear acceleration of the head. The accelerometer sensor was interfaced to the computer through a data acquisition card. The experimental setup has been validated in giving comparable results to those of previous studies under similar testing conditions. More detailed description of the experimental setup can be viewed in our earlier studies [3][26][27].
3.2 Impactor
A 3D printed cylindrical object was used as an impactor in this study. The dimensions of the impactor were ( , height and diameter). A 3D printer (Replicator 5th Generation, MakerBot Industries, USA) was used to build the object. Clay was used to fill the impactor to reach 0.4 kg. The soft materials (Ecoflex OO-30 & Dragon skin FX- Pro, Smooth-On, USA) were prepared according to manufacturer’s instructions. The soft materials were prepared in molds of different thicknesses and then rectangular ( ) samples of each were attached to the impactor covering the area of impacts (Fig. 3).
3.3 Procedures
3.3.1 Dynamic Mechanical Analysis
The soft materials properties were studied using a dynamic mechanical analyzer (RSA-G2, TA instruments, USA ; Fig. 4). The dynamic mechanical analysis (DMA) is a common test to measure the properties (i.e. elastic and viscous) of a material. The properties were studied by applying a stress (e.g. sinusoidal) and measuring the resultant strain and the phase difference between the input and output. A frequency sweep tests were conducted to study the storage modulus. In these tests, the frequency was varied from 0.1 Hz to 100 Hz while the strain and temperature kept constant. The storage modulus readings for each material were generated (Fig. 5). The values of storage modulus at 1 Hz for each material were considered in the analysis. This frequency is believed to be at which the high rate of challenging behaviors might occur [28].
3.3.2 Impact Experiments
A total of 27 main experiments (i.e. 9 experiments at each noise level) were conducted (See supplementary material and data [29][30]).The experiments covered different combinations of the control factors according to the orthogonal array (OA) (Table 1). To achieve consistent impact velocities (i.e. noise levels), the impactor was tied to the frame allowing it to swing freely (Fig. 3). By altering the drop height, three different impact velocities levels were generated in the range of 1 - 3 m/s (Table 2). As for the confirmation runs, a total of 24 runs at each noise level were conducted after identifying the optimal control factors levels from the main experiments.
A video camera (FDR-X1000V, Sony, Japan) was used to record all the experiments in slow-motion mode (240 fps, 720 pixels). An open-source video analysis software (Tracker version 4.10.0, Douglas Brown, Open Source Physics) was used to analyze the videos for impact velocities. A script based on LabView (2014, National Instrument, USA) was used to acquire and then save the raw data. A Matlab (Version 2015, MathWorks, Massachusetts, USA) script was used to post-process the data for the peak acceleration values.
3.4 Peak Linear Head Acceleration
The peak linear acceleration of the head during impacts has been used as one of the biomechanical measures to investigate concussive events [31][32]. In a study on young football players (age 7 - 8 years) [33], the reported peak linear accelerations during impacts could fall anywhere in the range from 10 g to 111 g, and that is believed to be the range at which concussions could potentially occur based on the football-related incidents [34]. Furthermore, concussion could occur at a low peak linear acceleration of 31.8 g as reported by another study [35]. Another study analyzed 62,974 head acceleration data points and identified subconcussive impacts with an average head acceleration of 26 20 g with a median of 19 g while the average head acceleration for concussive impacts was 105 27 g with a median of 103 g [36].
Laboratory settings using dummies are commonly used to evaluate the potential harm to a human by simulating a certain scenario, such as that used to evaluate harm levels due to impact in industrial robots [37]. Similar setups have been adopted in other fields to quantify harm due to impacts, such as that in sports to evaluate potential harm and the efficacy of protective gears [38][39][40]. Similarly, a laboratory setup generating the peak linear head acceleration severity index will be used in this study as an indicator to understand the effects on the head linear acceleration due to altering some of the parameters of the impacting objects.
3.5 Data Analysis
Two main analyses were conducted on the generated results. The first analysis was a one-way analysis of variance (ANOVA). This test was conducted on the average responses of the peak head acceleration at each level of each factor to understand the contribution of each factor on the resultant response. The level for statistical significance was set to p 0.05.
The second analysis was based on the signal-to-noise (S/N) ratio and it was used for optimization. The goal of this analysis is to minimize the response variable, hence, the smaller-the-better case was considered and the corresponding S/N ratio was used; it is defined as follows [24]:
[TABLE]
where E is the expected value and is the response. All analyses were performed using Minitab (v17.0, Minitab Inc., USA).
4 Results
4.1 Orthogonal array
A total of 27 responses of the peak linear head acceleration were recorded and the corresponding average value, standard deviation, and S/N ratio for each combination were calculated to complete the Taguchi orthogonal array (Table 4.1). The obtained linear acceleration values were in the range from 2.42 to 10.75 g due to different levels of control and noise factors. The lowest linear acceleration value obtained corresponds to a thickness of 3 mm, Ecoflex, and Level 1 impact velocity (i.e. A2-B1-X1) while the highest linear acceleration value corresponds to a thickness of 1 mm, Ecoflex, and Level 3 impact velocity (i.e. A1-B1-X3). The average response and the S/N ratio due to varying the level of each factor were tabulated (Table 4 and Table 5). The lowest average linear head acceleration was 3.18 g with S/N ratio of -10.10 occurred at Level 1 impact velocity while the highest average linear head acceleration was 10.10 g with S/N ratio of -20.09 due to Level 3 impact velocity.
The reference list from the paper itself. Each links out to its DOI / PubMed record.
- 1[1] International Federation of Robotics. IFR Press Releases, 2016. (Date last accessed 28-Jan-2019).
- 2[2] John-John Cabibihan, Hifza Javed, Marcelo Ang Jr, and Sharifah Mariam Aljunied. Why robots? A survey on the roles and benefits of social robots in the therapy of children with autism. International Journal of Social Robotics , 5(4):593–618, 2013.
- 3[3] Ahmad Yaser Alhaddad, John-John Cabibihan, and Andrea Bonarini. Head impact severity measures for small social robots thrown during meltdown in autism. International Journal of Social Robotics , nov 2018.
- 4[4] A Baghdadli, C Pascal, S Grisi, and C Aussilloux. Risk factors for self-injurious behaviours among 222 young children with autistic disorders. Journal of Intellectual Disability Research , 47(8):622–627, 2003.
- 5[5] James W Bodfish, Frank J Symons, Dawn E Parker, and Mark H Lewis. Varieties of repetitive behavior in autism: Comparisons to mental retardation. Journal of Autism and Developmental Disorders , 30(3):237–243, 2000.
- 6[6] Stephen M Kanne and Micah O Mazurek. Aggression in children and adolescents with asd: Prevalence and risk factors. Journal of Autism and Developmental Disorders , 41(7):926–937, 2011.
- 7[7] Tiffany L Hutchins and Patricia A Prelock. Using communication to reduce challenging behaviors in individuals with autism spectrum disorders and intellectual disability. Child and Adolescent Psychiatric Clinics , 23(1):41–55, 2014.
- 8[8] W-C So, MK-Y Wong, J-J Cabibihan, CK-Y Lam, RY-Y Chan, and H-H Qian. Using robot animation to promote gestural skills in children with autism spectrum disorders. Journal of Computer Assisted Learning , 32(6):632–646, 2016.