The role of deformability in determining the structural and mechanical properties of bubbles and emulsions
Arman Boromand, Alexandra Signoriello, Janna Lowensohn, Carlos S., Orellana, Eric R. Weeks, Fangfu Ye, Mark D. Shattuck, and Corey S. O'Hern

TL;DR
This study compares the structural and mechanical properties of jammed particle packings using soft particle and deformable particle models, revealing how deformability influences jamming behavior and void space in emulsions and foams.
Contribution
It introduces a deformable particle model for compressed bubbles and emulsions and compares its predictions with the soft particle model, highlighting differences in jamming and void structure.
Findings
Both models show $ ho$-scaling of contact number and shear modulus near jamming.
Deformability affects void space and Plateau border formation.
Results align with experimental data on foams and emulsions.
Abstract
We perform computational studies of jammed particle packings in two dimensions undergoing isotropic compression using the well-characterized soft particle (SP) model and the deformable particle (DP) model that we developed for compressed bubbles and emulsions. In the SP model, circular particles are allowed to overlap, generating purely repulsive forces. In the DP model, particles minimize their perimeter, while deforming at fixed area to avoid overlap during compression. We directly compare the structural and mechanical properties of jammed particle packings generated using the SP and DP models as a function of the true packing fraction , instead of the reduced number density . We show that near jamming onset the excess contact number and shear modulus scale as in the large system limit for both the SP and DP models, where…
Click any figure to enlarge with its caption.
 Figure 1
 Figure 2
 Figure 3
 Figure 5
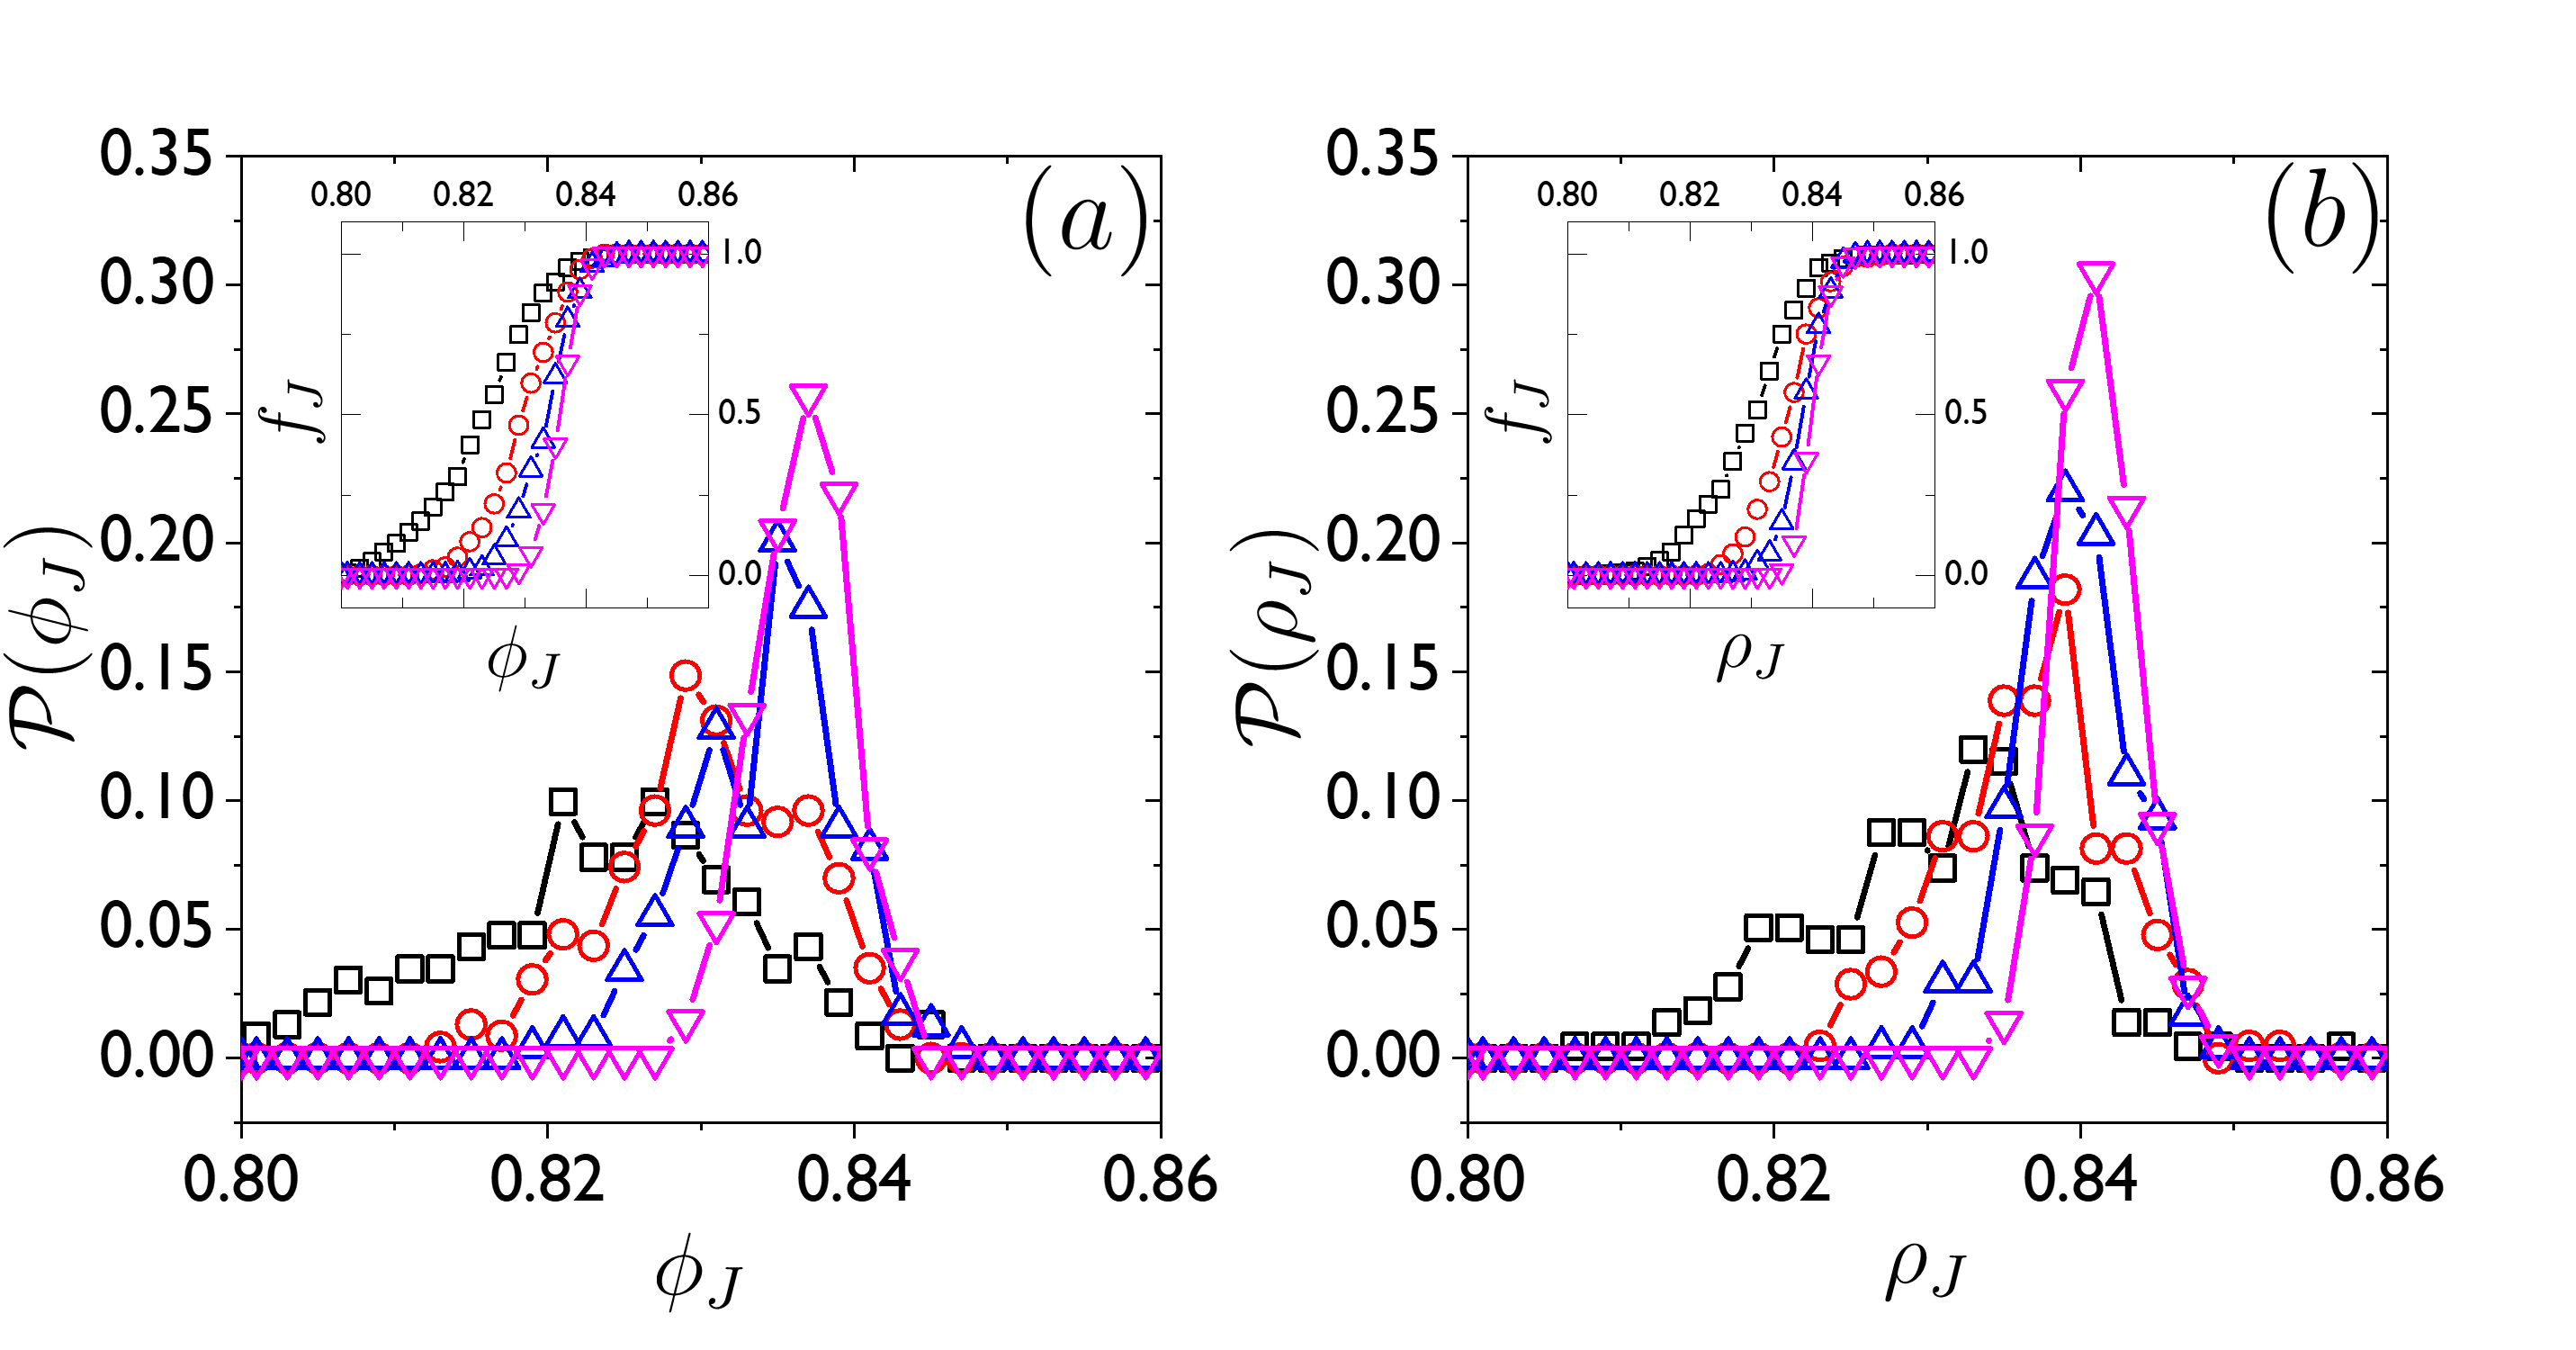 Figure 6
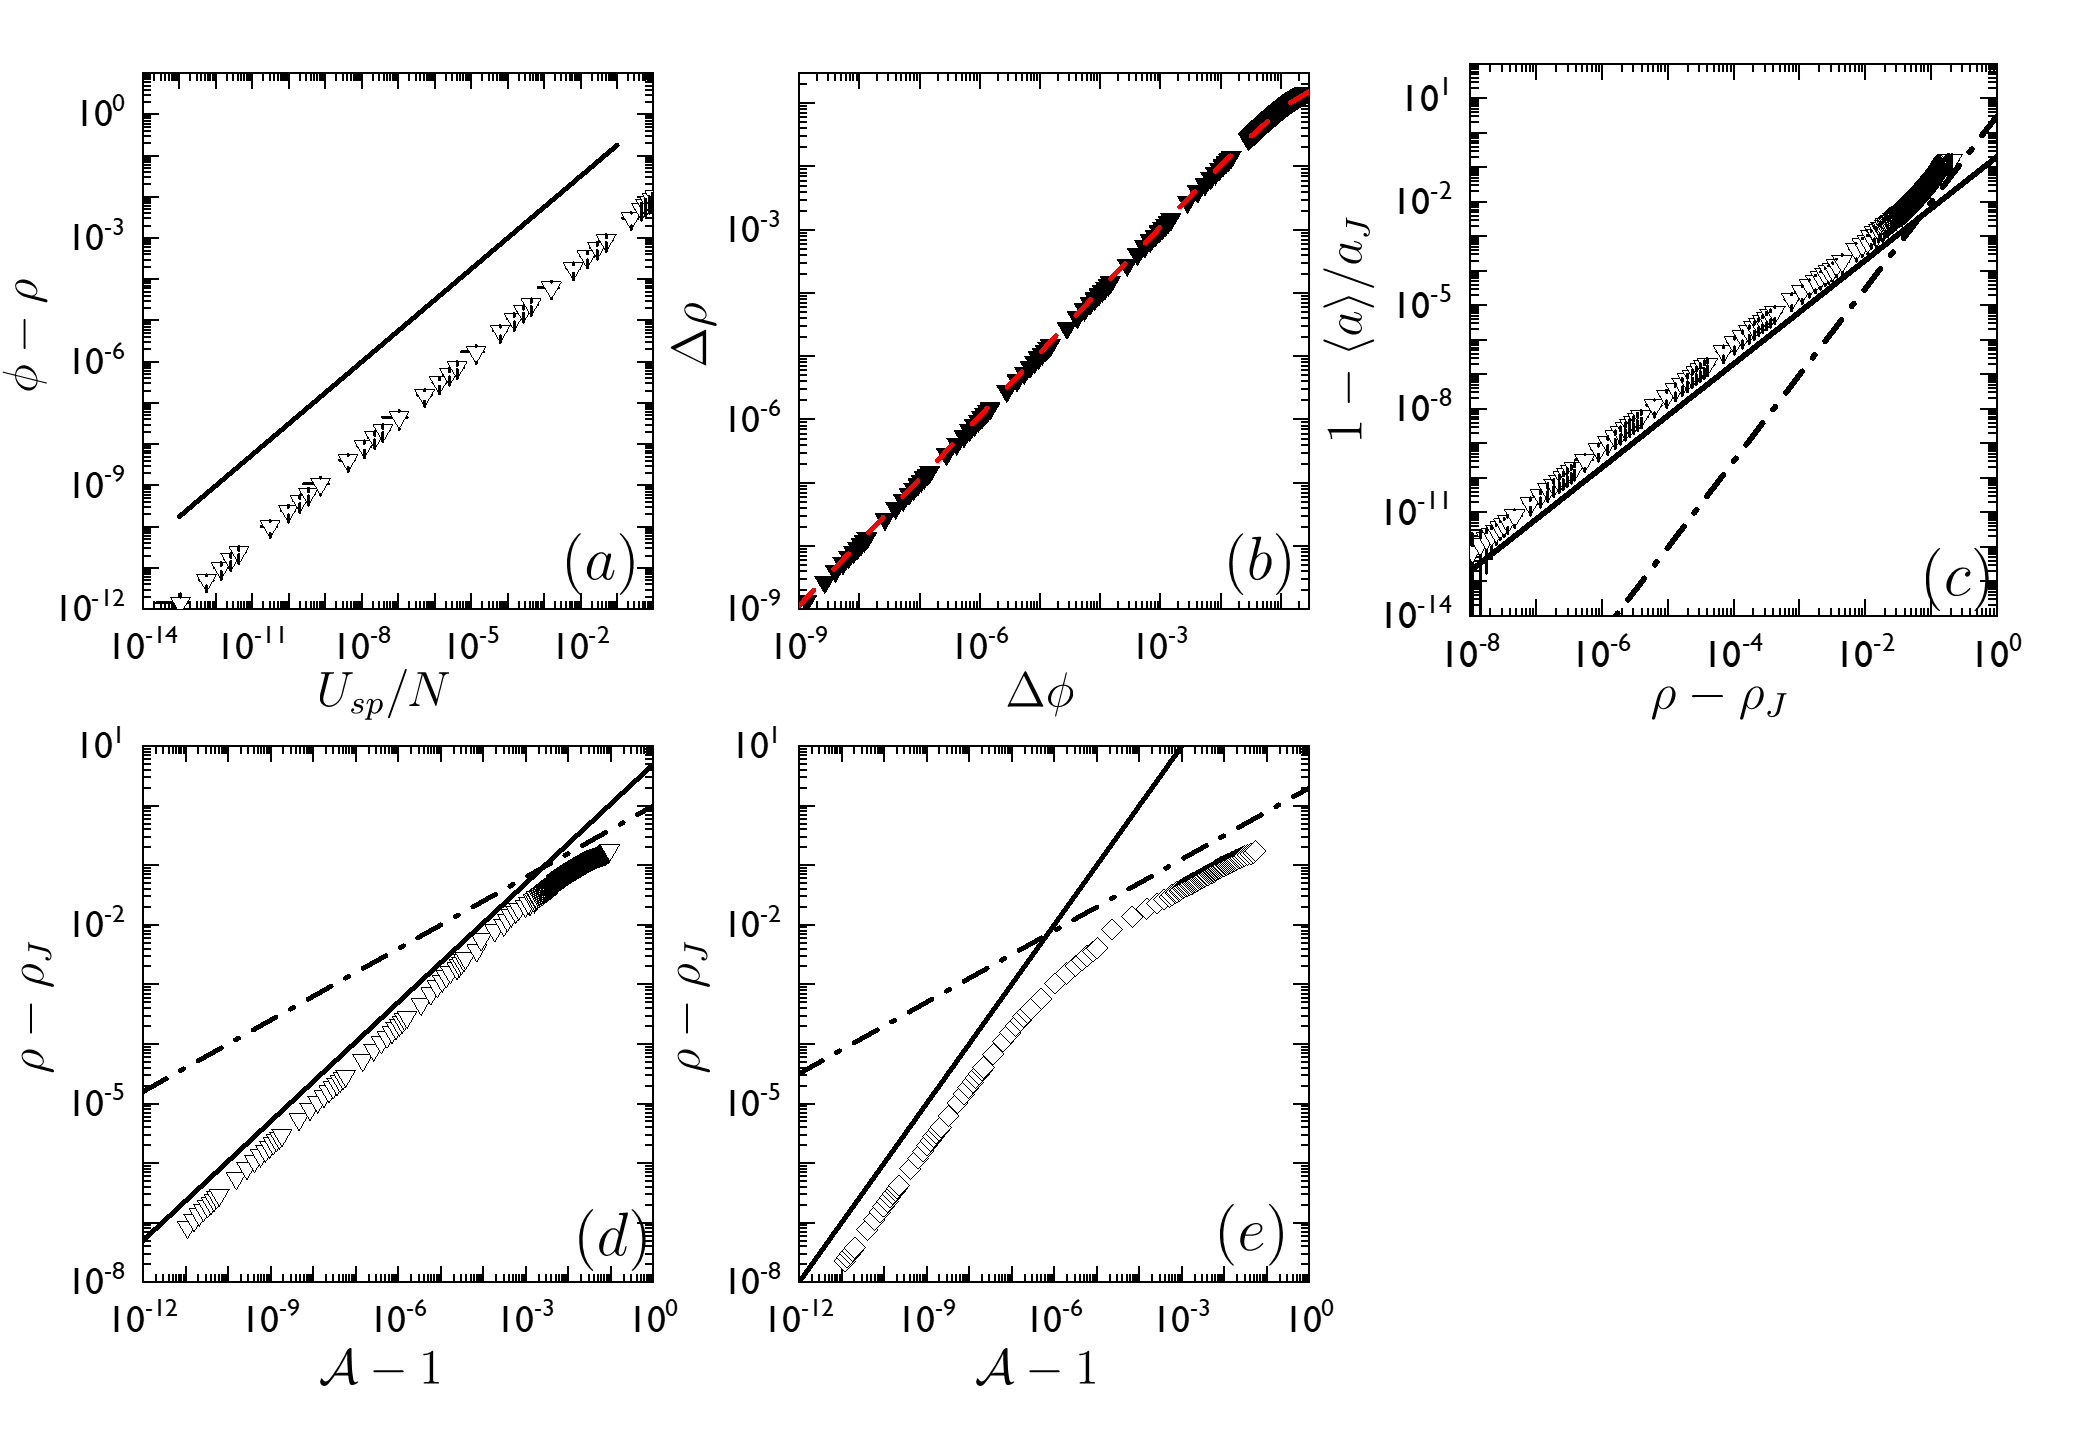 Figure 7
 Figure 8
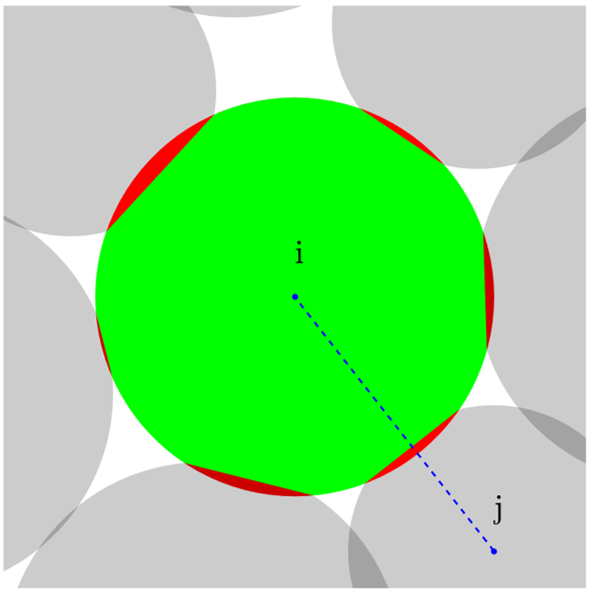 Figure 1
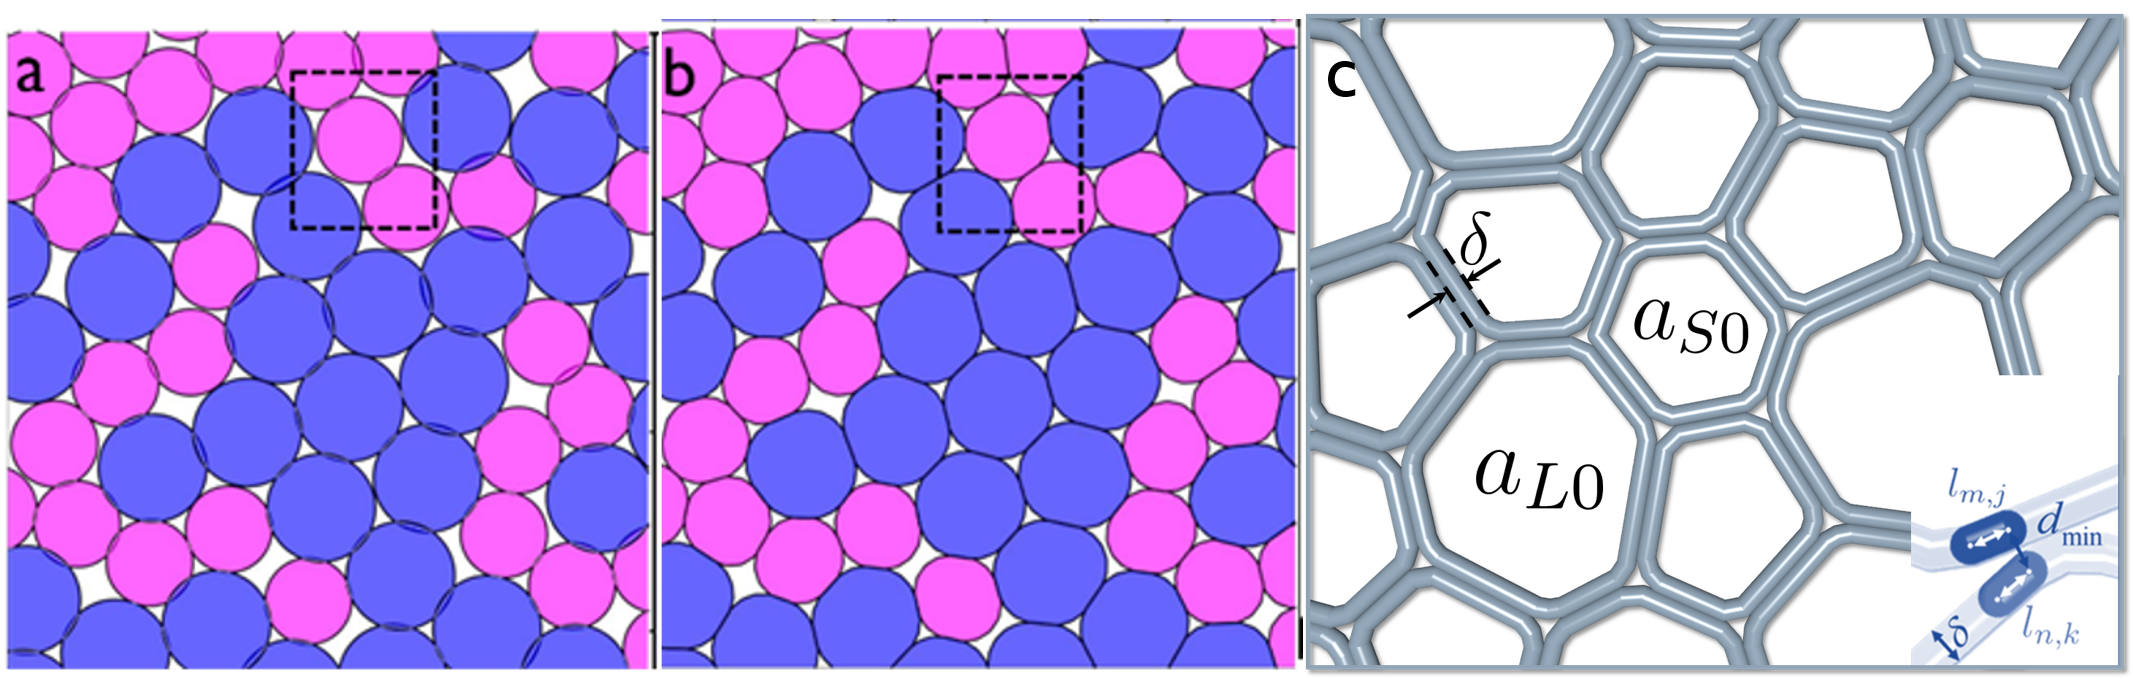 Figure 2
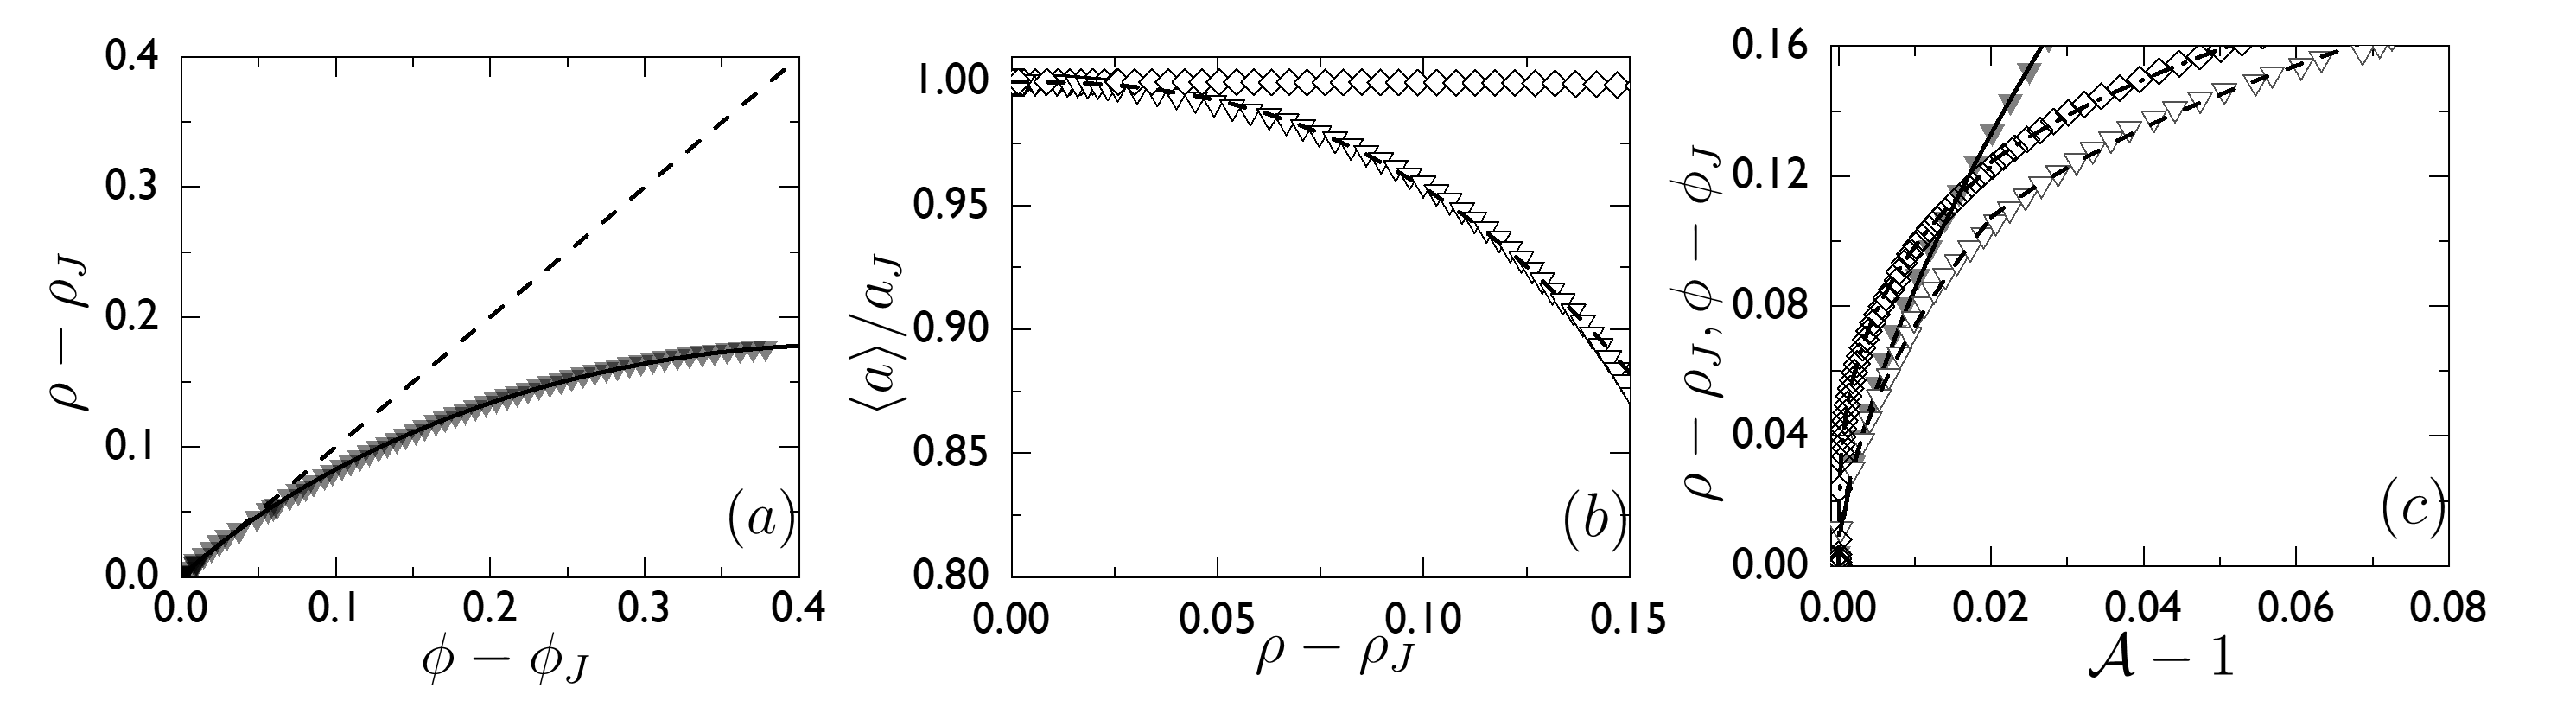 Figure 3
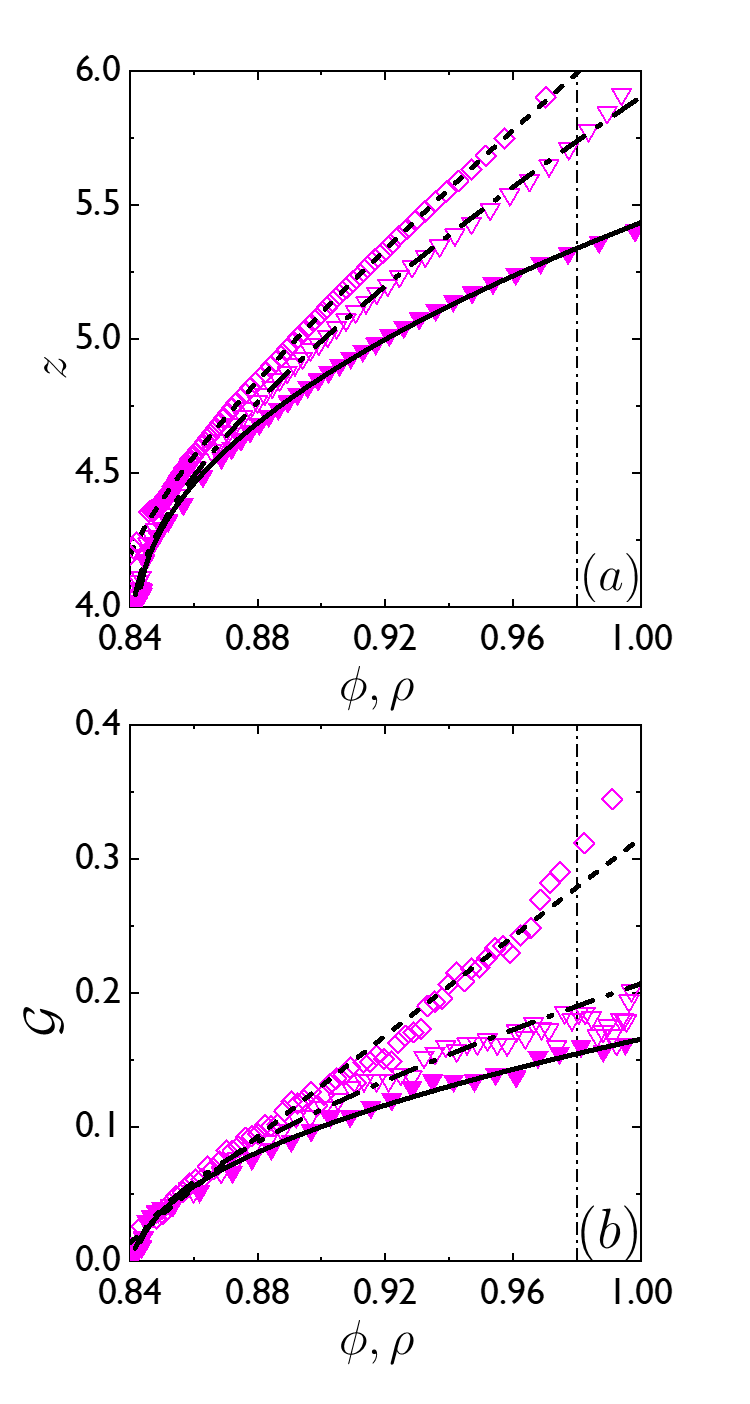 Figure 4
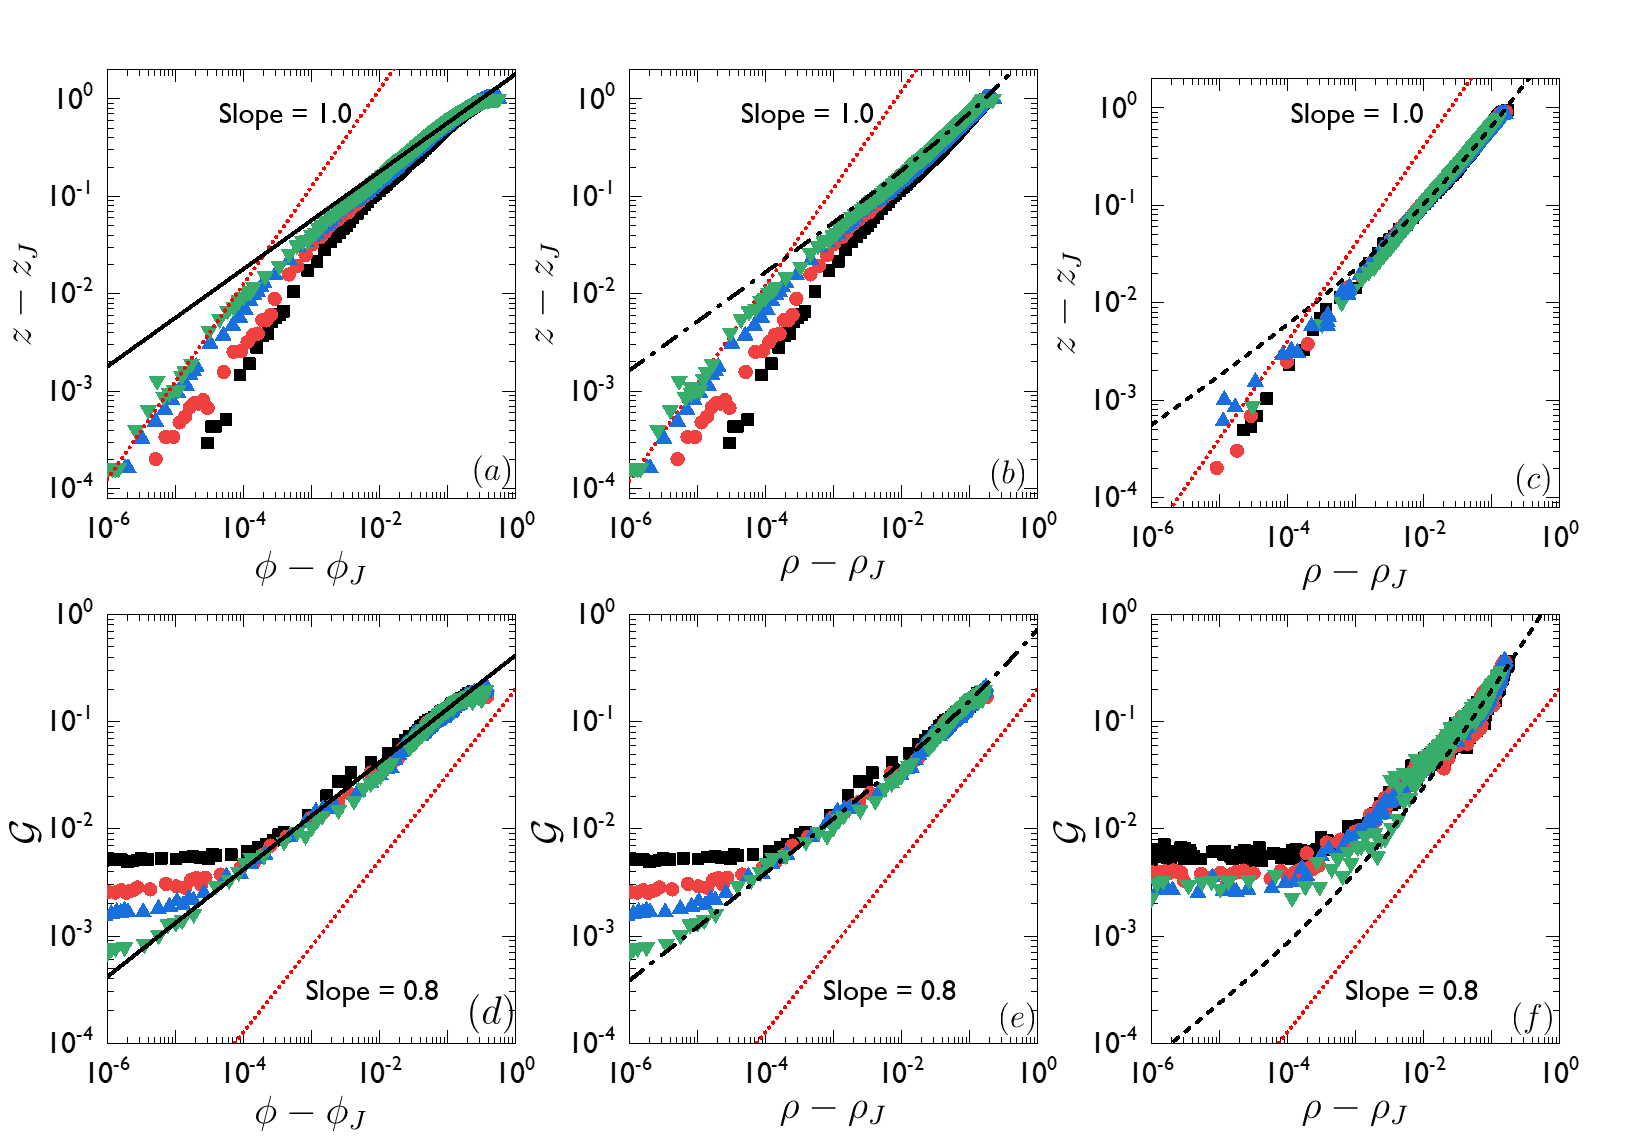 Figure 5
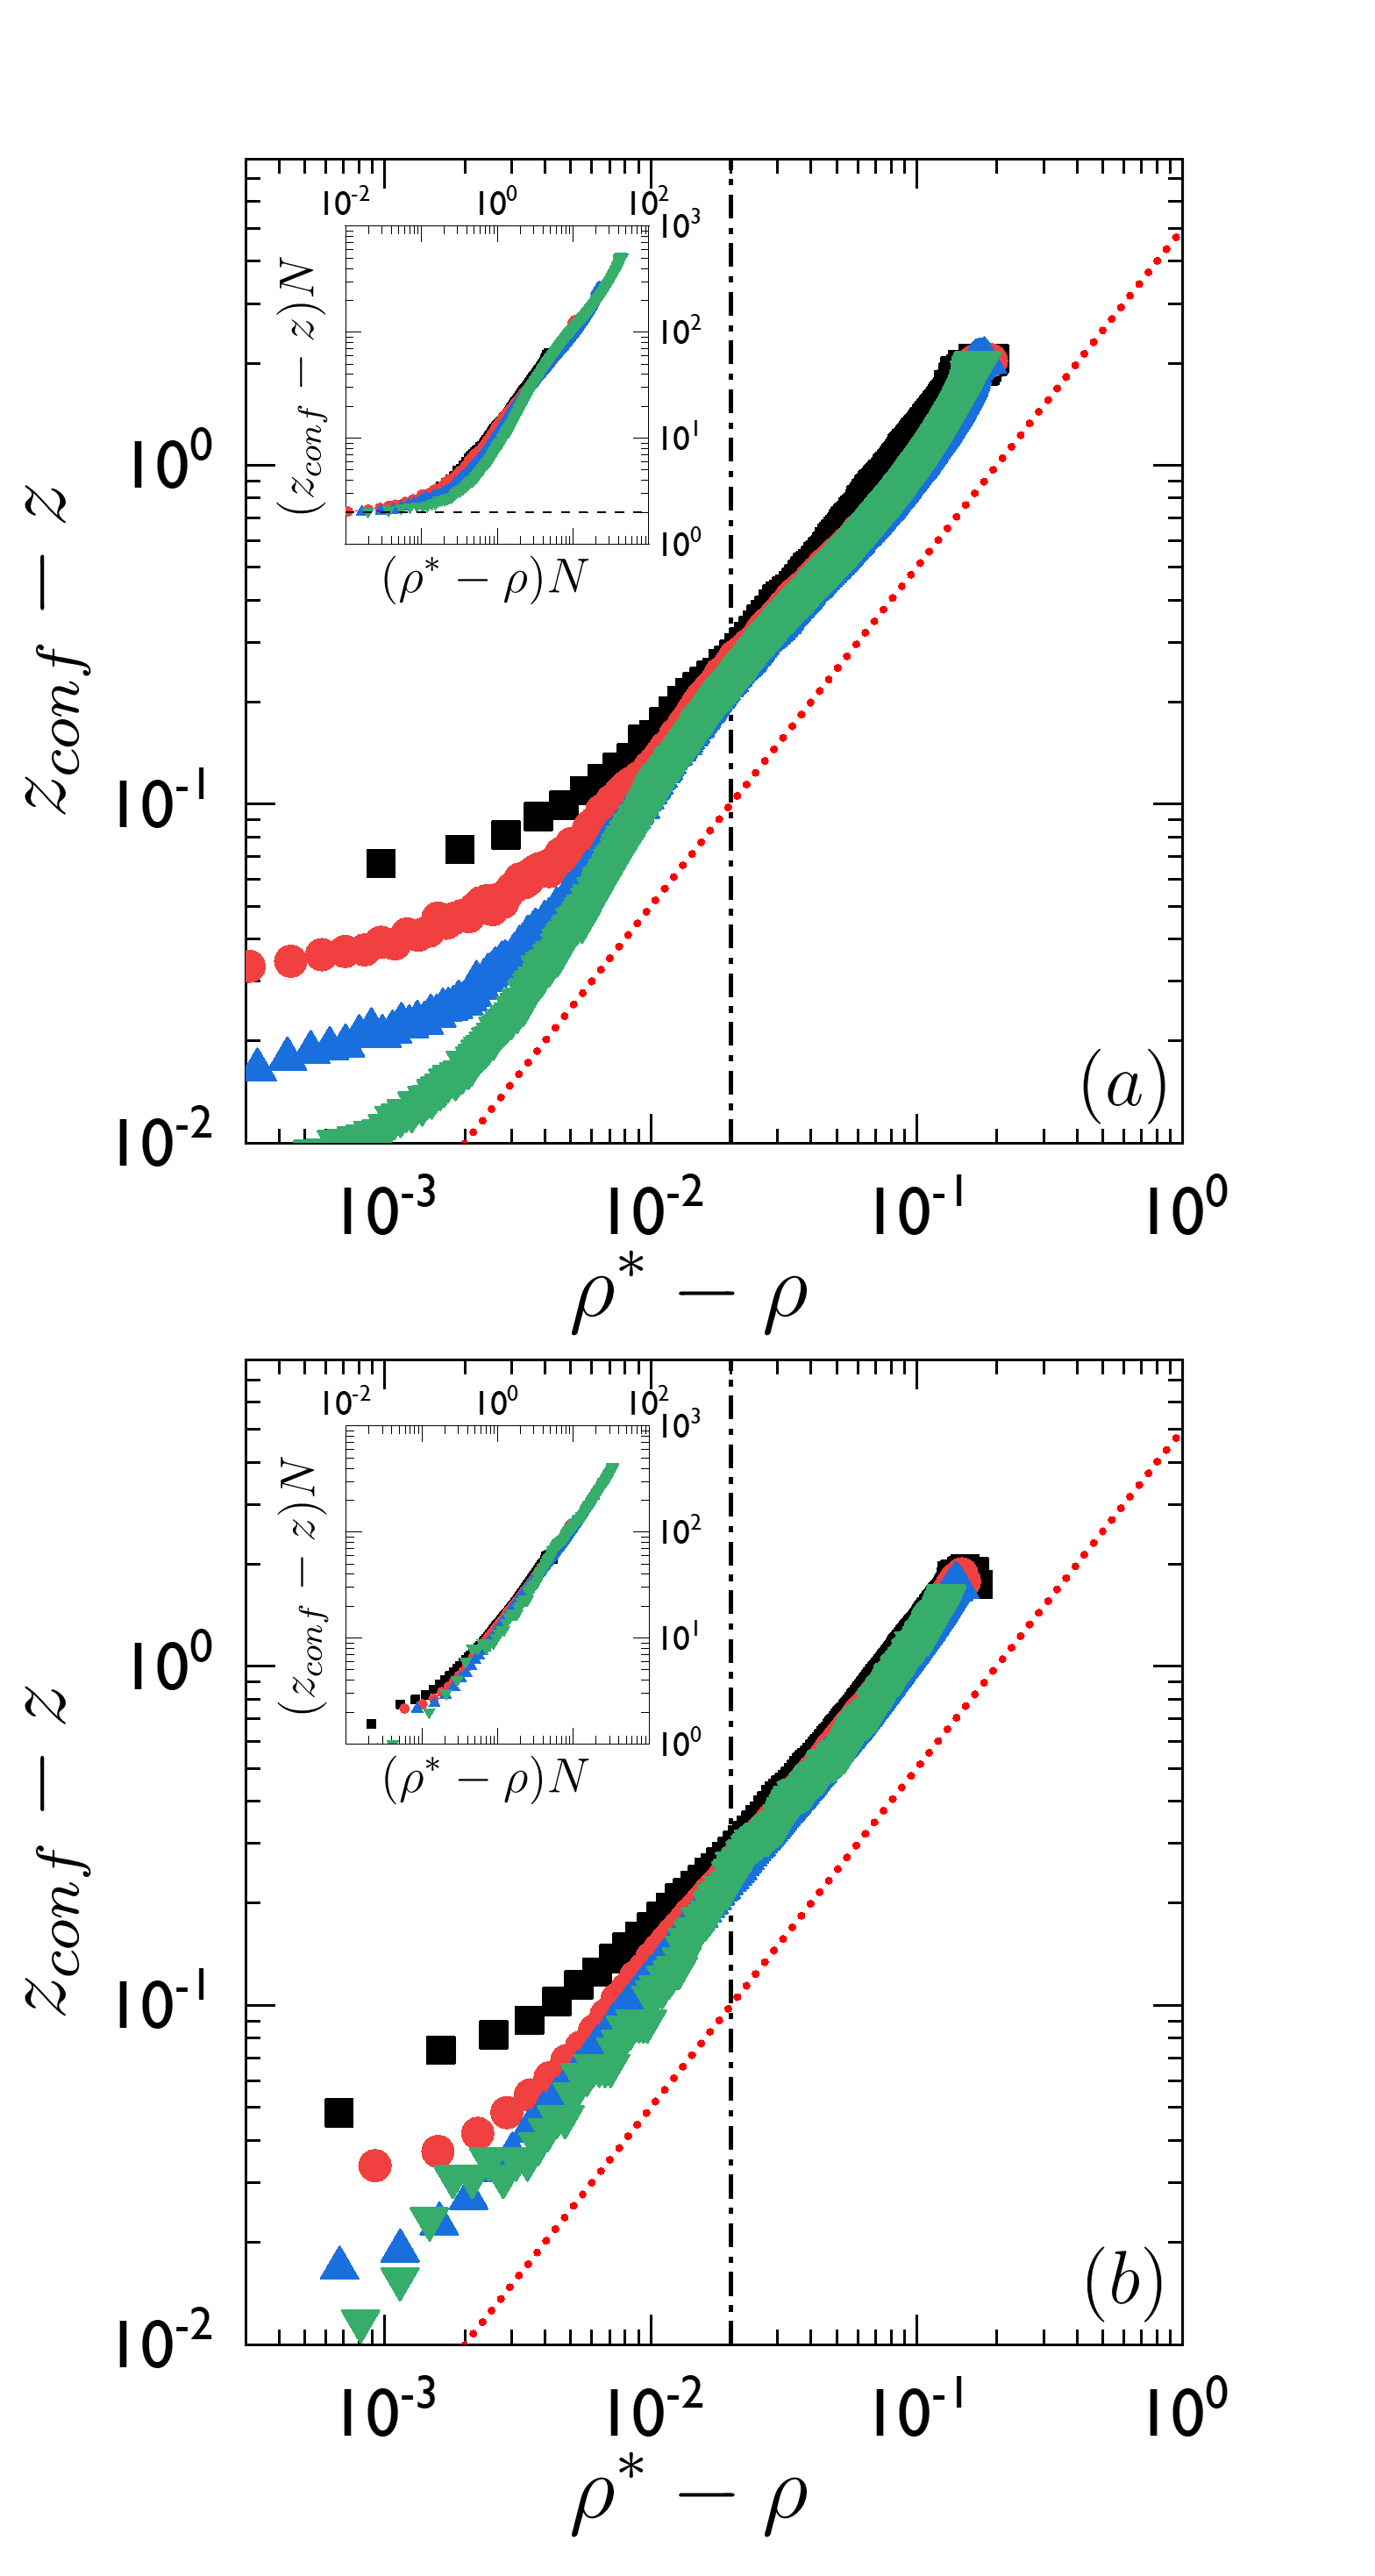 Figure 6
 Figure 7
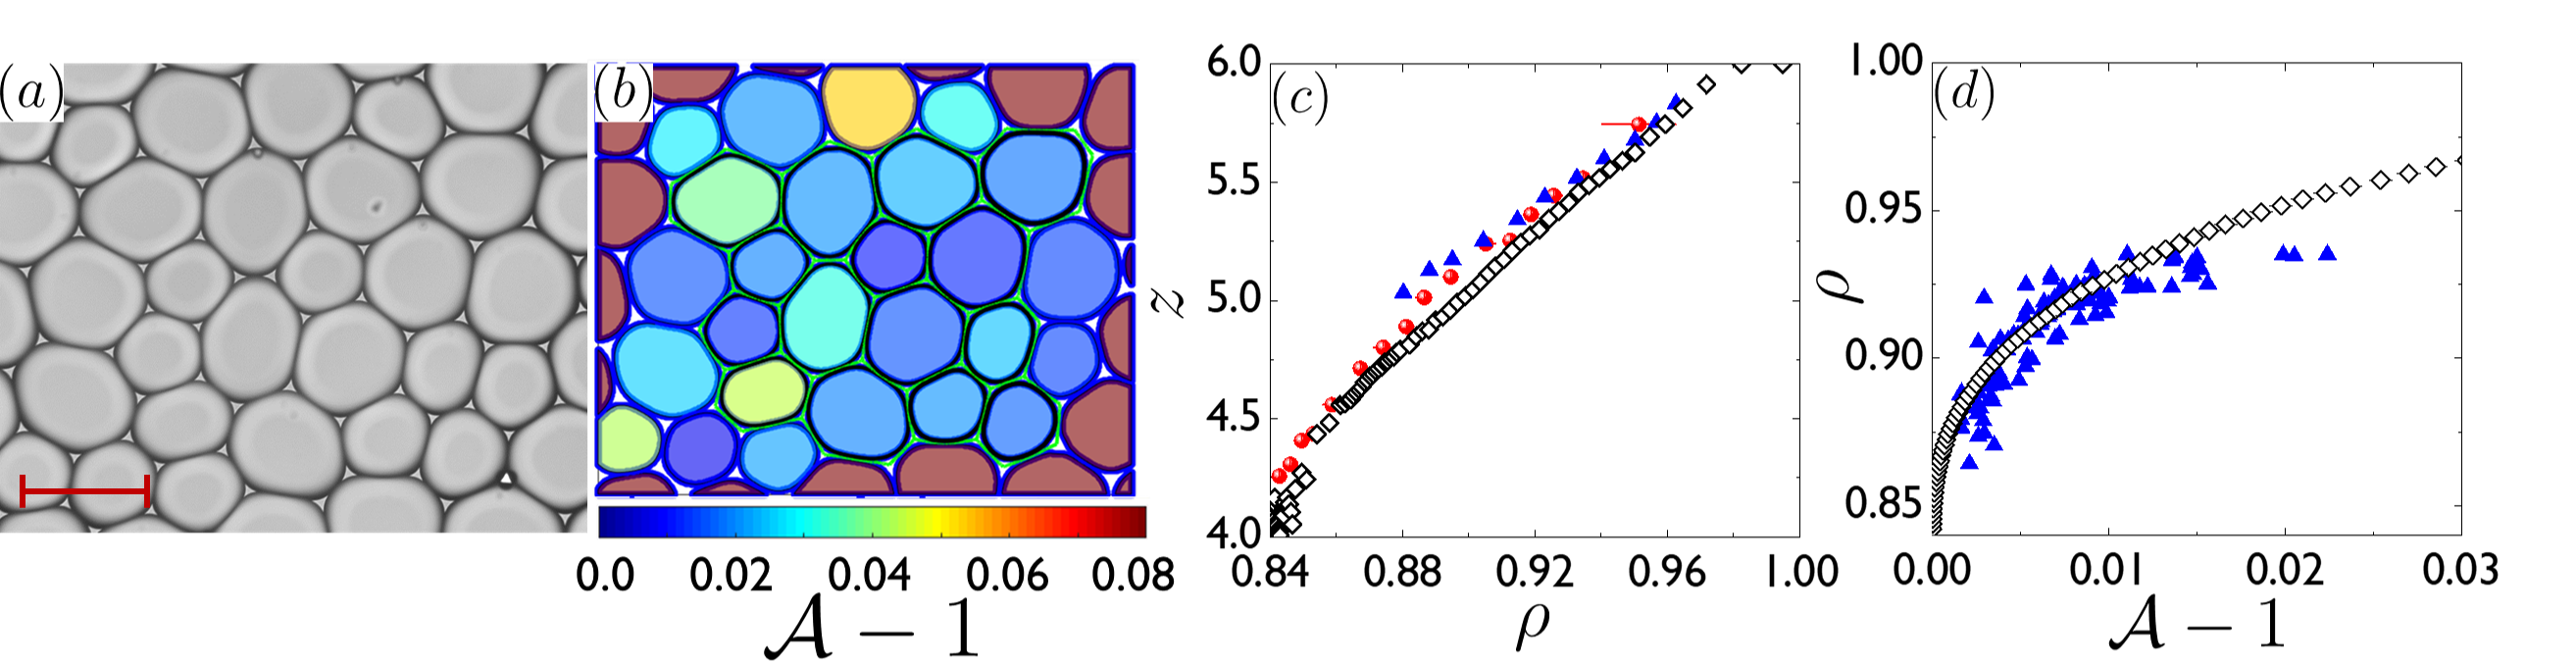 Figure 8
 Figure 17
 Figure 18
| Model | ||||||
|---|---|---|---|---|---|---|
| SP() | 3.97 | 0.84 | 3.7 | 0.5 | 0 | 1.0 |
| SP() | 3.97 | 0.84 | 2.6 | 0.5 | 4.0 | 1.0 |
| DP() | 3.97 | 0.835 | 3.3 | 0.5 | 7.1 | 1.0 |
| Model | |||||
|---|---|---|---|---|---|
| SP() | 0.84 | 0.42 | 0.5 | 0 | 1.0 |
| SP() | 0.84 | 0.38 | 0.5 | 0.35 | 1.0 |
| DP() | 0.835 | 0.07 | 0.5 | 1.7 | 1.0 |
Peer Reviews
No public reviews on file for this paper yet. If you reviewed it on a platform where reviews are public (OpenReview, ICLR, NeurIPS, ICML), you can paste yours below so the community can read it here.
Videos
No videos yet. Explain this paper in a talk, walkthrough, or lecture? Add one.
\makeFNbottom
[TABLE]
††footnotetext: a* Department of Mechanical Engineering and Materials Science, Yale University, New Haven, Connecticut, 06520, USA; E-mail: [email protected]. ††footnotetext: b Beijing National Laboratory for Condensed Matter Physics and CAS Key Laboratory of Soft Matter Physics, Institute of Physics, Chinese Academy of Sciences, Beijing, China.††footnotetext: c Program in Computational Biology and Bioinformatics, Yale University, New Haven, Connecticut, 06520, USA*††footnotetext: d* Department of Physics, Emory University, Atlanta, Georgia 30322, USA.††footnotetext: e School of Physical Sciences, University of Chinese Academy of Sciences, Beijing, China.††footnotetext: f Benjamin Levich Institute and Physics Department, The City College of New York, New York, New York 10031, USA.††footnotetext: g Department of Physics, Yale University, New Haven, Connecticut, 06520, USA. ††footnotetext: h Department of Applied Physics, Yale University, New Haven, Connecticut, 06520, USA; E-mail: [email protected]. *
1 Introduction
Soft materials, such as grafted core-shell particles, dendrimers, star polymers, emulsions, foams, and hydrogels, are a class of materials for which their microstructure can be altered by external fields, applied deformation, and thermal fluctuations at room temperature.. 1, 2 The ability to vary particle microstructure enables the design of soft materials with novel functional properties and processing capabilities. Molecular architecture, surface interactions, and deformability of soft particles can be harnessed to develop novel soft composites with optimized energy absorption, self-healing behavior, high mechanical strength, and other desirable properties.3, 4, 5, 6 In addition, many biological systems such as biofilms 7, cell aggregates 8, and tissues 9 can be considered as collections of soft and deformable particles.
The interactions between soft particles, e.g. the softness, range, and strength of the attraction and repulsion between soft particles is controlled by their composition and microstructure. In turn, the interactions between soft particles determine the collective mechanical and rheological properties of packings of soft particles. Significant challenges remain in understanding the influence of particle microstructure and interactions on the macroscopic properties of soft matter systems. In this article, we study the role of particle deformability in determining the structural and mechanical properties of packings of quasi-2D emulsions, modeled as collections of purely repulsive, deformable particles at and above the jamming transition.
Systems composed of soft, frictionless particles, such as foams and emulsions, can jam, or develop a non-zero static shear modulus , when they are isotropically compressed to packing fractions that approach random close packing . 10, 11, 12 For , packings of purely repulsive, frictionless spherical particles have an insufficient number of interparticle contacts for them to be mechanically stable. As a result, the packings exist at zero pressure () and are fluid-like, and particle rearrangements cost zero energy. 13 When compressed to , the packings develop a connected interparticle contact network with an isostatic number of contacts per particle , where , , is the total number of particles, and is the number of rattler particles with less than contacts, for frictionless circular particles in two spatial dimensions (2D) with periodic boundary conditions. 14, 15 For , the packings become solid-like with and a nonzero shear modulus . 16, 15, 17
A number of computational studies have been performed to investigate the structural and mechanical properties of compressed foams and emulsions in the solid-like regime . 18, 19, 20, 21 One of the most frequently used models for characterizing their structural and mechanical properties is the soft particle (SP) model 18, 16, for which there is a potential energy cost proportional to the square of the overlap between pairs of spherical particles, and no energy cost when the particles do not overlap. These studies find that the excess contact number above the isostatic number,
[TABLE]
and the shear modulus,
[TABLE]
obey power-law scaling relations with , where the scaling exponents in the large-system limit. 16, 15, 22 Further, these studies have found that the exponents do not vary with the shape of the purely repulsive interaction potential and are the same in 2D and 3D. 15, 22, 19, 17.
In Eqs. 1 and 2, we define the packing fraction (or reduced number density) in 2D for packings of circular disks as , where is the diameter of disk and is the area of the simulation box with edge lengths in the - and -directions. Note that when using this definition of , the area of particle overlaps is multiply-counted. A positive feature of the SP model is its simplicity, however, a negative aspect is that the particles do not conserve area when the packings are compressed above jamming onset.
There have also been a number of experimental 23, 24, 25, 26 studies (as well as computational studies 20, 21) of the structural and mechanical properties of compressed foams and emulsions in 2D and 3D. These studies also find power-law scaling of the excess contact number,
[TABLE]
where occurs in the range to depending on the particular study. The power-law scaling of is measured versus , not , where is the true packing fraction of the system. For systems at jamming onset, , but when particles overlap in the SP model. Also, is allowed, whereas is a hard constraint. In addition, experimental studies of compressed emulsions in 3D have shown that the shear modulus obeys power-law scaling in ,
[TABLE]
but the scaling exponent . 12, 27, 28
In light of the discrepancies between the power-law scaling exponents found in the experimental studies of compressed foams and emulsions and those obtained from the computational studies of the SP model, we employ the recently developed deformable particle (DP) model 29for foams and emulsions to understand how particle deformability affects the packing fraction dependence of the structural and mechanical properties of jammed particle packings.
Other computational methods have been employed to model particle deformability in soft matter systems, such as foams and emulsions. There are two main classes of methods for modeling particle deformability: Lattice Boltzmann 30, 31 and particle-based methods 20, 32, 33, 34, 35. The lattice-based methods have typically focused on two- or multi-phase modeling, whereas the DP model focuses only on the shape degrees of freedom of the particles (i.e. bubbles or droplets). Our work on the DP model differs from the previous studies using particle-based methods. First, the work by Rognon, et al. 35 has been limited to small systems composed of particles. Second, the froth model by Kern, et al. 33 is limited to the dry regime, where the true packing fraction approaches unity. In contrast, the DP model can be used to study a wide range of packing fractions, from values where the particles are out of contact to confluent systems. The model proposed by Kahara et al. 32 is most similar to the DP model. However, by modeling the pressure of the carrier fluid, their study is limited to the wet regime. In addition, their studies have focused on the rheological properties of bubbles during shear. In contrast, this article will focus on the structural and mechanical properties of jammed deformable particles generated during isotropic compression.
A central assumption of the SP model is that the particles remain spherical as particle overlap increases when the system is compressed above jamming onset. For this reason, studies that employ the SP model typically quantify the system properties as a function of instead of the true packing fraction 23, 24.
Even though the SP model does not conserve particle area as the system is compressed, one can also measure the structural and mechanical properties as a function of the true packing fraction when using the SP model by attributing half of an overlap between particles and to particle and the other half to particle . (See Fig. 1.)
A key feature in jammed packings of foams and emulsions is that the particles maintain their area (volume) during compression over the full range of packing fraction. Bubbles in foams and emulsion droplets can deform, become non-spherical, and form additional contacts that do not occur in the SP model at a comparable value of packing fraction as that shown in Fig. 2 (a) and (b). In this article, we show that the soft particle and deformable particle models show similar results for the scaling of the excess contact number and shear modulus versus for packing fractions close to jamming onset. However, for larger , we find that and for the SP and DP models begin to differ significantly. In this regime, for the deformable particle model is similar to that found for experimental studies of compressed emulsions and foams in 2D. We also study the geometric properties of the void space of jammed packings as a function of . We show that unlike the SP model, the DP model is able to recapitulate the formation of Plateau borders 36, 37, 38, 39, where bubble edges have a relative orientation of and form a void with shape factor , near confluence. (The shape factor , where is the perimeter and is the area of the void space 29, 26.)
The remainder of the article is organized as follows. In Sec. 2, we describe the soft particle and deformable particle models for 2D compresed foams and emulations, and the isotropic compression protocol that we employ to numerically generate jammed packings. In Sec. 3, we compare the results for the structural and mechanical properties of jammed packings using the SP and DP models. We show the variation of with above jamming onset and quantify the decrease in the average area of the particles as a function of increasing packing fraction for the SP model. We measure versus the shape factor to determine at what shape factor the SP and DP models reach confluence. We then show the power-law scaling results for and versus for the SP and DP models. We also characterize the connected void regions, by measuring the number, size, and shape of the voids as a function of packing fraction for the SP and DP models. In Sec. 4, we summarize the results for the SP and DP models, compare the results for the DP model to those from recent experiments on compressed foams and emulsions, and discuss future research directions.
2 Simulation Methods
In this article, we study the structural and mechanical properties of isotropically compressed jammed packings of purely repulsive, frictionless bidisperse particles in 2D using the soft particle and deformable particle models. For both models, the simulation cell is square with periodic boundaries in both directions.
2.1 Soft Particle Model
For the soft particle model, pairs of circular disks and interact via the purely repulsive pairwise potential:
[TABLE]
where is the characteristic energy scale of the interaction, = is the average diameter and is the center-to-center separation between disks and , and is the Heaviside step function that sets the interaction potential to zero when disks and do not overlap. We focused on systems composed of large and small disks with equal mass and diameter ratio, to avoid crystallization. The total potential energy for the SP model is and the stress tensor is given by
[TABLE]
where , and and . To measure the shear modulus , we apply an infinitesimal affine shear strain to the -positions of the particle centers, , and measure the resulting shear stress . We then calculate the shear modulus (at fixed area). For the SP model, we measure energy, length, and stress in units of , , and .
2.2 Deformable Particle Model
To model bubbles and droplets, we consider the deformable particle model 29 for foams and emulsions with a potential energy that includes the following three terms:
[TABLE]
Each deformable “particle” (indexed by ) is modeled as a polygon with circulo-line edges to represent shape degrees of freedom. The circulo-lines have width 40 and are indexed by . (See Fig. 2c).
We consider large particles with and small particles with , and , which is similar to the area ratio of the large and small disks in the SP model. We have also studied DP packings with larger numbers of vertices (while maintaining ), and the structural and mechanical properties are similar to those for and for the large and small particles, respectively. The location of the th circulo-line in particle is , and the bond vector connects circulo-lines and .
The first term in is proportional to the total length of the interface, i.e. the perimeter, of the th particle with a proportionality constant equal to the line tension . The second term is quadratic in with a minumum at , which penalizes deviations in area from the reference value . Here, we study , which implies that the fluctuations in the particle areas are . We characterize the shape of the deformable particles by calculating the particle shape parameter , which equals for circular disks and is greater than for all non-spherical shapes 41, 29.
Note that for the DP model for foams and emulsions, we remove the constraint on the elastic interface 29, i.e. the preferred bond length, . As a result, the spacing between the vertices on a given deformable particle can change as they interact with vertices on neighboring particles. This allows us to correctly model the formation of elongated edges when deformable particles make contacts (such that ), as well as model the formation of Plateau borders 37, 36 with .
The third term, , penalizes overlaps between deformable particles by including purely repulsive interactions between pairs of contacting circulo-lines on neighboring deformable particles:
[TABLE]
where gives the strength of the repulsive interactions, is the minimum distance between circulo-lines and on contacting deformable particles and , and ensures that there is no interaction when the circulo-lines on different particles are out of contact. The stress tensor for packings of deformable particles is obtained using , where is the force on particle arising from and is the position of the centroid of particle .
To measure the shear modulus , we apply an infinitesimal affine shear strain to the -positions of the circulo-lines on each particle , , and measure the resulting shear stress . We then calculate the shear modulus (at fixed area). For the DP model, we measure energy, length, and stress in units of , , and , where . The structural and mechanical properties of DP packings at jamming onset do not depend on the parameters , , and . However, above jamming onset, the properties can depend on these parameters. We focused on the parameter regime, , which is typical for foams and emulsions.
2.3 Isotropic Compression Packing Protocol
The protocol to generate jammed packings is similar for the SP and DP models. The protocol proceeds in two stages. For each initial condition, we first identify the packing fraction at jamming onset. For the SP model, the system is initialized using random locations for the disks at . For the DP model, we place the particle centers randomly at and then position the circulo-lines equally spaced around each particle center. We successively isotropically compress the system (by decreasing the size of the simulation cell) using small packing fraction increments (= for the SP model and for the DP model) and minimize the total potential energy per particle, , for the SP model (or for the DP model) after each compression step using over-damped molecular dynamics simulations until the kinetic energy per particle satisfies for the SP model and the total kinetic energy per circulo-line for the DP model. If or is “zero” (i.e. or ) after minimization, the system is subsequently compressed. If or is nonzero, i.e. there are finite particle overlaps and or , after minimization, the system is subsequently decompressed. The increment by which the packing fraction is changed at each compression or decompression step is gradually decreased.
We terminate the process of finding the onset of jamming at or when the system satisfies and for the SP model or and for the DP model. This process yields mechanically stable packings at jamming onset.
The second stage of the protocol involves sampling the system at set of packing fractions above jamming onset with adjacent values separated by for the DP model or a set of with adjacent values separated by for the SP model. Ensemble averages are obtained by averaging over systems at fixed or for the SP and DP models, respectively, where and are determined separately for each initial condition. The distribution of and for the SP and DP models are shown for several system sizes in the Appendix.
3 Results
Below, we compare the results for the structural and mechanical properties of particle packings as a function of packing fraction above jamming onset obtained using the soft particle and deformable particle models.
These studies allow us to investigate the effect of particle deformability on the structural and mechanical properties of jammed solids. As discussed in Sec. 1, there are several key differences between the SP and DP models. For example, the SP model allows overlap between particles and concomitant decreases in the particle area as the system is compressed above jamming onset. In contrast, the particles in the DP model deform to prevent interparticle overalps, and thus they maintain their areas, and do not remain circular in shape.
A method to minimize the effects of the loss of particle area for the SP model is to quantify the structural and mechanical properties of jammed packings generated using the SP model as a function of the true packing fraction , not . To measure at each , we need to subtract from the muliply-counted areas of overlapping disks. For , we only need to consider overlaps between pairs of disks, i.e. subtract off the area of each lens between pairs of overlapping disks. (See Fig. 1.) In this case, the true packing fraction is
[TABLE]
where
[TABLE]
is the area of the lens between overlapping disks and and . For , the lens between overlapping disks and can overlap with the lens of other overlapping pairs of disks, which modifies Eq. 9.
In Fig. 3 (a), we plot the deviation in the true packing fraction from that at jamming onset, , versus the deviation in the reduced number density from the value at jamming onset, , for jammed packings generated using the SP model. On a linear scale, for . More generally, we find
[TABLE]
where is weakly dependent on . (See Figs. 10 (a) and (b) in the Appendix.) Note that Eq. 11 is exact when higher-order overlaps (i.e. the lens from overlapping disks and overlaps with the lens from other overlapping disks) do not occur. To study the structural properties of the SP model near confluence, , we also considered cases where three disks mutually overlap. The true packing fraction becomes
[TABLE]
where is the area of the Reuleaux triangles that form when three disks mutually overlap. Using this approximation, we find that near .
As discussed in the introduction, for packings generated using the SP model, the area of the particles decreases with increasing packing fraction above jamming onset. We calculate the average area of the particles (normalized by the average at jamming onset) versus for packings generated using the SP and DP models in Fig. 3 (b). On a linear scale, begins deviating significantly from for for the SP model. In the Appendix, we show that with an exponent at small and at large for the SP model. In contrast, over the full range of for the DP model.
In Fig. 3 (c), we quantify how the particles deform during isotropic compression above jamming onset. In general, the packing fraction increases with the shape parameter . In the Appendix, we show that grows as a power-law in the deviation of the shape parameter from that at jamming onset, . At small , and for the SP and DP models, respectively. At large , for both the SP and DP models. for the SP model also grows as a power-law with , but much faster than .
At what shape parameter do 2D foams and emulsions reach confluence? Fig. 3 (c) shows that the DP and SP models reach confluence () at different values of the shape parameter, for the DP model and for the SP model. Thus, we find similarites and differences between the shapes of the particles for packings generated using the SP and DP models as they are compressed above jamming onset. An interesting similarity is that the packing fraction for both the SP and DP models scales as , where at large .
Next, we compare the contact number and shear modulus versus the packing fraction for the SP and DP models. On a linear scale, which emphasizes the values at large packing fraction, we find weak system-size dependence for and for packings generated via the SP and DP models. Note that for the deformable particle model, multiple circulo-lines on one deformable particle can be in contact with multiple circulo-lines on another deformable particle. These multiple circulo-line contacts are treated as a single contact between two deformable particles.
In Fig. 4, for both and , measured in packings of particles, the results for the SP and DP models are similar near jamming onset . For and , the results for the SP and DP models begin to deviate near . We find that more interparticle contacts form as the packings are compressed above jamming onset for the DP model, compared to that for the SP model. As a result, the shear modulus grows more rapidly with for packings generated using the DP model. We also show the best fits of and for the SP model to the power-law scaling form with in Eqs. 1 and 2. As found previously, the scaling exponents for the SP model.15, 13 By plugging Eq. 11 into Eqs. 1 and 2, we can convert and to and . To lowest order in , we find
[TABLE]
and
[TABLE]
for the SP model, where and . We show fits of and for the SP model to Eqs. 13 and 14 as dashed-dotted lines in Fig. 4. The combination of the two power-laws in with exponents and accurately describes the data for and . However, begins deviating from Eq. 13 for near confluence. Moreover, we find that Eqs. 13 and 14 can be used to fit the data for the DP model as well. The parameters for the fitting functions are shown in Tables 1 and 2.
In Fig. 5 (a) and (d), we present the excess contact number and shear modulus versus on logarithmic axes for jammed packings using the SP model for system sizes ranging from to . By plotting the data on logarithmic scales, we can identify several different regimes in : 1) , 2) , and 3) . Regime , where , is difficult to see on the linear scales shown in Fig. 4 (a). In this regime, there is strong system-size dependence and and . 22, 42 As found previously, at intermediate , and , where . The characteristic at which the and exponents cross-over from to and [math] and , respectively, scales as . (See Tables 1 and 2.) Thus, regime extends to smaller as the system size increases. In regime , at large , we find that the power-law scaling behavior of and with breaks down.
Using Eq. 11, we can convert the data from functions of to functions of for the SP model. We show and in Fig. 5 (b) and (d). We find two different regimes in . At low , and . At intermediate and large , the forms for and include a sum of two power-laws as shown in Eqs. 13 and 14. The characteristic packing fraction that separates the small and large regimes also scales as .
In Fig. 5 (c) and (f), we show and versus for the DP model. The data also show two regimes in . At small , and . At intermediate and large , we fit and to a sum of two power laws with exponents and . (See Tables 1 and 2.) Note that the scaling of and for the DP model is similar to that for the SP model (Eqs.13 and 14), but the ratio of the coefficient for the linear term in to that for the term is much larger than the corresponding ratio for the SP model. If we use only a single power law exponent to fit the data for and at large , we find a best fit exponent of for both and . Winklemann, et al. 20 recently studied packings of bubbles and showed that with an exponent , which is larger than the value we find if we use a single power-law to fit the data for for .
In Fig. 5 (a) and (b), the data for begin to plateau at large or , indicating that the packings are reaching confluence with at , where in the large system limit. To understand the scaling of near confluence, we plot versus . For the SP model, we use Eq. 12 to determine . We find that the data for versus for different system sizes can be collapsed onto a master curve when we scale and by as shown in the inset to Fig. 6 (a). However, as , does not approach zero for the SP model. Instead, . approaches a finite value because Eq. 12 does not account for all multiply-counted overlaps between mutually overlapping pairs of disks (i.e. beyond three mutually overlapping disks). For the DP model, verus can also be collapsed onto a master curve when both and are scaled by (Fig 6 (b)). Unlike the SP model, for the DP model we find that scales as in the large system limit over several orders of magnitude in .
In addition to the contact number and shear modulus, we also studied the variation of the structure of the void space of jammed packings as a function of packing fraction . To do this, for each jammed packing, we identify all of the void space that is not occupied by particles. We then determine the connected void regions (i.e. one can reach any part of a connected void region from any point in the region). The topology of each connected void can be characterized by the number of edges, or the smallest number of particles that form a loop on the perimeter of the void region (using the depth first search algorithm). 43 In Fig. 7 (a), we compare the probability to have a void with sides as a function of for the SP and DP models. Near , the SP and DP models are identical and we find that the distributions are the same for the two models. In this regime, the probability of - and -sided voids are similar (), while the probabilities for - and -sided voids are much smaller ( and ). For , for the DP model begins to deviate from that for the SP model. Similar behavior was found for the deviation in the contact number for . For the DP model, we find an increase in the probability of -sided voids over that for the SP model and a comparable decrease in the probability of -sided voids relative to the SP model. For the DP model, we find that for . In contrast, only in the limit for the SP model. Further, we find that the shape parameter of the -sided voids for the DP model is independent of , indicating that the DP model correctly captures the structure of the Plateau borders that form as . However, the shape parameter of the -sided voids varies from to less than as increases from to for the SP model, which indicates that the void structure for the SP model differs significantly from that for jammed packings of foams and emulsions near confluence.
In Fig. 8, we show preliminary studies comparing the results for jammed packings generated using the DP model to the results from optical microscopy experiments of quasi-2D compressed emulsion droplets 23. We find that the contact number versus for the DP model closely matches that from the experiments (Fig. 8 (c)). In addition, we show that the evolution of the shape factor of the particles with packing fraction above jamming onset is similar for the DP model and experiments (Fig. 8 (d)). However, we encourage additional experiments on compressed foams and emulsions to be performed with packing fraction to determine whether the DP model can recapitulate the structural and mechanical properties of compressed emulsions near confluence. For example, new experimental studies can test the prediction for the DP model that scales linearly with near .
4 Discussion and Conclusions
In this article, we investigated the structural and mechanical properties of jammed packings undergoing isotropic compression in 2D using the soft particle (SP) model 18, 44 and the new deformable particle model 29 that we developed for bubbles and emulsions. The SP model has been widely used to characterize the structural, mechanical, and rheological properties of jammed particulate systems including granular materials 15, dense colloidal suspensions 45, foams 18, and emulsions 46. The key difference between the two models is that in the SP model, the particles decrease in area as the system is compressed above jamming onset, while the DP model conserves particle area during compression. Studies that have employed the SP model typically characterize the properties of jammed packings as a function of the reduced number density 16, 13, 17, rather than using the true packing fraction . In this work, we provide direct comparisons of the structural and mechanical properties of packings generated using the SP and DP models as a function of the packing fraction .
First, we showed explicitly that the SP and DP models give the same results near jamming onset, where the disks are undeformed. In particular, we showed that the probability distribution of jamming onsets are nearly identical for the SP and DP models with in the large system limit. (For the detailed discussion of this point, see the Appendix.) In addition, we find similar scaling behavior for the excess contact number and shear modulus versus . Near jamming onset, for both the SP and DP models, and for small systems. 22, 42 This scaling behavior occurs for , where . In the large system limit, near jamming onset for both the SP and DP models.
For packings that are compressed above jamming onset, we determined the relation between the packing fraction and reduced number density for the SP model. Using this relation, we showed that for the SP model can be represented as a sum of power-laws in (not a single power-law), with and as the lowest order terms. The scaling of and is similar for the DP model, but the ratio of the coefficient for the linear term in to that for the term is much larger than the corresponding ratio for the SP model. As a result, we find that and are larger for the DP model compared to the SP model for .
In addition, we characterized the void space in jammed packings 26, 47 as a function of packing fraction for both models. We showed that the DP model can recapitulate the formation of Plateau borders as the deformable particles become tightly packed. The probability to obtain -sided voids becomes unity for and the shape factor of the -sided voids () is independent of . In contrast, for the SP model, the probability of -sided voids only becomes unity in the limit and over the full range of packing fraction. Thus, the SP model does not capture the topological features of the void space of packings of compressible bubbles near confluence. We believe that the results from this article will inspire additional experimental and theoretical studies of the collective behavior of droplets and bubbles in emulsions and foams. For example, the DP model can be extended to include attractive interactions to investigate the mechanical response of attractive emulsions in both 2D and 3D 48. In addition, active forces can be added to each circulo-line in the DP model to simulate collective motion, such as swarming and migration, in cell aggregates as well as living tissues.
5 Appendix
In this Appendix, we provide additional calculations to support the conclusions described in the main text. In Fig. 9, we show the distribution of the reduced number densities for the SP model (panel (a)) and the distribution of packing fractions for the DP model (panel (b)) at jamming onset using the isotropic compression protocol discussed in Sec. 2.3. (We also include the fraction of packings with (or ) at or below a given value in the insets to Fig. 9 (a) and (b).) The distributions for the SP and DP models were obtained using the same initial random particle positions. At jamming onset , and thus the distributions and for the SP and DP models are nearly identical. Similar to previous studies, we also find that the root-mean-square deviation in the packing fraction at jamming onset scales as , with , and in the large system limit.
In Fig. 10, we show a series of scaling laws for several physical quantities and compare the behavior for packings generated using the SP and DP models. In Fig. 10 (a), we show that , where , for the SP model. The scaling exponent can be obtained by assuming from Eq. 11 and using from Eq. 5.
In Fig. 10 (b), we show versus for packings generated using the SP model. The dashed line obeys Eq. 11 with . As discussed in Sec. 3, the relation between and only holds when multiply-counted overlaps (i.e. beyond pairwise overlaps) are absent. Combining the results from Fig. 10 (b) and 3 (a), we see that Eq. 11 holds over nearly orders of magnitude in . In Fig. 10 (c), we show the data for the relative deviation in the area of the particles versus from Fig. 3 (b) on logarithmic scales for the SP model. In contrast to the DP model, the SP model does not conserve particle area when ovecompressed above jamming onset. We find two power-law scaling regimes. with and at small and large , respectively.
In Figs. 10 (c) and (d), we characterize the change in particle shape as the packings are compressed above jamming onset for the SP and DP models. We show that , but the scaling exponent takes on different values in the for small and large values of . At small , and for the SP and DP models, respectively. At large , for both the SP and DP models.
6 Acknowledgments
We acknowledge support from NSF Grants No. PHY-1522467 (A.B., A.S., and C.S. O’Hern), No. CBET-1336401 (J.L., C.S. Orellana, and E.R.W), No. CBET-1804186 (E.R.W), No. CMMI-1462439 (C.S. O’Hern) and No. CMMI-1463455 (M.D.S.), the President’s International Fellowship Initiative (PIFI) and Hundred Talents Program of the Chinese Academy of Sciences (A.B. and F.Y.), and the Raymond and Beverly Sackler Institute for Biological, Physical, and Engineering Sciences (A.B.). This work was also supported by the High Performance Computing facilities operated by Yale’s Center for Research Computing.
Conflicts of interest
There are no conflicts to declare.
The reference list from the paper itself. Each links out to its DOI / PubMed record.
- 1De Gennes 1992 P.-G. De Gennes, Rev. Mod. Phys. , 1992, 64 , 645.
- 2Terentjev and Weitz 2015 E. M. Terentjev and D. A. Weitz, The Oxford handbook of soft condensed matter , Oxford Handbooks, 2015.
- 3Lyklema 2005 J. Lyklema, Fundamentals of interface and colloid science: soft colloids , Elsevier, 2005, vol. 5.
- 4Mattsson et al. 2009 J. Mattsson, H. M. Wyss, A. Fernandez-Nieves, K. Miyazaki, Z. Hu, D. R. Reichman and D. A. Weitz, Nature , 2009, 462 , 83.
- 5Malescio and Pellicane 2003 G. Malescio and G. Pellicane, Nat. Mat. , 2003, 2 , 97.
- 6Vlassopoulos and Cloitre 2014 D. Vlassopoulos and M. Cloitre, Curr. Opin. Colloid In. , 2014, 19 , 561 – 574.
- 7Acemel et al. 2018 R. D. Acemel, F. Govantes and A. Cuetos, Sci. Rep. , 2018, 8 , 5340.
- 8Bi et al. 2015 D. Bi, J. Lopez, J. M. Schwarz and M. L. Manning, Nat. Phys. , 2015, 11 , 1074.