Transparent electrodes with nanorings: a computational point of view
Mohammad-Reza Azani, Azin Hassanpour, Yuri Yu. Tarasevich, Irina V., Vodolazskaya, and Andrei V. Eserkepov

TL;DR
This study uses Monte Carlo simulations to analyze how the arrangement and size distribution of silver nanorings affect the electrical conductivity of transparent conductive films, providing insights into optimizing their design.
Contribution
It introduces a computational model for predicting electrical conductivity in nanoring-based transparent electrodes, considering size dispersity and ring density effects.
Findings
Electrical conductivity increases linearly with nanoring density.
Size dispersity lowers the percolation threshold.
Analytical estimations align with simulation results.
Abstract
Four samples of transparent conductive films with different numbers of silver nanorings per unit area were produced. The sheet resistance, transparency, and haze were measured for each sample. Using Monte Carlo simulation, we studied the electrical conductivity of random resistor networks produced by the random deposition of the conducting rings onto the substrate. Both systems of equal-sized rings, and systems with rings of different sizes were simulated. Our simulations demonstrated the linear dependence of the electrical conductivity on the number of rings per unit area. Size dispersity decreased the percolation threshold, but without having any other significant effect on the behavior of the electrical conductance. Analytical estimations obtained for dense systems of equal-sized conductive rings were consistent with the simulations.
Click any figure to enlarge with its caption.
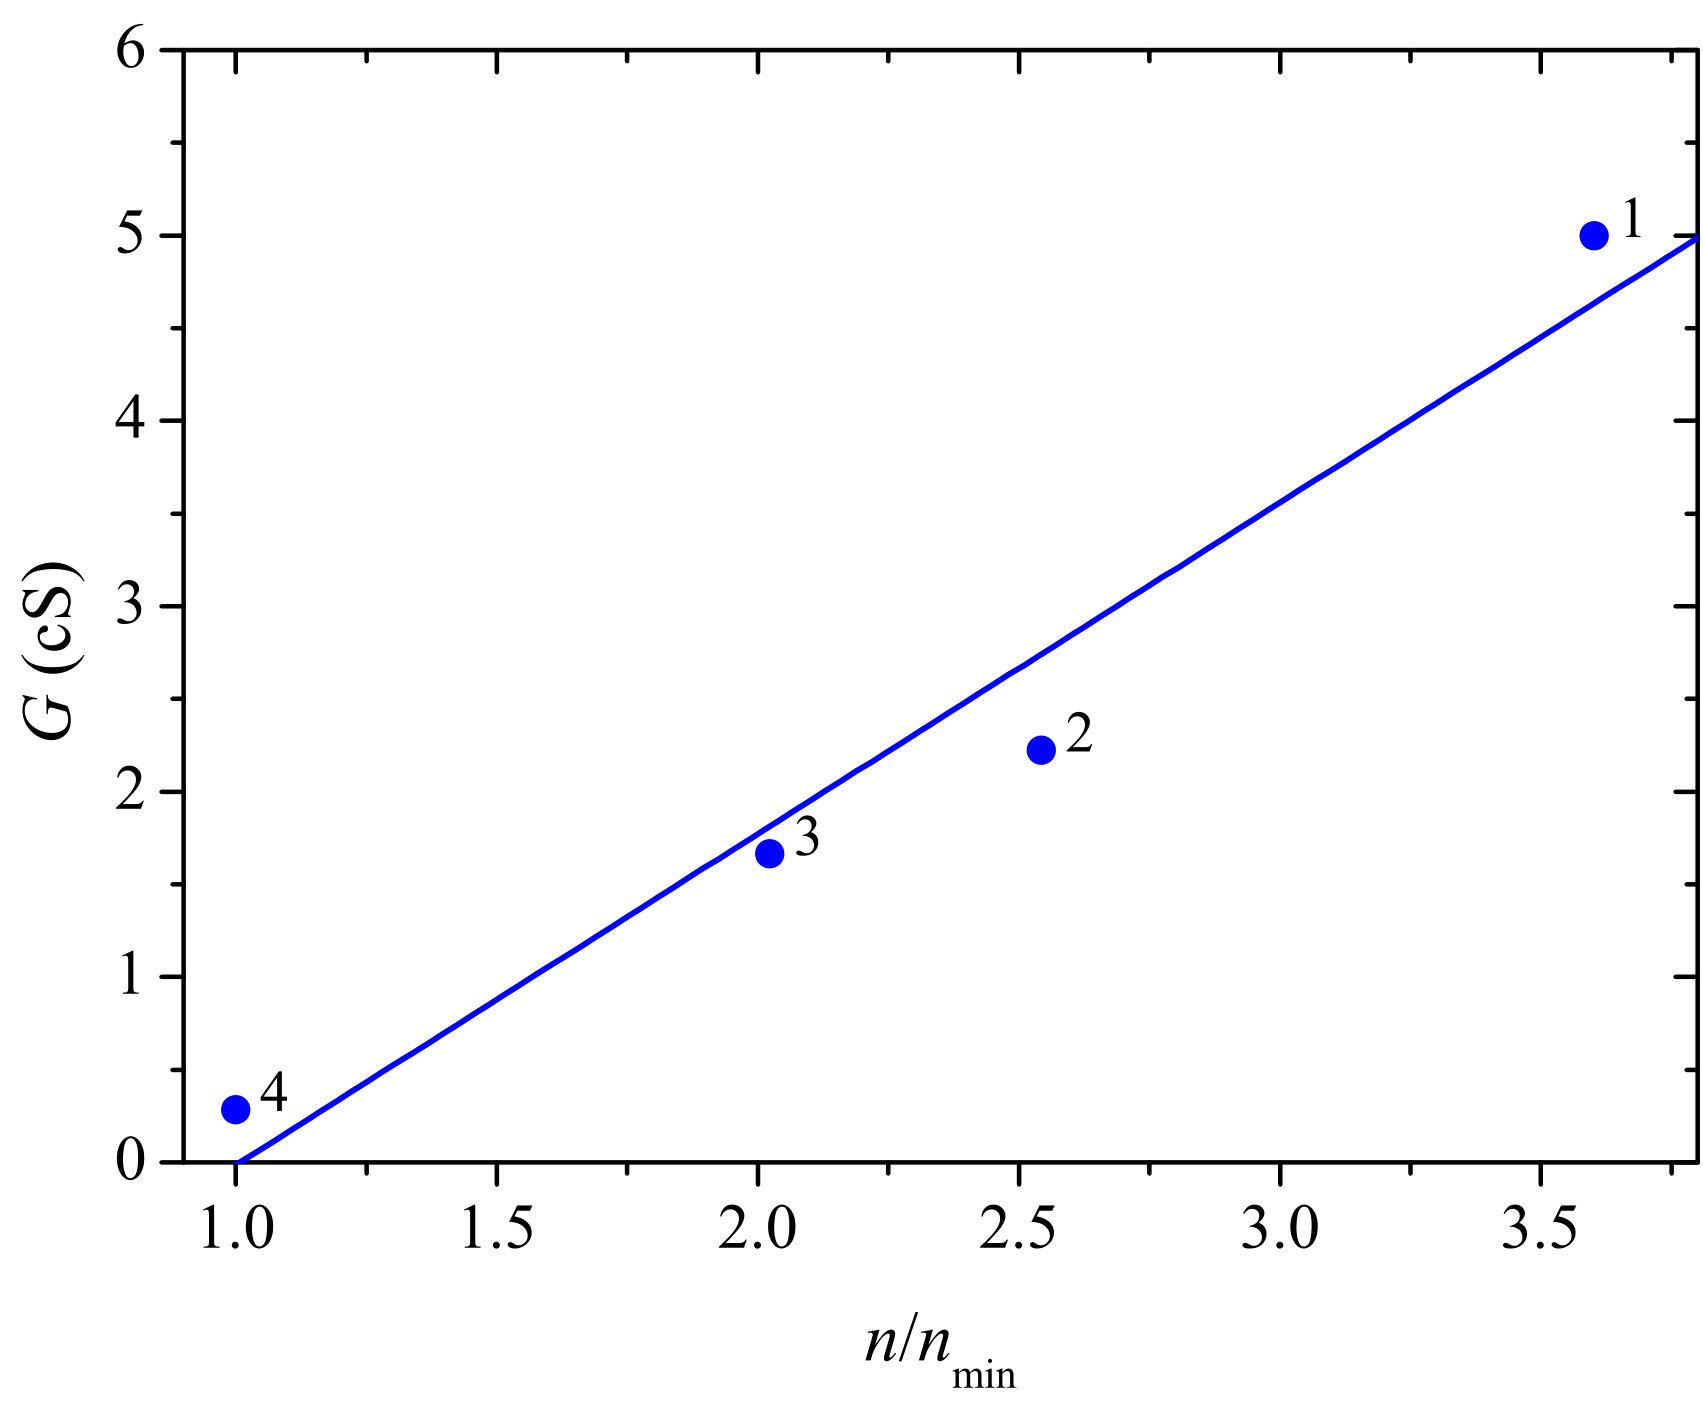 Figure 1
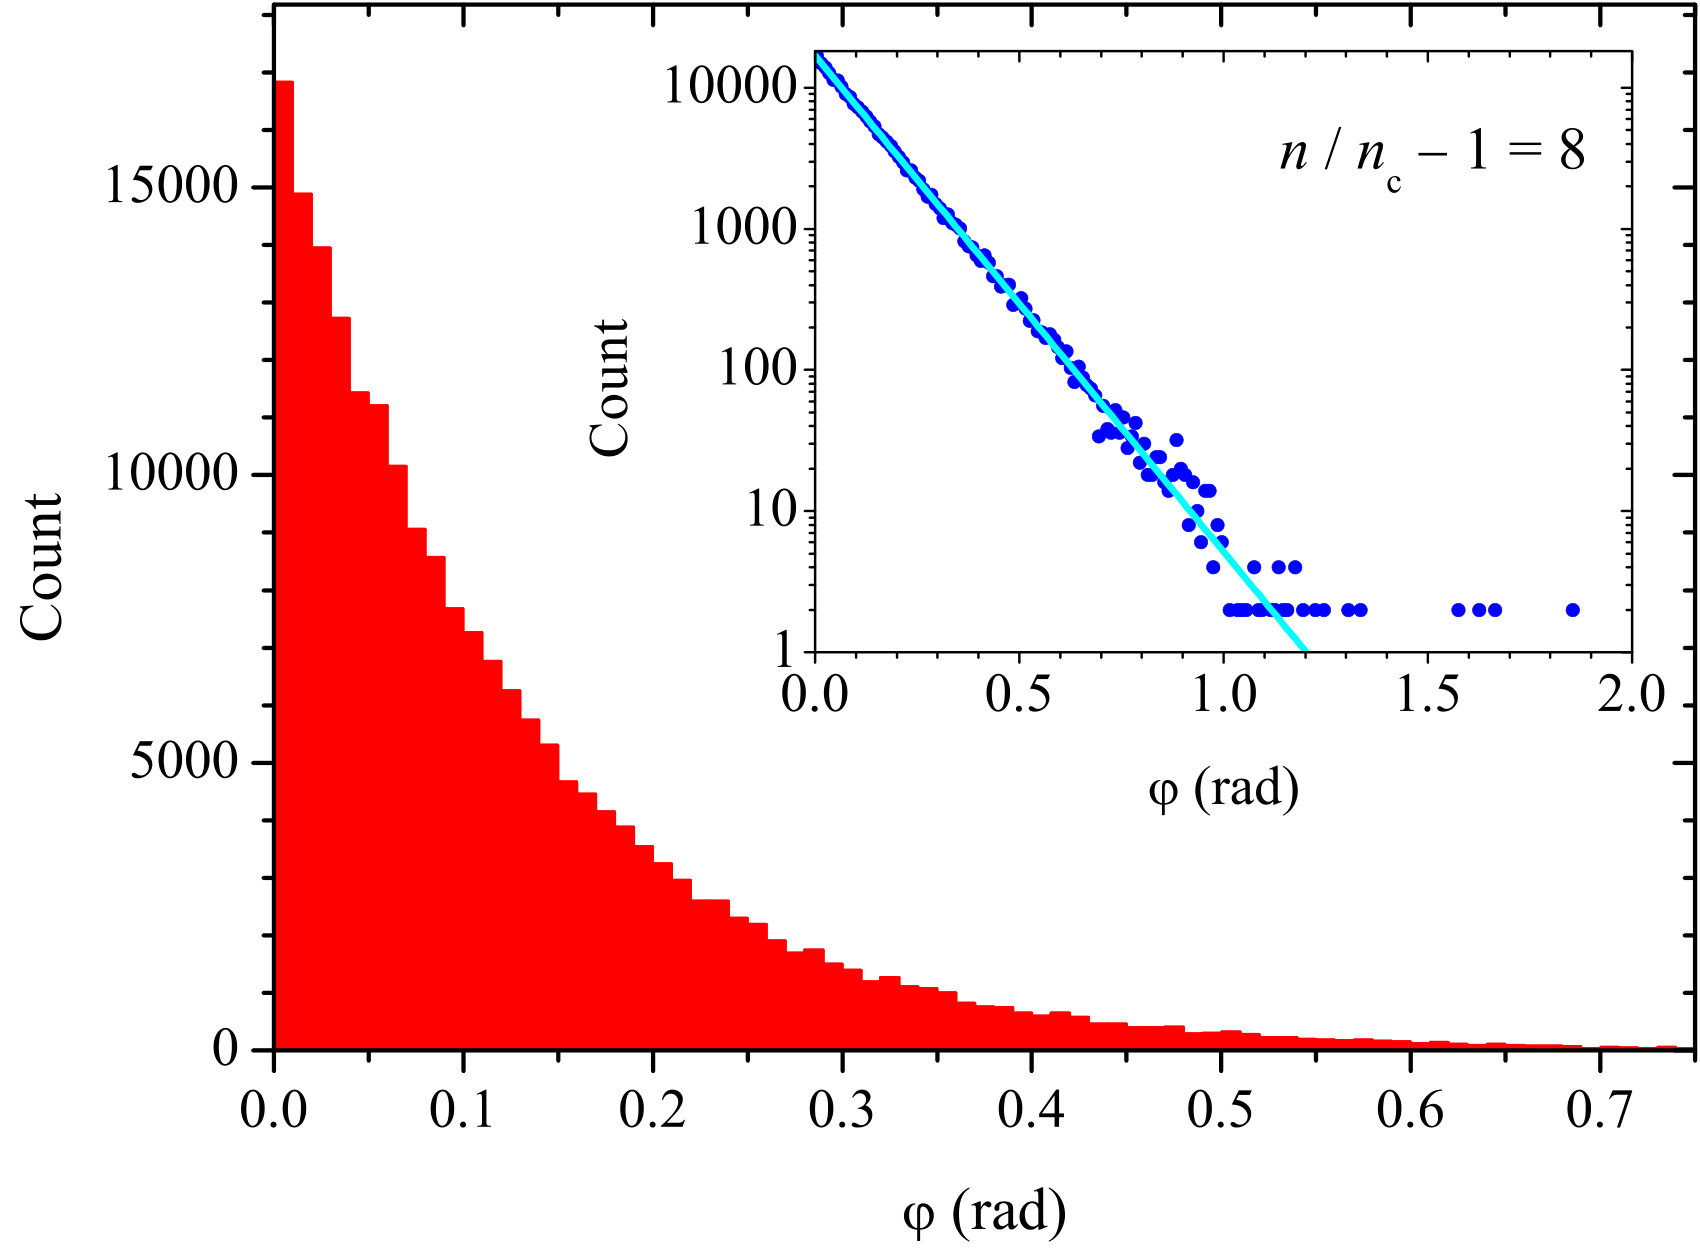 Figure 2
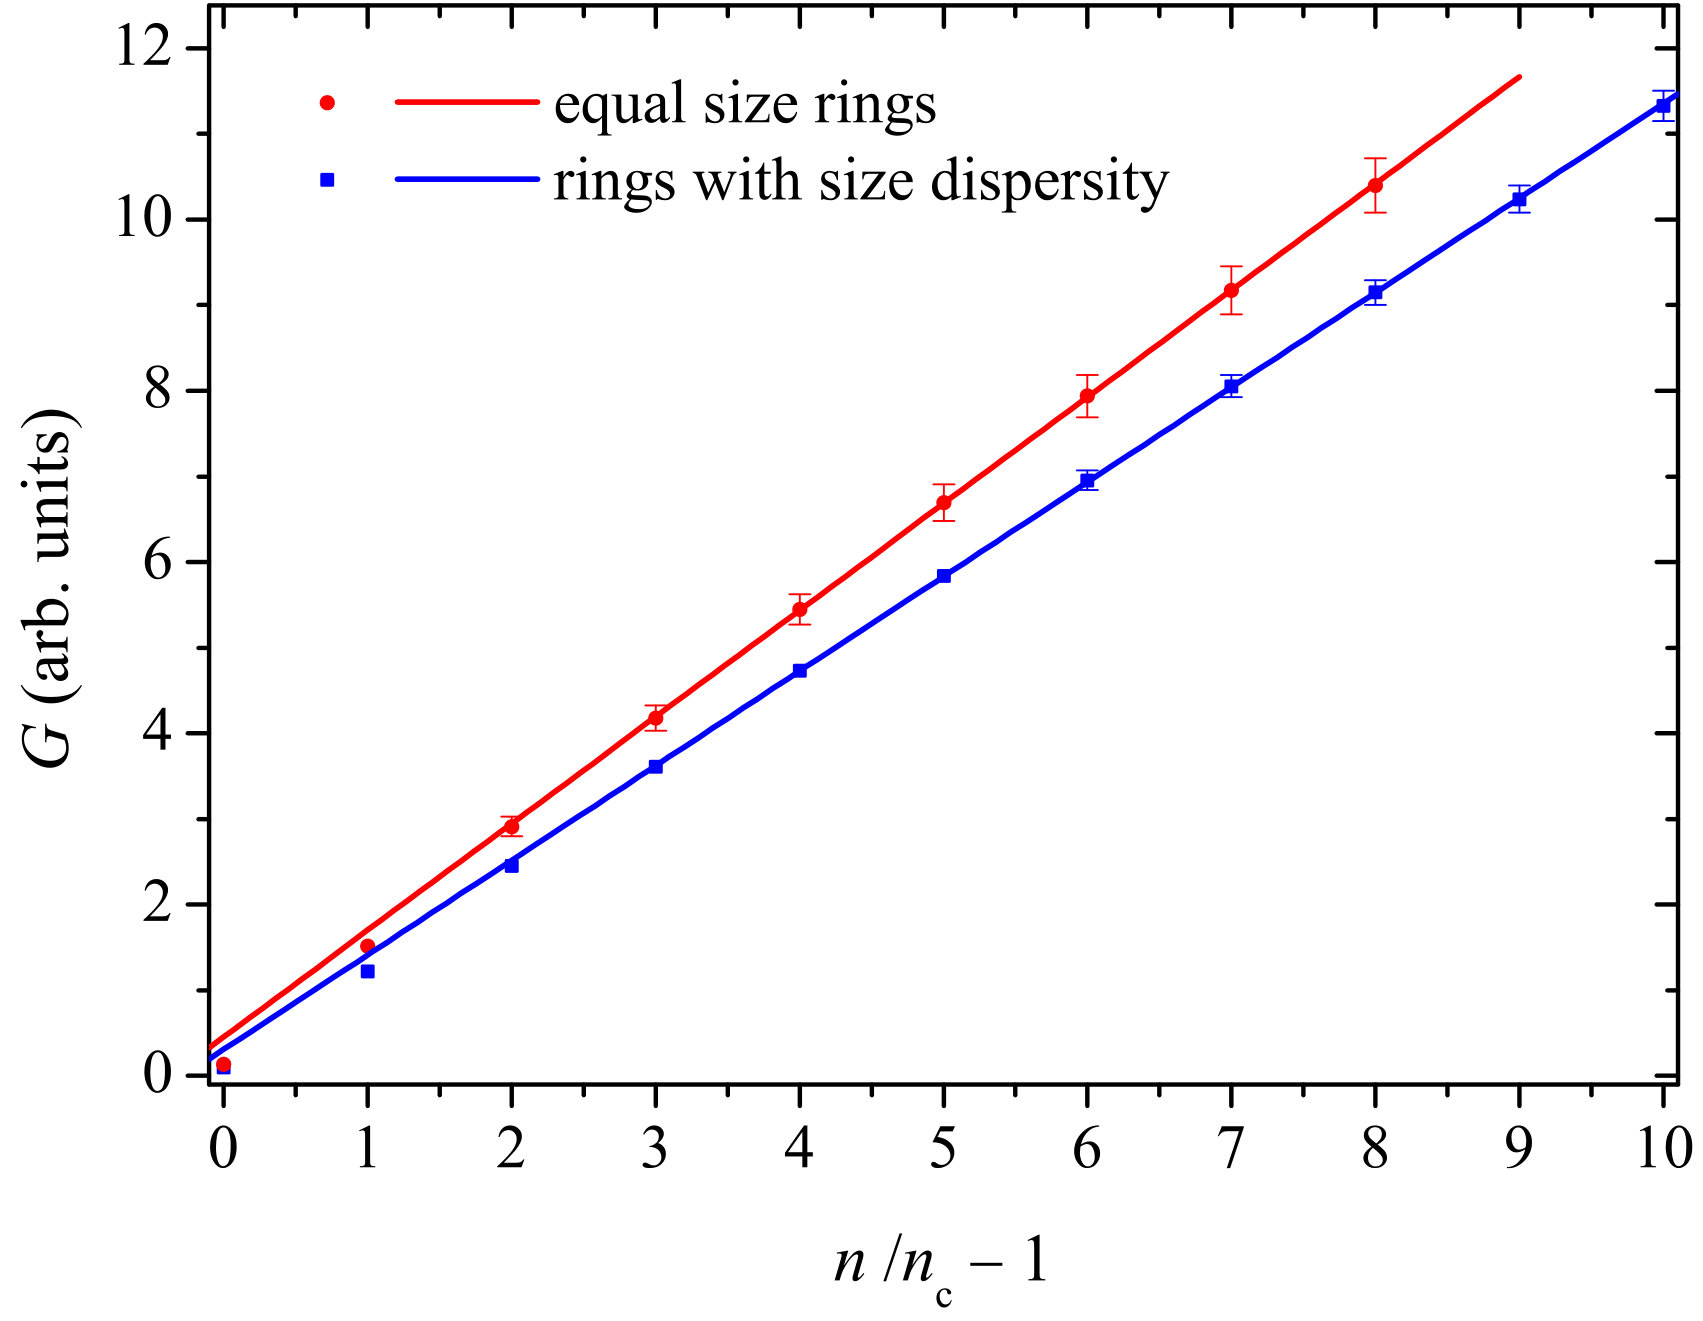 Figure 3
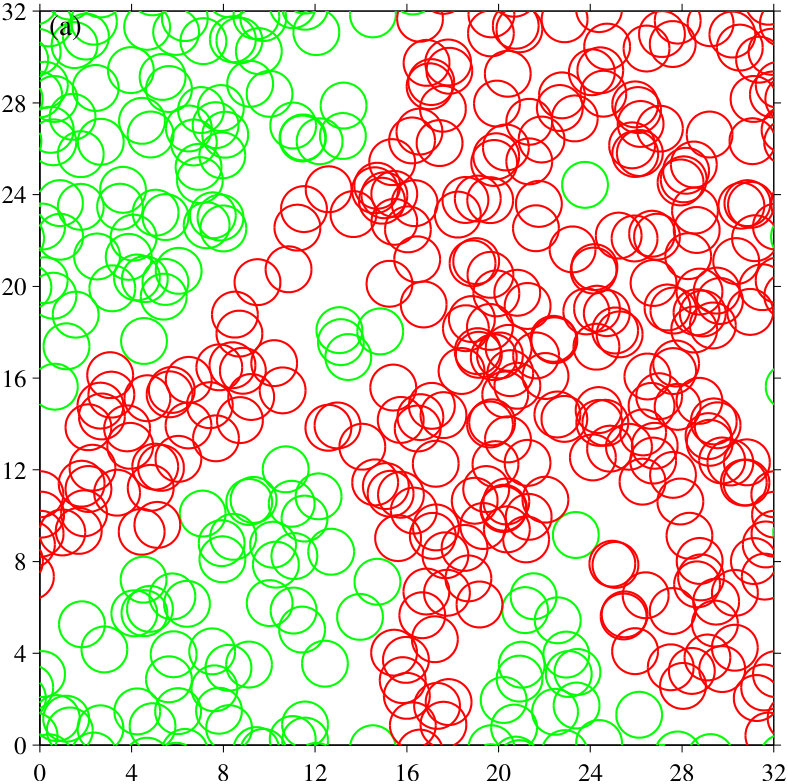 Figure 4
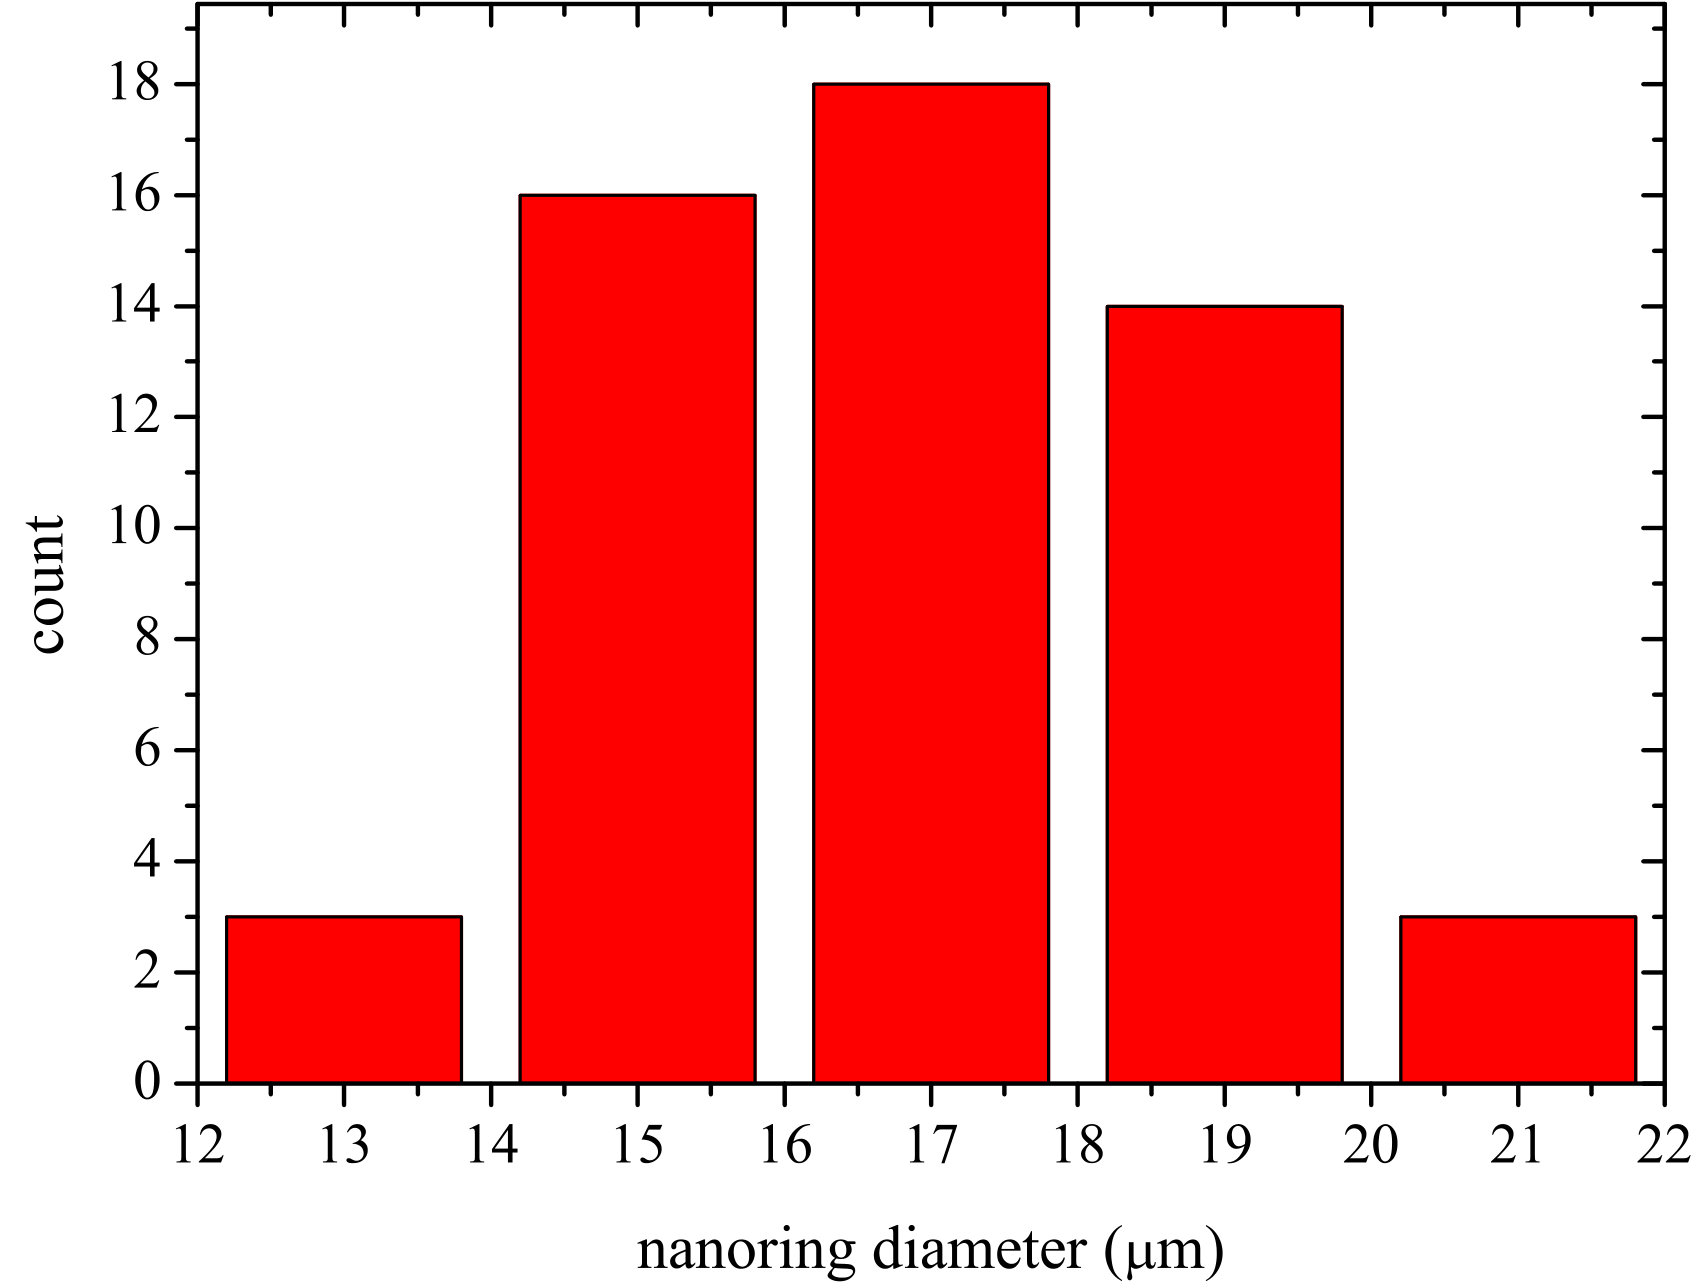 Figure 5
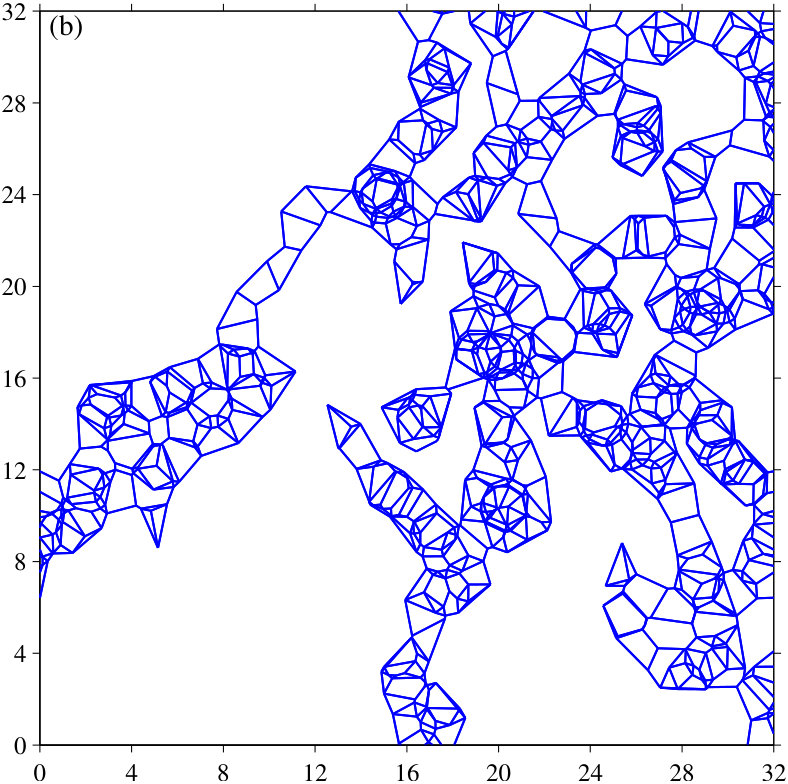 Figure 6
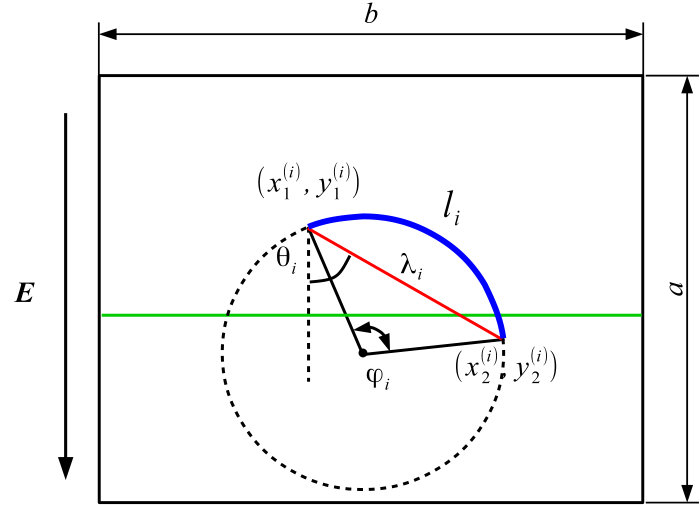 Figure 7
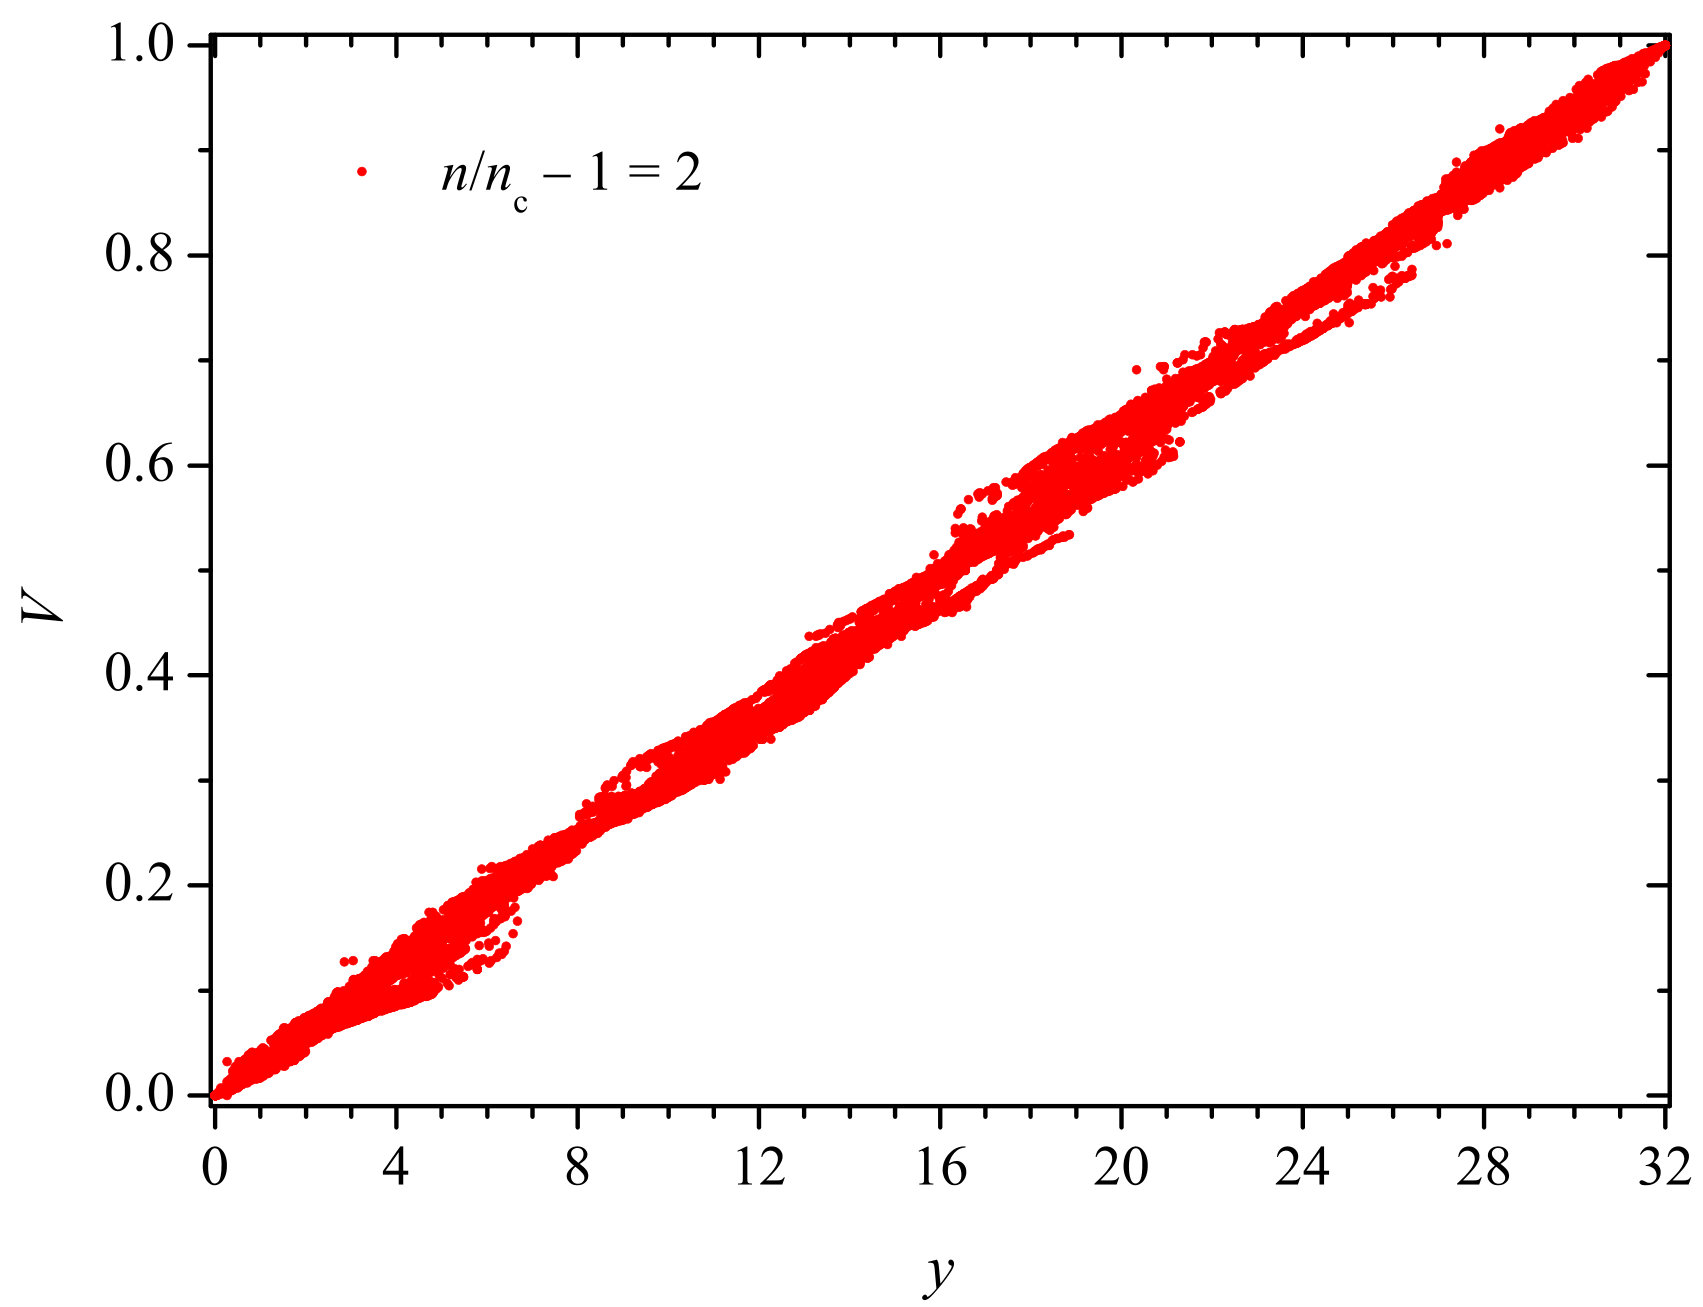 Figure 8
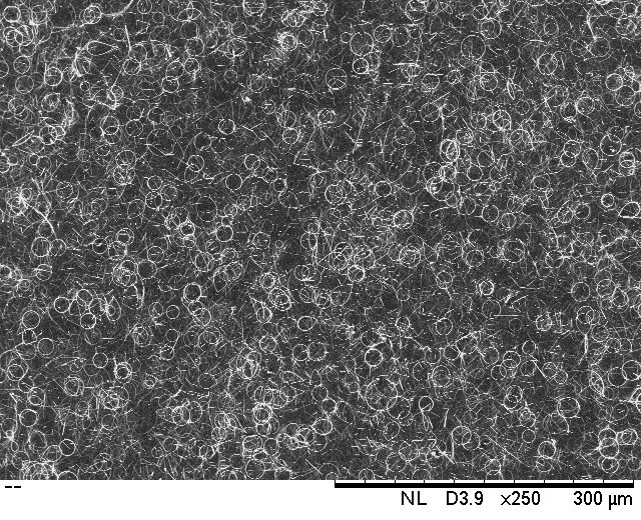 Figure 9
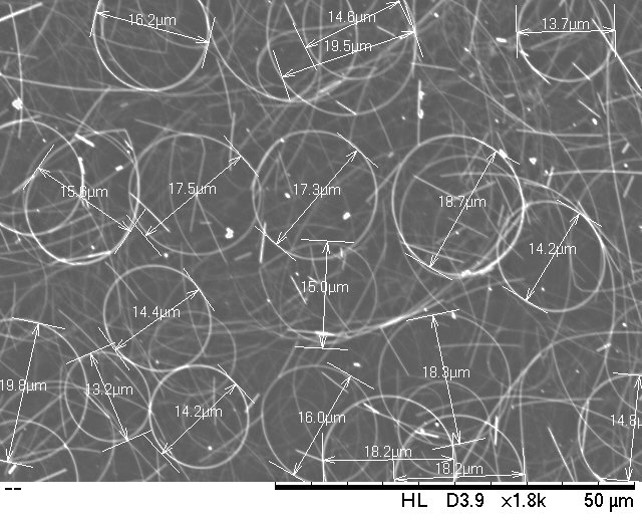 Figure 10
| Sample | Transparency (%) | Haze | ||
|---|---|---|---|---|
| 1 | 84 | 8 | 20 | 3.602 |
| 2 | 86 | 5.1 | 45 | 2.543 |
| 3 | 87 | 3 | 60 | 2.023 |
| 4 | 89 | 1.5 | 350 | 1 |
Peer Reviews
No public reviews on file for this paper yet. If you reviewed it on a platform where reviews are public (OpenReview, ICLR, NeurIPS, ICML), you can paste yours below so the community can read it here.
Videos
No videos yet. Explain this paper in a talk, walkthrough, or lecture? Add one.
Transparent electrodes with nanorings: a computational point of view
Mohammad-Reza Azani
Azin Hassanpour
Department of Research and Development, Intercomet S.L. Calle Cañada, 15, 28860 Paracuellos de Jarama, Madrid, Spain
Yuri Yu. Tarasevich
Irina V. Vodolazskaya
Andrei V. Eserkepov
Laboratory of Mathematical Modeling, Astrakhan State University, Astrakhan, 414056, Russia
Abstract
Four samples of transparent conductive films with different numbers of silver nanorings per unit area were produced. The sheet resistance, transparency, and haze were measured for each sample. Using Monte Carlo simulation, we studied the electrical conductivity of random resistor networks produced by the random deposition of the conducting rings onto the substrate. Both systems of equal-sized rings, and systems with rings of different sizes were simulated. Our simulations demonstrated the linear dependence of the electrical conductivity on the number of rings per unit area. Size dispersity decreased the percolation threshold, but without having any other significant effect on the behavior of the electrical conductance. Analytical estimations obtained for dense systems of equal-sized conductive rings were consistent with the simulations.
I Introduction
Transparent electrodes are used in a range of different electronic devices such as touch screens, displays, and solar cells. Recent advances in nano-materials research have offered new, transparent conductive materials, e.g., carbon nanotubes (CNTs), graphene, metal nanowires (NWs), and printable metal grids.Hecht, Hu, and Irvin (2011) In the case of CNTs and metal NWs, the concentration of conducting object should be large enough to ensure the occurrence of a conducting network connecting opposite borders of the film, i.e., the system has to be above the percolation threshold. Simultaneously, the concentration should be small enough to ensure high transparency of the film. These contradictory requirements have stimulated new research. To characterize both the sheet resistance, , and the transparency, , the figure of merit (FoM) is usedHaacke (1976)
[TABLE]
Numerous works have been devoted to the electrical and optical properties of transparent films with elongated fillers such as NTs, NWs, and nanorods.Yi, Berhan, and Sastry (2004); De et al. (2010); Heitz et al. (2011); Mutiso et al. (2013); Khanarian et al. (2013, 2013); Large et al. (2016); O’Callaghan et al. (2016); Kumar and Kulkarni (2016); Kumar, Vidhyadhiraja, and Kulkarni (2017); Kim and Nam (2018); Ainsworth, Derby, and Sampson (2018); Forró et al. (2018) However, the use of films containing conducting nanoringsLayani et al. (2009); Shimoni, Azoubel, and Magdassi (2014); Azani and Hassanpour (2018) looks extremely attractive since, in this case, there are no dead ends in the percolation cluster, i.e., the percolation cluster is identical to its geometrical backbone.
In a two-dimensional continuum percolation, the number density is defined as
[TABLE]
where is the number of objects randomly deposited onto a square substrate of size with periodic boundary conditions (PBC). The system is said to percolate when there exists a cluster of intersecting objects that spans the square.
When each object has area , the dimensionless quantity
[TABLE]
is called the filling factor. For zero-width sticks of length , the area is assumed to be . In the thermodynamic limit , the probability that a percolating cluster appears depends only on the filling factor. The percolation threshold for zero-width sticks is while the percolation threshold for discs is .Mertens and Moore (2012) The transparency [see, e.g., Ref. Yi, Berhan, and Sastry, 2004] of a film is proportional to the expected fraction of the film not covered by objects
[TABLE]
II Methods
II.1 Sampling
The samples were prepared exactly as in Ref. Azani and Hassanpour, 2018. The suspension of 0.003 mg/ml of purified silver nanorings in ethanol was prepared and shacken for 1 h using an orbital shaker in order to obtain a uniform suspension. Samples ( cm) of PET were cut and fixed onto a pre-heated heater at 100 ∘C using high-heat resistance adhesive tape (to prevent the “coffee ring effect” during spraying). Spray coating of the nanoring suspension was carried out using a DH-115 SPARMAX airbrush with a nozzle size of 0.35 mm and a 7 ml side feed fluid cup. This spray operates at a pressure of 0.18 to 0.20 MPa. Four transparent conductive films with different sheet resistances were prepared [Table 1]. SEM images were taken using a Hitachi Tabletop microscope (model TM3030) with a magnification range of 15 to 30000 V. The microscope has a pre-centered cartridge filament as an electron gun and a high-sensitivity semiconductor 4-segment BSE detector as its single detection system. This system operates at room temperature in ambient air conditions. The images were processed using the TM3030 software. Optical parameters (haze and transparency) were measured with haze-gard i from BYK, according to illuminants of ASTM-D1003.
In addition to the rings, a small number of rods were present in the samples [figure 1]. These rods were ignored both in our theoretical consideration and in the simulation.
The size dispersity of the rings can be clearly seen [figure 2].
II.2 Simulation
The rings were randomly deposited onto a substrate of size with PBC until the desired number density was reached [figure 3]. To detect a spanning cluster, the Union–Find algorithmNewman and Ziff (2000, 2001) modified for continuous systemsMertens and Moore (2012); Li and Zhang (2009) was applied. When a spanning cluster was found, all other clusters were removed since they do not contribute in the electrical conductivity. Then, an adjacency matrix was formed for the spanning cluster, treated as a random weighted graph. This graph is a multigraph since any two vertices (intersections of two circles) may be connected by more than one edge (arc of a circle). When the length of the -th arc connecting the -th and -th vertices is , the weight of the corresponding edge can be taken as . To simplify the consideration, each multiple edge was replaced by a single edge with an effective weight . This adjacency matrix was treated as the conductance matrix of a random resistor network (RRN). Then, Kirchhoff’s current law was applied to each ring junction, and Ohm’s law used for each circuit between two junctions. The resulting set of equations was solved using MATLAB to find the total conductance of the RRN. We ignored any contact resistance in the junctions between rings. The relative number density
[TABLE]
was used, where is the critical number density, i.e., the number density corresponding to the percolation threshold. The electrical conductivities for each particular value of the relative number density were averaged over 10 independent runs and in two mutually perpendicular directions. Two different kinds of systems were simulated, i.e., systems of equal-sized rings and systems of rings with size dispersity. To mimic the real distribution of radii [figure 2], the beta distribution with probability density function
[TABLE]
was used, where and are the adjusting parameters, and is the beta function.
We performed computations for systems of different sizes, viz., , and . Since the electrical conductivity depended only weakly on the system size, we present the results for only one particular system size .
III Results
III.1 Simulation
Figure 4 demonstrates the dependencies of the electrical conductance on the relative number density for films with equal-sized rings and for films with rings of different sizes. In the both cases, linear growth of the electrical conductance could be observed. A slight deviation from the linear behavior presents only in the vicinity of the percolation threshold. The size dispersity of the rings decreases the percolation threshold, . This is the sole reason why the two lines have different slopes (while have the same slopes but different intercepts).
Figure 5 evidences that a linear change of potential along a sample can be observed even in not very dense systems. When the number density of rings is three times more than the critical number density, the potential changes almost linearly.
Figure 6 demonstrates the arc distribution in one particular sample with equal-sized rings at . The distribution obeys exponential decay. Mainly, only short arcs () are present. Note that , hence, for dense systems, .
III.2 Analytical consideration
A geometrical consideration for dense networks of curved and waved wiresKumar and Kulkarni (2016) can directly be adapted for a dense system of rings. Let us consider a rectangular insulating film of size . Conducting rings are randomly deposited onto the film. All rings are assumed to belong to the percolation cluster. This assumption is supported by our simulation, viz., 0.9 of all rings belong to the percolation cluster when at the percolation threshold, while this fraction increases to 0.998 when . The potential difference is applied to the opposite borders of the sample [figure 7]. The simulations evidence that, when the number density of rings is high, the potential drop along the sample is linear [figure 5].
We have restricted ourselves to consideration of the simplest case where all the rings have the same radius and the cross-sectional areas of the ring-forming wires are equal and small. Let us consider an arc between two points of intersection of two rings [figure 7]. The potential difference between two junctions is proportional to the length of the projection of the chord between these junctions onto the direction of the electrical field
[TABLE]
The electrical conductance of the arc is inversely proportional to its length, ,
[TABLE]
where is the cross-sectional area of the ring-forming wire, and is the electrical conductivity of the wire. The electrical current through the arc is
[TABLE]
The total electrical current through the sample is
[TABLE]
where the summation goes over all those arcs intersecting a horizontal line. The resistance of the film is
[TABLE]
while the sheet resistance is
[TABLE]
Arc orientations are expected to be equiprobable and independent on the arc length. This assumption is supported by our simulation with high precision. Moving from summation to integration,
[TABLE]
where is the central angle corresponding to the arc and is the probability density function (PDF) of the arc lengths. Since the length of the arc is and the length of the chord is
[TABLE]
When the distance between a ring center and the horizontal line in Figure 7 does not exceed , this ring is intersected by the line. On average, a horizontal line intersects circles. Each circle is intersected twice.
Assuming a dense system, i.e. where all arcs are short, each intersection corresponds to an individual arc, and the total number of intersected arcs is . Hence,
[TABLE]
Therefore, the sheet resistance is
[TABLE]
This formula suggests that the reciprocal of sheet resistance, i.e., the sheet conductance, is a linear function of the number of rings per unit area
[TABLE]
Using the relative number density (5), the sheet conductance can be written as
[TABLE]
Our simulations were performed for . For systems of equal-sized rings, and [figure 4]. Our analytical estimation (7) suggests . However, in the vicinity of the percolation threshold (), the analytical estimation can hardly be treated as reliable since the basic assumptions do not hold. A difference in slopes is not yet clear since any obvious improvements to the estimations only enlarges this difference.
Note that the expected fraction of the film no covered by rings [Eq. (4)], i.e., the transparency of the film, is
[TABLE]
where is the diameter of the ring-forming wire. The FoM (1) in our particular case is
[TABLE]
corresponds to the maximal value of the FoM.
IV Conclusion
Sheet resistance, transparency, and haze were measured for four samples of transparent conductive films with different numbers of silver nanorings per unit area. Using a Monte Carlo simulation, we studied the electrical conductivity of random resistor networks, obtained by the random deposition of the conductive rings onto an insulating substrate. Our simulation demonstrated a linear dependence of the electrical conductivity on the number of rings per unit area both in the case of equal-sized rings and in the case of rings with size dispersity. While the size dispersity decreased the percolation threshold, the electrical conductance was insensitive to such dispersity. Analytical estimation of the sheet resistance has been derived for dense systems and the estimation is reasonably consistent with the simulation.
Unfortunately, a direct comparison of experimental and simulation results is hardly possible, since the real samples contain both nanorings and nanowires. Nevertheless, an estimation can be performed. The formula , where is the bare transparency of the substrate, allows an estimate of the effective concentration of nanoobjects in a sample.
Figure 8 demonstrates the dependence of the electrical conductivity of the samples on the effective number density of the nanorings and nanowires. Figure 8 can be treated as reasonably close to both the simulation and the analytical consideration. The effective number density is calculated as [the last column in Table 1].
Theoretical predictions suggest that nanoring-based films are very attractive candidates for the production of transparent electrodes. The linear dependence of the electrical conductance on the number density of conductive nanorings allows for easy prediction of the electrical conductance of any sample. The absence of dead ends in such ring-produced RRNs leads to an efficient use of the conducting elements. However, the manufacturing of pure nanoring-based samples without nanowire admixtures is still a problem requiring resolution..
Acknowledgements.
We would like to acknowledge funding from the Ministry of Science and Higher Education of the Russian Federation, Project No. 3.959.2017/4.6 (Y.Y.T., I.V.V., and A.V.E.), from Intercomet S.L. and from the Ministry of Science, Innovation and Universities of Spain for the sub-program Torres Quevedo and CDTI (M.-R.A. and A.H.).
The reference list from the paper itself. Each links out to its DOI / PubMed record.
- 1Hecht, Hu, and Irvin (2011) D. S. Hecht, L. Hu, and G. Irvin, Adv. Mat. 23 , 1482 (2011) . · doi ↗
- 2Haacke (1976) G. Haacke, J. Appl. Phys. 47 , 4086 (1976) . · doi ↗
- 3Yi, Berhan, and Sastry (2004) Y. B. Yi, L. Berhan, and A. M. Sastry, J. Appl. Phys. 96 , 1318 (2004) . · doi ↗
- 4De et al. (2010) S. De, P. J. King, P. E. Lyons, U. Khan, and J. N. Coleman, ACS Nano 4 , 7064 (2010) . · doi ↗
- 5Heitz et al. (2011) J. Heitz, Y. Leroy, L. Hébrard, and C. Lallement, Nanotechnology 22 , 345703 (2011) . · doi ↗
- 6Mutiso et al. (2013) R. M. Mutiso, M. C. Sherrott, A. R. Rathmell, B. J. Wiley, and K. I. Winey, ACS Nano 7 , 7654 (2013) . · doi ↗
- 7Khanarian et al. (2013) G. Khanarian, J. Joo, X.-Q. Liu, P. Eastman, D. Werner, K. O’Connell, and P. Trefonas, J. Appl. Phys. 114 , 024302 (2013) . · doi ↗
- 8Large et al. (2016) M. J. Large, J. Burn, A. A. King, S. P. Ogilvie, I. Jurewicz, and A. B. Dalton, Sci. Rep. 6 , 25365 (2016) . · doi ↗