The Ophiuchus DIsk Survey Employing ALMA (ODISEA): Disk Dust Mass Distributions across Protostellar Evolutionary Classes
Jonathan P. Williams, Lucas Cieza, Antonio Hales, Megan Ansdell, Dary, Ruiz-Rodriguez, Simon Casassus, Sebastian Perez, Alice Zurlo

TL;DR
This study uses ALMA observations to measure and analyze the dust mass distribution in 279 protostellar disks in the Ophiuchus region, revealing a trend of decreasing mass with evolution but also significant overlap and environmental influences.
Contribution
First comprehensive ALMA-based survey of disk dust masses across protostellar classes in Ophiuchus, highlighting the complex evolution and environmental effects on disk mass.
Findings
Disk masses follow a log-normal distribution with decreasing mean from Class I to II.
High dispersion causes significant overlap between classes.
Environmental factors may influence initial disk mass and dust regeneration.
Abstract
As protostars evolve from optically faint / infrared bright (Class I) sources to optically bright / infrared faint (Class II) the solid material in their surrounding disks accumulates into planetesimals and protoplanets. The nearby, young Ophiuchus star-forming region contains hundreds of protostars in a range of evolutionary states. Using the Atacama Large Millimeter Array to observe their millimeter continuum emission, we have measured masses of, or placed strong upper limits on, the dust content of 279 disks. The masses follow a log-normal distribution with a clear trend of decreasing mass from less to more evolved protostellar infrared class. The (logarithmic) mean Class I disk mass, M = 3.8 M_Earth, is about 5 times greater than the mean Class II disk mass, but the dispersion in each class is so high, sigma(logM) ~ 0.8-1, that there is a large overlap between the two distributions.…
Click any figure to enlarge with its caption.
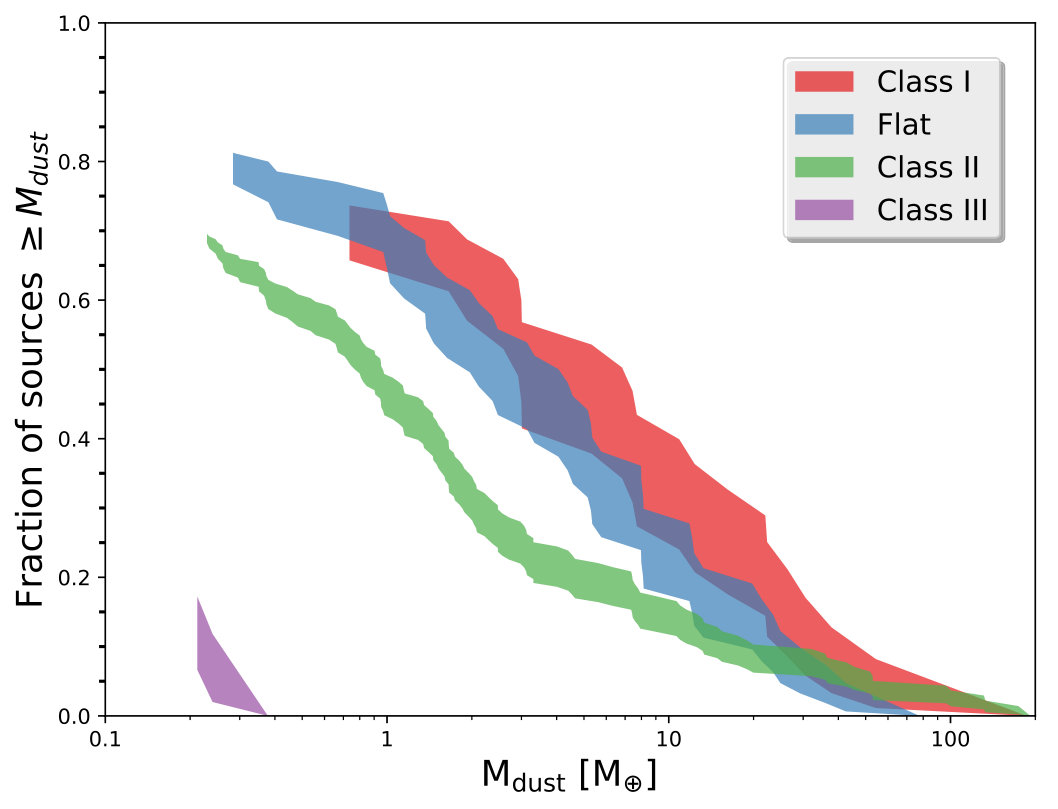 Figure 1
 Figure 2
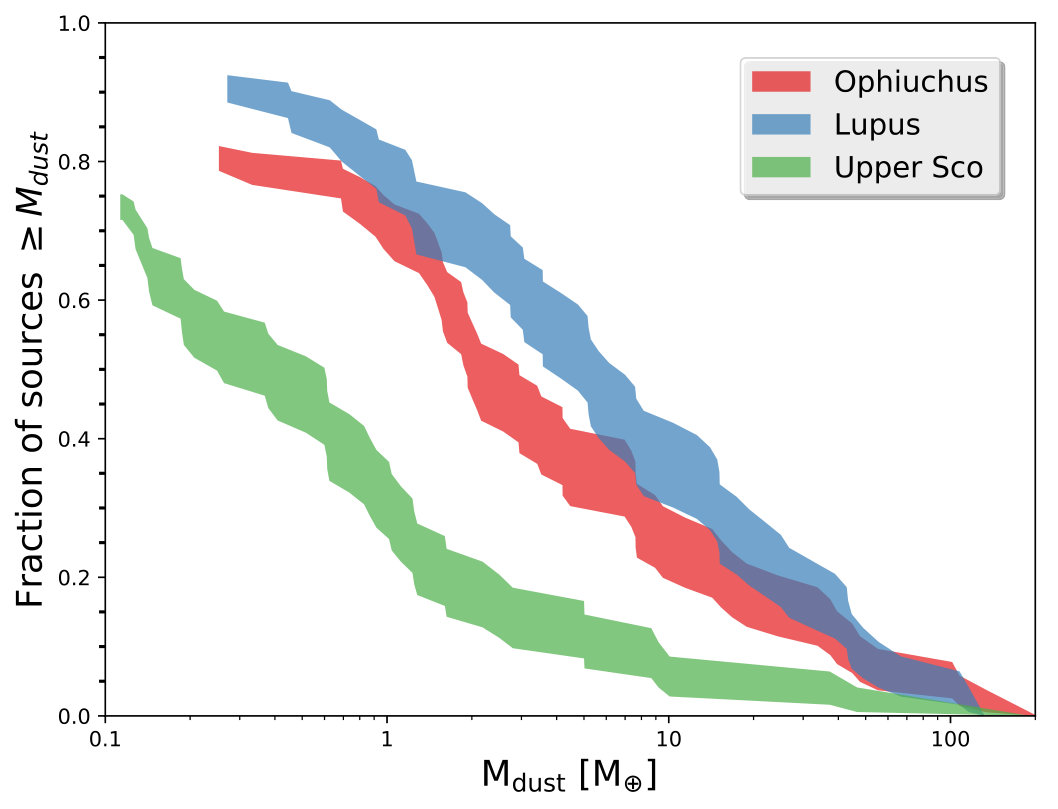 Figure 3
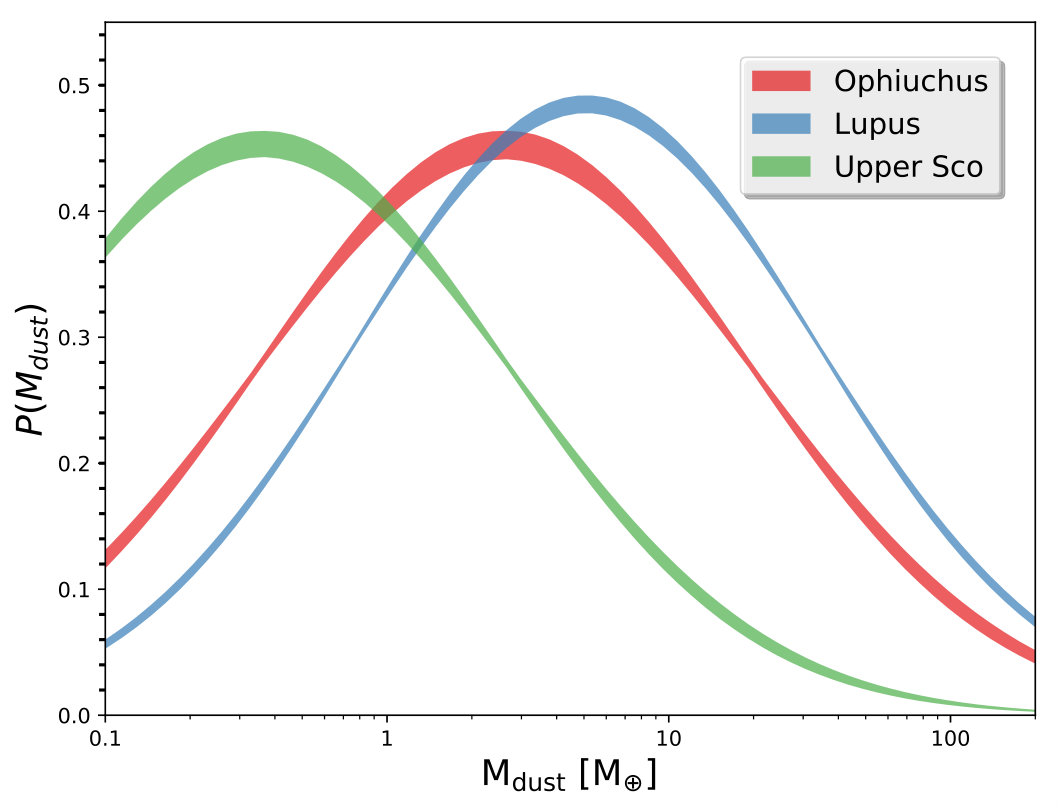 Figure 4
| Spitzer ID | Class | |||||
|---|---|---|---|---|---|---|
| (SSTc2d +) | (pc) | (mJy) | (mJy) | (∘) | (∘) | |
| J162034.2-242613 | II | 139.40 | 0.22 | 0.11 | … | … |
| J162118.5-225458 | II | 138.97 | 3.26 | 0.13 | 245.32696 | -22.91624 |
| J162131.9-230140 | II | 137.00 | 4.60 | 0.16 | 245.38302 | -23.02800 |
| J162138.7-225328 | I | 139.40 | 0.17 | 0.20 | … | … |
| J162142.0-231343 | II | 138.94 | 1.75 | 0.11 | 245.42493 | -23.22884 |
| YSO Class | N | aaThe fits are for a gaussian in the logarithm of the mass with mean value . | |
|---|---|---|---|
| I | 28 | ||
| Flat | 50 | ||
| II | 172 |
| Region | Age (Myr) | ||
|---|---|---|---|
| Ophiuchus | |||
| Lupus | |||
| Upper Scorpius |
Peer Reviews
No public reviews on file for this paper yet. If you reviewed it on a platform where reviews are public (OpenReview, ICLR, NeurIPS, ICML), you can paste yours below so the community can read it here.
Videos
No videos yet. Explain this paper in a talk, walkthrough, or lecture? Add one.
The Ophiuchus DIsk Survey Employing ALMA (ODISEA): Disk Dust Mass Distributions across Protostellar Evolutionary Classes
Institute for Astronomy, University of Hawaii, Honolulu, HI 96822, USA
Lucas Cieza
Facultad de Ingenieria y Ciencias, Nucleo de Astronomia, Universidad Diego Portales, Av. Ejercito 441. Santiago, Chile
Antonio Hales
Joint ALMA Observatory, Alonso de Cordova 3107, Vitacura 763-0355, Santiago, Chile
Megan Ansdell
Astronomy Department, University of California, Berkeley, CA 94720, USA
Dary Ruiz-Rodriguez
Chester F. Carlson Center for Imaging Science, Rochester Institute of Technology, Rochester, NY 14623-5603, USA
Simon Casassus
Departamento de Astronomia, Universidad de Chile, Casilla 36-D Santiago, Chile
Sebastian Perez
Departamento de Astronomia, Universidad de Chile, Casilla 36-D Santiago, Chile
Alice Zurlo
Facultad de Ingenieria y Ciencias, Nucleo de Astronomia, Universidad Diego Portales, Av. Ejercito 441. Santiago, Chile
(Received 3/4/2019; Accepted 3/25/2019)
Abstract
As protostars evolve from optically faint / infrared bright (Class I) sources to optically bright / infrared faint (Class II) the solid material in their surrounding disks accumulates into planetesimals and protoplanets. The nearby, young Ophiuchus star-forming region contains hundreds of protostars in a range of evolutionary states. Using the Atacama Large Millimeter Array to observe their millimeter continuum emission, we have measured masses of, or placed strong upper limits on, the dust content of 279 disks. The masses follow a log-normal distribution with a clear trend of decreasing mass from less to more evolved protostellar infrared class. The (logarithmic) mean Class I disk mass, , is about 5 times greater than the mean Class II disk mass, but the dispersion in each class is so high, , that there is a large overlap between the two distributions. The disk mass distribution of flat-spectrum protostars lies in between Classes I and II. In addition, three Class III sources with little to no infrared excess are detected with low disk masses, . Despite the clear trend of decreasing disk mass with protostellar evolutionary state in this region, a comparison with surveys of Class II disks in other regions shows that masses do not decrease monotonically with age. This suggests that the cloud-scale environment may determine the initial disk mass scale or that there is substantial dust regeneration after 1 Myr.
protoplanetary disks – stars: pre-main sequence – submillimeter: general
††journal: ApJ Letters††facilities: ALMA††software: astropy (Astropy Collaboration et al., 2013)
1 Introduction
Stars form from the gravitational collapse of dense cores in dusty molecular clouds. As the obscuring dust is used up or otherwise dispersed, the progression from embedded protostar to pre-main-sequence star can be followed through the shift in the peak of the spectral energy distribution (SED) from the far-infrared to optical. The spectral slope from 2 to m provides the most commonly used classification, beginning with rising Class I, through Flat Spectrum, to decreasing Class II, and finally Class III with weak or no infrared excesses. The star has almost reached its final mass by the Class I phase, within years after the onset of collapse (Kristensen & Dunham, 2018), but the remaining mass in the accompanying circumstellar disk and how that evolves through the Classes as planets form over the next several Myr is not known.
The material content in these small, cold, planet-forming disks is best measured using high-resolution millimeter wavelength observations. The Atacama Large Millimeter Array (ALMA) has the imaging speed and sensitivity to carry out complete surveys of disks in nearby star-forming regions, providing the essential millimeter wavelength counterpart to previous infrared surveys. However, the majority of ALMA disk measurements have been of Class II sources since they are much more numerous than the short-lived Class I phase and very little material remains in the later Class III phase (Hardy et al., 2015). To follow disk mass evolution requires a large survey of a star-forming region with the right age to contain a mix of many protostars in all evolutionary classes.
The Ophiuchus region is ideally suited on account of its proximity, youth, and size ( pc, Myr, and protostars). Here, we discuss the Ophiuchus DIsk Survey Employing ALMA (ODISEA) project, a complete survey of the millimeter continuum and CO line emission from all the protostars identified in the Spitzer “Cores to Disks” Legacy project (Evans et al., 2009). The survey and first results are described in Cieza et al. (2019, hereafter Paper I). In this Letter, we describe the completion of the initial survey and its vetting with the Gaia mission. We calculate disk masses and compare their distributions across protostellar classes, revealing their evolution with more clarity than before. We find that disk masses decline from Class I to Class II, smoothly through the intermediate Flat Spectrum stage. However, this seemingly simple picture of monotonic evolution is complexified by a comparison with other regions, which shows that Ophiuchus Class II disks have slightly, but significantly, lower masses than the slightly older Lupus region. We conclude with a discussion of these results and their implications for planet formation.
2 Observations
The full set of 289 sources in the ODISEA sample was observed in two samples, A and B, with 147 and 142 sources each. Paper I describes the full sample selection and the observations of sample A, consisting of Class I, Flat Spectrum, and bright ( mag) Class II sources. Here, we augment those data with the observations of sample B, consisting of the fainter ( mag) Class II and Class III sources in the same Cycle 4 ALMA program 2016.1.00545.S.
The observations of sample B were carried out in ALMA Band 6 with 40 antennas in the C40-3 array configuration (15 to 500 m baselines) on 2018 May 2nd, and August 20th and 21st. The precipitable water vapor was 2.15, 0.95, and 1.43 mm, respectively with corresponding average system temperatures of 122, 98, and 109 K. The correlator was configured in the same way as for sample A, with a total continuum bandwidth of 7.3 GHz centered at 225.4 GHz ( mm). There were also three higher spectral resolution windows centered on the transition of CO, 13CO, and C18O. These lines constrain the disk gas content and will be discussed in a future paper of the ODISEA series.
The visibilities were calibrated using the standard data pipeline scripts using version 5.3.0 of the CASA software package. The gain and bandpass calibrators were J1625-2527, J1517-2422, and J1924-2914. The flux scale was referenced to J1733-1304 and J1517-2422 and has an uncertainty of 10%. Each of the 142 sources was observed for a total of 54 seconds. Continuum images were created using the task tclean and inspected for multiplicity. The beam size was similar for all sources, at a position angle of , about four times larger than for sample A due to the more compact configuration. The expectation (which was realized) was that the disk fluxes in this sample would be lower due to their more evolved state and the lower stellar masses, and the lower resolution was chosen to ensure high mass sensitivity independent of disk size. All but three sources were indeed unresolved and only one millimeter binary was found. Photometry was carried out for the rest of the sample by fitting a point source to the visibilities using the task uvmodelfit. Total fluxes for the binary and resolved sources were measured using aperture photometry.
The distance to a source, , used to be a considerable source of error in determining disk and stellar properties but is now negligible thanks to the Gaia mission. Out of 289 sources in the original ODISEA sample, 169 have parallaxes () in the Data Release 2 catalog (Gaia Collaboration et al., 2018). 23 sources (4 Class II, 19 Class III) have mas which places them at a distance greater than 400 pc. We considered these to be background objects, probably red giants, and removed them from subsequent analysis (all are undetected in our ALMA observations). As in Manara et al. (2018), we set for those sources with since the inversion bias is very small in these cases (Bailer-Jones, 2015). For the 14 sources with larger fractional errors and the 106 with no measurement, we used a mean distance pc.
Finally, we removed a misclassified Class III source, J162119.2-234229, that was detected with a flux density mJy, but is actually a Be star (HD 147196). The ALMA measurements and Gaia distances for the final sample of 265 sources (279 disks after allowing for 12 binaries and one triple system) is listed in Table 1.
3 Disk Mass Distributions
The dust masses of the disks are calculated in the simplest way, under the assumption of optically thin emission throughout, with a uniform temperature, K, and opacity coefficient, . For a disk with flux density , this gives the standard formula,
[TABLE]
where is the Planck function. This approach is justified based on several reasons; most sources in the survey only have one millimeter wavelength flux measurement and are not well resolved; detailed radiative transfer modeling of ALMA disk images around protostars with similar luminosities as here find masses that are very similar to those derived from this equation (Tazzari et al., 2017); it allows the cleanest comparison of disks both within the large Ophiuchus sample and between surveys of other regions without adding uncertain effects from poorly constrained parameter variations. With that said, we return to the inherent assumptions and possible complexities in the discussion of the results in §4.
A disk was deemed to be detected by ALMA if the measured flux density was at least three times greater than the rms and the source position was within of the Spitzer coordinates. For nondetections, we set a mass upper limit for a flux density threshold of three times the rms. Cumulative mass distributions were then determined using survival analysis, which uses the constraints from upper limits in the data (Feigelson & Nelson, 1985). When plotted against the logarithm of the mass, we found that these were well fit by the integral of a gaussian indicating that the underlying probability distribution function is log-normal. To aid the visualization of the distributions, we therefore show both observed cumulative distributions with a range, and the corresponding range of gaussian fits to the probability distribution in the figures below.
3.1 Across Protostellar Evolutionary Classes
The dust mass distributions for each protostellar Class in Ophiuchus are plotted in Figure 1. For multiple systems, we have only included the primary disk as defined by the infrared brightness because the evolutionary state of the secondary (or tertiary) member is not known from the Spitzer data.
The cumulative distributions shift to lower masses as protostars evolve. However, the gaussian fits show that the mean Class I disk mass is only about a factor of 5 higher than that of Class II, a difference that is less than the standard deviation (Table 2). The upper quartile of Class II disks is more massive than the Class I mean and the large overlap is clear in the plot of the fitted probability distributions. Surprisingly, not all Class I or Flat Spectrum sources were detected despite a mass sensitivity of . In contrast, we detected three Class III sources with dust masses . This is not enough to strongly constrain the full distribution but suggests that more of these evolved disks may be detectable with a moderate increase in sensitivity.
Our results extend a recent ALMA survey of 49 Ophiuchus disks at m that was weighted toward Class II sources but which found higher average flux densities toward the small subset of Class I and Flat Spectrum objects in their sample (Cox et al., 2017). They also found that binaries have significantly lower flux densities. We have carried out high-resolution infrared imaging to identify and study the effect of multiplicity on disks and will discuss this in a future paper (Zurlo, A. et al. in preparation). There are 40 binaries in our sample, a small fraction of the total, and we found that omitting them from the disk distributions here did not significantly change the log-normal fits.
Tychoniec et al. (2018) found substantially higher disk masses for Class 0 and I sources in Perseus based on VLA 9 mm data. However, there can be significant free-free emission at these long wavelengths and the separation of the ionized gas and dust components is difficult. A comparison of the two regions at millimeter and centimeter wavelengths would help clarify the differences.
Andersen et al. (2019) and Tychoniec et al. (2018) derived disk masses for Class I sources in Perseus and found values that lie at the upper end of the Ophiuchus Class I distribution here (when differences in the conversion from flux to mass are taken into account). Their calculations require an extra step due, respectively, to lower resolution 1 mm data that blended disk and envelope emission and and longer wavelength 9 mm data that blended dust and free-free emission. A complete, millimeter survey at sub-arcsecond resolution is required to quantitatively compare the two regions.
3.2 Across Star-Forming Regions
ALMA has now surveyed the Class II disk population in several star-forming regions. In Paper I, we found that the cumulative mass distribution for sample A was similar to disks in the Taurus and Lupus regions. However, about half of the Ophiuchus sources in that plot were Class I and Flat Spectrum sources and we showed above that these tend to have more massive disks than those around Class II. Furthermore, the Class II sources in sample A are brighter in K-band and the disk mass scales with stellar mass (Andrews et al., 2013). With the addition of sample B, we can now make a statistically fairer comparison of complete populations of Class II sources.
We show the Ophiuchus results in comparison with the ALMA surveys of the Lupus and Upper Scorpius regions because these are similarly sensitive to sub-Earth masses of dust and are complete or very nearly so. Both regions are at a similar distance to Ophiuchus but are older, pc and Myr for Lupus and pc and Myr for Upper Scorpius (Ansdell et al., 2018; Barenfeld et al., 2016). Disk masses were recalculated from the observed flux densities with the same uniform temperature and opacity prescription as in Equation 1. A proper comparison across regions requires accounting for possible differences in the host stars. Spectral types are not yet known for the full ODISEA sample (the analysis of optical and infrared spectra will be presented in a future paper in preparation by Ruiz-Rodriguez, D. et al. in preparation) so we use a m J-band magnitude cutoff of 12 mag to restrict the comparison to stars with masses estimated to be in Figure 2.
We now find that the Ophiuchus disks tend to have lower masses than those in Lupus. The change is not surprising given the bias toward more massive disks in sample A but the result upends the conventional wisdom that disk masses decline monotonically with the age of the star-forming region. The separation between the cumulative distributions is robust to different J-band (or K-band) magnitude cutoffs and is discussed in more detail below. Low disk masses were also recently reported in the similarly young Corona Australis region (Cazzoletti et al., 2019). The results of the gaussian fits to the cumulative distributions from different regions are provided in Table 3. The probability distributions are uniformly broad but the mean disk mass appears to start low, then increase, before decreasing at late times.
4 Discussion
The ODISEA project is the largest complete ALMA disk survey of a single region to date and provides an unprecedented view of the disk mass distribution across protostellar evolutionary states. We find that disks are more massive in the early Class I stage, and steadily decline through the Flat Spectrum to the Class II stage. However, the difference in the mean mass from Class I to Class II is only a factor of about 5 and the distributions have a large overlap. In general, the dust masses are very low: only 10% of Class I sources have dust masses greater than the estimated total in the solar system, (Hayashi, 1981); and over half are less massive than . Based on exoplanet demographics, disks have a “missing mass” problem, as noted on several occasions for Class II disks (most recently by Manara et al., 2018), and we now see that it extends to the young, embedded Class I phase.
We must therefore consider the validity of the assumptions about temperature, opacity coefficient, and optical depth in §3. The assumed temperature, 20 K, is already low and does not leave much room for increasing the mass. The beautiful high-resolution ALMA survey of Class II disks by Andrews et al. (2018a) shows that the optical depth at 225 GHz is generally less than one at au scales although there could be smaller, very high density concentrations (Andrews et al., 2018b). The opacity coefficient depends on size, mineralogy, and shape of the dust grains but does not vary by more than a factor of for all but the most extreme set of these parameters (Pollack et al., 1994). However, any such flux-to-mass conversions are ultimately limited to constraints on the mass of particles with sizes comparable to the observing wavelength and there is ample reason to expect considerable mass in much larger bodies at early times: for example, the existence of differentiated meteorites within Myr after the first solids in the solar system (Kruijer et al., 2017); the detection of a planet in a Class II disk (Johns-Krull et al., 2016); and its implicit assumption in planetary population synthesis models (Mordasini, 2018).
Despite their youth, the Ophiuchus Class II disks have slightly lower masses than Class II disks in the older Lupus region. A similar result was recently found for the comparably young Corona Australis region (Cazzoletti et al., 2019). Based on the systematic decline in dust masses from to 10 Myr (Ansdell et al., 2017), we would expect the Ophiuchus and Corona Australis disks to be more, not less, massive. Because disk masses also correlate with stellar mass, such comparisons between regions consider possible differences in the stellar sample. The stellar initial mass function is known to be quite universal (Offner et al., 2014) although there may be differences around the substellar boundary. We have used a simple near-infrared luminosity cutoff to stay above that limit and will explore this further as we learn more about the stellar properties across the full sample.
The inherently limited sample sizes restrict the statistical rigor with which evolutionary trends can be dissected by stellar mass and other parameters, but the low disk masses in the Myr old Ophiuchus and Corona Australis regions appear to be an inherent trait. One possibility is simply that disk masses depend on the local (cloud) environment where the stars form. Such differences do not, however, appear to manifest themselves in stellar properties such as mass distribution or binarity. A more speculative, though exciting, alternative is that the young Class II disks in Ophiuchus and Corona Australis are indeed protoplanetary with most of the mass in planetesimal and smaller sizes, and that the slightly older Class II disks in Lupus and Taurus might be closer to the peak of planet formation with Earth masses of second-generation dust produced as the disk is stirred up due to the aggregation of planetesimals into protoplanets.
Demographic studies such as these provide useful insights into disk evolution and planet formation. Nevertheless, as with exoplanet observations, it is important to go beyond a single measure of an object and to gather more information. An important next step will be higher resolution observations to measure sizes and structure, and to see how these vary with protostellar class, stellar mass, and from region to region.
J.P.W. thanks Ewine van Dishoeck for comments. L.C. was supported by CONICYT-FONDECYT grant number 1171246. A.Z. acknowledges support from the CONICYT + PAI/ Convocatoria nacional subvención a la instalación en la academia, convocatoria 2017 + Folio PAI77170087. This paper makes use of the following ALMA data: ADS/JAO.ALMA #2016.1.00545.S. ALMA is a partnership of ESO (representing its member states), NSF (USA), and NINS (Japan), together with NRC (Canada), NSC and ASIAA (Taiwan), and KASI (Republic of Korea), in cooperation with the Republic of Chile. The Joint ALMA Observatory is operated by ESO, AUI/NRAO, and NAOJ. The National Radio Astronomy Observatory is a facility of the National Science Foundation operated under cooperative agreement by Associated Universities, Inc.
The reference list from the paper itself. Each links out to its DOI / PubMed record.
- 1Andersen et al. (2019) Andersen, B. C., Stephens, I. W., Dunham, M. M., et al. 2019, Ap J, 873, 54
- 2Astropy Collaboration et al. (2013) Astropy Collaboration, Robitaille, T. P., Tollerud, E. J., et al. 2013, A&A, 558, A 33
- 3Andrews et al. (2018 a) Andrews, S. M., Huang, J., Pérez, L. M., et al. 2018, Ap J, 869, L 41
- 4Andrews et al. (2018 b) Andrews, S. M., Terrell, M., Tripathi, A., et al. 2018, Ap J, 865, 157
- 5Andrews et al. (2013) Andrews, S. M., Rosenfeld, K. A., Kraus, A. L., & Wilner, D. J. 2013, Ap J, 771, 129
- 6Ansdell et al. (2017) Ansdell, M., Williams, J. P., Manara, C. F., et al. 2017, AJ, 153, 240
- 7Ansdell et al. (2018) Ansdell, M., Williams, J. P., Trapman, L., et al. 2018, Ap J, 859, 21
- 8Bailer-Jones (2015) Bailer-Jones, C. A. L. 2015, PASP, 127, 994