Antiferromagnetic Stacking of Ferromagnetic Layers and Doping Controlled Phase Competition in Ca$_{1-x}$Sr$_{x}$Co$_{2-y}$As$_{2}$
Bing Li, Y. Sizyuk, N. S. Sangeetha, J. M. Wilde, P. Das, W. Tian, D., C. Johnston, A. I. Goldman, A. Kreyssig, P. P. Orth, R. J. McQueeney, B. G., Ueland

TL;DR
This study investigates the magnetic phase transitions in Ca$_{1-x}$Sr$_{x}$Co$_{2-y}$As$_{2}$, revealing a complex interplay of 1D magnetic frustration, stacking variations, and doping effects through neutron diffraction and theoretical modeling.
Contribution
It uncovers the role of 1D magnetic frustration and stacking variations in the magnetic phase diagram of Ca$_{1-x}$Sr$_{x}$Co$_{2-y}$As$_{2}$, combining experimental data with classical analytical calculations.
Findings
Identification of x-dependent magnetic transitions.
Evidence for 1D magnetic frustration between layers.
Explanation of magnetic order changes via a 1D Heisenberg model.
Abstract
In search of a quantum phase transition between the two-dimensional (D) ferromagnetism of CaCoAs and stripe-type antiferromagnetism in SrCoAs, we rather find evidence for D magnetic frustration between magnetic square Co layers. We present neutron diffraction data for CaSrCoAs that reveal a sequence of -dependent magnetic transitions which involve different stacking of D ferromagnetically-aligned layers with different magnetic anisotropy. We explain the -dependent changes to the magnetic order by utilizing classical analytical calculations of a D Heisenberg model where single-ion magnetic anisotropy and frustration of antiferromagnetic nearest- and next-nearest-layer exchange are all composition dependent.
Click any figure to enlarge with its caption.
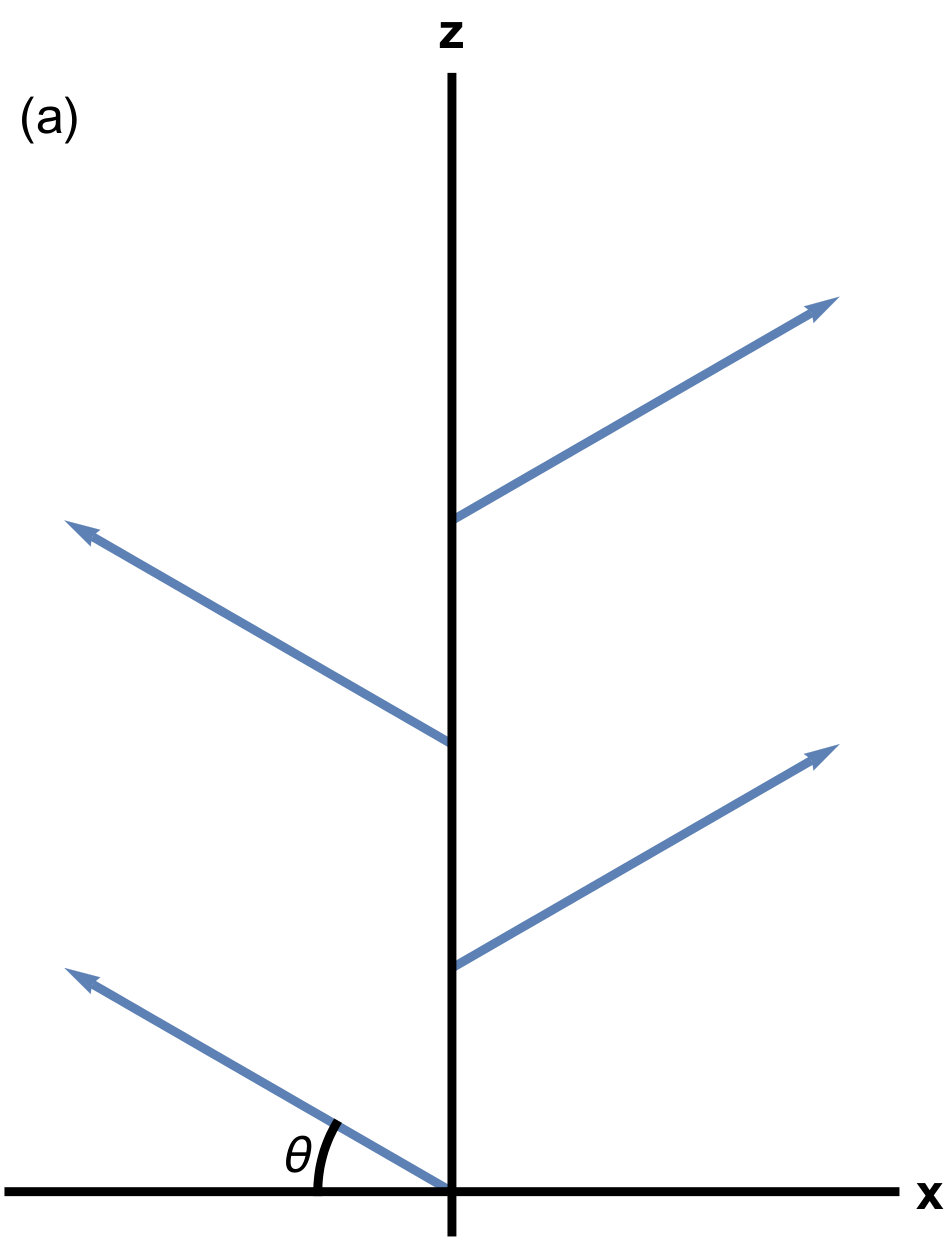 Figure 1
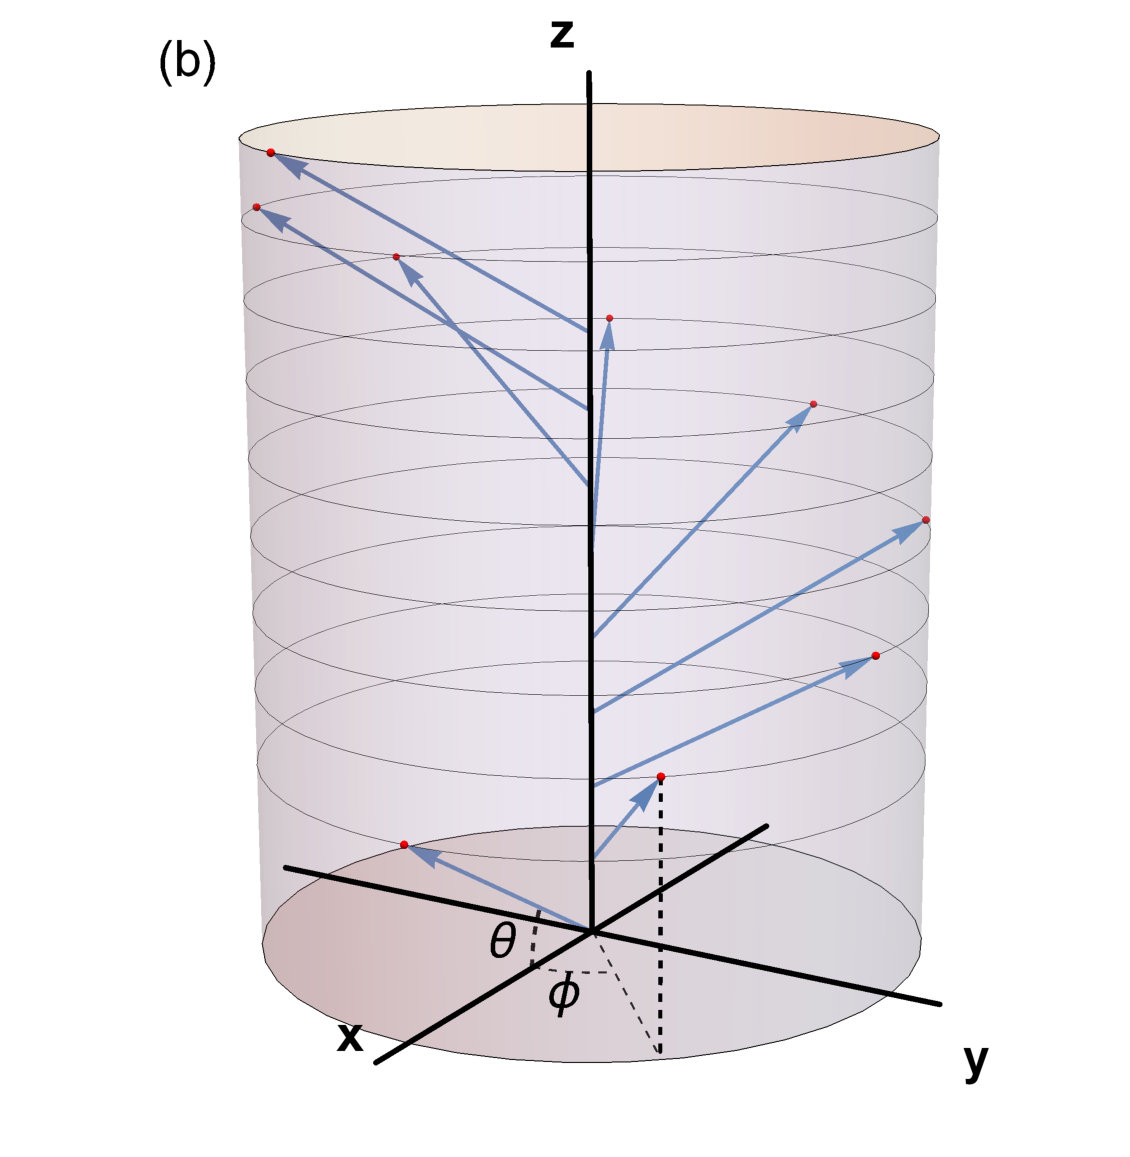 Figure 2
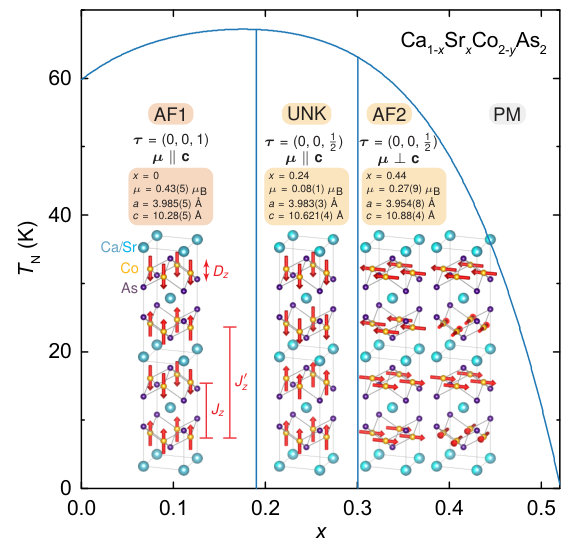 Figure 1
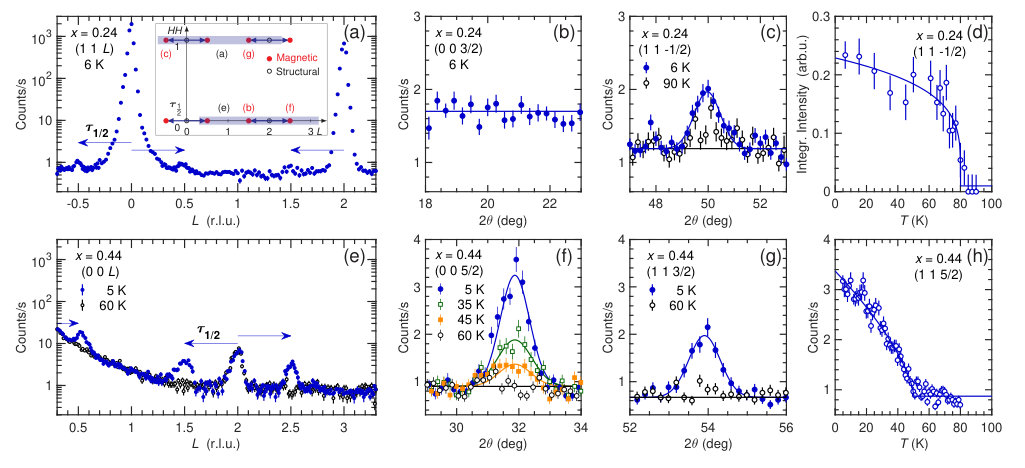 Figure 2
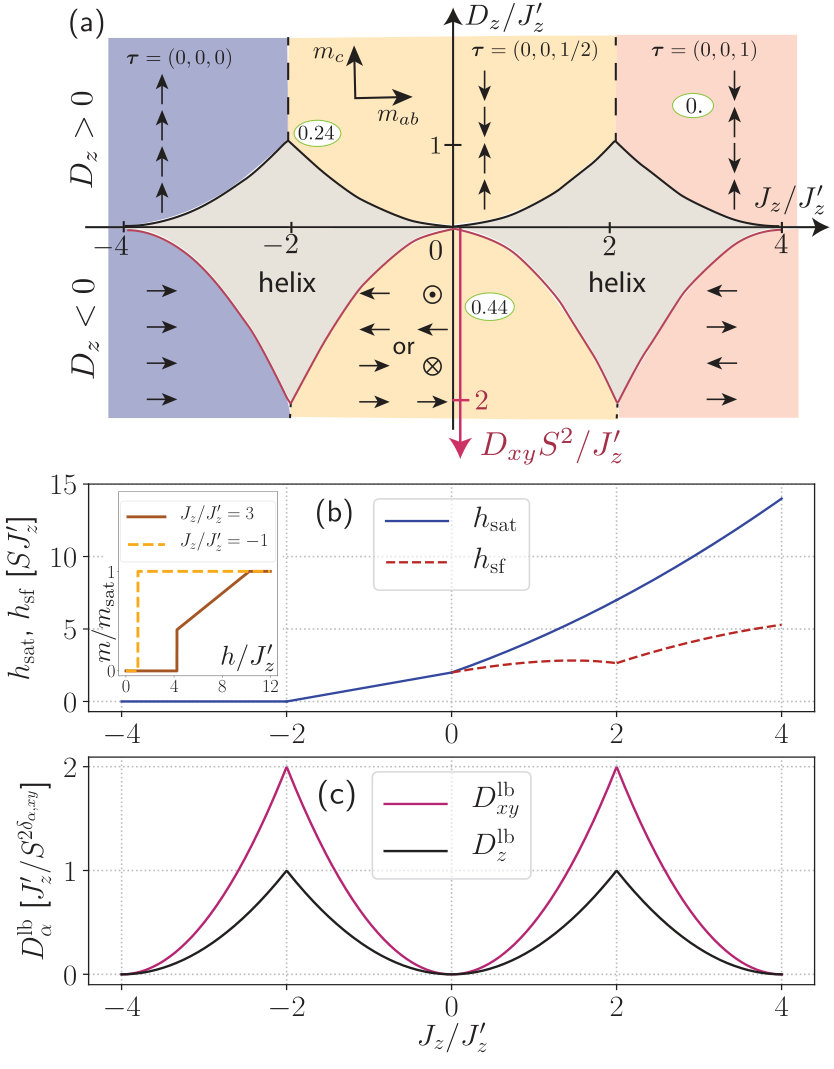 Figure 5
Peer Reviews
No public reviews on file for this paper yet. If you reviewed it on a platform where reviews are public (OpenReview, ICLR, NeurIPS, ICML), you can paste yours below so the community can read it here.
Videos
No videos yet. Explain this paper in a talk, walkthrough, or lecture? Add one.
Present Address: ]Institute for Shock Physics, Washington State University, Pullman, WA 99164, USA
Antiferromagnetic Stacking of Ferromagnetic Layers and Doping Controlled Phase Competition in Ca1-xSrxCo2-yAs2
Bing Li
Ames Laboratory, U.S. DOE, Iowa State University, Ames, Iowa 50011, USA
Department of Physics and Astronomy, Iowa State University, Ames, Iowa 50011, USA
Y. Sizyuk
Ames Laboratory, U.S. DOE, Iowa State University, Ames, Iowa 50011, USA
Department of Physics and Astronomy, Iowa State University, Ames, Iowa 50011, USA
N. S. Sangeetha
Ames Laboratory, U.S. DOE, Iowa State University, Ames, Iowa 50011, USA
J. M. Wilde
Ames Laboratory, U.S. DOE, Iowa State University, Ames, Iowa 50011, USA
Department of Physics and Astronomy, Iowa State University, Ames, Iowa 50011, USA
P. Das
[
Ames Laboratory, U.S. DOE, Iowa State University, Ames, Iowa 50011, USA
Department of Physics and Astronomy, Iowa State University, Ames, Iowa 50011, USA
W. Tian
Neutron Scattering Division, Oak Ridge National Laboratory, Oak Ridge, TN 37831, USA
D. C. Johnston
Ames Laboratory, U.S. DOE, Iowa State University, Ames, Iowa 50011, USA
Department of Physics and Astronomy, Iowa State University, Ames, Iowa 50011, USA
A. I. Goldman
Ames Laboratory, U.S. DOE, Iowa State University, Ames, Iowa 50011, USA
Department of Physics and Astronomy, Iowa State University, Ames, Iowa 50011, USA
A. Kreyssig
Ames Laboratory, U.S. DOE, Iowa State University, Ames, Iowa 50011, USA
Department of Physics and Astronomy, Iowa State University, Ames, Iowa 50011, USA
P. P. Orth
Ames Laboratory, U.S. DOE, Iowa State University, Ames, Iowa 50011, USA
Department of Physics and Astronomy, Iowa State University, Ames, Iowa 50011, USA
R. J. McQueeney
Ames Laboratory, U.S. DOE, Iowa State University, Ames, Iowa 50011, USA
Department of Physics and Astronomy, Iowa State University, Ames, Iowa 50011, USA
B. G. Ueland
Ames Laboratory, U.S. DOE, Iowa State University, Ames, Iowa 50011, USA
Department of Physics and Astronomy, Iowa State University, Ames, Iowa 50011, USA
Abstract
In search of a quantum phase transition between the two-dimensional (D) ferromagnetism of CaCo2-yAs2 and stripe-type antiferromagnetism in SrCo2As2, we instead find evidence for D magnetic frustration between magnetic square Co layers. We present neutron diffraction data for Ca1-xSrxCo2-yAs2 that reveal a sequence of -dependent magnetic transitions which involve different stacking of D ferromagnetically-aligned layers with different magnetic anisotropy. We explain the -dependent changes to the magnetic order by utilizing classical analytical calculations of a D Heisenberg model where single-ion magnetic anisotropy and frustration of antiferromagnetic nearest- and next-nearest-layer exchange interactions are all composition dependent.
I INTRODUCTION
The -type cobalt pnictides Co ( Ca, Sr, Eu, As, P) with the tetragonal ThCr2Si2-type structure (space group ) Johnston (2010); Hoffman and Zheng (1985); Jia et al. (2009); Pandey et al. (2013); Anand et al. (2014a, b); Sefat et al. (2009); Imai et al. (2017); Jayasekara et al. (2013) are metals with fascinating properties due to magnetic frustration within their square Co layers Sapkota et al. (2017) and - hybridization-driven magnetoelastic interactions Hoffman and Zheng (1985); Reehuis et al. (1998). In particular, CaCo1.86As2 shows evidence of Stoner-enhanced ferromagnetism (FM), and SrCo2As2 Pandey et al. (2013); Anand et al. (2014a) harbors itinerant antiferromagnetic (AF) fluctuations Jayasekara et al. (2013) centered at neutron-momentum transfers corresponding to the stripe-type AF found in various -type Fe-pnictide superconductors Lynn and Dai (2009); Johnston (2010); Paglione and Greene (2010); Canfield and Bud’ko (2010); Stewart (2011). These fluctuations exist despite SrCo2As2 remaining paramagnetic (PM) down to a temperature of at least K Li et al. . Here, we present results from neutron diffraction experiments made on the series Ca1-xSrxCo2-yAs2 which detail the microscopic changes to the AF order as Ca is replaced by Sr.
CaCo1.86As2 has A-type AF order below a Néel temperature of K, which consists of FM aligned square Co layers stacked AF along the crystalline direction ( structure) and an ordered magnetic moment lying parallel to Quirinale et al. (2013); Jayasekara et al. (2017), as shown in Fig. 1 Sangeetha et al. (2017); Momma and Izumi (2011). Despite the A-type order, its spin fluctuation spectrum indicates strong itinerant fluctuations within the extremely magnetically frustrated Co planes and only weak coupling along Sapkota et al. (2017). Creating a slight imbalance of the frustrated intralayer interactions of the effectively D FM order may drive the ground state towards stripe-type AF Sapkota et al. (2017). Thus, studying Ca1-xSrxCo2-yAs2 provides a possible route to find quantum critical behavior between D FM and stripe-type AF ground states.
Magnetization data for the Ca1-xSrxCo2-yAs2 series reveal multiple magnetic transitions Ying et al. (2014); Sangeetha et al. (2017) between and , and similar data exist for Ca1-xSrxCo2P2 Jia et al. (2009). Recent reports for the arsenide series find that the A-type phase (AF) transitions to an unknown magnetic phase (UNK) for , into an AF phase (AF) with for , and finally into a PM state for . The effective magnetic anisotropy has different signs in the AF and AF phases, with oriented parallel or perpendicular to , respectively. In the UNK phase, but the magnetic anisotropy is essentially zero Sangeetha et al. (2017). The microscopic details of the magnetic order in the UNK and AF phases were previously unknown.
In this paper, we show that the square Co layers of Ca1-xSrxCo2-yAs2 remain FM aligned in the UNK and AF phases, and that the AF stacking of the layers changes with . Previous research has shown that materials with such coupled FM aligned planes may be described using a one-dimensional (D) Heisenberg model Majlis (2000) in which tuning the interlayer coupling strengths gives rise to a variety of collinear and noncollinear magnetic ground states Orbach (1958); Yang and Yang (1966a, b, c); Baxter (1972). We show that this is the case here, and reveal that the evolution of magnetic order in Ca1-xSrxCo2-yAs2 can be understood in terms of the above D Heisenberg model with nearest-layer (NL) and next-nearest-layer (NNL) exchange interactions and single-ion magnetic anisotropy. Using neutron diffraction data and analytical calculations, we show that the AF ordered phases for and Sangeetha et al. (2017) both have an AF propagation vector of , which requires relatively large NNL exchange over much of the phase diagram. For the FM NL exchange is partially frustrated by the AF NNL exchange, which may explain the occurrence of substantial FM correlations Sangeetha et al. (2017) and a small .
II EXPERIMENT
We synthesized plate-like single crystals of Ca1-xSrxCo2-yAs2 by solution growth using Sn flux, and confirmed their stoichiometry via energy-dispersive x-ray spectroscopy measurements. We found no evidence for vacancies of the Co sites in the and samples used for the neutron diffraction measurements within an uncertainty of (i.e. ). We previously discussed that the presence of vacancies and/or the growth technique used may lead to the different observed values of for , ranging from to K Jayasekara et al. (2017). Nevertheless, this level of vacancies does not affect the occurrence of A-type AF order Jayasekara et al. (2017); Quirinale et al. (2013); Anand et al. (2014a); Cheng et al. (2012); Ying et al. (2014, 2012).
Neutron diffraction experiments were performed with the HB-A fixed-incident-energy triple-axis spectrometer at the High Flux Isotope Reactor, using a fixed neutron energy of meV. Effective collimations of were utilized and pyrolitic graphite filters were placed before the sample. Single crystals with and and masses of and mg, respectively, were measured with their () reciprocal-lattice planes coincident with the scattering plane, and cooled down to K using a He closed-cycle refrigerator. A high-energy x-ray diffraction measurement was made as described in Ref. [Jayasekara et al., 2017] on a mg single-crystal of Ca0.60(2)Sr0.40(2)Co1.93(3)As2 at station -ID-D at the Advanced Photon Source to confirm that the sample retained symmetry down to K. In this report, we express in reciprocal-lattice units (r.l.u.).
III Results
Neutron diffraction data for and are shown in Figs. 2(a)–2(d) and 2(e)–2(h), respectively. The arrows in Figs. 2(a) and 2(e) point from structural to magnetic Bragg peaks and demonstrate that the AF order is characterized by for both compounds. This propagation vector corresponds to a periodicity along of four square Co layers, which differs from the A-type AF order found for with (alternating square Co layers) Quirinale et al. (2013), and from the stripe-type AF order found in many -type Fe-pnictide superconductors and the stripe-type spin fluctuations in SrCo2As2 with Jayasekara et al. (2013). The widths of the magnetic and structural Bragg peaks are similar, which attests to the presence of long-range AF order. We find no evidence for magnetic Bragg peaks in data measured at reciprocal-lattice positions corresponding to and .
Figures 2(b) and 2(e), respectively, illustrate that magnetic Bragg peaks are absent at , odd integer, positions for , but that they occur for . Since neutron diffraction is sensitive to the component of , these data indicate that for , whereas has a component in the plane for . These results agree with the conclusions from magnetization data that for and for Sangeetha et al. (2017).
Figures 2(c), 2(f), and 2(g) show detailed views of select magnetic Bragg peaks at various temperatures. The peaks are quite weak, which implies small ordered moments. Using the magnetic structures shown in Fig. 1 for the UNK and AF phases, we find Co for at K and Co for at K. Three magnetic Bragg peaks were used to determine for and six were used for . More details concerning the magnetic structures are given below.
The temperature dependence of the magnetic order parameter for and is presented in Figs. 2(d) and 2(h), respectively. Upon cooling, a magnetic diffraction signal first appears at and K for and , respectively, which are above the values of and K expected from magnetization data Sangeetha et al. (2017). This may be due to differences in the level of vacancies between the samples used for the neutron diffraction experiments and those used for magnetization Sangeetha et al. (2017). In particular, the level of Co vacancies for the neutron diffraction samples is , whereas the magnetization samples with and have and , respectively. Samples with Co vacancies seem to have lower values for , with K for Quirinale et al. (2013) and K for Cheng et al. (2012). On the other hand, it has been suggested that vacancies alone may not explain the differing values of from different reports, and that different growth conditions may also be responsible Zhang et al. (2015).
IV Discussion
We capture the observed magnetic ordering behaviors using the classical Heisenberg Hamiltonian:
[TABLE]
Here, contains competing FM and AF interactions between Heisenberg spins within a square layer, () is the effective NL (NNL) magnetic exchange interaction along , () is the single-ion magnetic anisotropy along (within the plane), and where is the distance between neighboring Co layers. We regard each FM-aligned Co layer as a single localized Heisenberg spin at position and consider the layers’ relative orientations along in terms of a D model. For helical AFs, this is a common model denoted as the -- model Johnston (2012, 2015).
We analytically calculate the classical ground-state energies in units of , which we assume to be AF (), and find the phase diagram given in Fig. 3(a). More details of our calculations are given in Appendix A. In the absence of anisotropy, the ground state is either an A-type AF, a single- helix with a turn angle of , or FM, with phase boundaries at and , respectively Johnston (2012, 2015, 2017). AF order with a propagation vector of occurs only at .
On the other hand, both neutron diffraction and magnetization data require that for and for , and it turns out that magnetic anisotropy suppresses helical AF order in favor of regions with either -type AF, A-type AF, or FM order. In the case of , must be greater than a lower bound of to suppress helical AF order. For , anisotropy that picks a specific direction within the plane, , must be included and must be greater than a lower bound of to suppress helical AF order. We determined and by comparing the energy of a helical AF state at finite or (with ) to the state found at large or (with ). The computed boundaries are plotted in Fig. 3(c) and are included in Fig. 3(a), where the helix region corresponds to coplanar helical AF order.
The top part of Fig. 3(a) shows that for , the value of and the sign of determine the stacking of the FM layers. The ground state is () for and either FM () or A-type AF () for . Note that half of the NL interactions are frustrated for whereas the NNL interactions are frustrated for . In other words, dominates for and dominates for . Figure 3(a) shows that the phase diagram looks quite similar for and .
Our theory predicts that for and that the corresponding AF structure is with , as shown in Fig. 1 for the UNK phase. For , which has , we predict and that the AF order is either the or the -state clock structure shown for the AF phase in Fig. 1. Both of these magnetic structures correspond to and produce similar neutron diffraction patterns due to the presence of magnetic domains. We cannot differentiate between them using our data. Similarly, we cannot rule out an amplitude-modulated spin-density wave for either or . The absence of evidence for a distortion away from tetragonal symmetry in our high-energy x-ray diffraction data for may favor the -state clock structure for AF.
Figure 3(a) also illustrates that close to the degree of anisotropy needed to suppress helical AF order becomes quite significant. In particular, for and a weak dependence of on , we predict distorted helix states to emerge when falls outside the window where -type order is stabilized. These distorted helix states are multi- states, and have a turn angle which varies along as the spins are canted towards and by . The precise form of the distorted helix order, which is not observed for , may be determined numerically, as done for helical AFs in Refs. [Johnston, 2017] and [Johnston, 2019], or by classical Monte-Carlo simulations.
We further test our model by analytically determining the spin-flop and saturation magnetic fields, and , respectively, for the A-type and -type ground states with , and compare its predictions to magnetization versus magnetic field data Sangeetha et al. (2017). We assume that the component of the flopped spins have helical AF order similar to that for and negligible , and plot the results in Fig. 3(b). In our calculations, and we set , where is the spectroscopic splitting factor.
We find that our model predicts the observed spin flop in the A-type AF phase Sangeetha et al. (2017) for with
[TABLE]
where and . A spin flop occurs only if ; otherwise the compound directly saturates with increasing . For , the spin-flop field is
[TABLE]
and a spin flop occurs only for .
For the saturation fields, we find for . If the system directly saturates without a spin flop, we find for and for .
Using the expressions for , the experimental data for Sangeetha et al. (2017) and the experimentally determined value of Jayasekara et al. (2017), we estimate that meV and meV for and place it on the phase diagram in Fig. 3(a) by arbitrarily assuming that . We place the compound in the -type AF ordered region of Fig. 3(a) corresponding to FM and based on the observed AF propagation vector for and the fact that magnetization data find evidence for strong FM correlations along coexisting with the AF order Sangeetha et al. (2017). In this region, is partially frustrated, and may cause the strong FM correlations and a value of much lower than that found for either or . Magnetization data for do not show evidence for strong FM correlations along Sangeetha et al. (2017). Hence, we place it on the positive side of the axis in Fig. 3(a).
For Ca1-xSrxFe2As2, stripe-type AF order persists across the series with an almost constant despite increasing by between and Kirshenbaum et al. (2012). The change in is tied to changes in the chemical unit cell size and structure. This behavior is distinct from our observations for Ca1-xSrxCo2-yAs2. Nevertheless, the crossover from a collapsed-tetragonal to tetragonal phase in Ca1-xSrxCo2-yAs2 and the associated large increase in and changes to other unit-cell parameters with increasing Sangeetha et al. (2017) likely play a role in the variation of and with composition.
A recent report on electronic-band-structure calculations for Co2As2, Ca, Sr, Ba, find that the overall electronic structures are similar for all three compounds, with only the proximity to a van Hove singularity of a flat band associated with the Co orbitals responsible for FM fluctuations within the plane differing between them Mao and Yin (2018). The flat band lies just below the van Hove singularity for Ca, causing an enhancement of the dynamical susceptibility which may lead to the observed A-type AF order. The flat band lies further away from the van Hove singularity for Sr and Ba, which have not been observed to magnetically order. The closer proximity of the flat band to the van Hove singularity for Ca is tied to a larger Co-Co bond length and lower As height above a Co layer. It would be interesting to observe how the enhancement in the dynamical susceptibility seen for Ca changes as Ca is systematically replaced by Sr.
V Conclusion
Our results highlight the manifestation of highly-tunable and analytically-determinable magnetic ground states in Ca1-xSrxCo2-yAs2 in the presence of frustrated NL or NNL exchange between FM-aligned square Co layers and magnetic anisotropy. More generally, we have found that the cobalt-arsenide system manifests strong magnetic frustration both within its square layers and between them. The origins of frustration within the layers likely trace back to flat electronic bands associated with Stoner-like ferromagnetism Mao and Yin (2018), whereas here we highlight a different kind of frustration: frustration between FM-aligned layers. Future band structure calculations and inelastic neutron scattering experiments can provide detailed information on the magnetic state of the layers themselves, and determine whether or not the itinerant FM fluctuations present for persist into the UNK and AF phases, and if the stripe-type fluctuations found in SrCo2As2 Jayasekara et al. (2013) exist in Ca1-xSrxCo2-yAs2. Such work should also result in a better understanding of the microscopic origin of the compositional changes to our Heisenberg model’s parameters, as well as the limits of our D local-moment model.
Acknowledgements.
We are grateful for assistance from D. Robinson with performing the x-ray experiments, and helpful conversations with T. W. Heitmann, D. H. Ryan, L. Ke, and D. Vaknin. Work at the Ames Laboratory was supported by the U. S. Department of Energy (DOE), Basic Energy Sciences, Division of Materials Sciences & Engineering, under Contract No. DE-AC-CH. A portion of this research used resources at the High Flux Isotope Reactor, a U. S. DOE Office of Science User Facility operated by the Oak Ridge National Laboratory. This research used resources of the Advanced Photon Source, a U. S. DOE Office of Science User Facility operated for the U. S. DOE Office of Science by Argonne National Laboratory under Contract No. DE-AC-CH. Y. S. and P. P. O. acknowledge support from Iowa State University Startup Funds.
Appendix A Analytical Calculations
A.1 Introduction
We model the stacking along the tetragonal axis of the ferromagnetically (FM) aligned square Co layers in Ca1-xSrxCo2-yAs2 using the classical local-moment Heisenberg spin Hamiltonian:
[TABLE]
and analytically calculate the classical ground-state energies in units of , which we assume to be antiferromagnetic (AF) (). We regard each FM-aligned Co layer as a single Heisenberg spin at position , and consider the layers’ relative orientations along in terms of a one-dimensional (D) model. For helical AF, this is a common model denoted as the -- model Johnston (2012, 2015). In Eq. (4), contains competing FM and AF interactions between Heisenberg spins within a square layer, () is the effective nearest-layer (NL) [next-nearest-layer (NNL)] exchange along , () is the single-ion magnetic anisotropy along (within the plane), and , where is the distance between neighboring Co layers.
The following subsections give details of the calculations for the spin-flop and saturation fields in different regions of the phase diagram shown in Fig. 3(a) for a magnetic field applied along . Details of the calculations used to estimate the lower bounds of and necessary to suppress a helix state are also presented.
To determine and , the standard Zeeman-interaction term is added to Eq. (4):
[TABLE]
For brevity, the spectroscopic-splitting factor and Bohr magneton are absorbed into the field definition , where is the magnetic field applied along . These constants are restored at the end for numerical estimates of and that incorporate experimental results.
A.2 , , and
The ground state in the regime and is A-type AF order with moments laying along , as shown for the AF phase in Fig. 1. The AF propagation vector is . We consider the following variational state [see Fig. 4(a)]:
[TABLE]
and set equal to . Note that is measured from the plane rather than . The energy of this state is
[TABLE]
Minimizing Eq. (7) with respect to gives:
[TABLE]
which has two solutions:
[TABLE]
The first solution is the saturated state, where the spins are fully polarized along the field direction. The second solution is a canted state, in which the spins are canted away from . is found by setting the energy of the canted state equal to the energy of the state. This yields
[TABLE]
Solving Eq. (11) gives
[TABLE]
Note that vanishes as .
The canted state exists only if . It must occur before the saturated state occurs, otherwise the spins would directly saturate. We can determine when this happens by setting the energy of the saturated state equal to the state, which gives:
[TABLE]
Comparing Eqs. (12) and (13), we see that the canted state exists for . To summarize, for the and region of the phase diagram we have:
[TABLE]
for .
A.3 , , and
Let us consider the regime with and . As we show below, for and the ground state is a helix with a turn angle given by , where . For , we expect the helix to align and distort to accommodate the easy-axis anisotropy [gray region of the phase diagram in Fig. 3(a)], and we do not have an analytical expression for this state. Nevertheless, as discussed in the main text, for greater than a lower bound, , the ground state is FM for , -type AF with for , and A-type AF [] for .
We now consider and the following variational state [see Fig. 4(b)]:
[TABLE]
where is the turn angle, is an integer representing the layer number along , and is the canting angle (measured from the plane). We expect Eq. (17) to describe the ground state for .
The energy of a state given by Eq. (17) is
[TABLE]
which is independent of . To obtain a solution for the turn angle, we minimize Eq. (18) with respect to which gives
[TABLE]
Since in the canted state, it is safe to cancel the term. Equation (19) then has the following solution:
[TABLE]
() corresponds to FM-aligned (A-type AF-aligned) layers, and corresponds to -type AF-aligned layers. Other values of correspond to a helix state, or a single- helix state for the case of and . Note that is independent of and .
Next, to determine and , we minimize Eq. (18) with respect to and use Eq. (20) to substitute for in subsequent calculations. From Eq. (18) we find:
[TABLE]
The first solution is the saturated state, and the second corresponds to a canted-helix state.
To determine , we need to compare the energy of the canted-helix state to the ground-state energy. We assume that the orientation of the spins in the spin-flopped state is given by Eq. (17). The expressions for we derive below are therefore only lower bounds. Since the ground state with is A-type AF [] for and -type AF [] for , we consider the two cases separately.
A.3.1 order for , , and
Substituting and into Eq. (18) and taking yields a zero-field ground state energy for the A-type AF order of
[TABLE]
Upon setting Eqs. (23) and (18) equal to each other, and substituting Eq. (20) for and Eq. (22) for , we find that
[TABLE]
where and . Similarly to the previous section, this spin-flop field is only valid if , otherwise the system directly saturates. This happens when
[TABLE]
Upon setting Eq. (25) equal to the value of field that solves Eq. (22) for , we arrive at the condition for the transition:
[TABLE]
To summarize, in the and part of the phase diagram we have the following spin-flop and saturation fields:
[TABLE]
for .
A.3.2 order for
Substituting and into Eq. (18) and taking yields a zero-field ground state energy for the -type AF order of
[TABLE]
Setting Eq. (30) equal to Eq. (18), and substituting Eq.( 20) for and Eq. (22) for gives
[TABLE]
This spin-flop field is only valid if , otherwise the system directly saturates. This happens when:
[TABLE]
Upon setting Eq. (32) equal to the value of field that solves Eq. (22) for , we arrive at the condition for the transition:
[TABLE]
Since this calculation is only valid for , we disregard the solution with the minus sign.
To summarize, in the and part of the phase diagram we have the following spin flop and saturation fields:
[TABLE]
for . Equations (35) and (36) also apply for .
A.3.3 Comparison with experimental data
Using the expressions for , the experimental data for Sangeetha et al. (2017) and experimentally determined value of Jayasekara et al. (2017), we estimate that meV and meV for . We place on the phase diagram in Fig. 3(a) by arbitrarily assuming that .
We place the and compounds in the region of the phase diagram in Fig. 3(a) based on our neutron diffraction result that both compositions have , with for (corresponding to ) and for (corresponding to ). Further, we place the compound on the FM side () and close to the FM boundary (), as curves for are quite soft, showing small saturation fields Sangeetha et al. (2017). We think that the proximity to the phase boundary and/or the frustrated FM NL exchange combined with sufficiently large may explain the reported strong FM correlations along in the midst of AF order, as well as a value for lower than that found for either or . Magnetization data for do not show evidence for strong FM correlations along Sangeetha et al. (2017), hence we place on the positive side of the axis.
A.4 Estimation of
In the case of easy-plane anisotropy corresponding to spins lying in the plane (), the ground state for is a helix with lying in the plane. In order to obtain the experimentally observed of for , must be finite and larger than a lower bound of . To find , two calculations are necessary: () we need to determine the energy difference between the helix state and the -type AF state (i.e. the energy gap to overcome); () we need to determine how affects the energy of the helix state versus how it affects the -type AF state. Namely, we need to determined how effective is at overcoming .
For (), we use the above results to determine the energy of the FM, -type AF, A-type AF, and helix states to be, respectively:
[TABLE]
As in Eq. (20), gives the turn angle for the helix. Whether the FM, -type AF, or A-type AF state is closest in energy to the helix state is dependent on the ratio. The gaps are:
[TABLE]
For (), we look at the energy contribution of in terms of unit strength. For the FM, -type AF, or A-type AF state, we get, by design, energies of
[TABLE]
where we have dropped the factor of for convenience. For the helix state we need to calculate:
[TABLE]
where we sum over layers that make a full turn of the helix commensurate with the chain. The summation can be done analytically by using the trigonometric identities
[TABLE]
and noting that the sum over the linear trigonometric functions are averages over the period, which is zero. Thus, we only have the constant terms left, and . Therefore, the unit strength term creates an energy difference of , and
[TABLE]
where is given in Eqs. (41)–(43). is shown in Fig. 3(c).
A.5 Estimation of
The calculation of the equivalent lower bound on follows a similar vein. The only differences are due to the effect of the unit strength of on the helix state, and that we assume that the plane of the helix contains . The energy we need to calculate to determine the unit strength of is
[TABLE]
which leads to
[TABLE]
Thus, the shape of the curve is the same as , but has half the magnitude. is plotted in Fig. 3(c).
The reference list from the paper itself. Each links out to its DOI / PubMed record.
- 1Johnston (2010) D. C. Johnston, Adv. Phys. 59 , 803 (2010).
- 2Hoffman and Zheng (1985) R. Hoffman and C. Zheng, J. Phys. Chem. 89 , 4175 (1985).
- 3Jia et al. (2009) S. Jia, A. J. Williams, P. W. Stephens, and R. J. Cava, Phys. Rev. B 80 , 165107 (2009).
- 4Pandey et al. (2013) A. Pandey, D. G. Quirinale, W. Jayasekara, A. Sapkota, M. G. Kim, R. S. Dhaka, Y. Lee, T. W. Heitmann, P. W. Stephens, V. Ogloblichev, A. Kreyssig, R. J. Mc Queeney, A. I. Goldman, A. Kaminski, B. N. Harmon, Y. Furukawa, and D. C. Johnston, Phys. Rev. B 88 , 014526 (2013) . · doi ↗
- 5Anand et al. (2014 a) V. K. Anand, R. S. Dhaka, Y. Lee, B. N. Harmon, A. Kaminski, and D. C. Johnston, Phys. Rev. B 89 , 214409 (2014 a).
- 6Anand et al. (2014 b) V. K. Anand, D. G. Quirinale, Y. Lee, B. N. Harmon, Y. Furukawa, V. V. Ogloblichev, A. Huq, D. L. Abernathy, P. W. Stephens, R. J. Mc Queeney, A. Kreyssig, A. I. Goldman, and D. C. Johnston, Phys. Rev. B 90 , 064517 (2014 b).
- 7Sefat et al. (2009) A. S. Sefat, D. J. Singh, R. Jin, M. A. Mc Guire, B. C. Sales, and D. Mandrus, Phys. Rev. B 79 , 024512 (2009).
- 8Imai et al. (2017) M. Imai, C. Michioka, H. Ueda, A. Matsuo, K. Kindo, and K. Yoshimura, J. Phys.: Conf. Ser. 868 , 012015 (2017).