The Inner Disk and Accretion Flow of the Close Binary DQ Tau
James Muzerolle, Kevin Flaherty, Zoltan Balog, Tracy Beck, Robert, Gutermuth

TL;DR
This study combines optical and NIR observations of DQ Tau, revealing correlations between orbital phase and brightness, and variations in dust emission that inform models of accretion flows in close binary systems.
Contribution
First multi-epoch optical and NIR data of DQ Tau linking flux variations to orbital phase and accretion processes, with insights into dust temperature changes near periastron.
Findings
Optical flux peaks near periastron passages.
NIR brightness correlates with orbital period and precedes optical pulses.
Dust emission varies with orbit, indicating dynamic accretion streams.
Abstract
We present multi-epoch optical and near-infrared (NIR) photometry and spectroscopy of the spectroscopic binary T Tauri star DQ Tau. The photometric monitoring, obtained using SMARTS ANDICAM, recovers the previously-seen correlation between optical flux and the 15.8-day binary orbital period, with blue flux peaks occurring close to most observed periastron passages. For the first time, we find an even more consistent correlation between orbital period and NIR brightness and color. The onset of pulse events in the NIR on average precedes those in the optical by a few days, with the rise usually starting near apastron orbital phase. We further obtained five epochs of spectroscopy using IRTF SpeX, with a wavelength range of 0.8 to 5 microns, and derived spectra of the infrared excess emission. The shape and strength of the excess varies with time, with cooler and weaker characteristic dust…
Click any figure to enlarge with its caption.
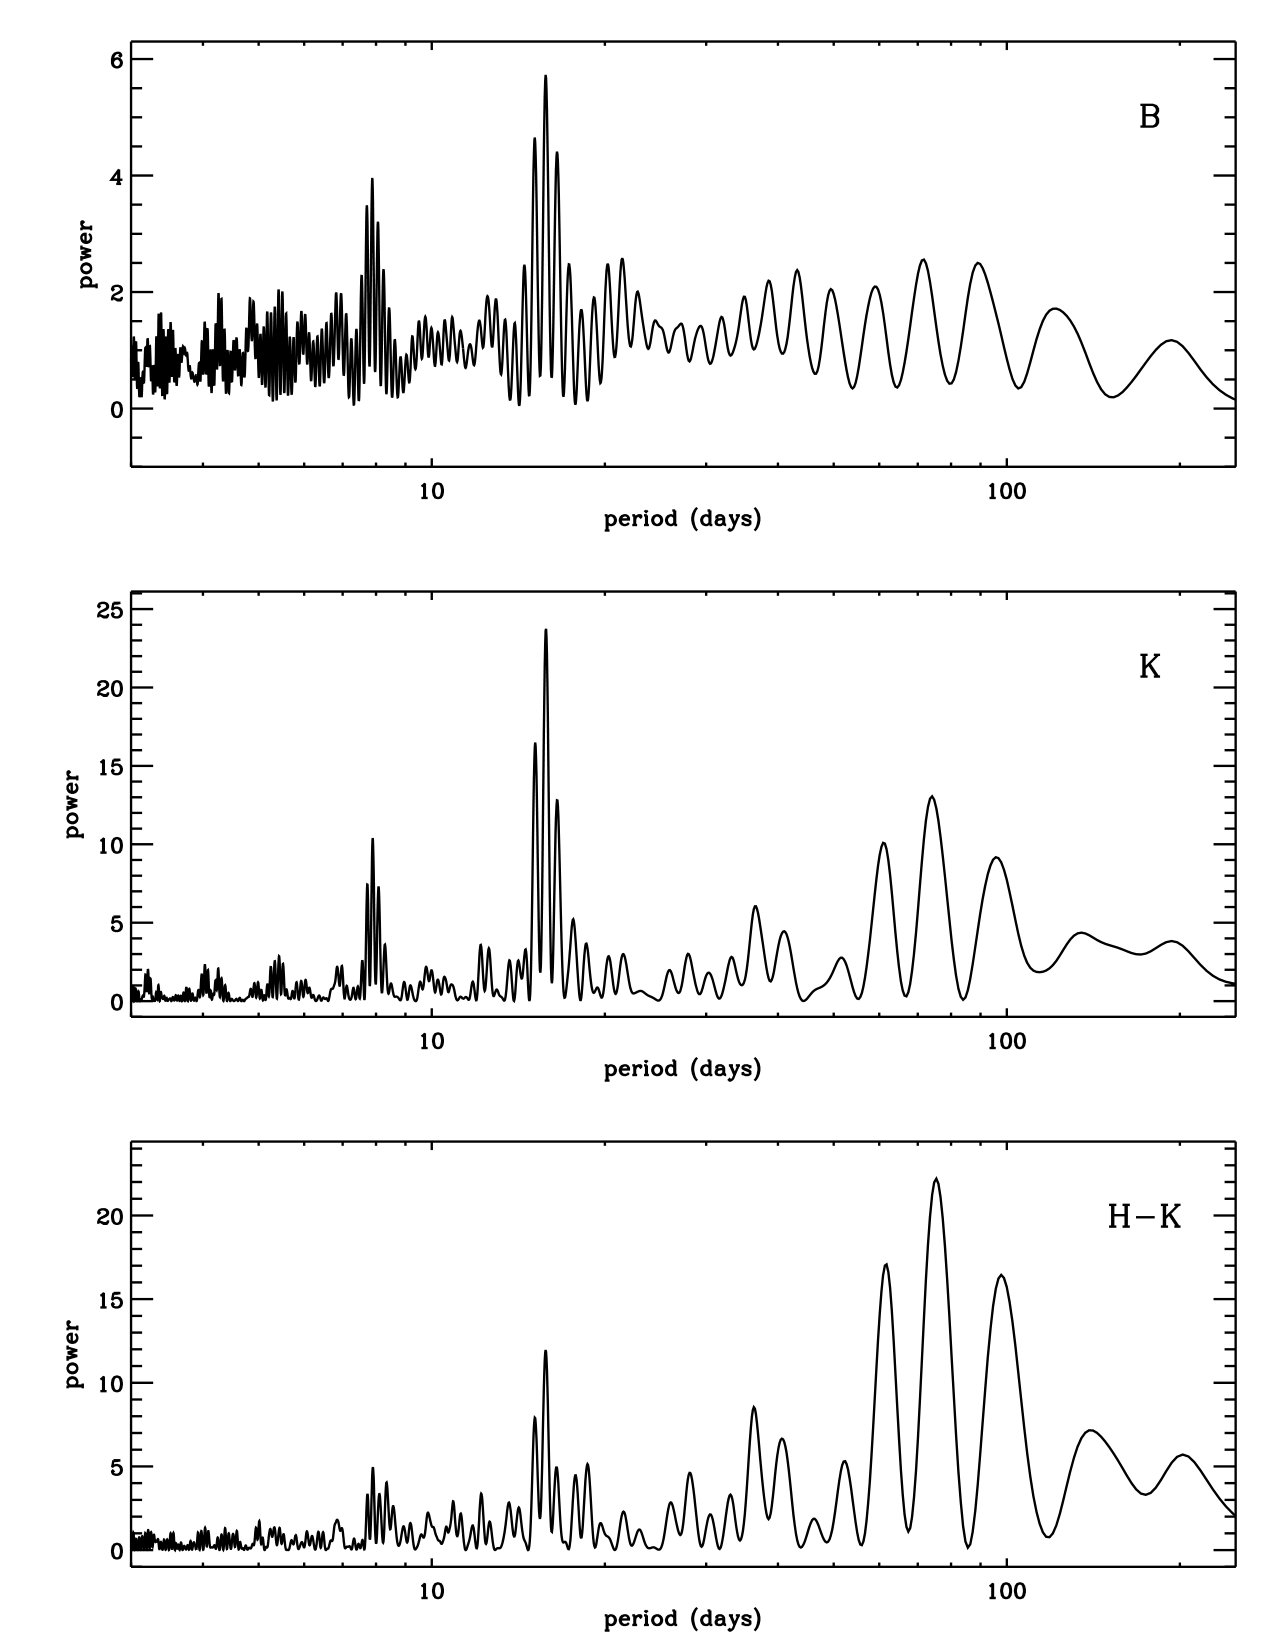 Figure 1
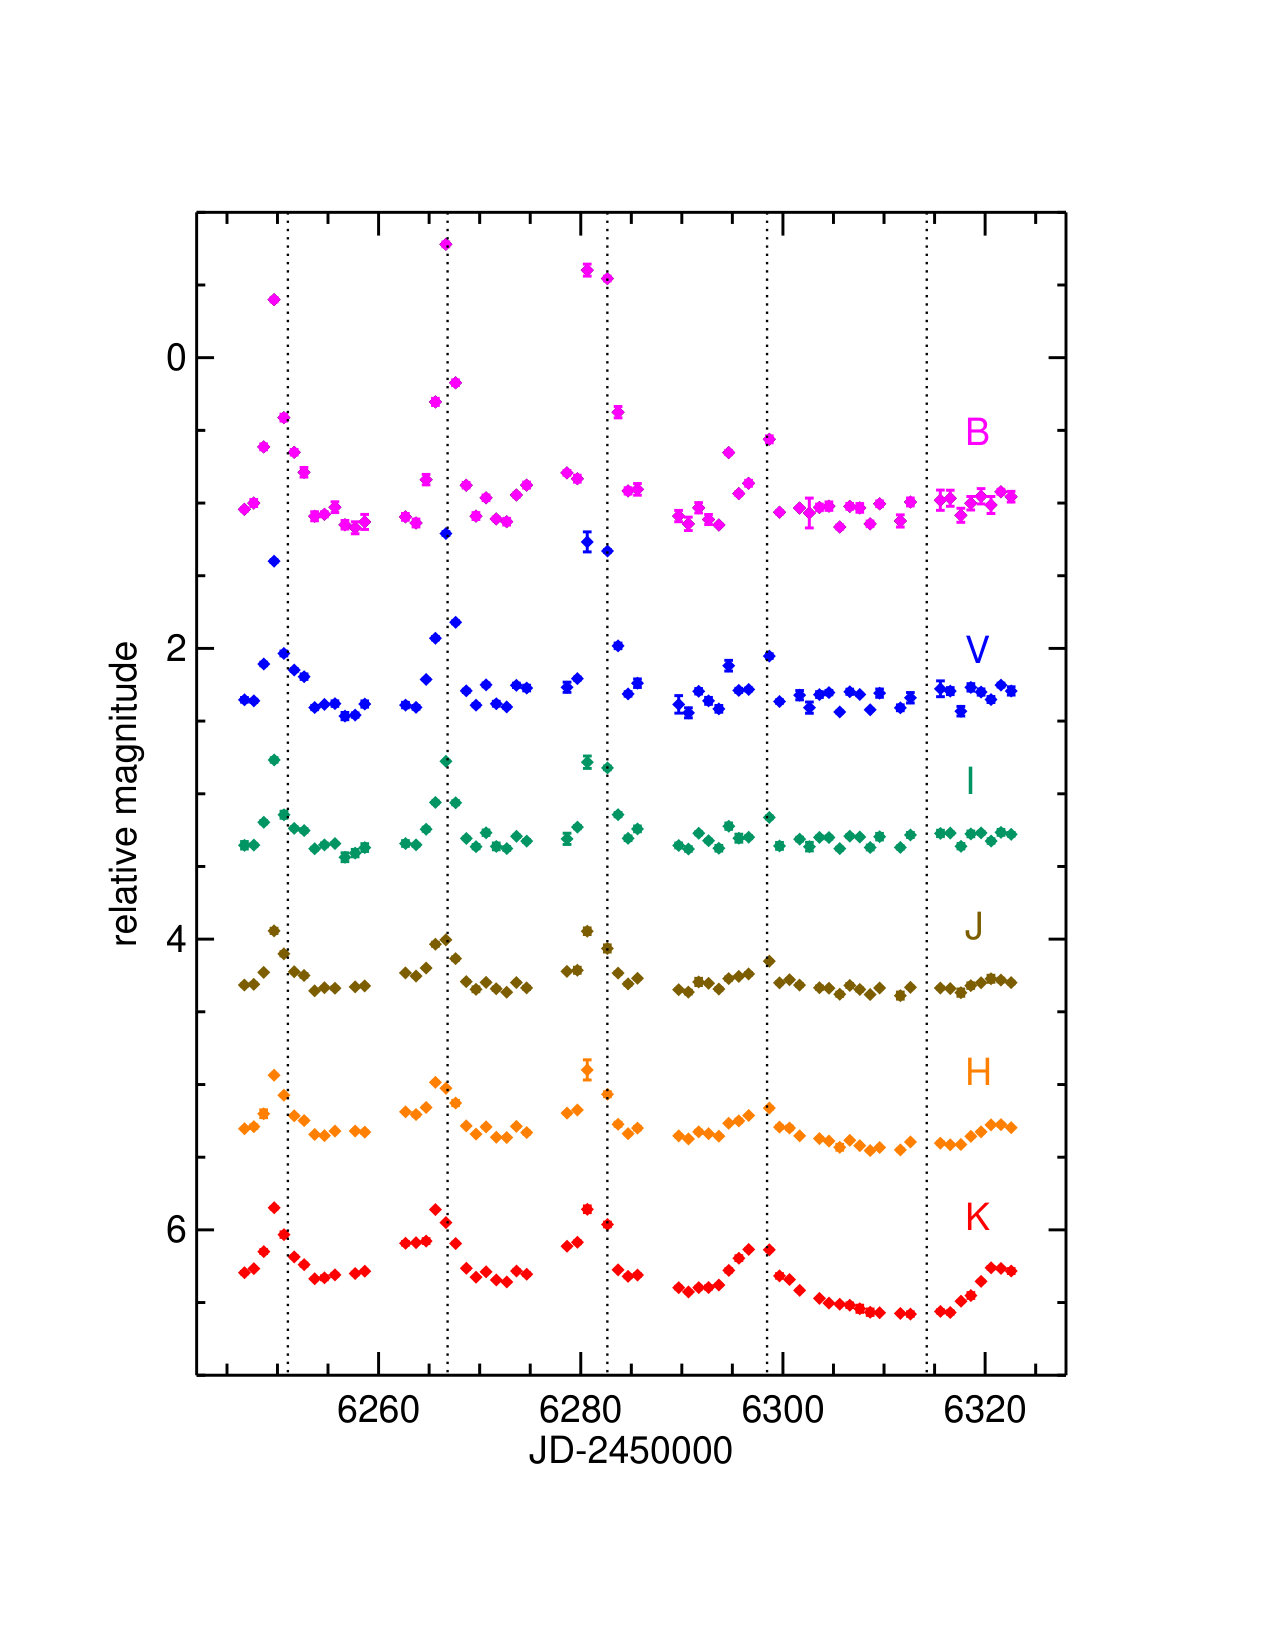 Figure 2
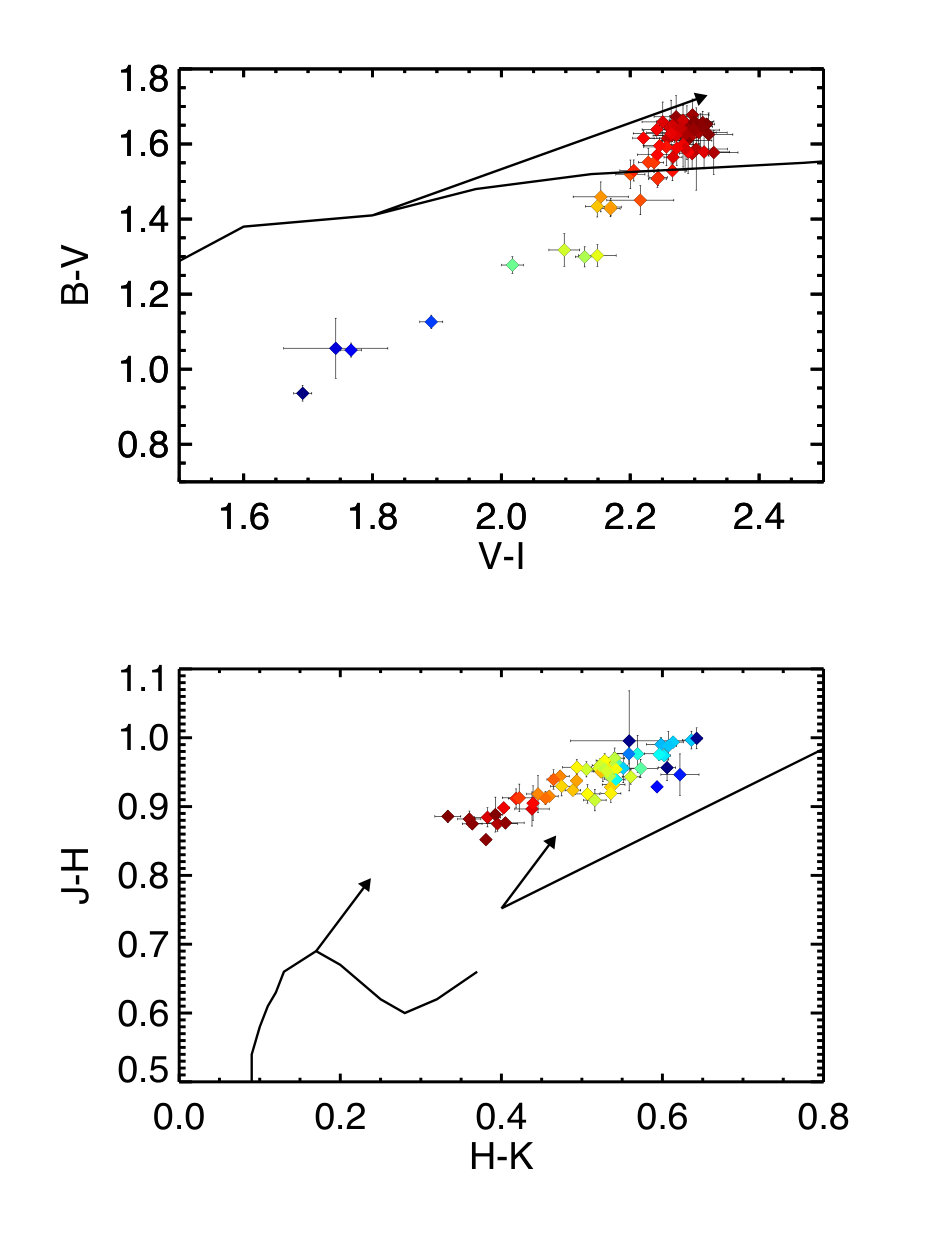 Figure 3
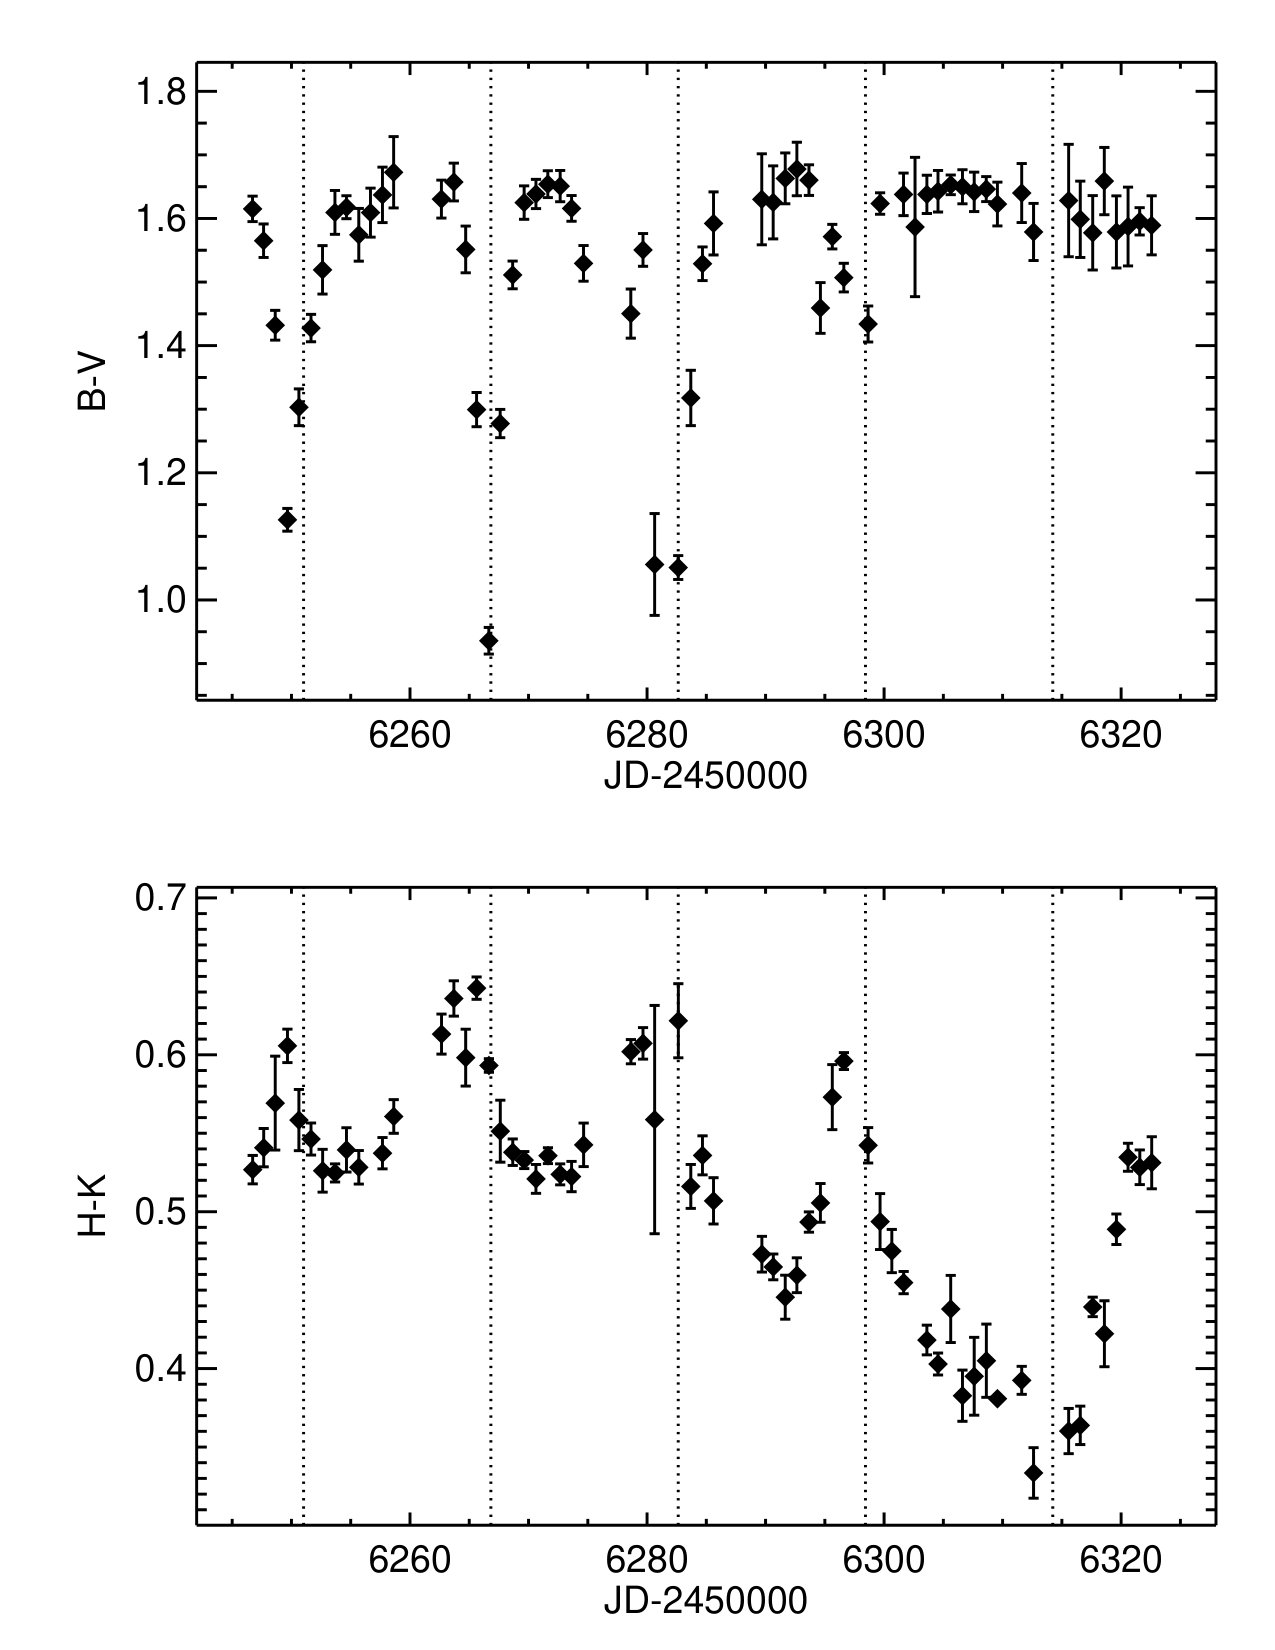 Figure 4
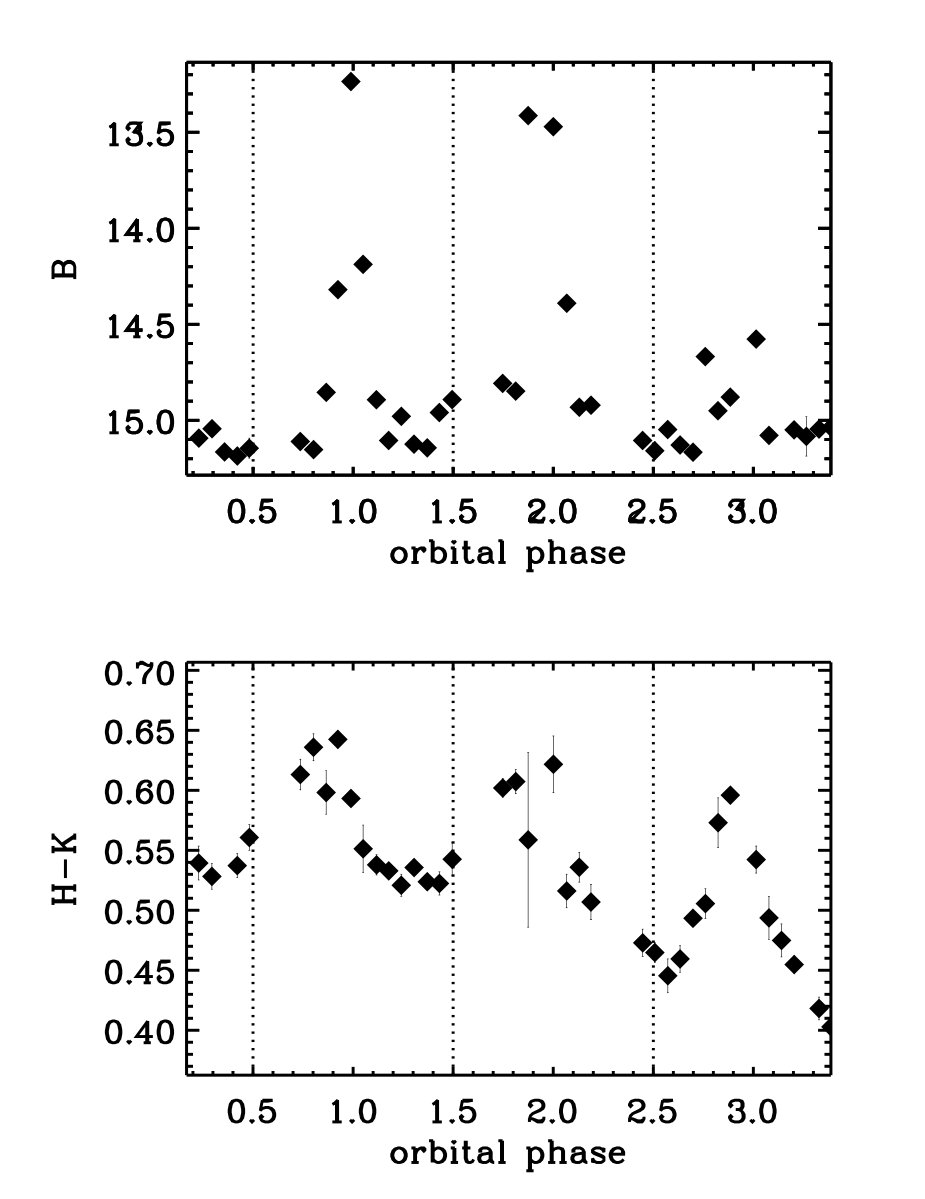 Figure 5
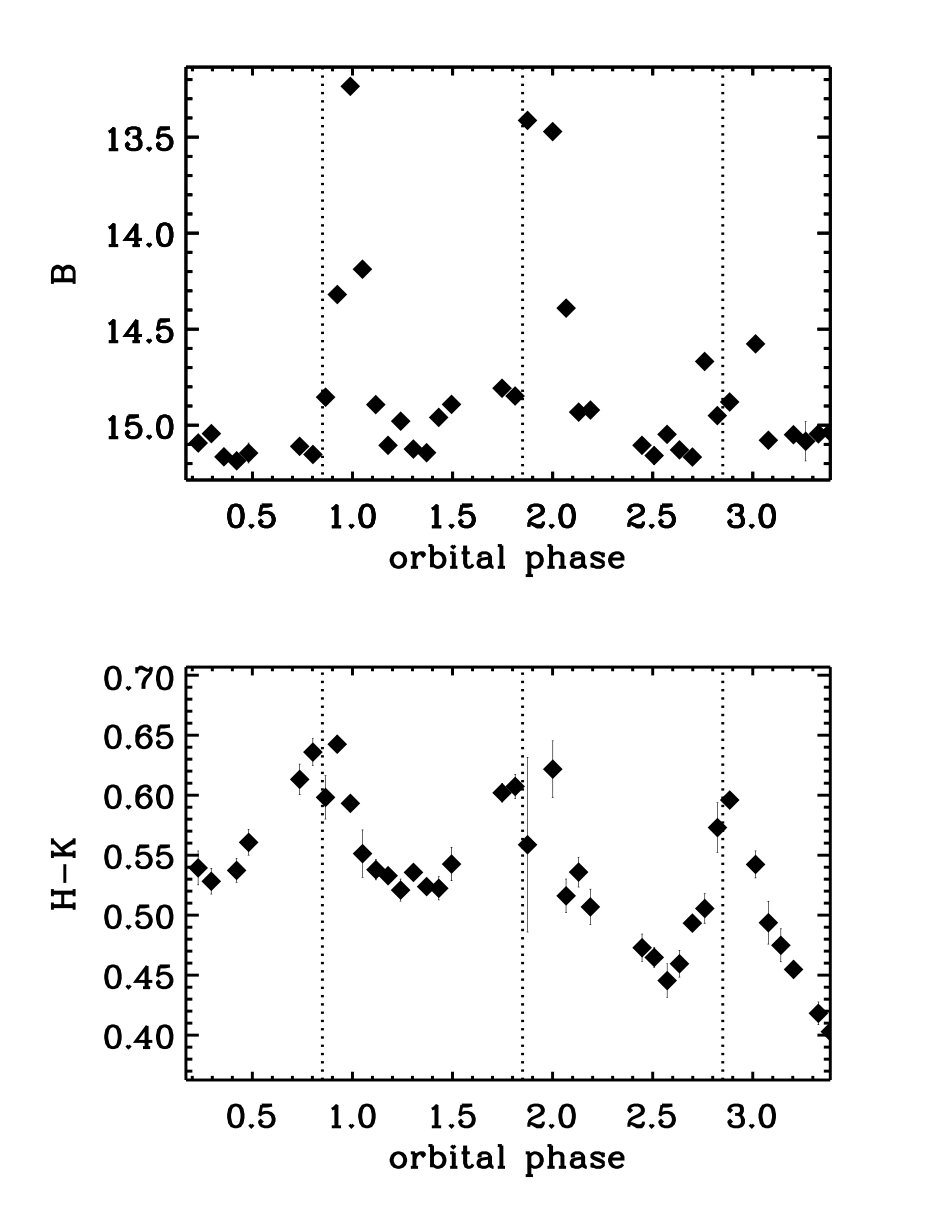 Figure 6
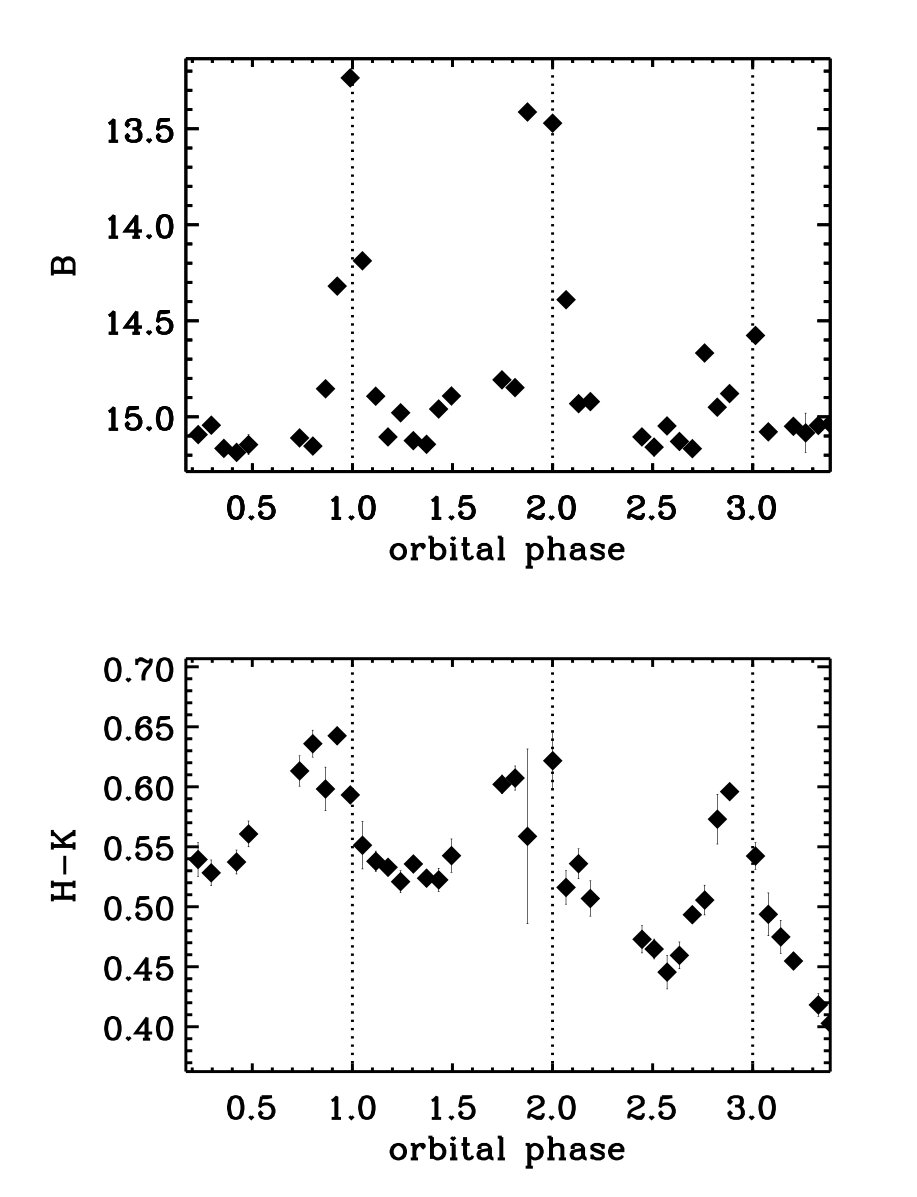 Figure 7
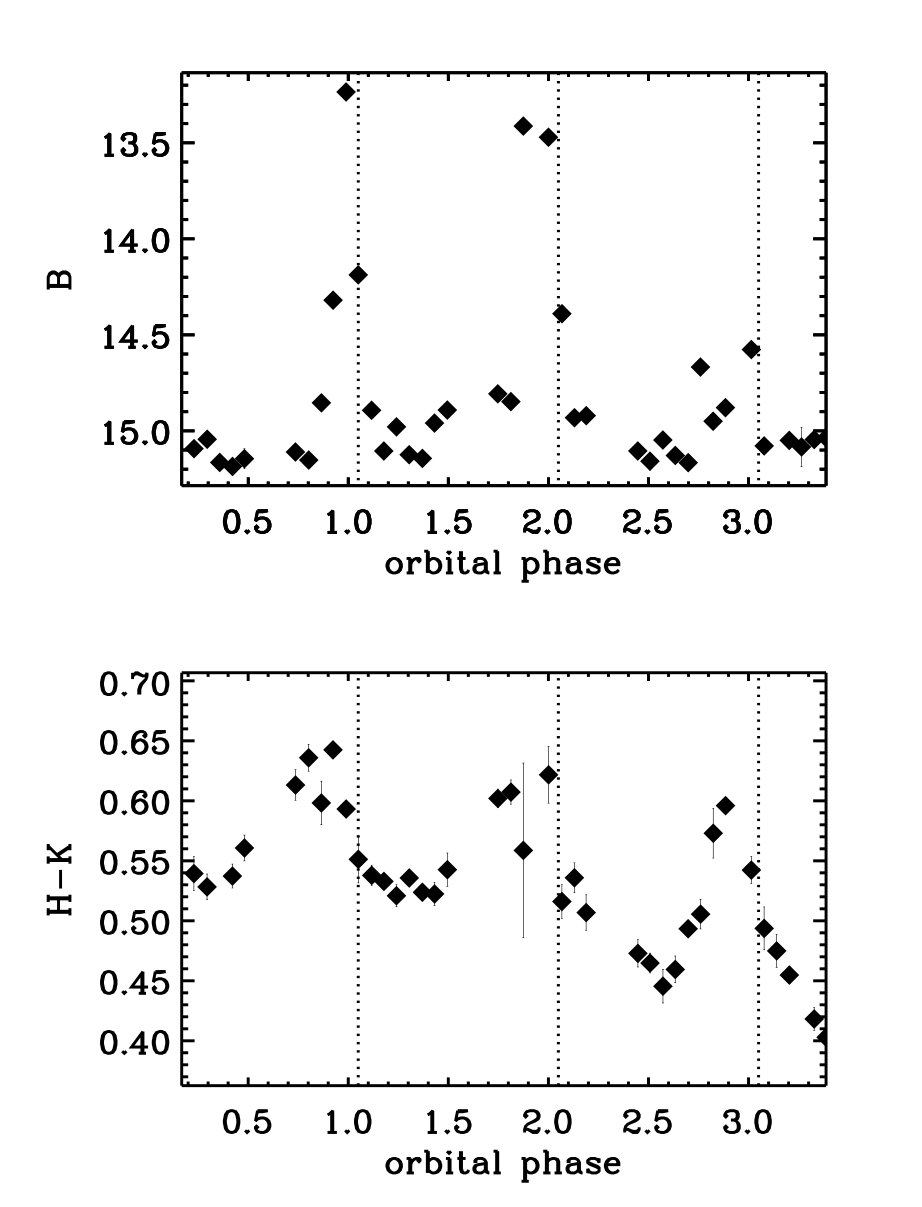 Figure 8
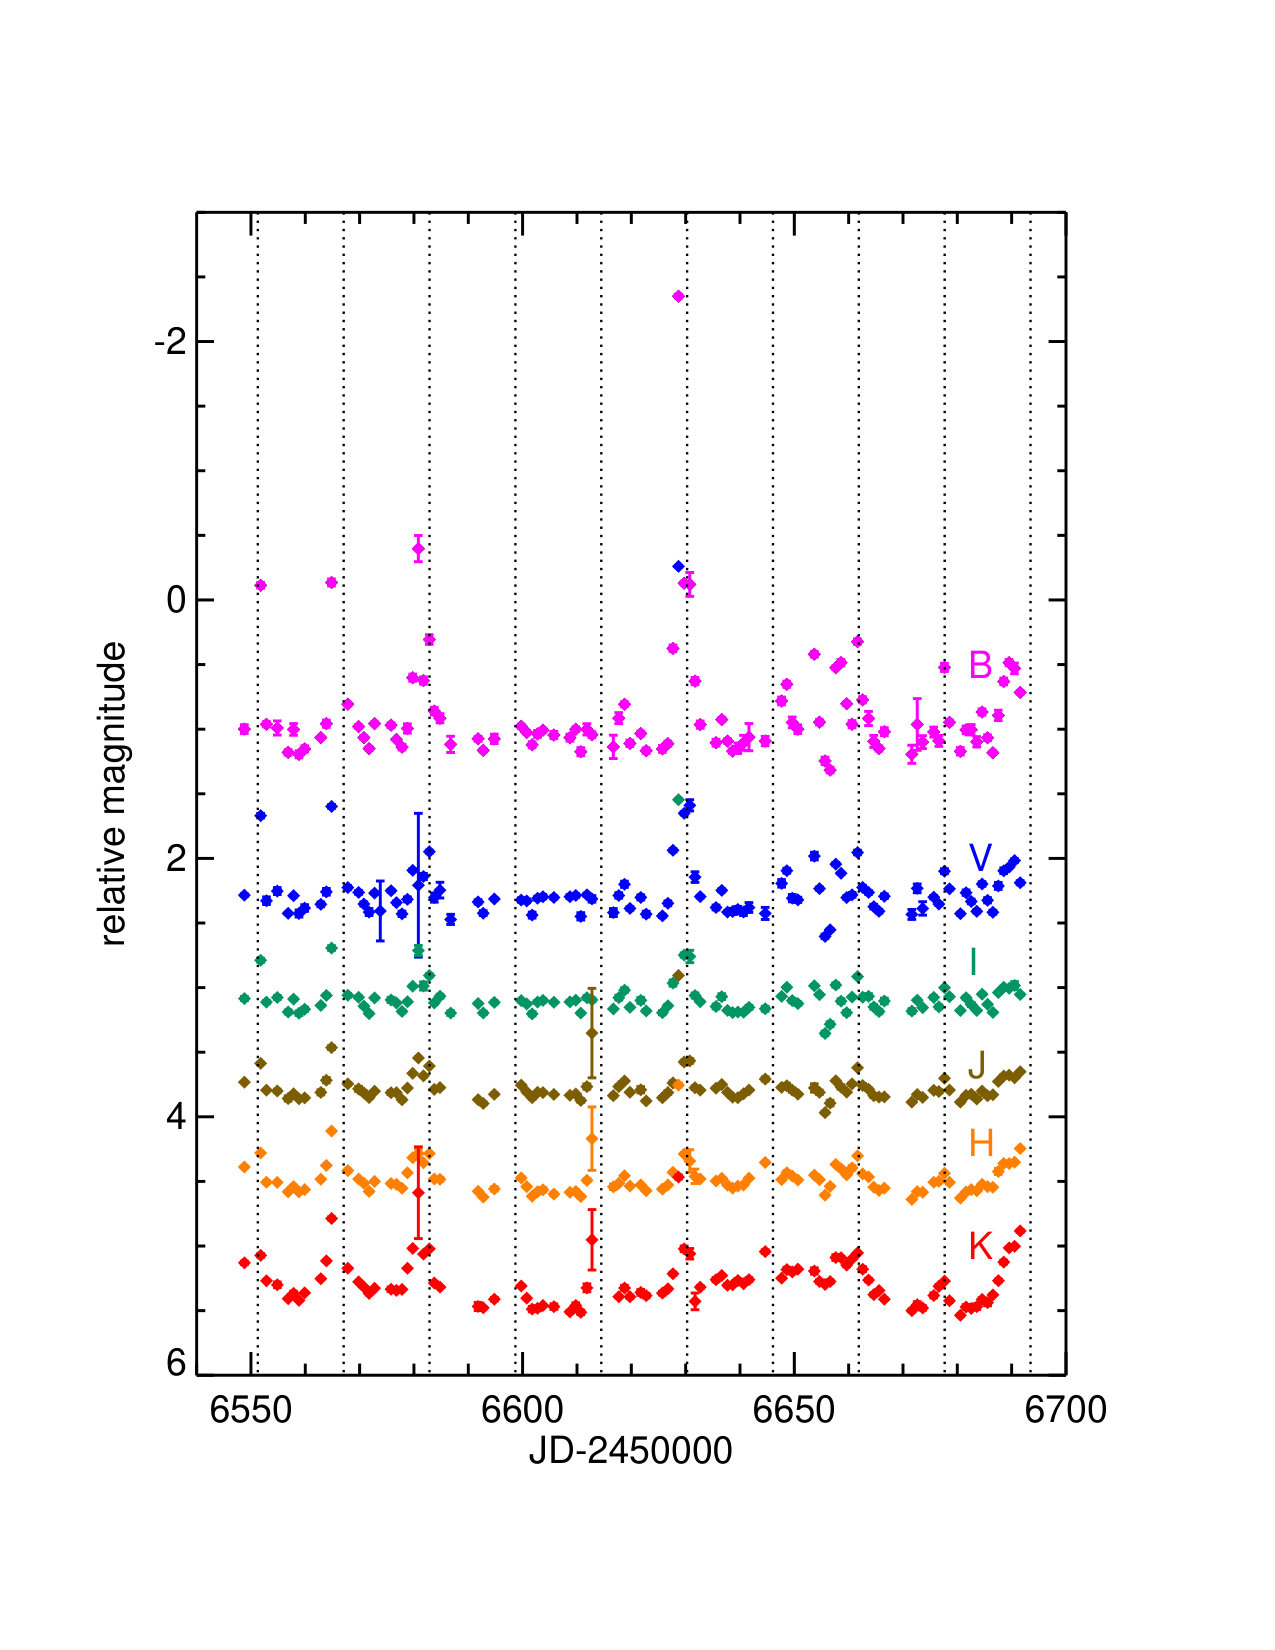 Figure 9
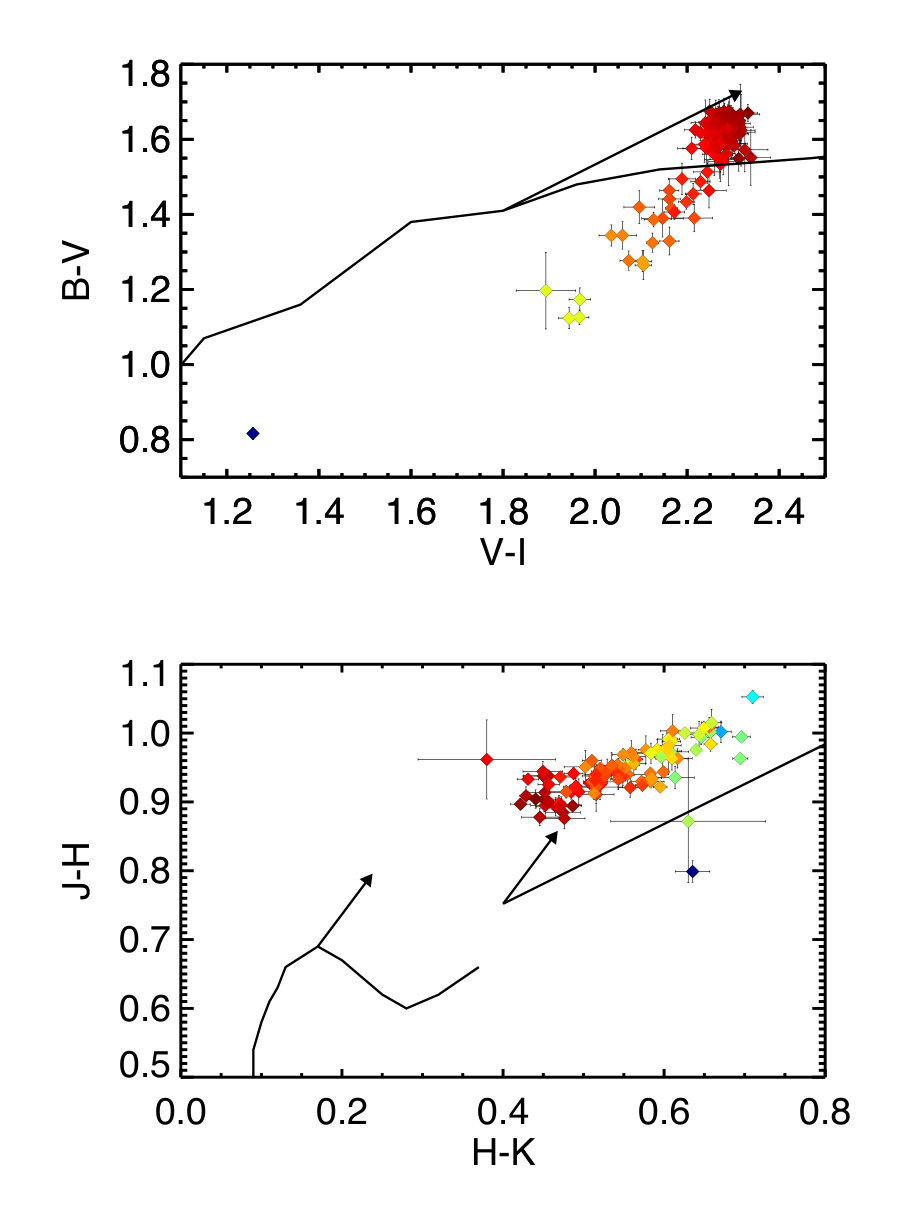 Figure 10
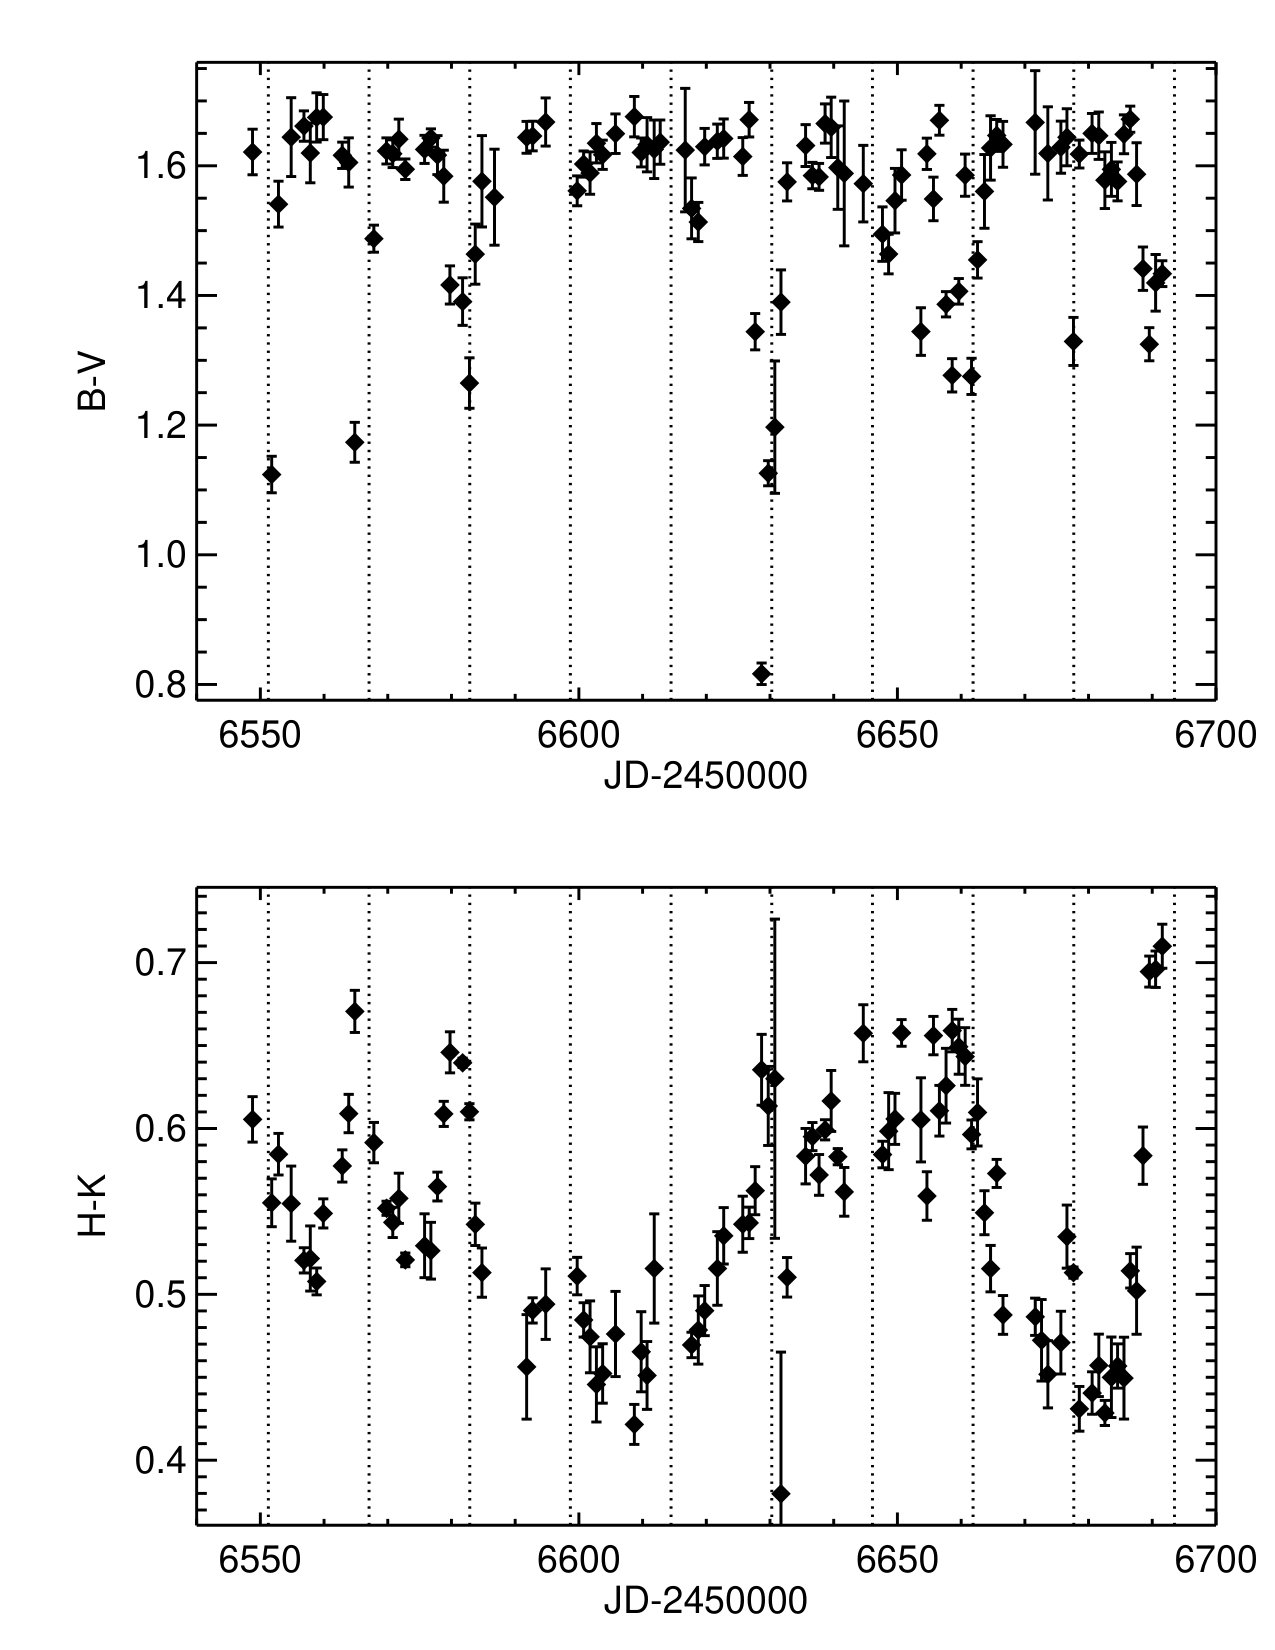 Figure 11
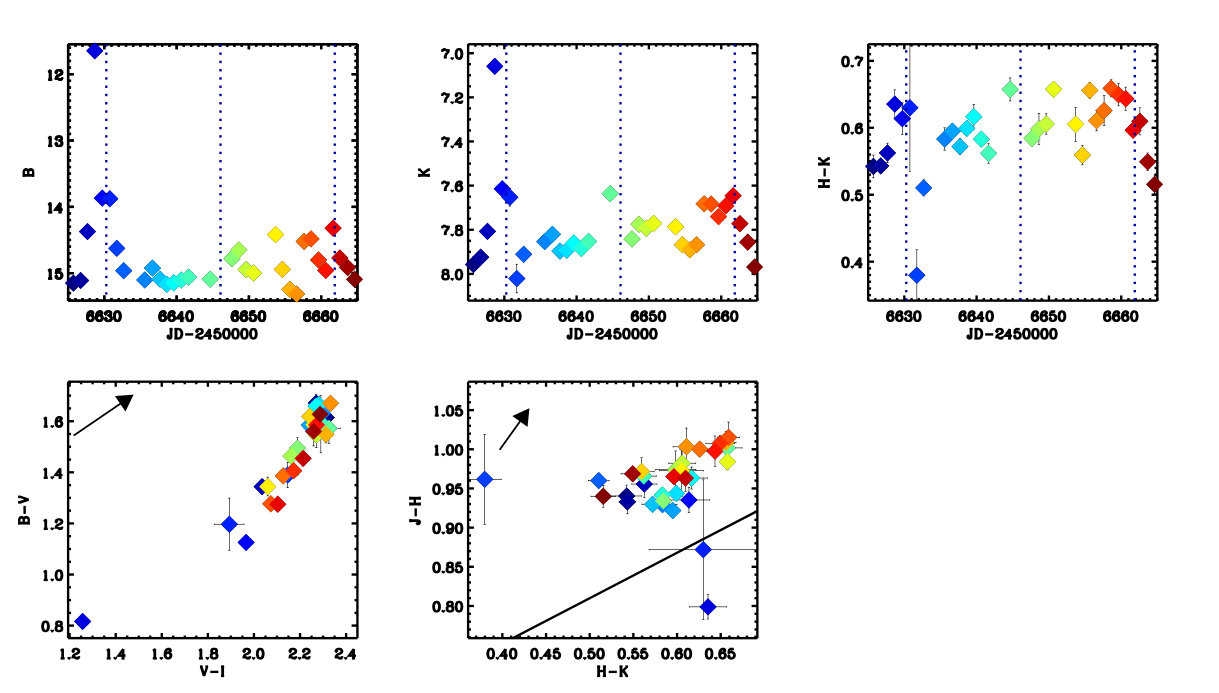 Figure 12
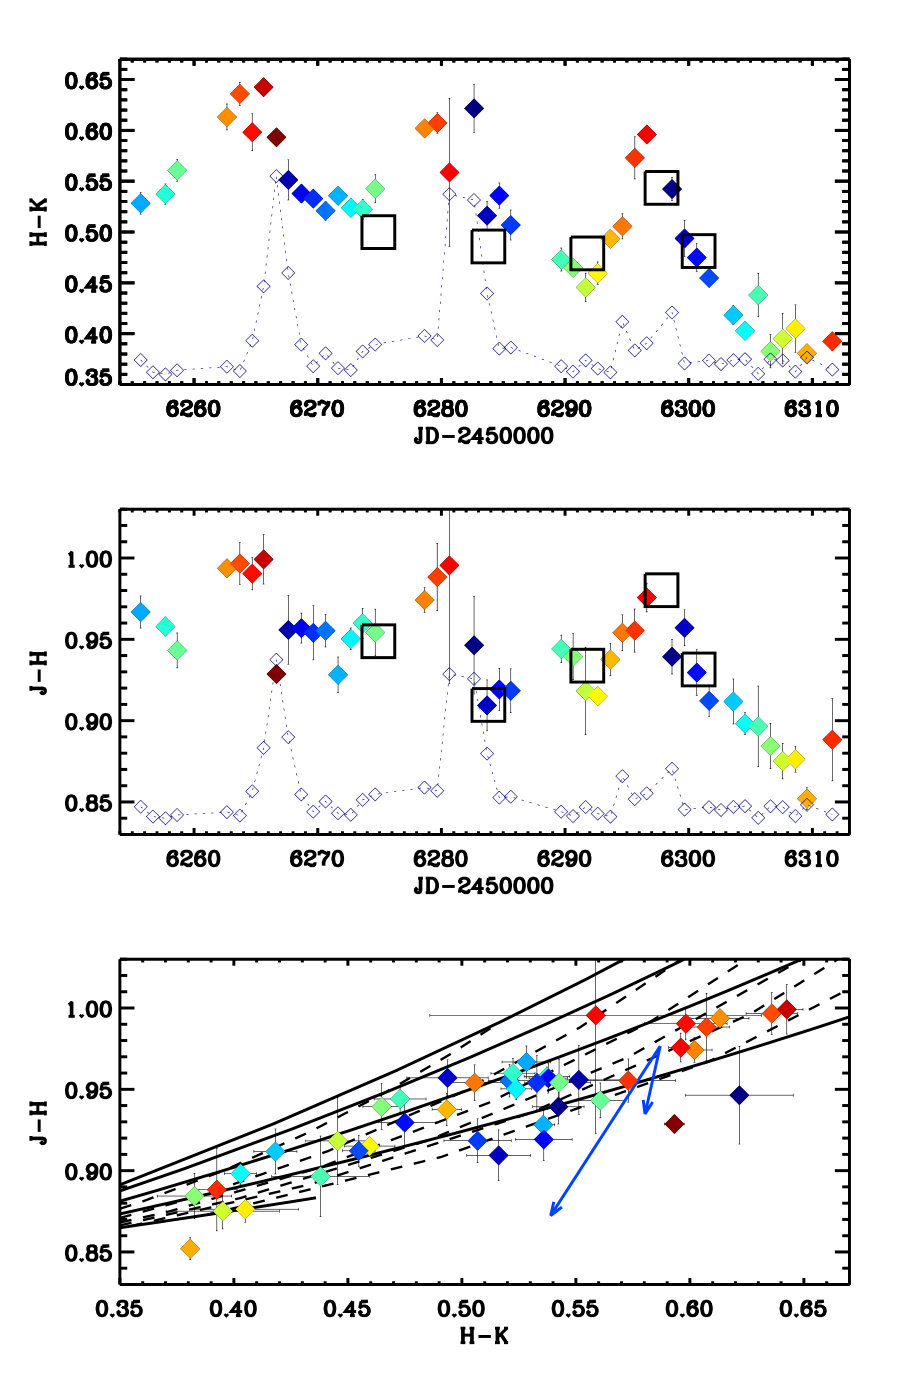 Figure 13
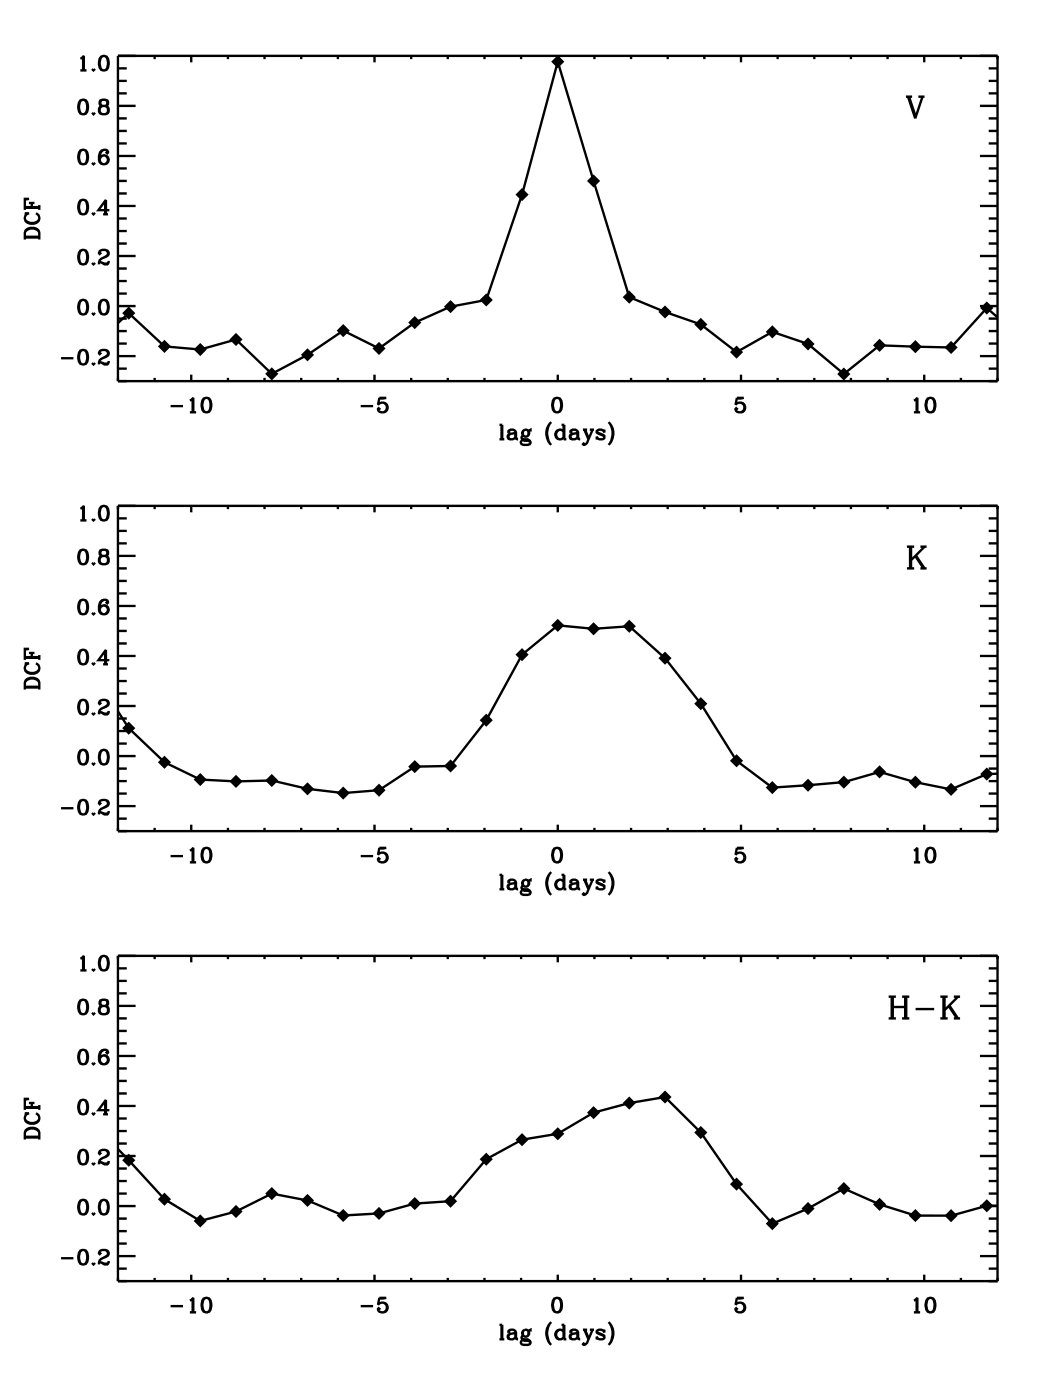 Figure 14
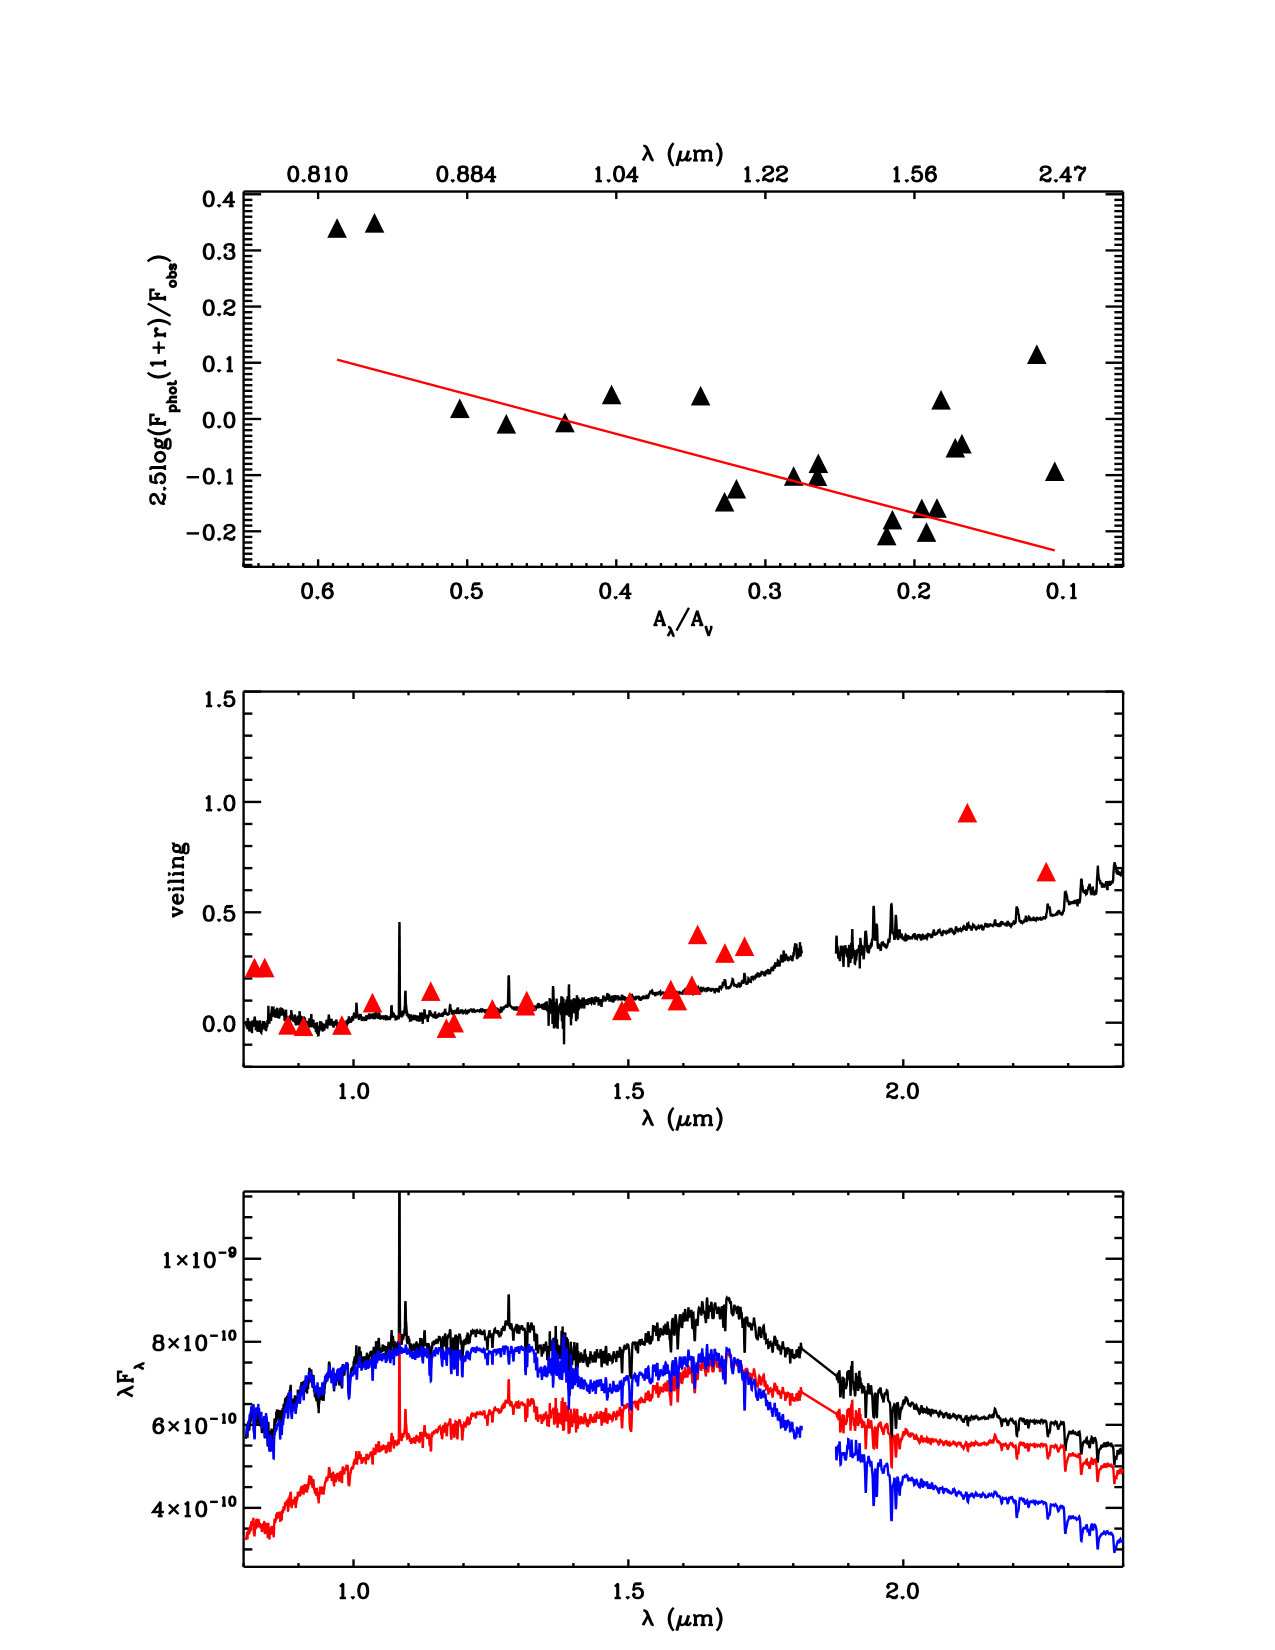 Figure 15
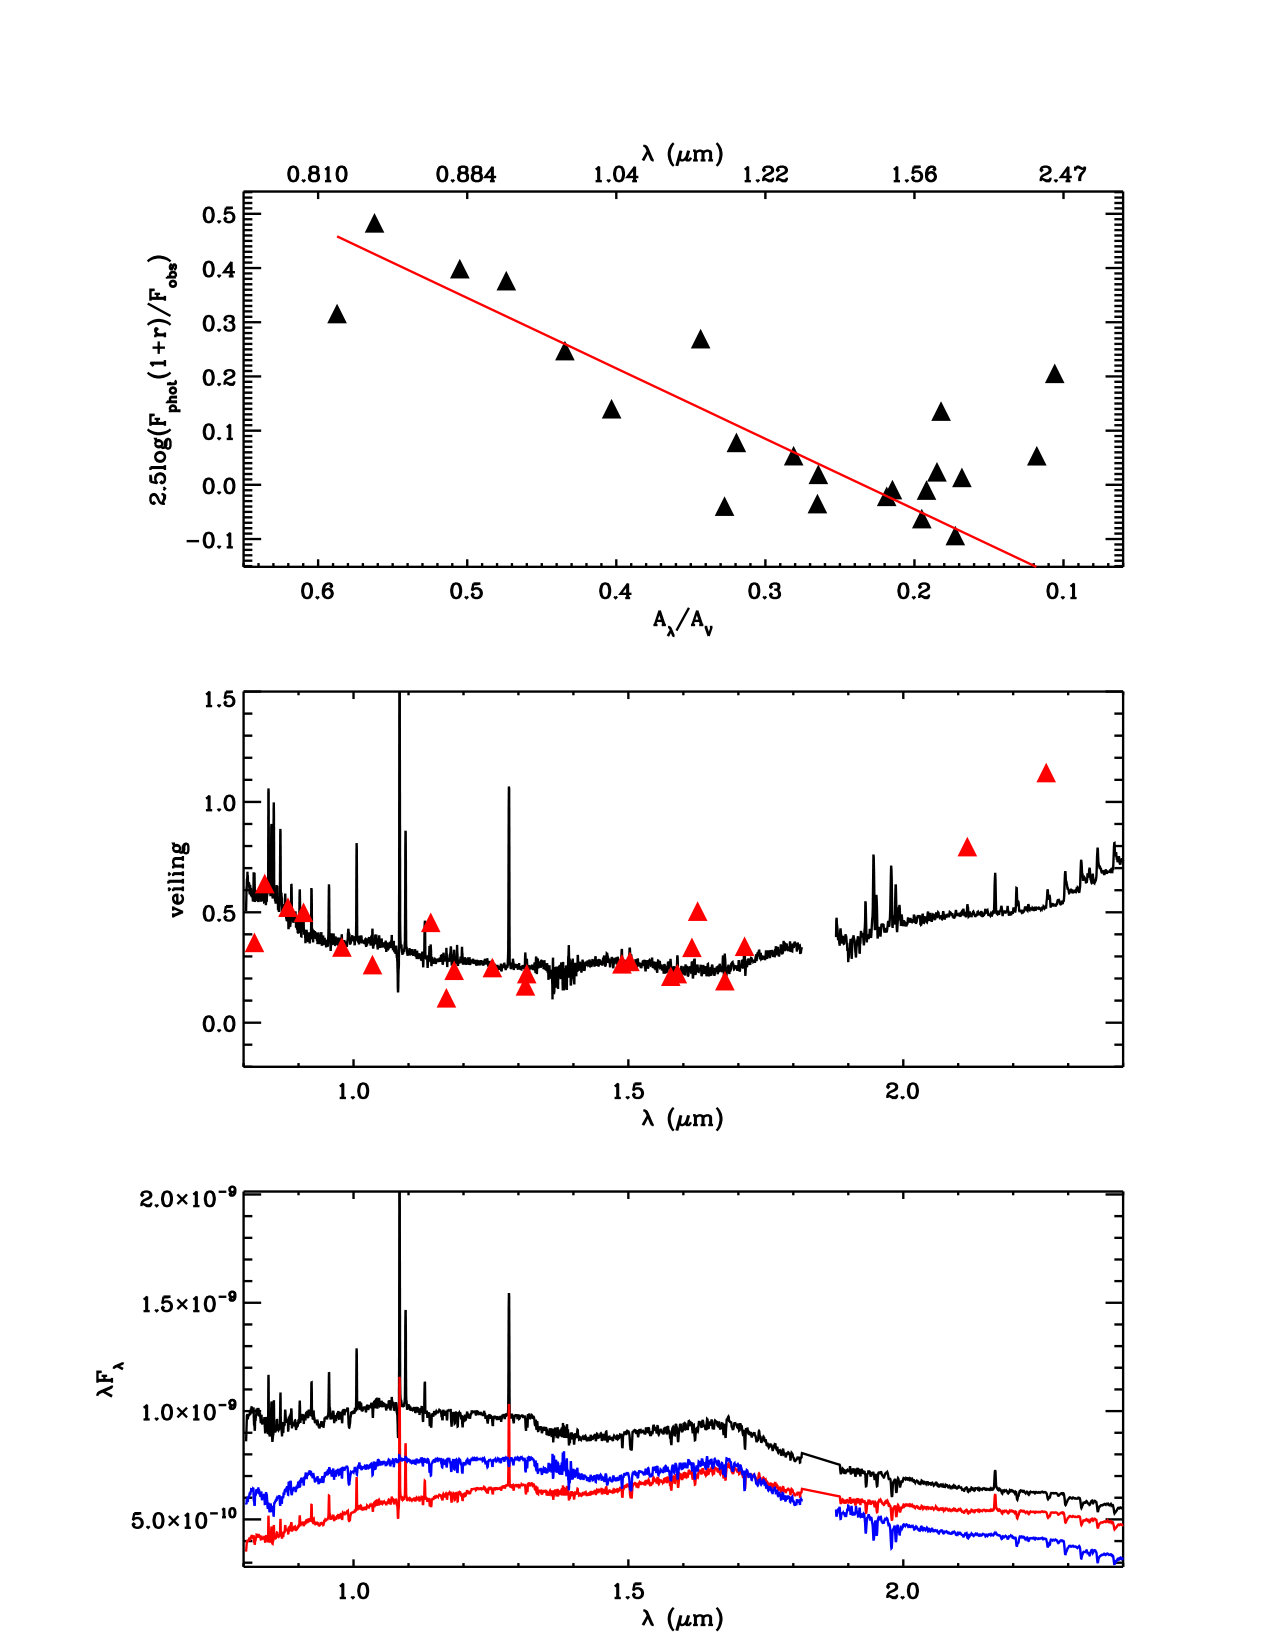 Figure 16
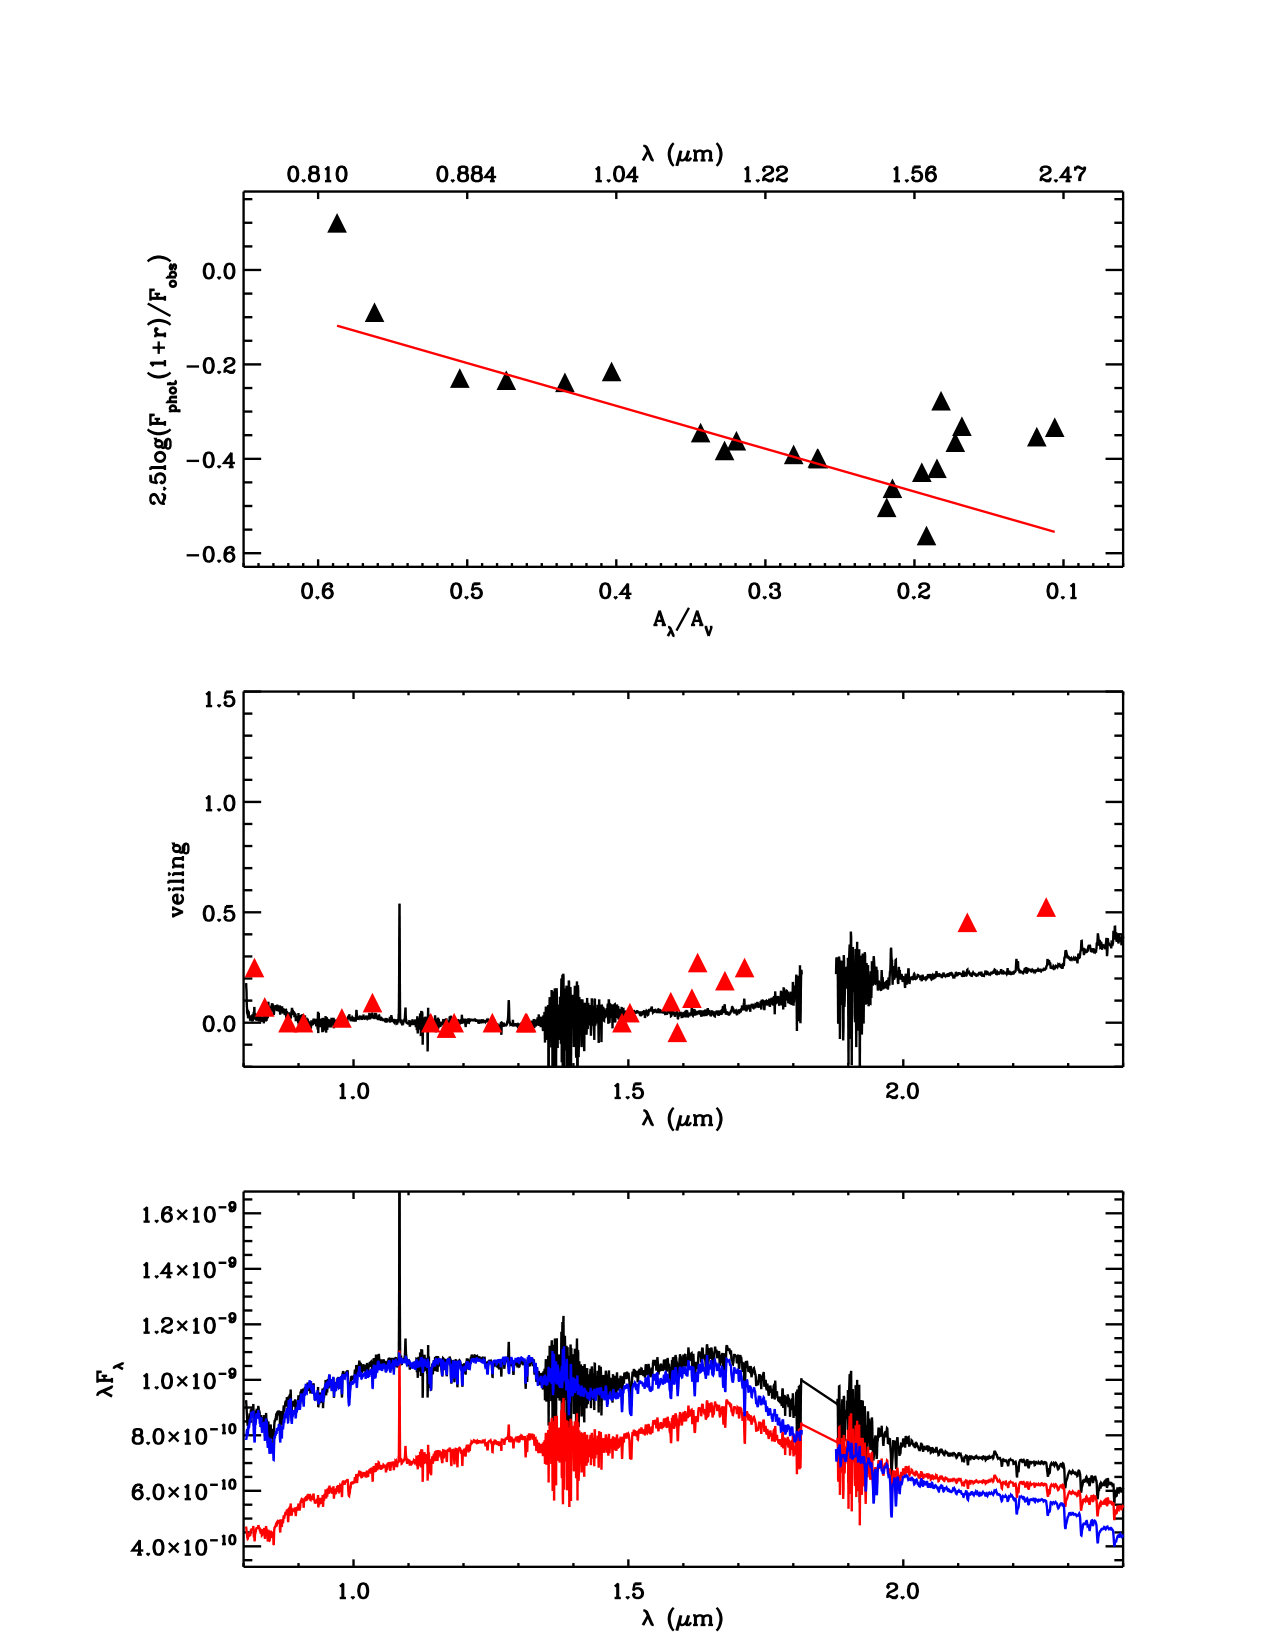 Figure 17
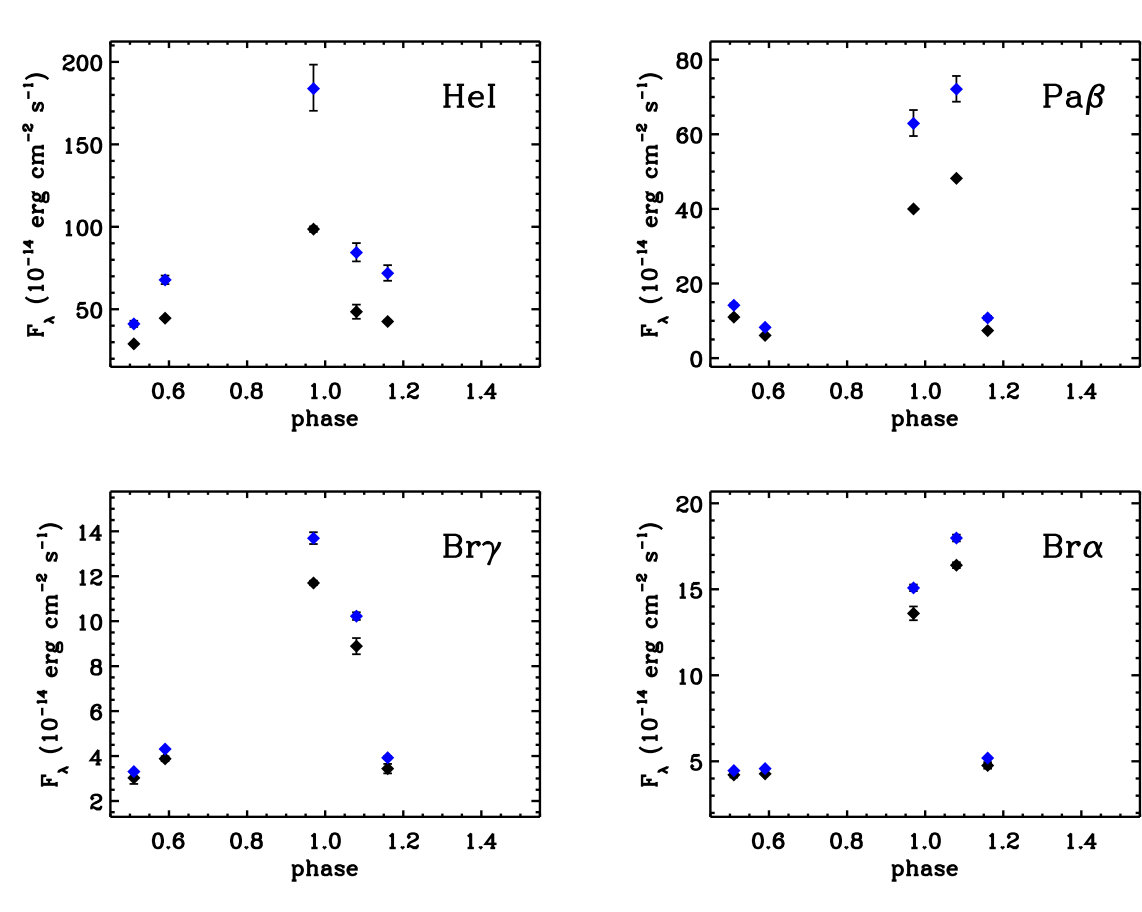 Figure 18
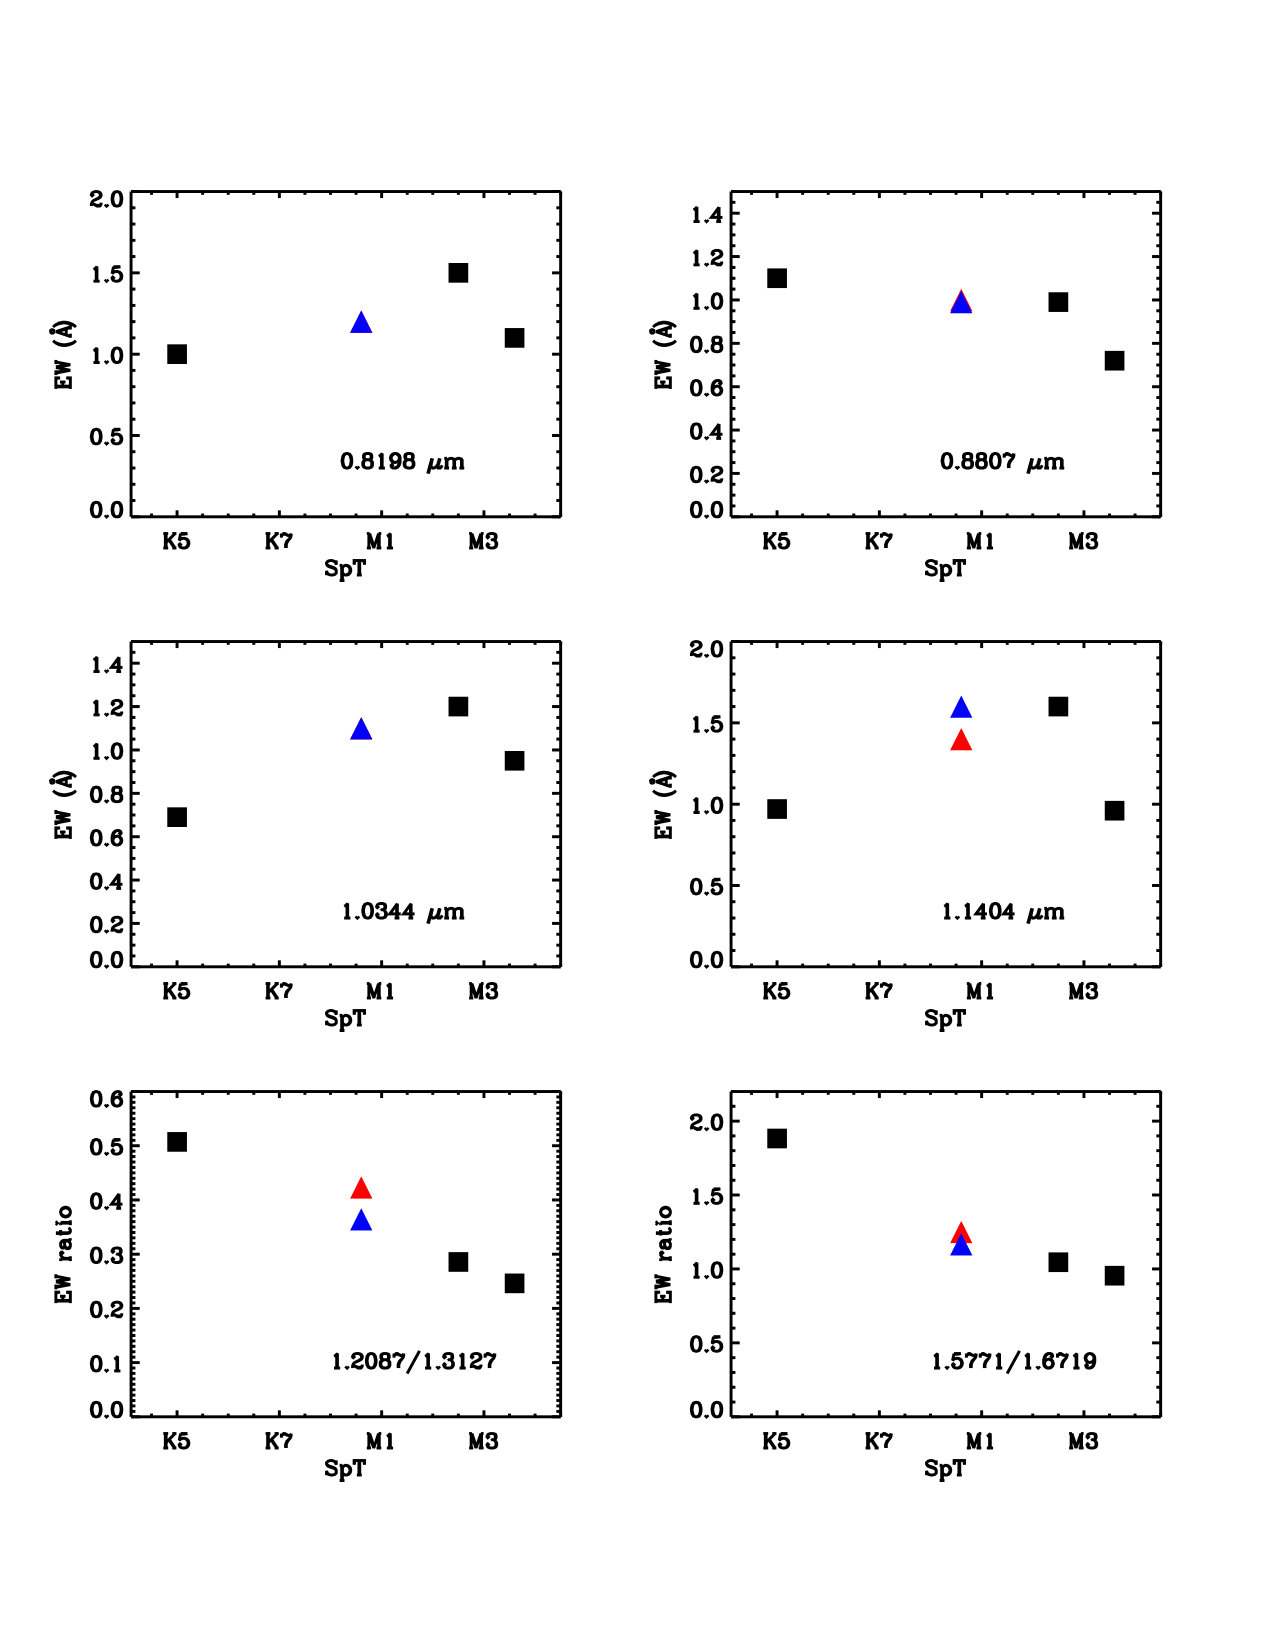 Figure 19
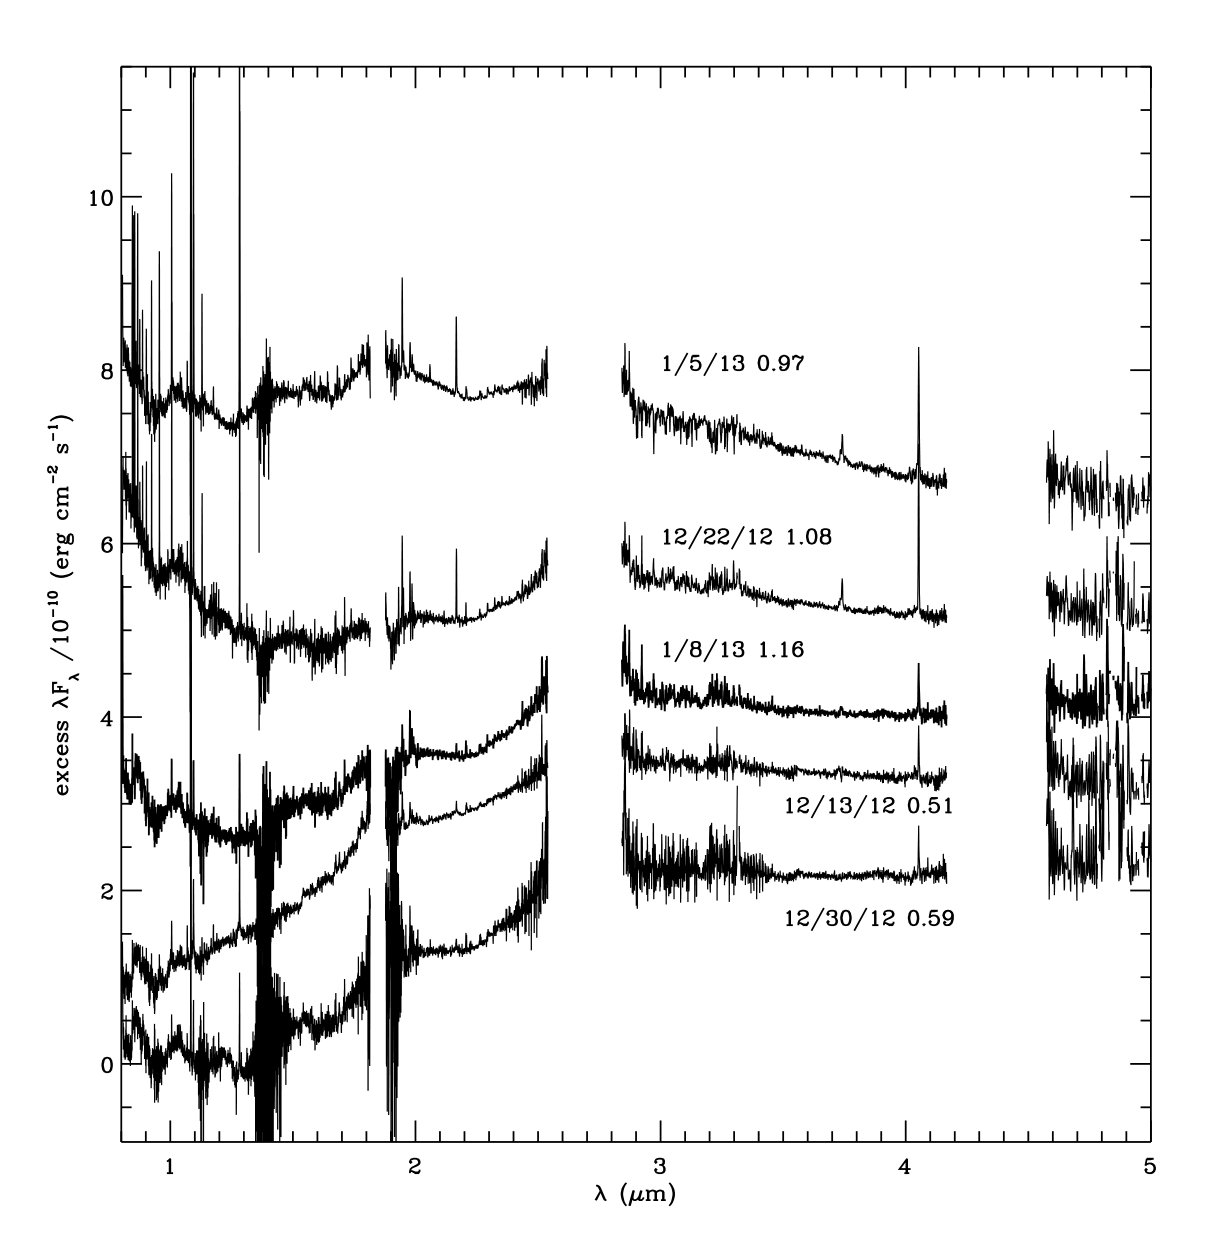 Figure 20
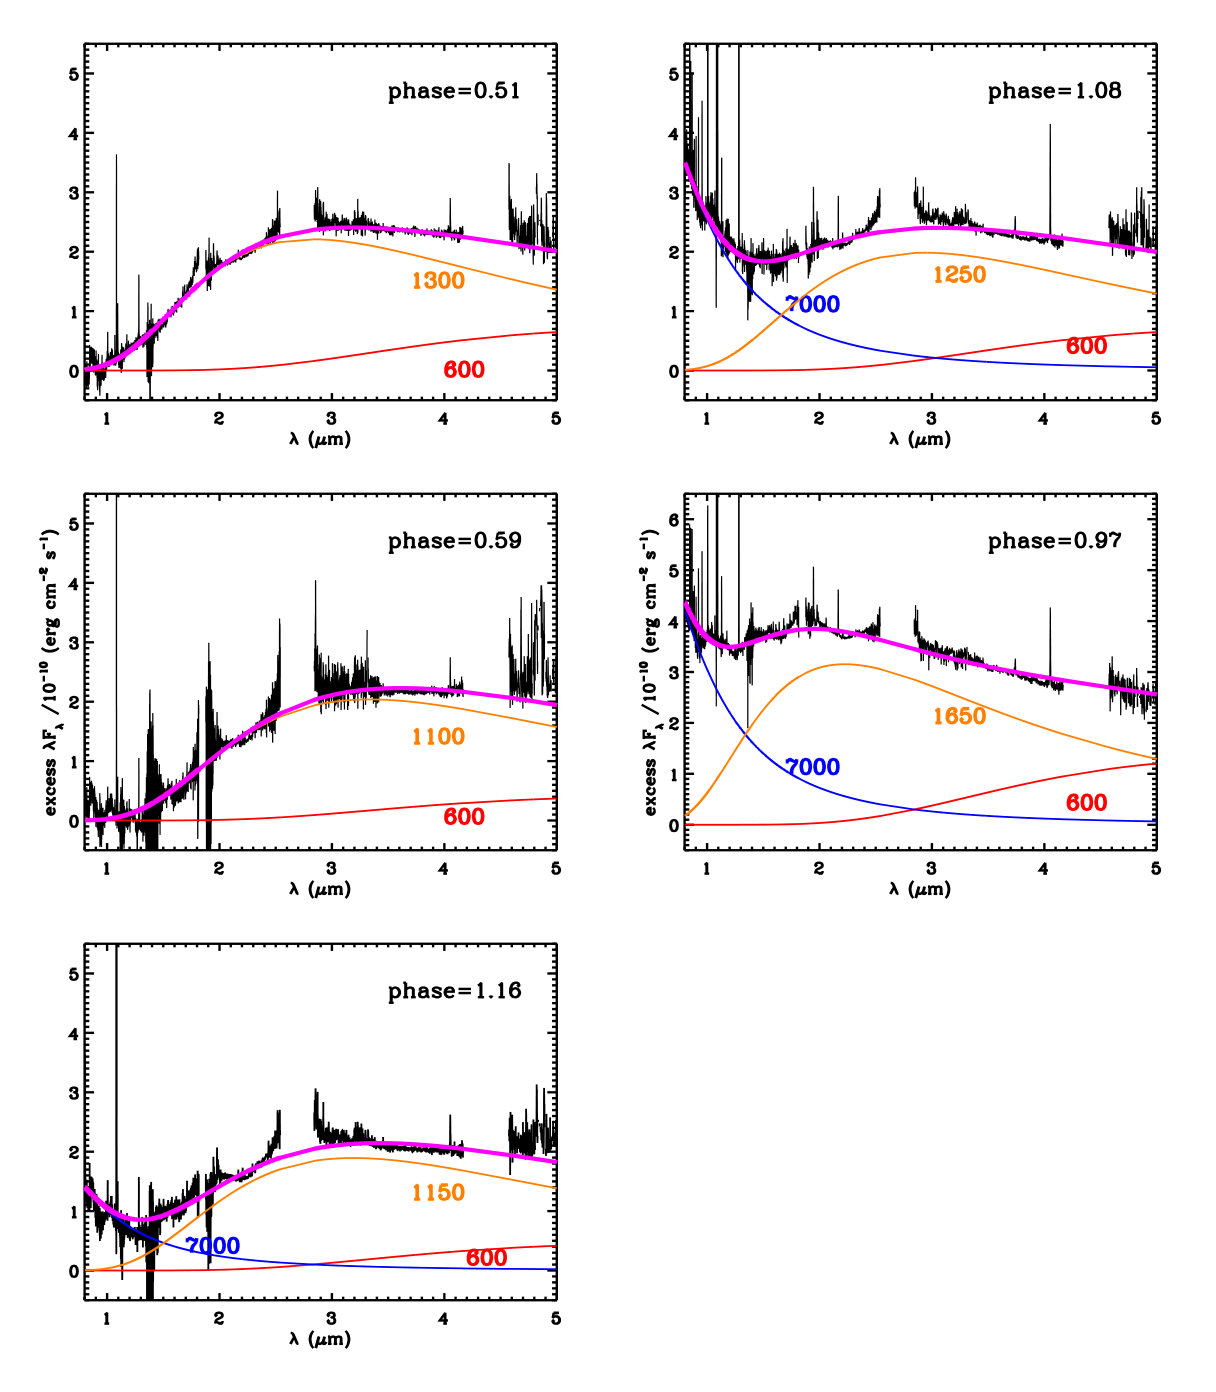 Figure 21
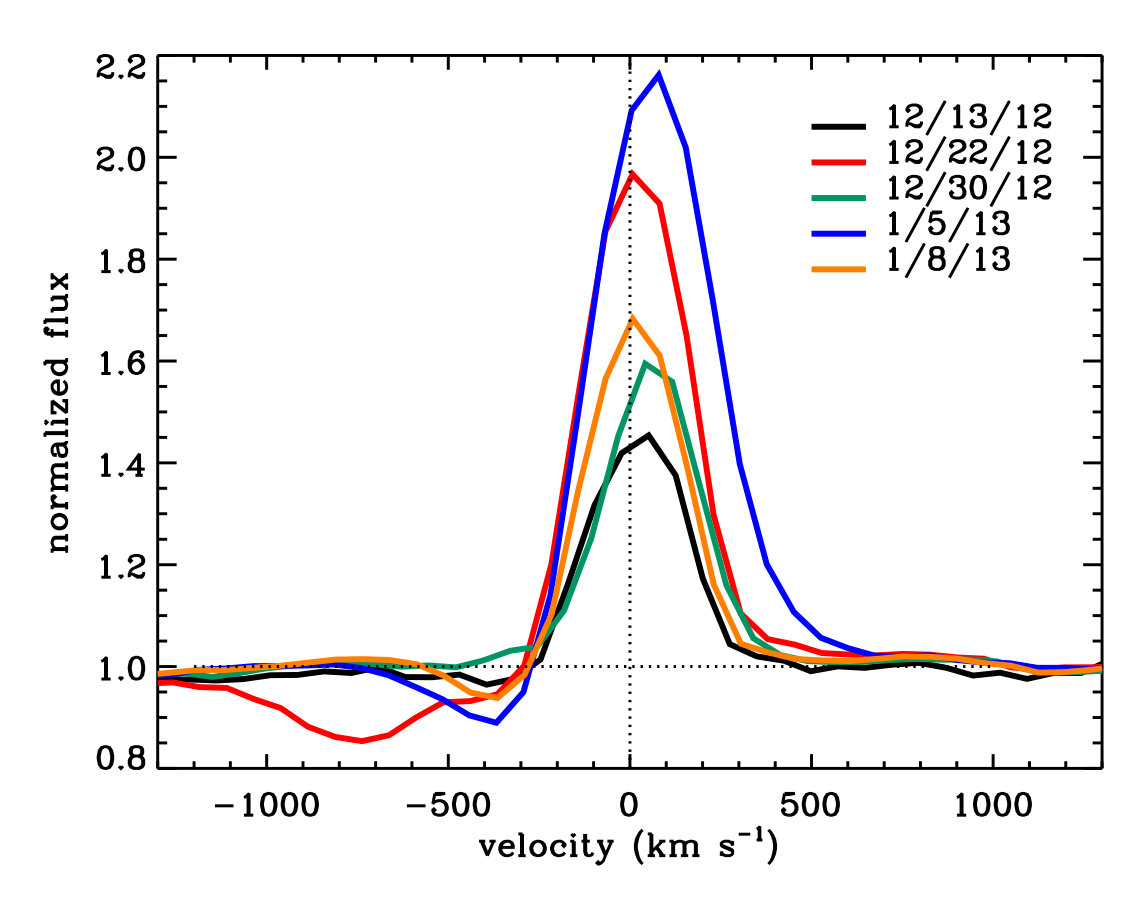 Figure 22
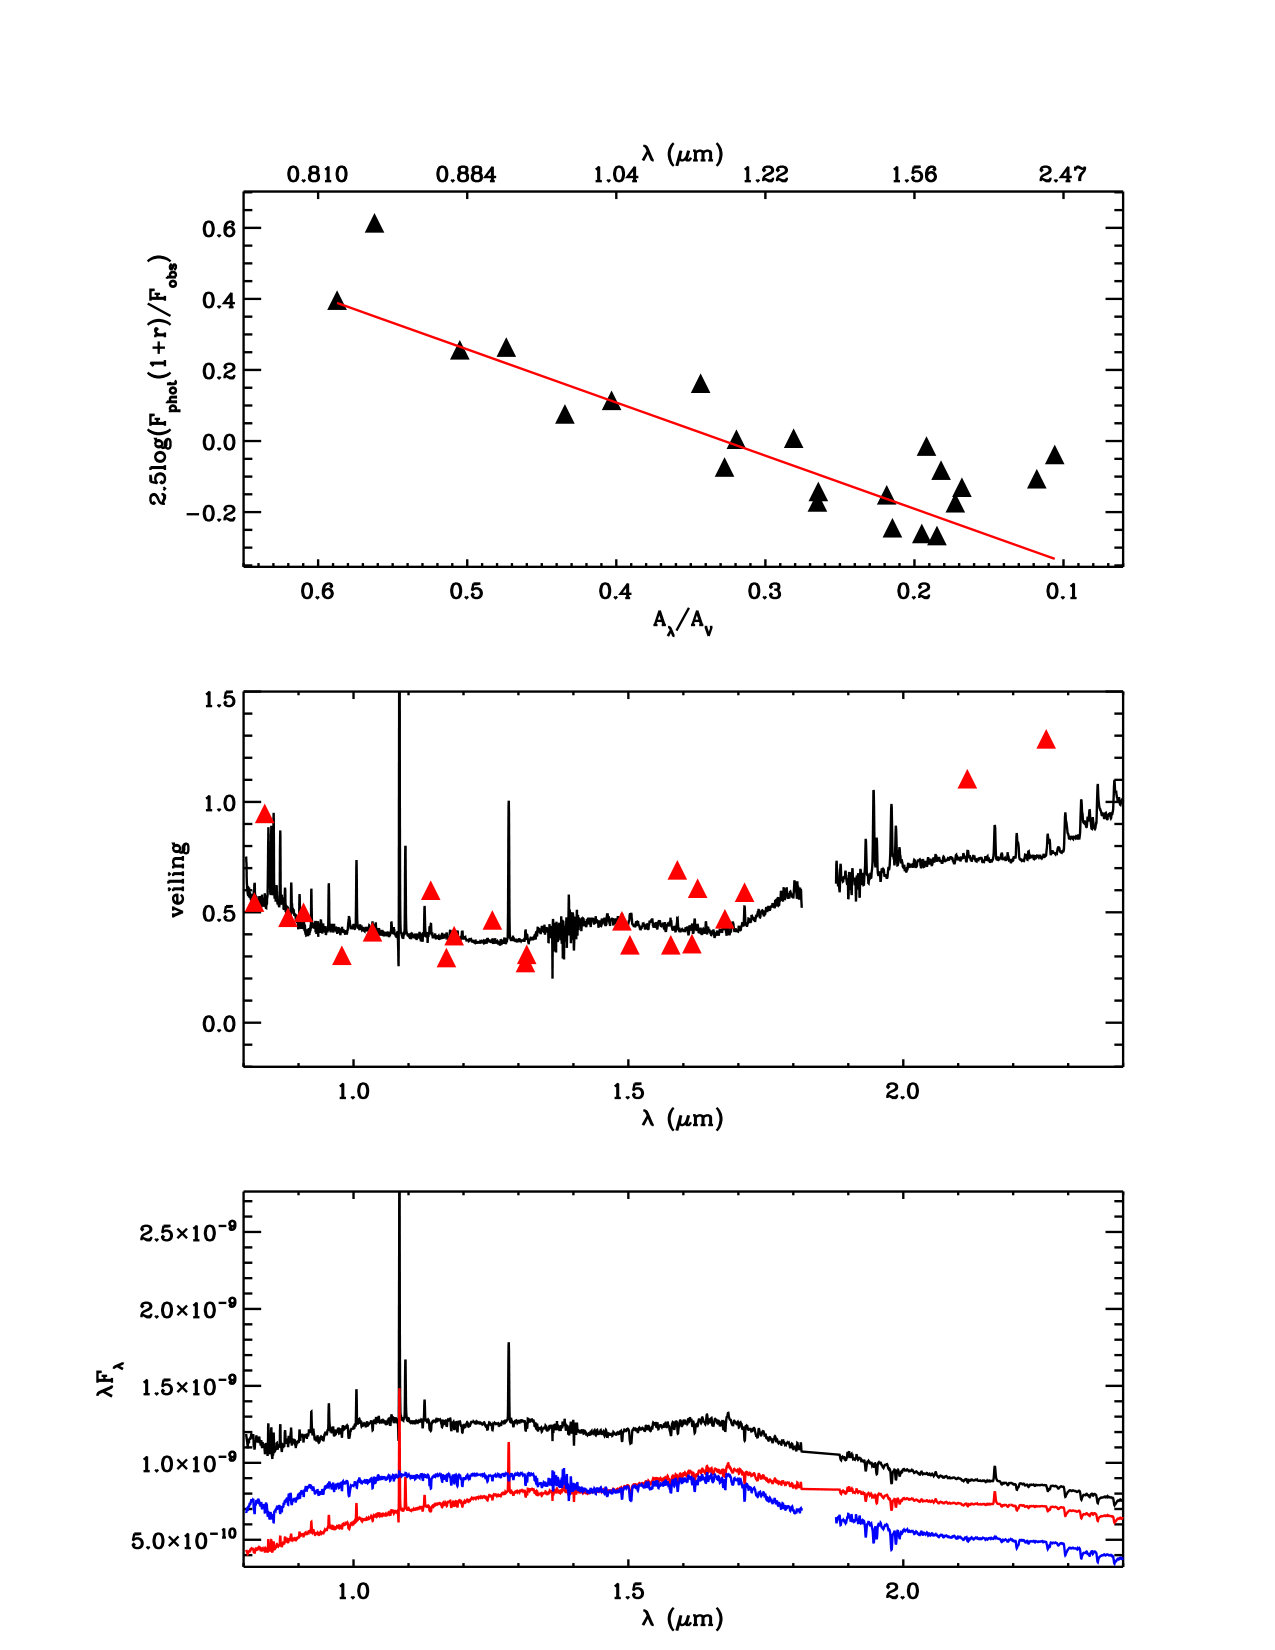 Figure 23
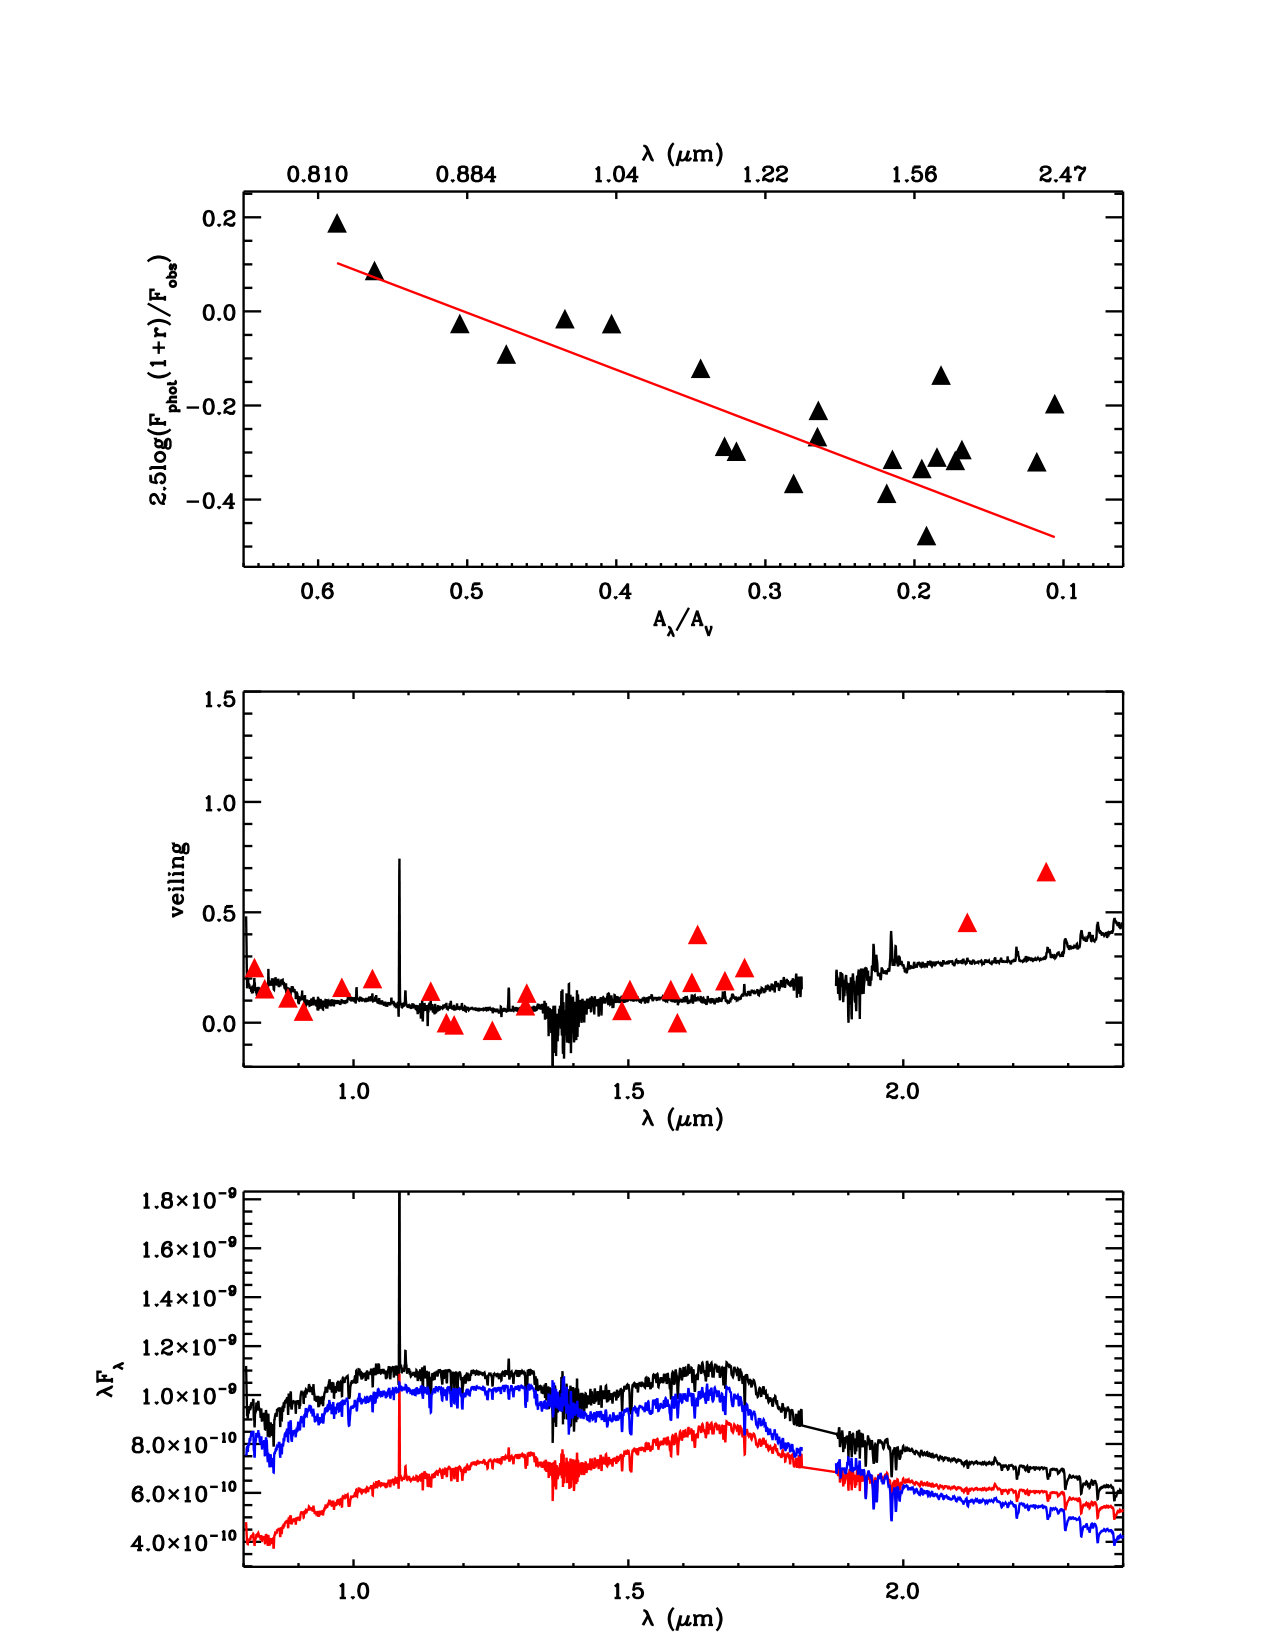 Figure 24
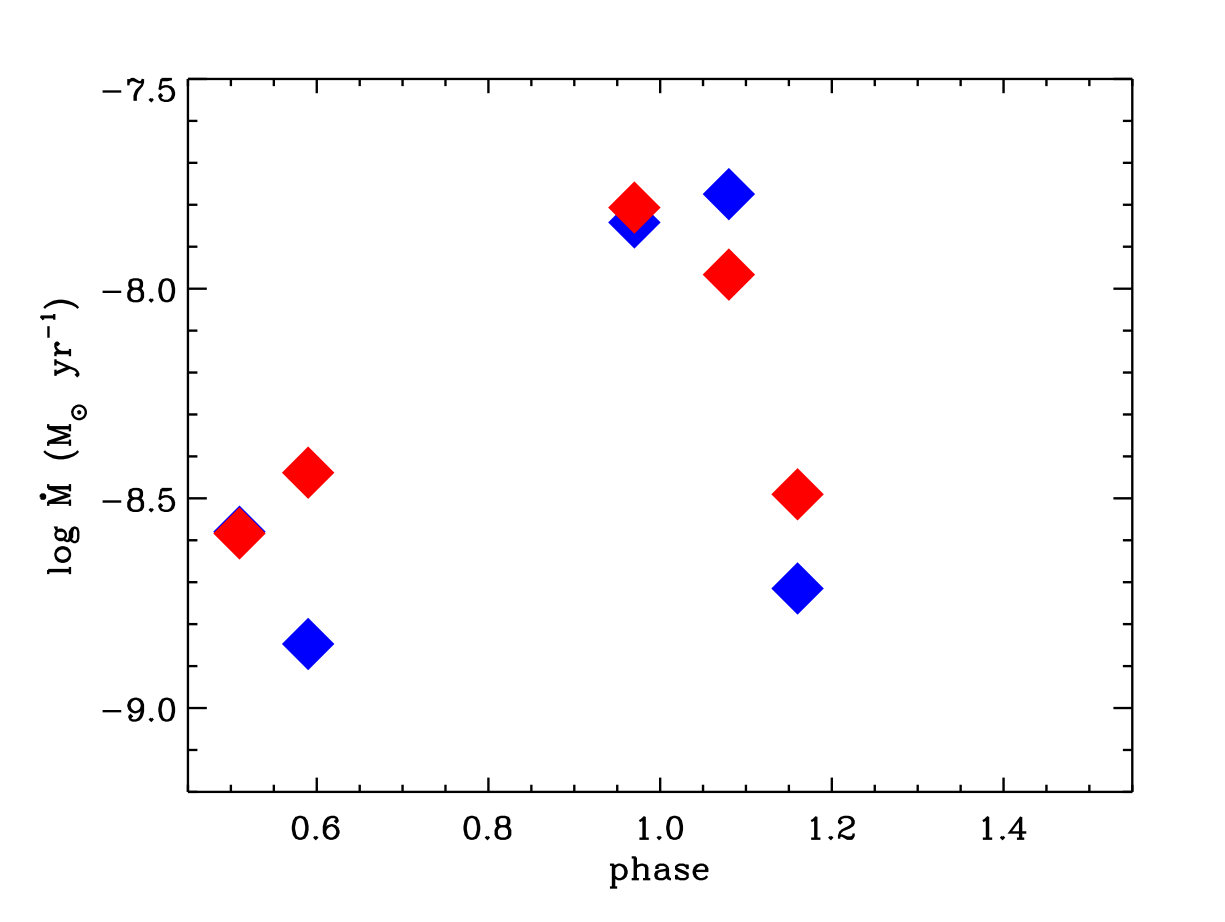 Figure 25
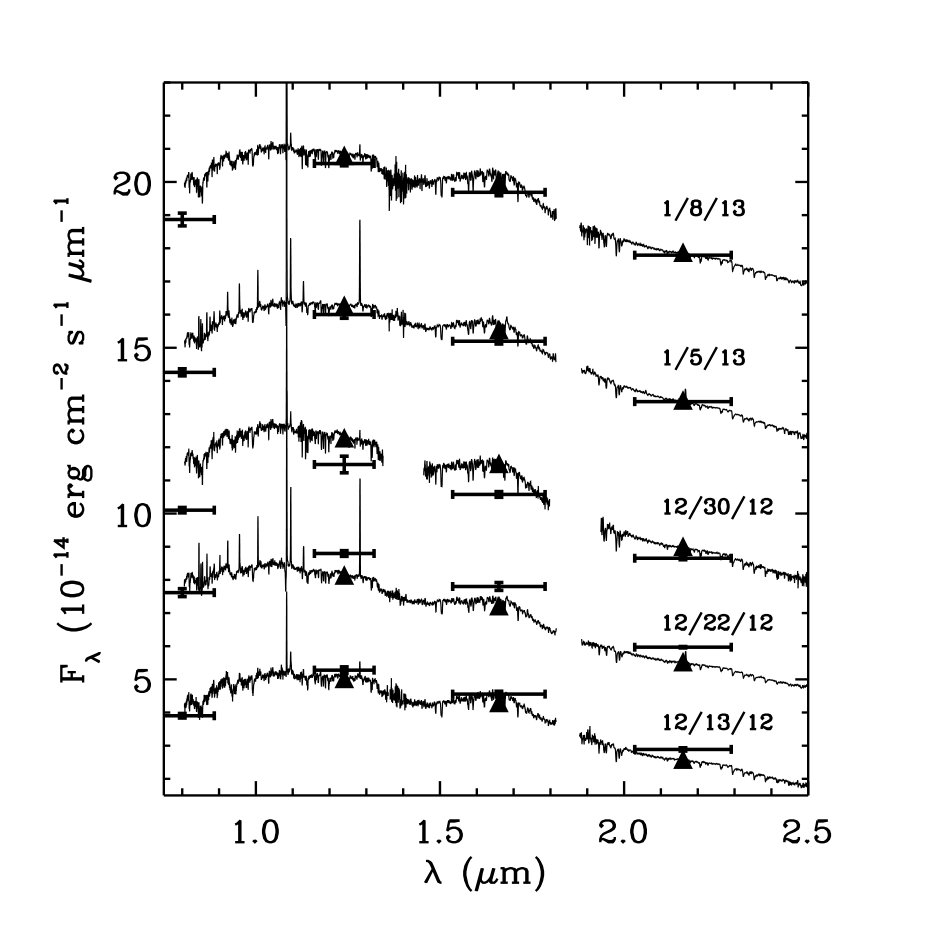 Figure 26
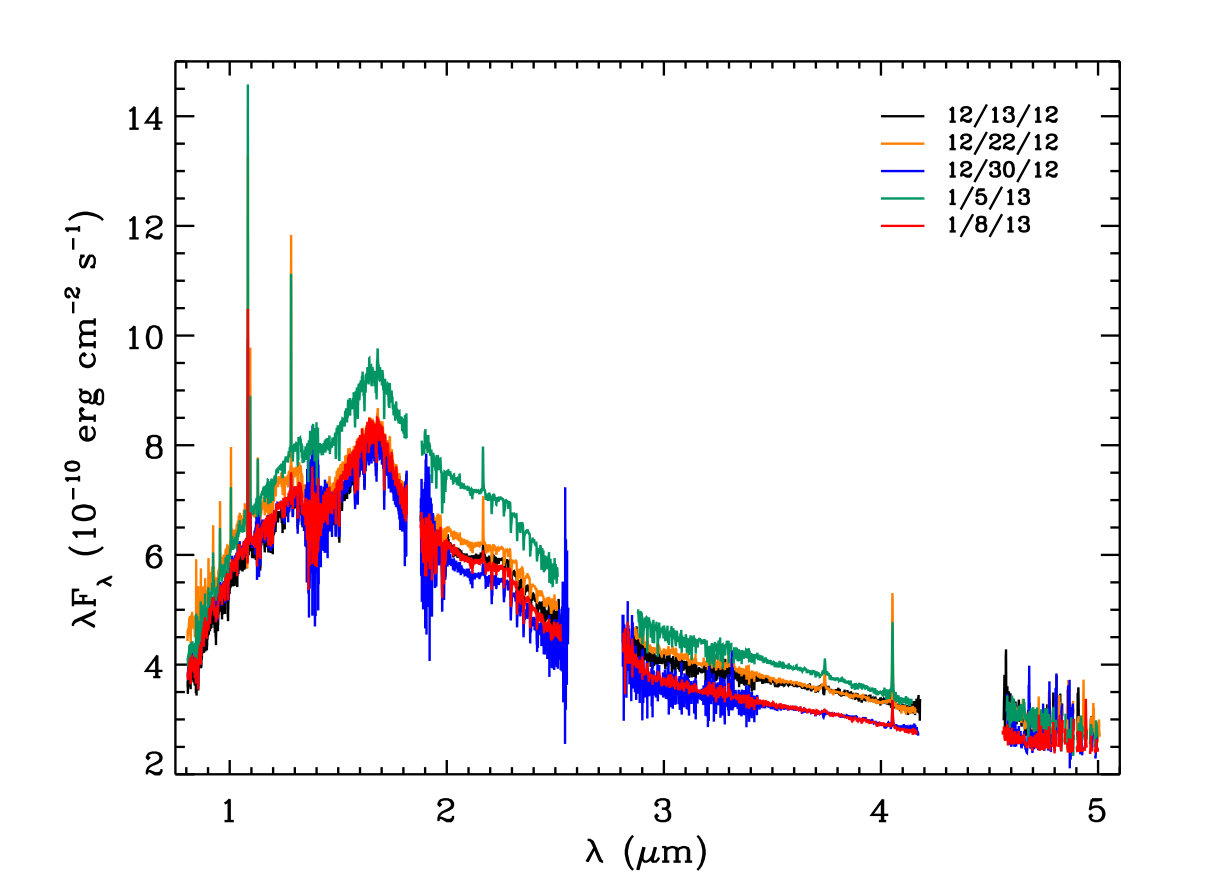 Figure 27
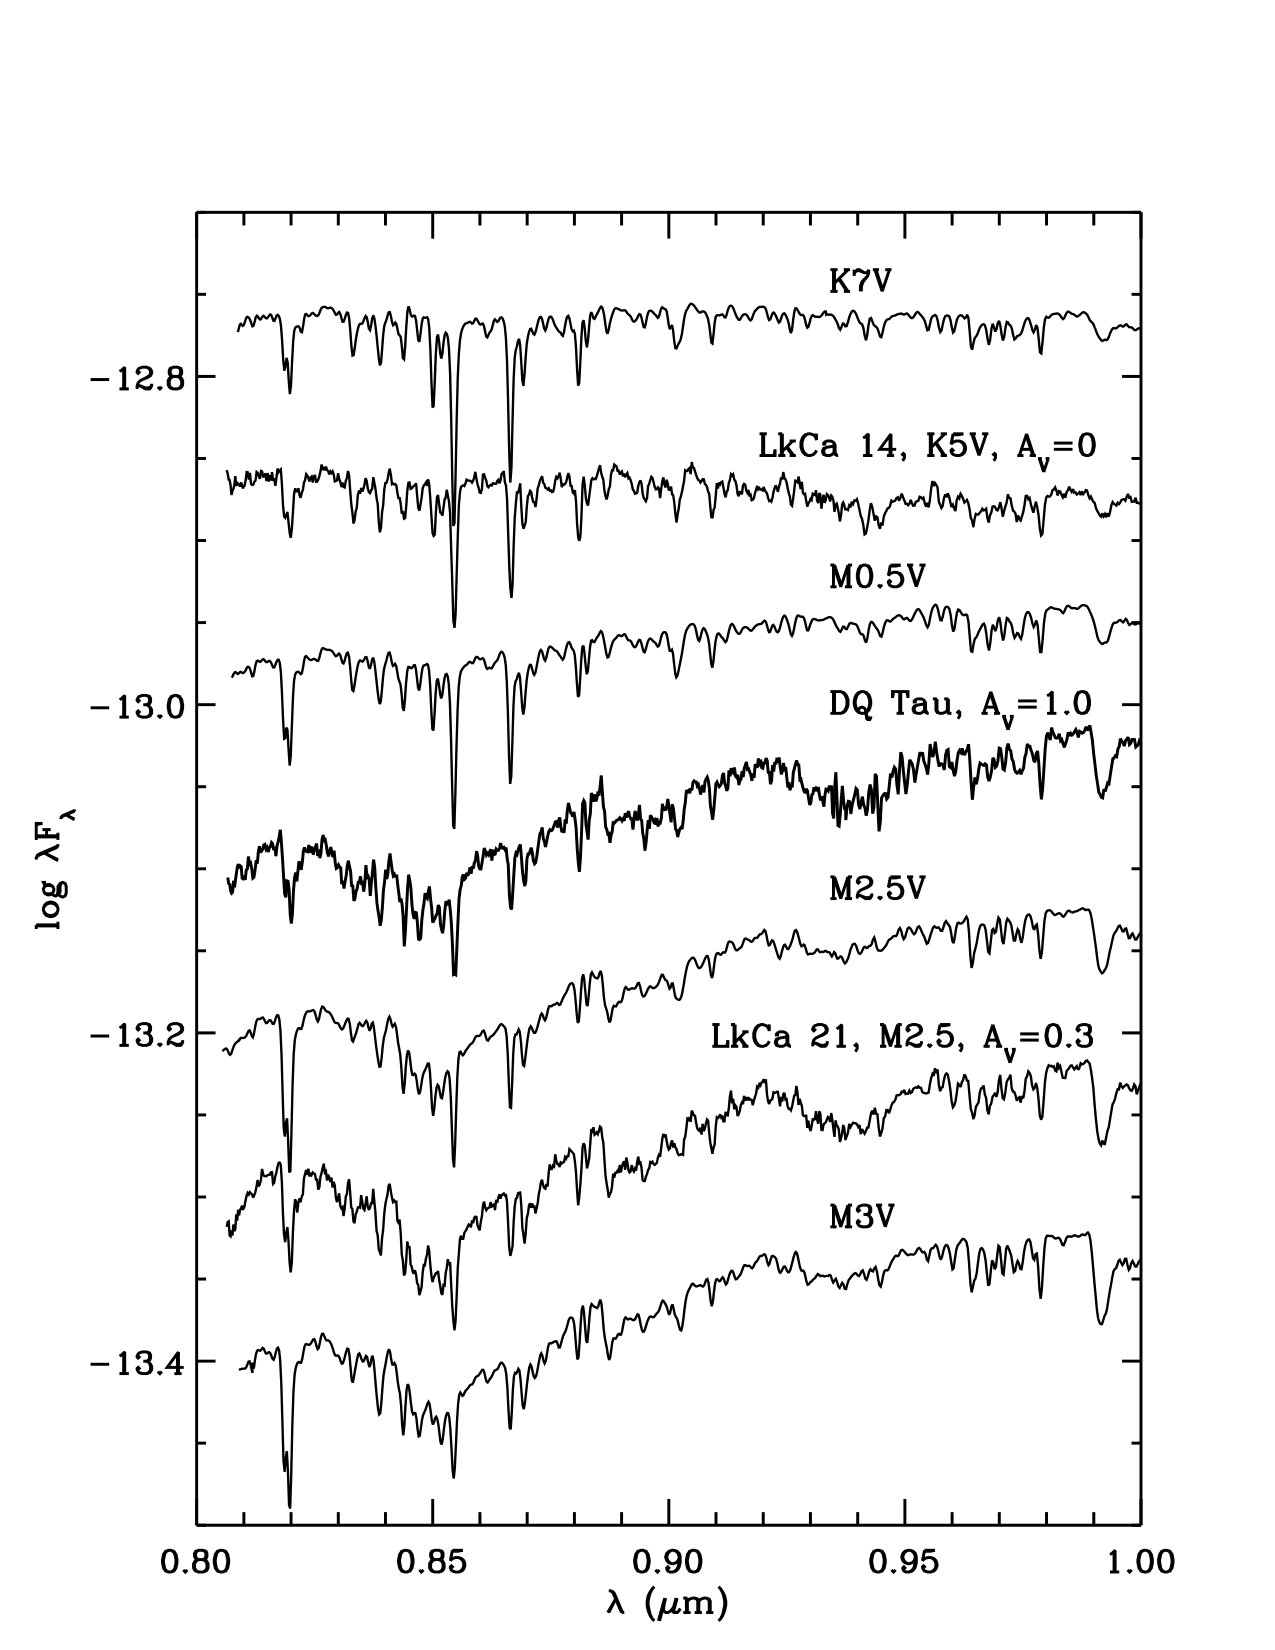 Figure 28
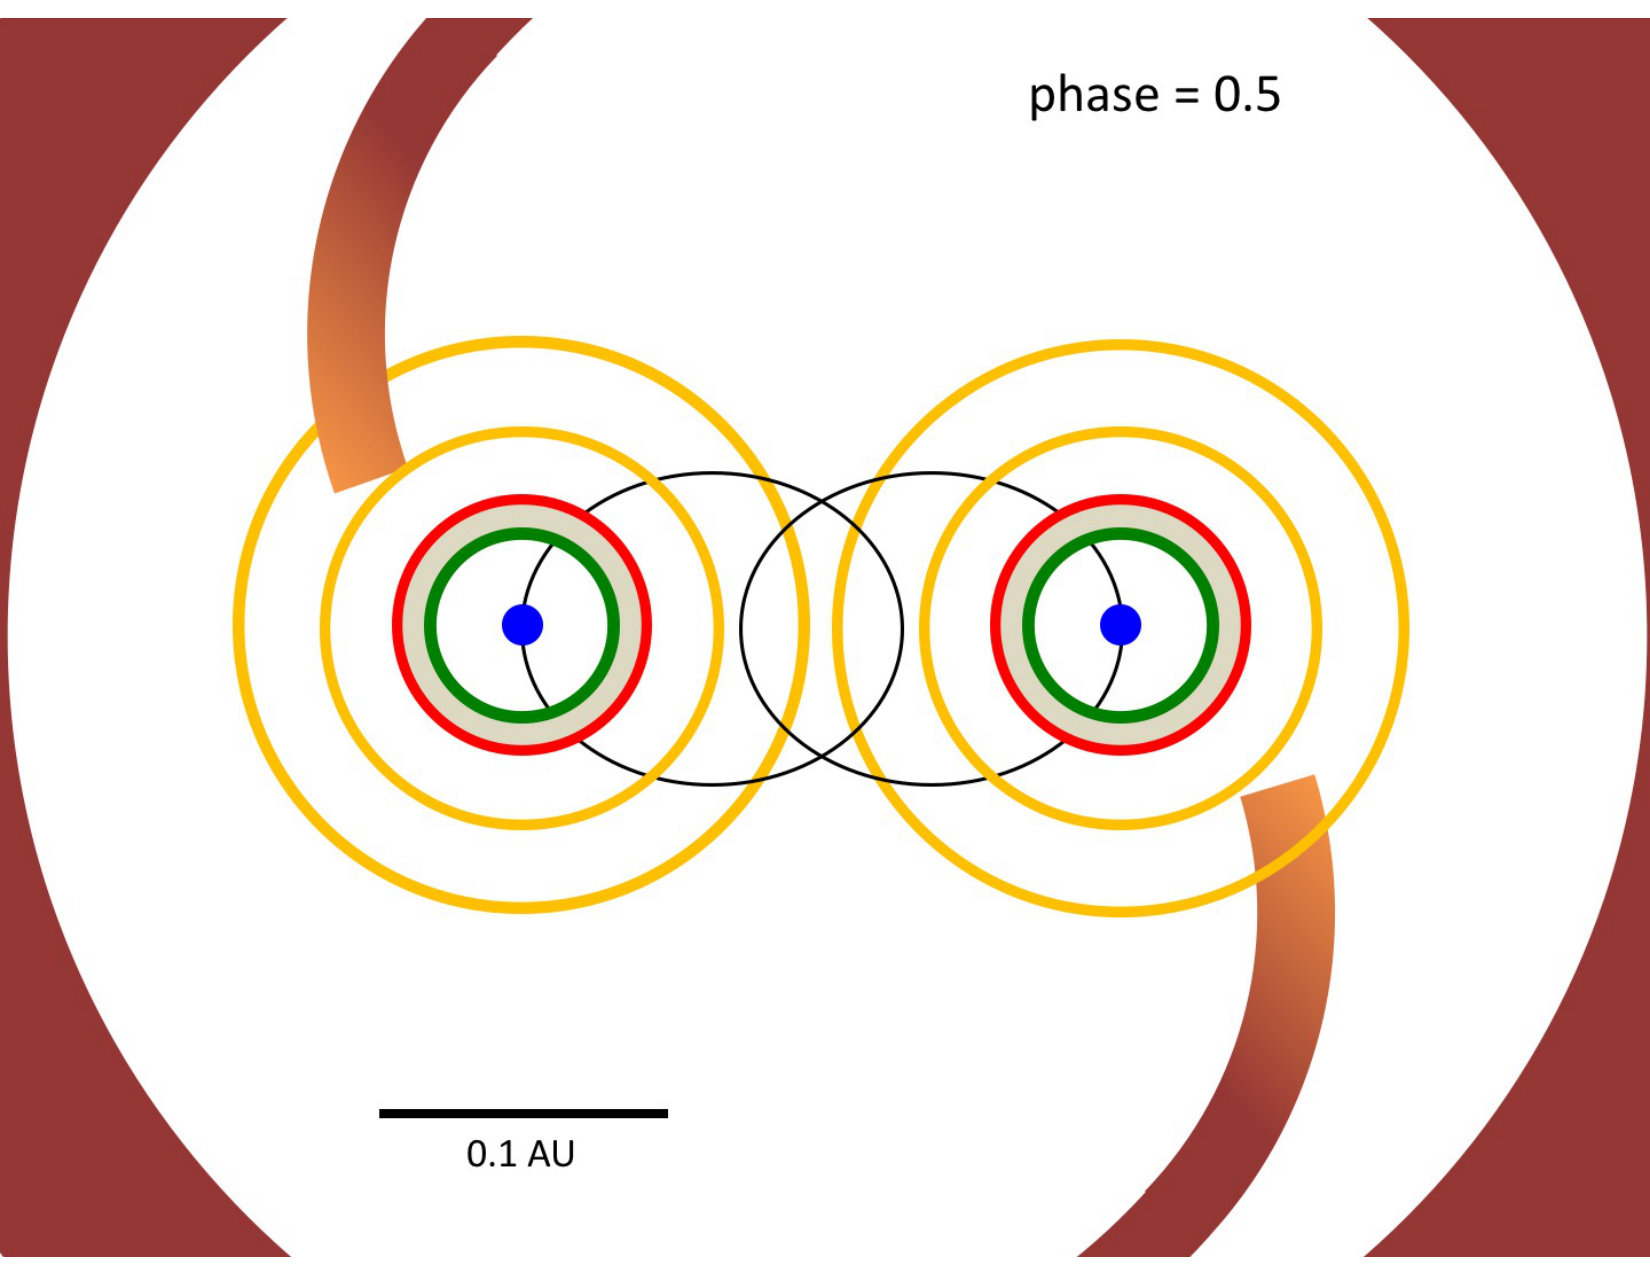 Figure 29
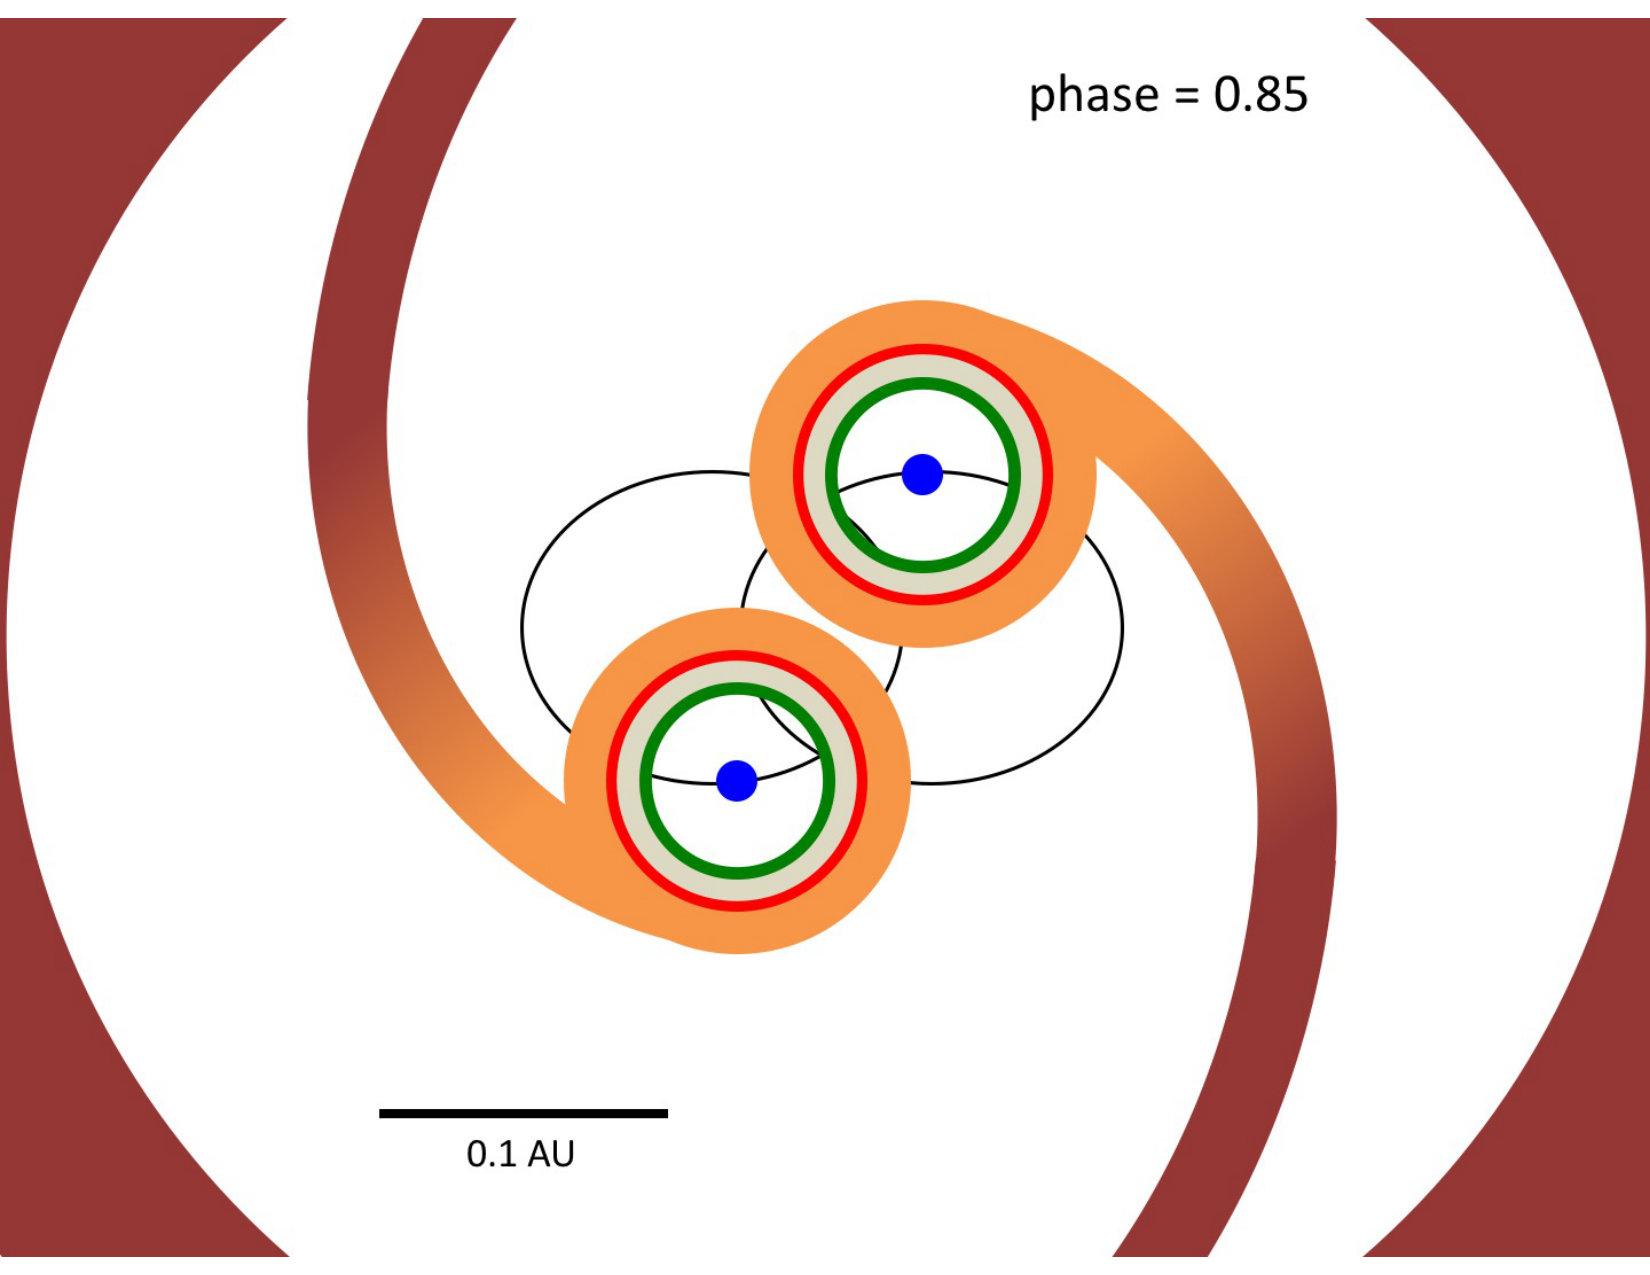 Figure 30
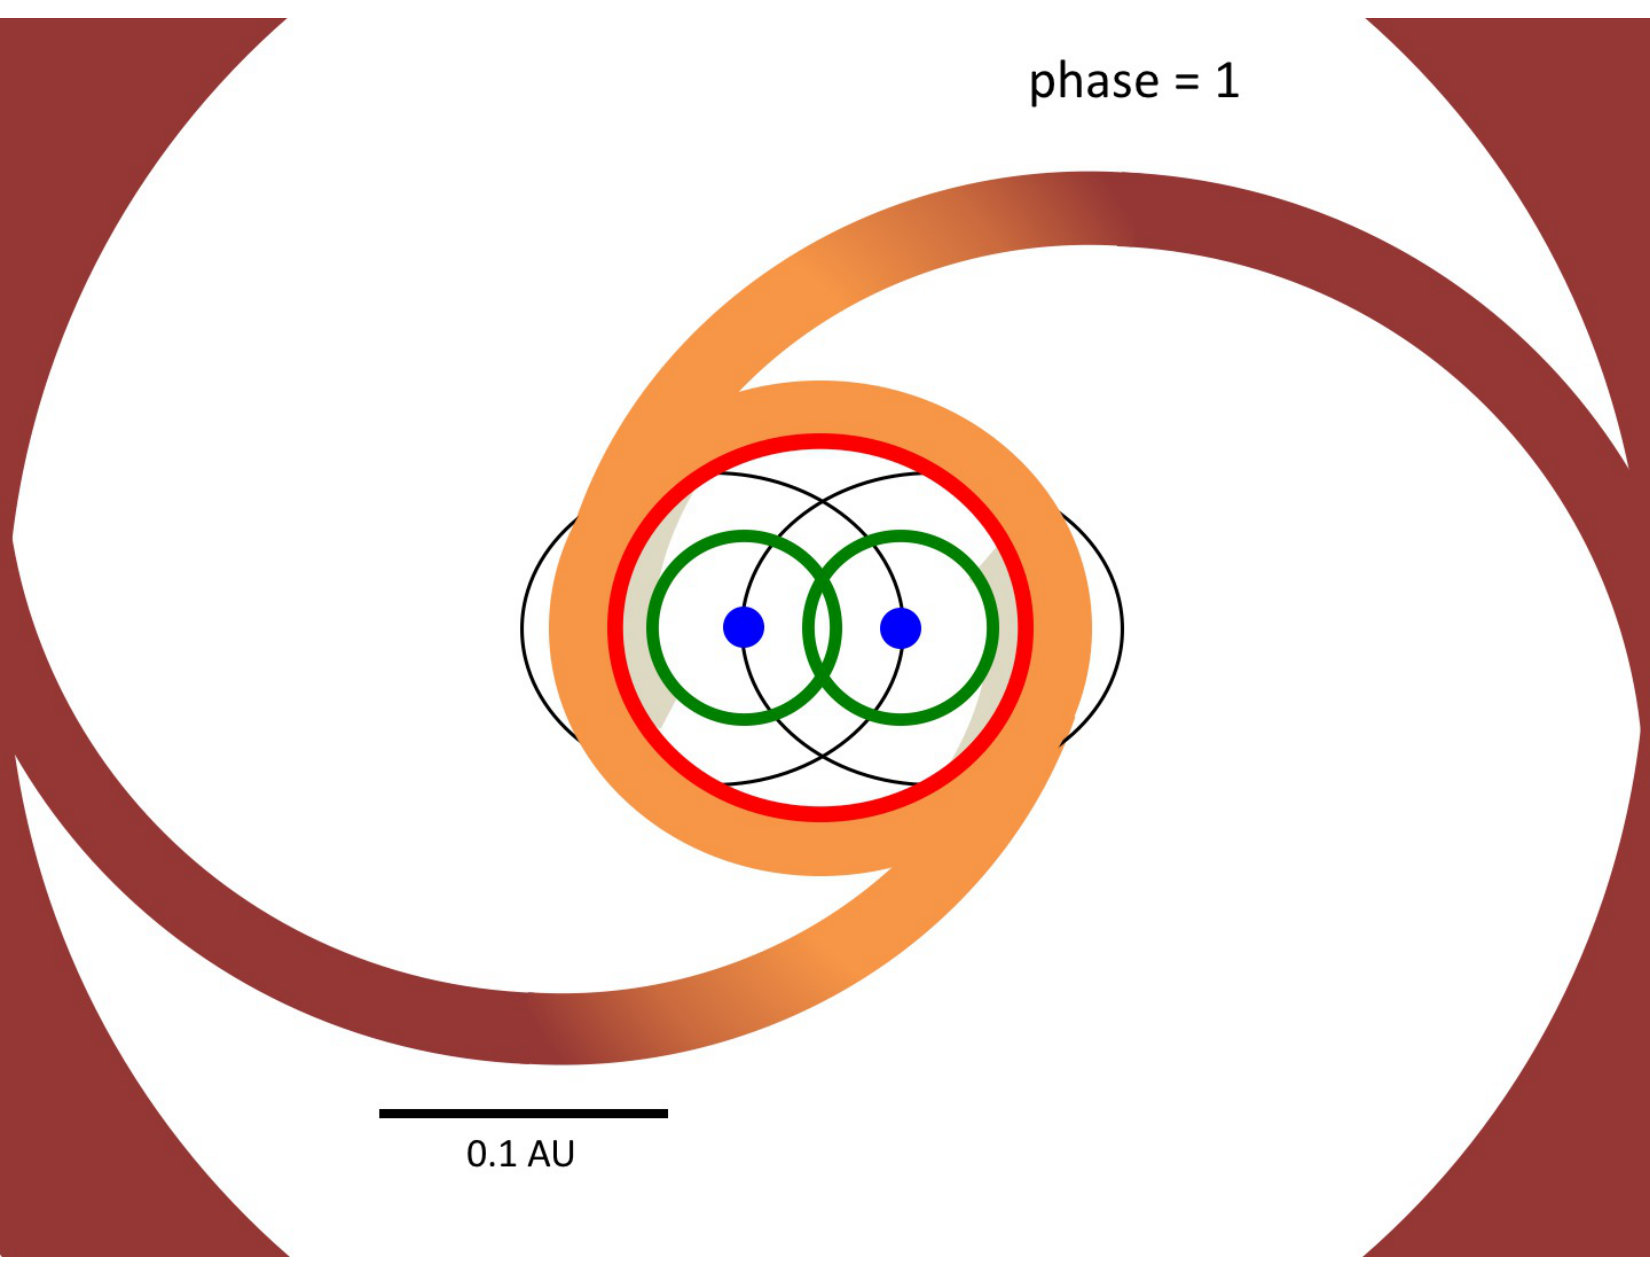 Figure 31
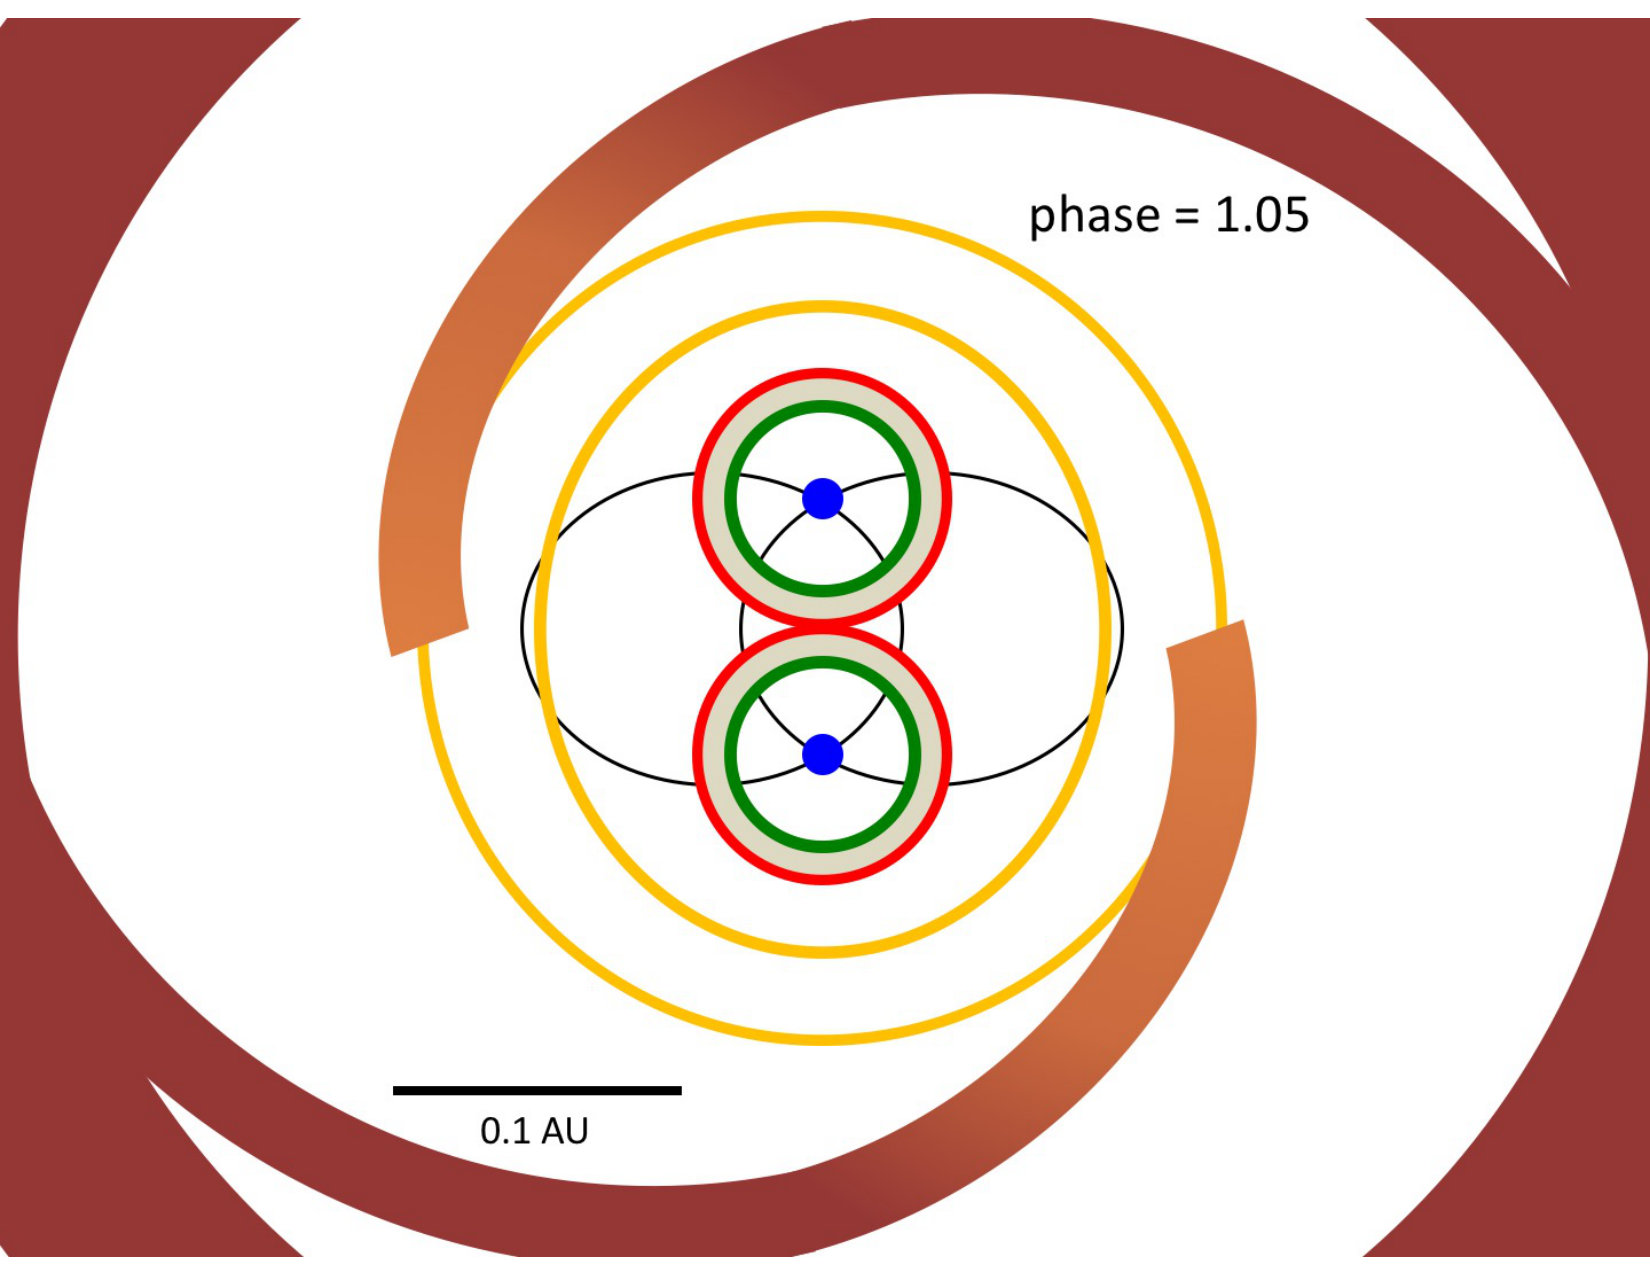 Figure 32
| property | adopted value | reference |
|---|---|---|
| (days) | 15.80158 | Czekala et al. (2016) |
| 0.568 | Czekala et al. (2016) | |
| (HJD-2,400,000) | 47433.507 | Czekala et al. (2016) |
| d (pc) | 196 | Bailer-Jones et al. (2018)aaBased on the Gaia DR2 catalog. |
| (K) | 3700 | Czekala et al. (2016) |
| (deg) | 158 | Czekala et al. (2016) |
| () | 1.21 | Czekala et al. (2016)bbEstimated by Czekala et al. assuming a distance of 140 pc. |
| () | 0.64 | Czekala et al. (2016)ccScaled up by a factor of two to account for the Gaia distance of 196 pc. |
| (AU) | 0.13 | Czekala et al. (2016) |
| (AU) | 0.034 | Kóspál et al. (2018)ddCorotation radius calculated given the rotation period measured by Kóspál et al. (3.017 days), and the stellar mass (not adjusted for the difference in distance, and assuming both stars are identical). |
| date range | exposuresaaNumber of exposures and exposure time in seconds, per filter and observation. | Nobs | |||||
|---|---|---|---|---|---|---|---|
| B | V | I | J | H | K | ||
| Nov. 15 2012 - Jan. 30 2013 | 3x30 | 3x15 | 3x10 | 6x12 | 6x6 | 6x7 | 62 |
| Sep. 9 2013 - Feb. 3 2014 | 3x30 | 3x15 | 3x15 | 6x15 | 6x9 | 6x9 | 103 |
| ID | RAaaCoordinates and magnitudes from 2MASS. | DECaaCoordinates and magnitudes from 2MASS. | B | V | I | JaaCoordinates and magnitudes from 2MASS. | HaaCoordinates and magnitudes from 2MASS. | KaaCoordinates and magnitudes from 2MASS. |
|---|---|---|---|---|---|---|---|---|
| 1bbNot in ANDICAM NIR field of view. | 04:46:40.79 | +16:57:50.4 | 15.19 | 13.56 | 11.66 | 10.27 | 9.55 | 9.32 |
| 2bbNot in ANDICAM NIR field of view. | 04:46:39.64 | +17:00:04.3 | 15.84 | 14.38 | 12.46 | 10.98 | 10.43 | 10.16 |
| 3 | 04:46:46.15 | +17:00:29.1 | 16.02 | 14.79 | 13.22 | 12.02 | 11.51 | 11.33 |
| JD -2450000 | B | V | I | J | H | K | ||||||
|---|---|---|---|---|---|---|---|---|---|---|---|---|
| 6246.72 | 15.0582 | 0.0120 | 13.4431 | 0.0160 | 11.1853 | 0.0256 | 9.4064 | 0.0074 | 8.4451 | 0.0031 | 7.9183 | 0.0085 |
| 6247.65 | 15.0151 | 0.0242 | 13.4501 | 0.0104 | 11.1837 | 0.0094 | 9.4013 | 0.0083 | 8.4310 | 0.0122 | 7.8902 | 0.0004 |
| 6248.63 | 14.6287 | 0.0201 | 13.1966 | 0.0120 | 11.0268 | 0.0112 | 9.3191 | 0.0017 | 8.3424 | 0.0267 | 7.7732 | 0.0135 |
| 6249.66 | 13.6157 | 0.0153 | 12.4896 | 0.0093 | 10.5984 | 0.0152 | 9.0337 | 0.0179 | 8.0772 | 0.0062 | 7.4715 | 0.0087 |
| 6250.63 | 14.4273 | 0.0237 | 13.1242 | 0.0165 | 10.9752 | 0.0241 | 9.1916 | 0.0145 | 8.2149 | 0.0033 | 7.6565 | 0.0192 |
| 6251.65 | 14.6657 | 0.0189 | 13.2381 | 0.0104 | 11.0688 | 0.0107 | 9.3150 | 0.0067 | 8.3561 | 0.0066 | 7.8098 | 0.0078 |
| 6252.62 | 14.8033 | 0.0331 | 13.2841 | 0.0188 | 11.0839 | 0.0126 | 9.3405 | 0.0126 | 8.3890 | 0.0088 | 7.8629 | 0.0104 |
| 6253.67 | 15.1059 | 0.0312 | 13.4964 | 0.0148 | 11.2090 | 0.0099 | 9.4460 | 0.0035 | 8.4848 | 0.0032 | 7.9601 | 0.0048 |
| 6254.64 | 15.0925 | 0.0174 | 13.4748 | 0.0049 | 11.1824 | 0.0127 | 9.4246 | 0.0050 | 8.4928 | 0.0047 | 7.9534 | 0.0133 |
| 6255.68 | 15.0436 | 0.0370 | 13.4693 | 0.0187 | 11.1732 | 0.0074 | 9.4282 | 0.0092 | 8.4614 | 0.0035 | 7.9331 | 0.0101 |
| Object | spectral type | log L () | |
|---|---|---|---|
| LkCa 14 | K5.0 | 0.0 | -0.15 |
| LkCa 21 | M2.5 | 0.3 | -0.37 |
| LkCa 1 | M3.6 | 0.45 | -0.29 |
| line | DQ Tau | LkCa 21 | LkCa 14 | ||||
|---|---|---|---|---|---|---|---|
| 12/13/12 | 12/22/12 | 12/30/12 | 1/5/13 | 1/8/13 | |||
| 0.81980 | 1.20 | 1.10 | 1.20 | 0.97 | 1.20 | 1.50 | 1.00 |
| 0.83840 | 1.20 | 0.92 | 1.40 | 0.77 | 1.30 | 1.50 | 1.00 |
| 0.88070 | 1.00 | 0.65 | 0.99 | 0.67 | 0.89 | 0.99 | 1.10 |
| 0.90900 | 0.61 | 0.40 | 0.60 | 0.40 | 0.57 | 0.60 | 0.78 |
| 0.97880 | 0.95 | 0.70 | 0.92 | 0.72 | 0.81 | 0.94 | 0.76 |
| 1.03440 | 1.10 | 0.95 | 1.10 | 0.85 | 1.00 | 1.20 | 0.69 |
| 1.14040 | 1.40 | 1.10 | 1.60 | 1.00 | 1.40 | 1.60 | 0.97 |
| 1.16890 | 0.81 | 0.71 | 0.81 | 0.61 | 0.79 | 0.79 | 0.56 |
| 1.18300 | 0.99 | 0.80 | 0.99 | 0.71 | 1.00 | 0.99 | 1.60 |
| 1.2087 | 0.55 | 0.42 | 0.51 | 0.36 | 0.55 | 0.40 | 0.71 |
| 1.25250 | 0.80 | 0.68 | 0.85 | 0.58 | 0.88 | 0.85 | 0.50 |
| 1.31270 | 1.30 | 1.20 | 1.40 | 1.10 | 1.30 | 1.40 | 1.40 |
| 1.31500 | 1.00 | 0.90 | 1.10 | 0.84 | 0.97 | 1.10 | 1.10 |
| 1.48818 | 1.80 | 1.50 | 1.90 | 1.30 | 1.80 | 1.90 | 2.70 |
| 1.50270 | 2.10 | 1.80 | 2.20 | 1.70 | 2.00 | 2.30 | 3.00 |
| 1.57710 | 2.00 | 1.90 | 2.10 | 1.70 | 2.00 | 2.30 | 3.20 |
| 1.58900 | 2.00 | 1.80 | 2.30 | 1.30 | 2.20 | 2.20 | 3.40 |
| 1.61550 | 0.94 | 0.82 | 0.99 | 0.81 | 0.93 | 1.10 | 1.60 |
| 1.62590 | 1.00 | 0.93 | 1.10 | 0.87 | 1.00 | 1.40 | 1.30 |
| 1.6719 | 1.60 | 1.80 | 1.80 | 1.30 | 1.60 | 2.20 | 1.70 |
| 1.67550 | 1.90 | 2.10 | 2.10 | 1.70 | 2.10 | 2.50 | 2.30 |
| 1.71130 | 2.60 | 2.60 | 2.80 | 2.20 | 2.80 | 3.50 | 3.20 |
| 2.11650 | 0.82 | 0.89 | 1.10 | 0.76 | 1.10 | 1.60 | 1.30 |
| 2.26000 | 1.90 | 1.50 | 2.10 | 1.40 | 1.90 | 3.20 | 2.70 |
| date | phase | |
|---|---|---|
| 12/13/12 | 0.51 | 1.01 |
| 12/22/12 | 1.08 | 1.60 |
| 12/30/12 | 0.59 | 1.21 |
| 1/5/13 | 0.97 | 1.80 |
| 1/8/13 | 1.16 | 1.51 |
| date | phase | hot Teff | hot | warm Teff | warm | cool Teff | cool |
|---|---|---|---|---|---|---|---|
| 12/13/12 | 0.51 | 7000 | 0 | 1300 | 20 | 600 | 140 |
| 12/22/12 | 1.08 | 7000 | 0.05 | 1250 | 21 | 600 | 140 |
| 12/30/12 | 0.59 | 7000 | 0 | 1100 | 36 | 600 | 80 |
| 1/5/13 | 0.97 | 7000 | 0.06 | 1650 | 11 | 600 | 260 |
| 1/8/13 | 1.16 | 7000 | 0.02 | 1150 | 28 | 600 | 90 |
| line | 12/13/12 | 12/22/12 | 12/30/12 | 1/5/13 | 1/8/13 |
|---|---|---|---|---|---|
| O I 8446 | 4.91 0.70 | 13.5 0.30 | 5.01 0.52 | 11.9 0.4 | 4.84 0.42 |
| Ca II 8498 | 2.51 0.17 | 7.50 0.19 | 2.58 0.75 | 9.74 0.33 | 2.34 0.80 |
| Ca II 8542 | 7.50 0.78 | 7.67 0.30 | 7.88 0.31 | 7.51 0.31 | 7.82 0.08 |
| Pa11 | 1.30 1.30 | a | 1.0 1.0 | 2.36 0.27 | 1.8 1.8 |
| Ca II 8662 | 3.17 0.15 | 7.62 0.14 | 5.46 0.12 | 8.45 0.12 | 5.38 0.14 |
| Pa 10 | a | a | a | a | a |
| Pa 9 | 1.50 1.50 | 3.94 0.38 | 1.4 1.4 | 6.06 0.34 | 0.9 0.9 |
| Pa 8 | a | a | a | a | a |
| Pa 7 | 1.00 1.00 | 4.52 0.12 | 2.4 2.4 | 3.63 0.27 | 0.8 0.8 |
| Pa 6 | 1.40 1.40 | 7.89 0.21 | 1.2 1.2 | 8.60 0.32 | 1.04 0.26 |
| Pa 5 | 4.34 0.29 | 15.23 0.65 | 2.5 2.5 | 14.1 0.5 | 2.90 0.15 |
| Pa | 2.47 0.53 | 18.3 0.15 | 5.6 5.6 | 15.8 0.2 | 3.5 3.5 |
| He I | 29.0 0.70 | 48.5 4.30 | 44.6 0.5 | 98.6 1.7 | 42.6 0.6 |
| Pa | 6.85 1.26 | 30.2 0.80 | 4.74 0.47 | 30.2 0.3 | 4.75 0.23 |
| O I 1.13 | 2.88 0.15 | 9.78 0.28 | a | 9.98 0.31 | 7.0 7.0 |
| Pa | 11.0 0.44 | 48.2 0.22 | 6.09 0.14 | 40.0 0.3 | 7.38 0.19 |
| Br | 3.03 0.27 | 8.89 0.36 | 3.88 0.11 | 11.7 0.1 | 3.44 0.21 |
| Pf | 2.1 2.1 | 3.68 0.27 | 1.5 1.5 | 3.25 0.17 | 0.66 0.18 |
| Br | 4.21 0.15 | 16.4 0.17 | 4.27 0.04 | 13.6 0.4 | 4.76 0.19 |
Peer Reviews
No public reviews on file for this paper yet. If you reviewed it on a platform where reviews are public (OpenReview, ICLR, NeurIPS, ICML), you can paste yours below so the community can read it here.
Videos
No videos yet. Explain this paper in a talk, walkthrough, or lecture? Add one.
The Inner Disk and Accretion Flow of the Close Binary DQ Tau
James Muzerolle
Space Telescope Science Institute, 3700 San Martin Dr., Baltimore MD 21218, USA
Visiting Astronomer at the Infrared Telescope Facility, which is operated by the University of Hawaii under Cooperative Agreement no. NNX-08AE38A with the National Aeronautics and Space Administration, Science Mission Directorate, Planetary Astronomy Program.
Kevin Flaherty
Department of Astronomy and Department of Physics, Williams College, Williamstown, MA 01267, USA
Zoltan Balog
Center for Astronomy, University of Heidelberg, Heidelberg, Germany
Tracy Beck
Space Telescope Science Institute, 3700 San Martin Dr., Baltimore, MD 21218, USA
Robert Gutermuth
Department of Astronomy, University of Massachusetts, Amherst, MA 01003, USA
Abstract
We present multi-epoch optical and near-infrared (NIR) photometry and spectroscopy of the spectroscopic binary T Tauri star DQ Tau. The photometric monitoring, obtained using SMARTS ANDICAM, recovers the previously-seen correlation between optical flux and the 15.8-day binary orbital period, with blue flux peaks occurring close to most observed periastron passages. For the first time, we find an even more consistent correlation between orbital period and NIR brightness and color. The onset of pulse events in the NIR on average precedes those in the optical by a few days, with the rise usually starting near apastron orbital phase. We further obtained five epochs of spectroscopy using IRTF SpeX, with a wavelength range of 0.8 to 5 microns, and derived spectra of the infrared excess emission. The shape and strength of the excess varies with time, with cooler and weaker characteristic dust emission (T K) over most of the binary orbit, and stronger/warmer dust emission (T K, indicative of dust sublimation) just before periastron passage. We suggest our results are broadly consistent with predictions of simulations of disk structure and accretion flows around close binaries, with the varying dust emission possibly tracing the evolution of accretion streams falling inwards through a circumbinary disk cavity and feeding the accretion pulses traced by the optical photometry and NIR emission lines. However, our results also show more complicated behavior that is not fully explained by this simple picture, and will require further observations and modeling to fully interpret.
accretion, accretion disks — binaries: close — planetary systems: protoplanetary disks — stars: individual (DQ Tau) — stars: pre-main sequence
1 Introduction
While the disk accretion paradigm in young stars has tended to focus on the simpler case of single stars, understanding how the process works in binary systems is essential since most stars are multiple (e.g. Duchêne & Kraus, 2013, and references therein). Studies of young accreting binaries also provide upper bounds on the dynamical effects of companions on disk structure and evolution, and elucidate the potential for planet formation in binary systems. Close (spectroscopic) binary systems are particularly interesting since they are likely surrounded by circumbinary accretion disks during the class I and II phases (Bate, 2000), disks which are largely analogous to those around single stars except within the central few AU. Moreover, the relatively short periods of spectroscopic binaries, typically ranging from days to weeks, enable multi-epoch monitoring campaigns capable of characterizing variability in the accretion and inner disk emission that may trace dynamically-induced effects on the material closest to the stars.
The spectroscopic binary T Tauri star DQ Tau has been a target of particular interest. Mathieu et al. (1997) first characterized its orbital parameters ( days, , 0.14 AU), and also discovered a correlation between orbital phase and optical photometric variability, in which the light curves exhibited sharp increases in brightness at or just before periastron passages. A similar correlation of spectroscopic signatures of accretion activity such as H emission and continuum veiling was also found by Basri et al. (1997). These results suggested that the accretion flow onto the stars was highly modulated by their orbital motion, repeatedly peaking in intensity when they drew close to each other. Such behavior was predicted by hydrodynamical simulations of circumbinary disk accretion, which showed that torques generated by the binary motion create a low-density cavity in the disk out to a distance of ; accretion then precedes onto the stars via dynamical streams of denser material that are repeatedly torn off the inner edge of the disk near apastron orbital phase and reach a maximum flow of gas near periastron phase, before being disrupted as the stars move further apart (Artymowicz & Lubow, 1996). This process has come to be known as “pulsed” accretion. Subsequent simulations of circumbinary disks around both young stars and compact objects, with increasingly sophisticated computational techniques and exploration of parameter space, have shown the same general features, and elucidated the effects of different binary orbital architectures on the strength and periodicity of the accretion (Günther & Kley, 2002; de Val-Borro et al., 2011; Shi et al., 2012; Dunhill et al., 2015; Muñoz & Lai, 2016).
Subsequent observations of DQ Tau have further clarified its behavior and revealed more complexity. Carr et al. (2001) detected CO fundamental emission, constraining the location of the emitting gas to be within the putative circumbinary disk hole. Boden et al. (2009) resolved K-band emission using interferometry, also locating the emission region inside of the expected disk inner edge. Observations of flares at X-ray and millimeter wavelengths (Salter et al., 2008, 2010; Getman et al., 2011) found evidence of enhanced activity near periastron, suggestive of magnetic reconnection events induced as the magnetospheres of the two stars interact/collide. Bary & Petersen (2014, hereafter, Bary14) recovered the orbital phase dependence of accretion using Pa emission from multi-epoch near infrared spectroscopy; however, they also discovered a surprising increase in accretion luminosity near apastron phase at one epoch. More recent optical photometric investigations have also uncovered complex light curve behavior, with occasional brightenings not associated with periastron (Tofflemire et al., 2017a; Kóspál et al., 2018), although a correlation with orbital phase remains the dominant feature.
The signature of pulsed accretion remains extremely rare. Only one other young close binary system has been found that exhibits unambiguous brightenings associated with periastron passages (TWA3; Tofflemire et al., 2017b). Jensen et al. (2007) found a periodicity in the optical light curve of UZ Tau E which matched the orbital period, however the flux variations were much slower with low amplitude, and direct accretion probes such as H showed inconclusive correlations. Three protostellar objects have also been found to exhibit periodic infrared brightenings that look very much like pulsed accretion (Muzerolle et al., 2013; Hodapp & Chini, 2015; Flaherty et al., 2016), although no evidence of binarity has yet been published.
Other aspects of the expected circumbinary disk structure have been seen in wider binaries where features can be more readily spatially resolved, such as circumbinary rings and streams (e.g., GG Tau; Dutrey et al., 2016). In close binaries such as DQ Tau, these regions of the system can be probed with multi-epoch infrared observations, particularly at wavelengths m where warm dust emission becomes significant. Infrared photometry in particular has been lacking, however; we thus initiated a multi-year campaign to obtain near-infrared (NIR) photometric monitoring, with simultaneous optical observations, spanning multiple orbital cycles. In this paper, we present the results of the first two seasons of photometry, along with contemporaneous 0.8-5 m spectroscopy at a more limited set of epochs. In section 2, we describe the observations and data reduction. Section 3 details the photometric analysis of light curves, color-color comparisons, and periodicities and timing, as well as the spectroscopic analysis of spectral typing, veiling measurements, and derivation of excess spectra. Finally, we discuss our results in the context of the pulsed accretion model in section 4.
For the purposes of our various analyses, we adopted the most recent and robust determinations of the DQ Tau system parameters from the literature, as listed in Table 1. This includes updating the distance from the canonical Taurus region value of 140 pc to the specific value of 196 pc recently measured by Gaia (Bailer-Jones et al., 2018). Despite the possibility of systematic errors due to the binarity of the system, we believe this new larger value is likely correct; DQ Tau is part of a small subgroup of five stars that lie within the L1558 cloud southeast of the main concentration of stars in the Taurus star forming region; their median Gaia distance is 196 pc (Luhman, 2018).
2 Observations
2.1 SMARTS Photometry
We observed DQ Tau with the ANDICAM instrument on the CTIO 1.3m telescope, operated by the SMARTS Consortium. ANDICAM is a dual-channel imager that enables simultaneous observations at two band passes in the optical and near-infrared. The optical channel has a field of view is ’ x 6’ and detector pixel scale of arcsec, while the NIR channel has a field of view of ’ x 2.4’ and detector pixel scale of arcsec. We used filters (standard KPNO Johnson-Cousins) with the optical channel and filters (CIT/CTIO) with the infrared channel. Table 2 summarizes the exposure times and observation date ranges. The NIR channel has an internal tip-tilt mirror to enable small-scale dithering; six exposures were taken at each filter, with each exposure separated by a small dither offset of arcseconds. The observations were obtained over two seasons from fall 2012 to winter 2014; each season had almost continuous nightly coverage (excluding bad weather or scheduling pre-emptions) over two- to four-month periods, during which time the star was observable below 2 airmasses. The total sequence of exposures taken with 3 pairs of filters each night took about 10 minutes to execute.
The optical data are automatically processed by the SMARTS pipeline, including bias and zero subtraction and flat field correction. We measured stellar photometry using the resulting archived products, as described below. The NIR images are not automatically processed, other than having a 2x2 pixel binning applied. For each set of dithered exposures at each filter, we created a median sky image and subtracted from each exposure. We then divided the sky-subtracted images by flat fields constructed from dome flat exposures at each filter.
We measured stellar photometry using the archived pipeline products in the optical and the sky-subtracted, flat fielded images in the NIR. This was done with aperture photometry, using an aperture radius of 20/15 pixels and sky annulus of 25-32/30-35 pixels in the optical/NIR. Suitably bright comparison stars within the field provided relative photometry, calibrating out variable nightly weather conditions; three were used in the optical images and one in the NIR. Most of these comparison stars are fainter than DQ Tau at all bands, and thus are the limiting factor in the final photometric uncertainties in most cases. In poor weather conditions, the NIR sky background was variable on timescales of minutes or less, which sometimes contributed the largest source of photometric error at the bands. Relative magnitudes were computed for each exposure in each band, and the final results averaged over all exposures (and all comparison stars in the optical) for a given band on each night, including one iteration of outlier rejection, with the standard deviation of these values taken as the uncertainty. By cross-checking the optical comparison stars, we demonstrated excellent repeatability (and ruled out any significant intrinsic variability) with an overall precision of , 0.02, and 0.015 magnitudes at , , and . The relative precision of the NIR photometry, as estimated by comparing the primary comparison star with a fainter third star in the field, is , 0.02, and 0.04 magnitudes at , , and (the fainter star is bluer, so these relative measurements are more uncertain at longer wavelengths).
To convert the optical photometry to the Johnson-Cousins system, we calibrated the three comparison stars using contemporaneous standard star observations taken during the 2012 season on ostensibly photometric nights. A total of 35 observations of the Landolt standard TPhe D were taken on the same nights as our DQ Tau observations. The zero points and color terms for these are given on the SMARTS consortium website, and we used them to convert the instrumental magnitudes to the standard system. Table 3 gives the resultant magnitudes. The extinction coefficients are the largest source of uncertainty in this conversion because of the limited number of measurements as a function of airmass; we used the “default” values provided on the SMARTS website. We conservatively estimate overall absolute uncertainties of about 0.2 magnitudes in each optical band. and photometry for all three stars are provided in the UCAC4 catalog (Zacharias et al., 2013), and are within 0.1 magnitudes of our values. Salter et al. (2010) also derived photometry for all three stars at and that agree to within 0.2 magnitudes. In the NIR, we used photometry of the primary comparison star from 2MASS to convert the relative magnitudes of DQ Tau directly to the CIT system (Carpenter, 2001); the absolute accuracy is then limited by the uncertainties of the 2MASS measurements and the transformations between the 2MASS and CIT systems (combined, about 0.05 magnitudes in each band). Table 4 shows a truncated set of the final calibrated photometry (the full version will be made available online).
2.2 SpeX Spectroscopy
We observed DQ Tau with the SpeX spectrograph (Rayner et al., 2003) at IRTF on December 13, 22, and 30 2012 and January 5 and 8 2013. All observations used both SXD and LXD modes, for a combined wavelength coverage of 0.8 to 5 m, and a slit width of 0.8”, for a spectral resolution of . The position angle was adjusted to keep the slit at the parallactic angle during each observation in order to minimize slit losses from atmospheric refraction. Total exposure times were typically 6 to 8 minutes for SXD mode and 30 to 40 minutes for LXD mode, all split into multiple nods in the typical ABBA pattern for background subtraction. The data were reduced and spectra extracted using the Spextool package (Cushing et al., 2004), which includes routines for sky subtraction, flat fielding, tracing and extraction of each spectral order, telluric correction, and order matching and combination. The telluric correction step was done using spectra of A0 stars observed near in time and airmass to each DQ Tau observation, combining with a model spectrum of Vega in order to correct for photospheric absorption lines (Vacca et al., 2003). The final spectra have a very accurate spectral shape, although the absolute flux level (estimated by extrapolating from the optical brightness of the telluric standard) can have larger errors depending on the weather conditions (Fig. 1).
3 Results
3.1 Photometric Behavior
The time series photometry for the 2012-2013 and 2013-2014 seasons are shown in Figures 2 and 3, respectively. Repeated flux increases (hereafter referred to as “pulses”) above a flat or slowly varying baseline level are readily apparent at all bands in both the optical and NIR. Pulse events occur within most of the binary orbits covered by our data, and usually (but not always) peak at or just before the time of periastron passage. The pulses are typically sharply peaked and have durations ranging from 2 to 6 days. Of the 14 binary orbits fully covered over both seasons, only two appear to lack obvious pulse events in the optical (the ones with periastron passages near JD 2456315 and 2456600); however, because of gaps in coverage due to bad weather, we cannot rule out the presence of very short pulses with durations of 1-2 days in these cases. In the NIR, only one orbit shows no related pulse (JD 2456315), although the timing of the increase at the very end of the 2012-2013 monitoring leads to ambiguity as to whether it was associated with the preceding orbit or the next (mostly uncovered) one. The timing of the pulse peaks in many cases appears to be wavelength-dependent, with the peaks at typically occurring at the same time, while some peaks at and occur up to 1 to 2 days beforehand. The amplitude of the optical peaks are strongly variable, with increases above the baseline at mostly ranging from to 2 magnitudes, and up to 3.5 magnitudes in one extraordinary case (near JD 2456630). In the NIR, the amplitudes are smaller and somewhat more regular, with most pulses at about 0.5 magnitudes at .
The pulse heights and, to a lesser extent, durations, are wavelength-dependent. Figures 4 and 5 show optical and NIR color-color plots for both observing seasons. In the optical, the flux level is strongly correlated with color, with brighter epochs (i.e., the pulses) being bluer. Plotted as a function of time, the pulse correlation can be seen more clearly (Figs. 6, 7). The baseline between the pulses is relatively flat, with the average color being consistent with a reddened M0 photosphere with A; there is likely some residual continuum excess at least at B and V bands, given that previous measures of optical veiling rarely if ever decreased to zero (e.g., Basri et al. 1997), and the fact that small color variations do occur.
In the NIR, the brighter epochs correspond to redder colors. In general, the NIR observations form a locus of points that are roughly parallel to the CTTS locus (as defined by Meyer et al. 1997). Dereddening these points down to the locus (assuming that the separation is entirely due to extinction, which may not be the case) yields a typical extinction value of A. There are a few interesting outliers in the 2013-2014 season, which we describe in more detail below. The color time series (lower panels of Figs. 6 and 7) exhibit peaks corresponding to each pulse event; most of these peaks are broader in time, with an earlier start time in terms of binary phase (typically at or near apastron phase), compared to the peaks seen in the optical. They also typically reach a maximum earlier than the optical color peaks, consistent with the behavior in the corresponding photometric bands as described above. In addition to the pulse events corresponding to each orbital period, the NIR photometry also exhibits a longer-term trend at H and K bands with characteristic timescales of a few months. The trend is most apparent in the H-K color time series, exhibiting an amplitude of magnitudes.
In order to quantify the apparent lags between bands, we computed discrete correlation functions (DCFs; Edelson & Krolik, 1988) for the combined 2012-2013 and 2013-2014 photometry. This method is designed for unevenly-sampled data, as is the case here (we also looked at cross-correlations of the light curves interpolated onto a regular time spacing and obtained similar results). Figure 8 shows the DCFs of V and K bands and the H-K color relative to the B band. The V band is well-correlated with B and shows no measurable lag. K band is also correlated, though at a somewhat lower level of significance. Its DCF is clearly offset from zero lag, with maxima at zero and 2-day lags and a ”centroid” value at about a 1-day lag, and is also broader than for V band. This may be a further indication of the longer apparent duration of the K band flux peaks on average compared to the optical pulse events, or alternatively may be explained by two separate events in the light curves, one with zero lag associated with the optical events and one with lag days. The H-K color DCF exhibits a weak peak at a lag of 3 days, however the significance is not as robust given the smaller amplitude of the H-K peaks.
Periodograms of the combined data from both seasons are shown in Figure 9. Results for the B band photometry show a weak peak at 15.77 days (error estimated from the FWHM of the periodogram peak), with false alarm probability (FAP) of 0.65, indicating only a weak statistical correlation of the blue pulses with the binary orbital period. The K band periodogram also shows a peak at 15.80 days, with FAP , a much stronger statistical correlation that reflects the more steady nature of the NIR pulses; there is also a second weaker but possibly significant peak at 74.1 days, which corresponds to the long-term trend mentioned above. The H-K color time series periodogram shows a strong peak at a similar period of 75.4 days, with FAP , and a peak at 15.77 days is still present but with lower significance. Given that our data cover only about three full periods of the 75-day feature, confirmation of a persistent periodic feature in the NIR light curves requires further long-term monitoring. The 15.8-day periodicity exactly matches the binary orbital period as measured from radial velocity observations.
There is also a higher-frequency low-amplitude variation seen during several quiescent cycles in both seasons, with amplitude decreasing to longer wavlengths. Periodograms for those parts of the V-band light curves (in the intervals JD 2456300-6325 and 2456585-6615) show a peak at 3.0 days (with significance values of 0.05 and 0.09, respectively). This is similar to the estimate of the stellar rotation period of days from Basri et al. (1997) based on measurements of sin, and is in agreement with the period recently found from Kepler K2 observations (3.017 days; Kóspál et al. 2018). This feature is likely the signature of a rotating hot- or cold-spot on the surface of one or both of the stars, a signature that is typically obscured by the larger-amplitude variations likely driven by accretion.
Several orbital cycles monitored in the 2013-2014 season presented particularly noteworthy behavior, some of which contradicts the general photometric trends. Figure 10 shows the multiband photometry and colors for this interval, which spans about 2.5 cycles. The most obvious feature is the extremely large pulse near JD 2456630, as previously mentioned. To our knowledge, this is by far the largest amplitude optical brightening ever observed in DQ Tau, with a maximum increase of about 3.4 magnitudes at and just under 1 magnitude at . The pulse peak is extremely blue in the optical, consistent with emission from the accretion shock, which is so strong that even the color is significantly bluer than at any other epoch (dropping below the CTTS locus). By contrast, the peak colors are similar to those of other pulse peaks. Immediately after this strong pulse, the IR emission decreases significantly, with the color exhibiting a particularly dramatic drop to one of the lowest levels we see at any epoch, though it recovers quickly in just a few days. The subsequent two orbital cycles show very different behavior. No obvious optical pulse appears before the next periastron passage, although there is a peak in the NIR. After that, the light curves become much more complicated; there are four peaks in the optical separated by roughly four to five days, and three peaks in the color curve (not coincident with the optical peaks).
3.2 Spectroscopy
The full set of spectra are shown in Figure 11. The data quality is uniformly high, with over the entire wavelength range except for the edges of some of the telluric absorption bands and parts of the 4.6-5 m order. In most of the 1-2.5 m range, the . Telluric absorption residuals are seen in some epochs at the edges of the telluric windows and at 2.8-3.4 and 4.6-5 m, typically the result of an imperfect match of the telluric template air mass. The spectra show absorption features typical of young early M-type stars, as well as a wide range of emission lines whose strengths vary considerably with epoch. Our primary objective with these data is to derive spectra of the dust excess emission in order to characterize its strength and shape. This requires matching with a proper photospheric template and correcting for extinction and veiling, a process which we describe in the next two subsections.
3.2.1 Spectral type and template matching
The spectral type of DQ Tau as estimated from optical spectroscopy ranges from about K5 (Basri et al., 1997) to M0.6 (Herczeg & Hillenbrand, 2014). However, the SpeX data exhibit many features, in particular broad molecular absorption bands such as TiO and H2O, that are more consistent with a later type. This was also shown by Bary14, who suggested that the discrepancy could be explained by including the effects of large cool spots. One difficulty with deriving accurate spectral types in the infrared is that many photospheric features are sensitive to surface gravity; the usual practice of adopting main sequence dwarfs to calibrate absorption line strengths can then have significant errors depending on which features are being compared (e.g., McClure et al., 2013, hereafter, McClure13).
To try to mitigate surface gravity effects, we observed several weak line T Tauri stars (WTTSs) with a range of spectral types to use as photospheric templates (Table 5). Figure 12 compares the 0.8-1 m range of one DQ Tau epoch (which had a low level of accretion activity, and hence veiling) to two of our WTTS templates, as well as several dwarf standards taken from the SpeX spectral library (Cushing et al., 2005; Rayner et al., 2009). The closest match by eye is the WTTS LkCa 21, which has an optical spectral type of M2.5 (Herczeg & Hillenbrand, 2014). For a more rigorous comparison, we measured absorption line equivalent widths and line ratios, restricted to lines at shorter wavelengths and/or closely spaced in wavelength in order to mitigate the effects of veiling. These specific indicators were found by McClure13 to offer the most accurate measures of spectral type. The resulting measurements for the WTTS templates and two epochs of DQ Tau (in which the veiling was lowest) are shown in Figure 13. We also measured the same features in the IRTF spectral library dwarf spectra, degrading the resolution in order to match our observations taken with a wider slit. In most cases, DQ Tau and the WTTSs follow the trend with spectral type indicated by the dwarf measurements. The M3.6 WTTS LkCa 1 has systematically weaker absorption for all but one of the four lines plotted, although the two line ratios are consistent with its optical spectral type; this may be a surface gravity effect (note the luminosity derived by Herczeg & Hillenbrand is fairly high for its spectral type, suggesting a larger radius and lower surface gravity). Overall, the measurements for DQ Tau suggest a spectral type in the range M0-M1, in excellent agreement with the most recent optically-derived type of M0.6 from Herczeg & Hillenbrand (2014). Again, of the three WTTS templates the closest match is LkCa 21. Given the reasonable similarity in absorption line equivalent widths as well as the excellent match to the broader TiO and H2O absorption bands, we adopted LkCa 21 as the photospheric template in all further analyses of the dust excess emission in DQ Tau.
3.2.2 Derivation of excess spectra
The photospheric absorption lines in our spectra of DQ Tau are subject to continuum veiling, particularly at wavelengths m. This excess emission originates largely from hot dust in the innermost regions of the system, as indicated by our NIR photometry. By characterizing the excess as a function of wavelength at multiple epochs, we can infer general properties such as temperature, location, and size of the emitting region, and how these vary with time.
To measure the veiling, we compared depths of selected absorption lines in each spectrum of DQ Tau with those of the template, LkCa 21. There are several methods that have been devised originally for optical measurements (e.g. Hartigan et al., 1989) that are equally applicable to the NIR (McClure13). We adopted the equivalent width method, whereby the veiling is measured for individual absorption lines using the ratio of equivalent widths between the object and template spectra: . As noted by McClure13, this technique has the advantage of being able to ignore lines that may be sensitive to differences in surface gravity or cool spot surface coverage between the object and stellar template. The measured line equivalent widths for all DQ Tau epochs and two WTTSs are given in Table 6. We used only atomic lines at wavelengths shorter than m; molecular features such as the CO overtone lines around 2.3 m are more sensitive to gravity and spot effects, and any lines at longer wavelengths are filled in by the veiling.
In order to derive the excess emission spectrum at each epoch, the observed spectrum must be correctly matched with that of the template. We followed a procedure similar to Gullbring et al. (1998), originally applied to UV/optical data and subsequently adapted to NIR data by Fischer et al. (2011) and McClure13. This method allows a simultaneous derivation of the reddening and normalization factor given the measured veiling. In short, the ratio of the continum fluxes of the object () and the template (), modified by the object veiling, is related to the difference in extinction between the two by
[TABLE]
where is the normalization factor between object and template, and is the extinction law. By measuring the flux and veiling at a number of lines across the spectrum, the left-hand side of equation 1 can be evaluated. A linear fit between those values and an assumed extinction law then yields the difference in extinction (from the slope of the fit), and the normalization constant (from the y-intercept). We adopted the extinction law from Mathis (1990) for m, and Flaherty et al. (2007) for longer wavelengths. Once the extinction and normalization factor have been determined, the object spectrum can be dereddened, and the template can be scaled and subtracted to remove the photospheric component.
The results of these calculations for each observation epoch are shown in Figures 14- 18. Each upper panel plots the evaluation of equation 1 for each of the absorption lines indicated in Table 6, along with a linear fit to the data points. Some of the lines selected for this analysis are consistently poor matches to the template. In particular, the lines at 0.8198 and 0.8384 m, and most of the lines at wavelengths m, are significantly stronger in the template spectrum than in any of the DQ Tau spectra, and thus give systematically larger veiling values. We believe this is due to a mismatch in the gravity and/or the fraction of the stellar surface covered by cool spots between object and template, and elected to ignore these lines when performing the linear fits. The middle panels show the measured veiling values for each line, along with a veiling spectrum calculated by dividing the excess spectrum by the template. There is good agreement between the individual veiling values and the calculated spectrum for all except the aforementioned discrepant lines, which indicates self-consistency between the derived extinction and normalization constant. Finally, the lower panels show the resulting dereddened and scaled object spectrum compared to the original observed spectrum and the template.
The resulting extinction estimates for each epoch are given in Table 7. The values differ from each other, with a maximum deviation. Moreover, it appears that the extinction is systematically larger closer to periastron passages (see Discussion). The extinction can be independently estimated from the maximum observed color (in between pulse events), assuming no excess and an M0 photosphere; in that case, we derive , which is identical within the uncertainties to the minimum spectroscopically-derived value. The uncertainties quoted in Table 7 reflect the formal errors on the fit, and do not take into account possible systematic errors from any mismatch between the object and template spectra. A detailed comparison using a larger grid of templates is needed to better constrain systematics, but we currently lack the sample to do this. Nevertheless, any such systematics should affect all epochs equally, and we believe that the apparent extinction variations are likely real.
3.2.3 Characterizing the excess
The excess spectra resulting from subtraction of the template from each dereddened object spectrum are shown in Figure 19. There is a clear change in both the shape and strength among the different epochs, apparently correlated with the binary orbital phase. The two observations taken closest to periastron passages show the largest excess with the bluest colors, while the reverse is true for those taken farthest in time from a periastron passage. There is a similar correlation with the emission line fluxes (see next subsection). The most dramatic changes occur in the 0.8-1.5 m range, which exhibits nearly zero continuum excess near apastron phase but increases to a nearly flat excess spectrum near periastron. Other broad spectral features are also apparent in some or all epochs, such as the “bumps” centered roughly at 0.85, 1.05, 1.8, and 2.6 m; these are coincident with molecular features such as TiO and H2O, and are most likely indicative of slight spectral mismatches between object and template or, particularly in the latter case, artifacts introduced by imperfect telluric correction.
In order to derive a rudimentary characterization of the excess shape, we fit a set of blackbody components to each observation. The optical-NIR continuum excess in most CTTSs has several components: “hot” emission most likely originating from the accretion shock on the stellar surface, “warm” emission produced by dust at or near the the inner disk rim where temperatures reach the sublimation point, and “cool” emission produced by the region of the disk behind the inner rim. Detailed studies have indicated that the picture is somewhat more complicated, with intermediate-temperature components of uncertain origin (e.g. Fischer et al., 2011). For the purposes of this study, where we are taking a first look at time variability in the excess, we restrict ourselves to blackbody models of these three basic components, following McClure13. Each component is defined by a characteristic blackbody temperature and solid angle. We fix the hot component temperature at 7000 K, which is characteristic of accretion shock emission (the exact value is not crucial here since we are only seeing the Rayleigh-Jeans tail). We also fix the cool component to a value of 600 K, which is roughly the equilibrium temperature for dust at the predicted location of the inner edge of the circumbinary disk around DQ Tau ( AU). For the warm component, we allow the temperature to vary between 1000-1800 K (which spans the range of typical characteristic maximum dust temperatures in TTSs) in increments of 50 K. The solid angles (relative to the stellar value assuming R⊙ and pc) are varied from 0 to 0.1 for the hot component, 10 to 50 for the warm component, and 50 to 300 in the cool component.
For each set of parameters, the models for all three components are combined and then compared to the observed excess spectra, with the best fit determined via chi-squared minimization. The resulting best fits for each observed spectrum are shown in Figure 20, with the associated parameters listed in Table 8. Given the systematic uncertainties in the template matching, these values should be taken as indicative only; however, they provide a useful first look at the gross properties of the material in the inner regions of this system. The best-fit hot component solid angles range from zero at several epochs, where no discernible emission was detected, to 0.06, which is typical for weakly- to moderately-accreting TTSs. The cool component solid angles range from 90 to 260, roughly as expected for a puffed inner disk rim with a temperature of 600 K. If our assumption of a constant temperature is a reasonable approximation, the variation in solid angle may be indicative of a variable scale height of the inner edge of the putative circumbinary disk. There is a weak correlation with the warm component, but the origin of such a variation is unclear; it could simply be an artifact of our overly-simplistic assumptions of the dust temperatures. However, it should be noted that this cooler dust emission is not as well-constrained as the other components since it contributes an appreciable fraction of the total emission only at the long-wavelength end of our spectra. Observations in the 5-10 m range are required to test the significance of any variations from this region.
The warm component presents the most obvious variations. The best-fit temperatures range from 1100 K, lower than typical dust sublimation temperatures, to 1650 K, which likely corresponds to dust at the sublimation front. The hottest value coincides with a NIR photometric peak several days before a periastron passage, while the coolest value coincides with an apastron passage. The temperatures are also cooler at and just after periastron passage. This suggests a sequence of increasingly warming dust as the binary moves closer together in its orbit, with the hottest dust being removed during or just after the accretion pulse.
3.2.4 Emission lines
DQ Tau exhibits an emission line spectrum that is fairly typical for low to moderate accretors. Table 9 lists the measured line fluxes for the most prominent lines, including the Ca II triplet, He I m, and H I Paschen and Brackett lines. This is not a complete list of detections; upper Brackett lines in H band appear in some epochs, but are severely blended with the copious photospheric absorption lines in that range. We also detect CO fundamental emission in M band (lines of the P and R branches) at all epochs; however, we cannot reliably measure these because of both residual telluric absorption and blending of the individual lines themselves.
All of the measured line emission varies significantly with time, by a factor of 5 or more in some cases. The strongest lines are clearly correlated with orbital phase (Fig. 21), with the flux peaking at or just before periastron passages, similar to the optical photometry. These lines are known tracers of accretion activity in TTSs, and their observed variation is fully consistent with the prior evidence for phase-dependent, or “pulsed”, accretion in the DQ Tau system. Using previously-calibrated relations between line luminosity and accretion luminosity (e.g. Muzerolle et al., 1998), we estimated mass accretion rates from the observed Pa and Br line fluxes. To do this, we applied extinction corrections based on the simultaneous AV measurements from the veiling analysis, and adopted the most recent determinations of the binary stellar mass (M M*⊙*, dividing in half the total mass from Czekala et al., 2016) to convert from accretion luminosity to mass accretion rate. The results are shown in Figure 22; the accretion rate varies by roughly an order of magnitude from to , strongly correlating with orbital phase. Our measurements are consistent with previous studies; Bary14 (also based on NIR lines) and Tofflemire et al. (2017a) (based on U band photometry), both with far more epochs, also showed a strong correlation between accretion luminosity and/or rate and orbital phase, although both also showed some exceptions with increased activity far from periastron.
The He I line at 1.083 m is a particularly interesting diagnostic of both accretion and outflow, as it often shows both blueshifted and redshifted absorption superposed on the emission profile (Edwards et al., 2003, 2006). This line is robustly detected in emission in all of our spectra, with blueshifted absorption components seen in three of the five epochs (Fig. 23). Edwards et al. (2006) observed DQ Tau at high spectral resolution at an orbital phase of , and their profile is consistent with the strength and shape of our observations at quiescent epochs. Our spectral resolution is too low to detect the blueshifted absorption they observed at velocities around -200 km s*-1*. We detect a much more strongly blueshifted absorption component at km s*-1* at the three epochs closest to a periastron passage, which is significantly more blueshifted than seen in any of the T Tauri line profiles shown by Edwards et al. (2006). Bary14 also reported on variations of the He I blueshifted absorption component in DQ Tau as a function of orbital phase, though they do not remark on velocities (and many of their spectra have insufficient resolution to reliably detect the absorption components). The spectrum we observed on 12/22/2012 (orbital phase 1.08) exhibits a second, stronger absorption component centered at roughly 750 km s*-1*. Such a velocity is virtually unprecedented for any tracer of gas motions observed around any T Tauri star, and is far above the escape velocity of the system. This component does not appear to be a spurious artifact since it is clearly seen at the same velocity and depth in each of the 12 individual exposures that were averaged into the final spectral extraction. However, no absorption or emission at comparable velocities is seen in any other observed line. The appearance of this absorption very close to a periastron passage, where the magnetospheres of the two stars are likely to overlap, suggests a possible origin in some kind of flare event caused by magnetic reconnection (possibly analogous to a coronal mass ejection). We cannot make an accurate estimate of the terminal velocity since the absorption component is not spectrally resolved, but it could be as high as km s*-1*. Further observations near periastron passage at higher spectral resolution are needed to determine whether events of this type are common, and what the true origin might be.
4 Discussion
The combined results of our photometric and spectroscopic observations show clear correlations of the accreting gas and hot dust with the binary orbit in the DQ Tau system. This behavior is broadly consistent with the pulsed accretion scenario predicted by simulations. Our spectroscopy indicates that the cavity inside the circumbinary disk, if present, is never completely clear of dust; the minimum dust temperatures we measure ( K) around apastron orbital phases are much higher than the equilibrium temperature at the location of the disk edge expected by simulations ( K). However, those dust temperatures are also clearly lower than the sublimation temperature, which suggests that there is little if any dust near the sublimation fronts of either star at those epochs.
With only five epochs, the spectroscopy offers limited snapshots of the full range of behavior of DQ Tau as traced by the photometric data. Figure 24 shows observed NIR colors for a subset of the photometric observations that span a time range encompassing the spectroscopy. Corresponding colors derived from the blackbody models of the excess spectra, with a scaled photospheric template spectrum added in, are also indicated; these match the contemporaneous photometry to within the relative flux accuracy of the spectroscopic data. Note that four of the spectroscopic epochs span a very small range of NIR colors, and the reddest epoch (1/5/2013) is still somewhat bluer than the peaks in the HK light curve. We calculated additional sets of blackbody models to see what range of parameters would be needed to explain the maxima and minima of the NIR colors. One of these sets, using the minimum measured extinction and assuming no hot component, is shown in the lower panel of Fig. 24. Although there is degeneracy between the effects of extinction and hot accretion emission, we can make some general conclusions. One, the rise of the NIR excess prior to the onset of an accretion pulse is primarily explained by a significant increase in the dust emission solid angle (by as much as a factor of 3). An increase in the dust temperature may also occur, but the photometric accuracy prevents a definitive constraint in the absence of simultaneous spectroscopy. The rise cannot be due to a significant increase in the extinction alone, otherwise the color would be larger than observed. Two, the highest dust temperatures, corresponding to the expected sublimation limit, and the highest extinctions can only occur once the accretion pulse is in progress; the blue excess serves to cancel out the reddening effect at shorter NIR wavelengths, effectively putting a cap on the colors. At epochs with the strongest accretion emission, there is a pronounced blueing of the color. Near the end of a pulse, both the and the colors drop, signaling a decline in both the dust temperature and emission solid angle. Three, the warm dust component exhibits a varying minimum temperature between periods of quiescence, which may be related to the 75-day period possibly present in the NIR photometry. The minimum temperature may get as low as 900 K, still warmer than the expected temperature of the inner edge of the circumbinary disk.
Using prior simulations as a guide, we propose the following scenario as a general framework for understanding the observations, using schematics of the system geometry as shown in Figures 25-28. Note that these present a highly idealized picture of the complex dynamical environment (for example, the circumbinary disk inner edge is likely not sharp and well-defined, and the material inside is not all strictly confined to narrow streams), but are intended to provide a rough guide to the scale of various physical regions of interest. To start, at apastron orbital phase, accretion streams falling from the inner edge of the circumbinary disk begin to approach each star (Fig. 25). Most of the material has not yet reached the sublimation radius around either star, hence the apparent dust temperature should be lower than the typical sublimation point. There is still gas left around one or both stars, located mostly between the sublimation front and corotation radius, slowly accreting onto the star(s) at a quiescent level after having been cut off from the previous orbit’s streams. As the stars come closer together in their orbits, the accretion streams fall inwards, increasing the amount of gas and dust inside the cavity, and begin feeding temporary circumstellar structures (Fig. 26). The dust in the streams reaches the sublimation fronts, and increases the gas supply to the accretion flows onto the stars, resulting in an increasing accretion rate. The increase in the amount of circumstellar material, and possibly its scale height, leads to an increase in the NIR emission (and possibly the stellar extinction if the material is sufficiently stirred out of the disk plane). As the stars continue to draw closer, the circumstellar dust structures begin to interact. Near periastron phase, there is a single sublimation front around both stars, the inner gas disks become disrupted as the corotation radii slightly overlap, and the stellar magnetospheres may also interact (Fig. 27). This produces a spike in the stellar accretion rate. Finally, as the stars begin to separate, the circumstellar dust structures are torn apart, and the accretion streams become disconnected, leading to a drop in the NIR excess flux and characteristic temperature, and a decrease in the stellar accretion rate (Fig. 28).
This generalized picture does not explain all observed characteristics. For one, the accretion of gas onto the binary never completely stops, which means there must always be some reservoir of material located near the corotation radius of one or both stars (the viscous timescale at that location is of order 100 yr; Hartmann et al., 1998). Some material also likely remains around the sublimation radius, which should lead to some hot dust emission; if so, it may be that such emission is too small to detect along with the cooler dust emission that is dominant during the quiescent epochs (from the excess spectra, we estimate a conservative limit on the solid angle of a component at the sublimation temperature to be % of the dominant cooler component). Another difficulty lies in explaining the very rapid decline in dust emission and temperature immediately after periastron orbital phase. It seems unlikely that all dust near the sublimation front gets dynamically disrupted in one or two days; again, there may be an emission component that is too small to reliably identify in the excess spectrum. Finally, not all of the monitored binary orbital cycles exhibit such a clear-cut pulse signature in either the optical or NIR wavelength range. A few cycles show very complicated photometric behavior, with multiple peaks in both the optical and NIR. These may indicate a breakdown of the regular two-armed accretion stream infall, perhaps by turbulent clumps accreted from the circumbinary disk. In any case, more detailed simulations, and calculation of observables from them, are needed to clarify specific predictions from the pulsed accretion theory.
In cycles with a strong NIR peak, the observed colors rule out the presence of a significant amount of dust near the sublimation front ( K) prior to the start of the stellar accretion pulse. The fact that we measured a 1650 K component in one spectrum during an accretion pulse suggests a connection between the sudden increase in dust temperature and the pulse itself. This could simply be a result of the sudden expansion of the sublimation radius to encompass both stars when they move sufficiently close together (as shown in Fig. 27). There may also be a concurrent “puffing up” of the material near the sublimation front as irradiation heating from the accretion luminosity increases. Enhanced outflow related to the accretion pulse may also entrain more dust, raising the effective solid angle of the hottest dust (Bans & Königl, 2012). Another possibility is the formation of shocks as the accretion streams collide with other material in the cavity, as seen in simulations (e.g. Muñoz & Lai, 2016) and observed via H2 emission in the wide binary GG Tau (Beck et al., 2012); such shocks could potentially heat the circumstellar dust and increase its scale height. Our simplistic blackbody fits infer a very large solid angle for the warm dust component near NIR photometric peaks prior to an accretion pulse, with or more for K. This is much larger than inferred for single T Tauri stars (McClure13), and may be indicative of a higher scale height for the temporary circumstellar dust structures that form in the DQ Tau system close to periastron orbital phase, as might be expected from dynamical stirring of the inner disk material by the binary motion. However, given the very different geometry, a detailed comparison with the standard accretion disk model requires analysis of circumbinary disk simulations, which is beyond the scope of this work.
Several previous investigations of warm material in the DQ Tau system support our findings. Carr et al. (2001) characterized CO fundamental emission line profiles, finding a CO excitation temperature of 1200 K. Assuming a simple Keplerian disk model, they estimated an emitting region in the range to AU, which is at least partly co-located with the warm dust component. Boden et al. (2009) used Keck NIR interferometry to resolve K-band emission in the system, placing it at roughly 0.15-0.2 AU, which again is consistent with our inferred location of the warm component.
In contrast, Kóspál et al. (2018) recently presented a somewhat different characterization of the inner disk region, based on contemporaneous observations from the Kepler K2 mission and the Spitzer Space Telescope. Their Spitzer data included 3.6 and 4.5 m photometry obtained at a roughly daily cadence spanning slightly less than one orbital period, and covering most of one accretion pulse event; the light curves in both bands correlated with the Kepler optical data, exhibiting an increase in flux between orbital phases of about 0.8 - 1, and peaking a few days before periastron. There is no evidence of a lag between the infrared and optical data, unlike what we have found for most pulse events at shorter infrared wavelengths. However, the Spitzer observations began when the optical pulse was already underway, so it is possible the onset of the infrared flux increase may have occurred before that of the optical flux. We also note that their measured colors get progressively bluer before periastron, and redder thereafter, which is qualitatively consistent with the dust temperature changes we have inferred from our data.
Based on the Spitzer colors, Kospal et al. inferred a characteristic dust temperature of 917 K near periastron passage, declining to 825 K a few days later. These temperatures are significantly cooler than our spectroscopically-derived values; we believe their estimates to be in error because they are based on single-temperature blackbody fits to two photometric points spanning a limited wavelength range. As we have shown, the infrared excess emission shape can only be explained with a range of dust temperatures (even the two dust components we adopted are likely overly simplistic compared to reality), and the Spitzer photometry by itself is relatively insensitive to any warmer dust component. Since the Spitzer data coincided with an optical accretion pulse, there must have been material closer to the stars than this location in order to feed the stellar accretion flows, thus warmer dust was almost certainly present. Given the characteristic dust temperatures they inferred, Kospal et al. estimated a physical location for the emitting material at about 0.13 AU. Assuming this location corresponds to the inner edge of the circumbinary disk, they interpreted the increase in characteristic dust temperature near periastron as due to increased irradiation by the accretion pulse. Our results suggest that changes in the location and geometry of the emitting material are also important, if not dominant, in setting the level and shape of the dust emission. In addition, the warmer dust temperatures we infer ( K) indicate that most of this material is unlikely to be associated with any stable circumbinary disk since it is located in a region where the binary torques are very strong. Our data show ambiguous evidence of the effects of variable irradiation on the warmest circumstellar material, except perhaps in the case of the extremely large pulse we observed near MJD-2456630. Nevertheless, further NIR spectroscopy tracing the onset and growth of the NIR photometric peaks is required to better understand the relative roles of dust heating and surface area.
As mentioned above, accretion pulses do occasionally occur at phases other than periastron. We observed several examples of weak pulses a few days after periastron passage in the 2013-2014 season, and one cycle with four roughly equally spaced peaks. Other studies have also seen pulses occurring close to apastron phase (Bary14; Tofflemire et al., 2017a; Kóspál et al., 2018). The origin of these events is unclear; they may represent stochastic accretion events related to clumpy circumstellar material, as often seen in classical T Tauri disks (Cody et al., 2014; Stauffer et al., 2014, 2016). Tofflemire et al. (2017a) suggested the possibility that the stars may occasionally cross through remnant streams from a previous cycle, as seen in some simulations. Interestingly, the cycle we observed containing four optical peaks occurred after the extremely large pulse near MJD-2456630, and also exhibited the reddest baseline level, indicative of a significant amount of residual material inside the circumbinary disk.
The correlation between the minima and periastron passages with weak or no optical pulses suggests a link between pulse strength and the amount of material dragged inward by the accretion streams. The source of the 75-day periodicity may be a result of dynamical processes in or near the inner edge of the circumbinary disk. For example, some simulations have shown that the disk cavity can become eccentric and/or develop repeated azimuthal density enhancements (Shi et al., 2012; Miranda et al., 2017). The former effect is unlikely to lead to the observed variability since the eccentricity precesses on a much longer timescale, of order years. In the latter case, when a density “lump” rotates into one of the points from which the streams originate, it can lead to an increase in the surface area and accretion rate in the stream. If the 75-day periodicity is tracing orbital motion, the source would be located at AU, very similar to the predicted location of the lump at , which corresponds to AU in DQ Tau. However, the simulations to date find that such density enhancements form only in binaries with very low eccentricities, which is not the case for the DQ Tau system.
Finally, our finding of an increase in the extinction near periastron phase has implications for interpretation of optical light curves. Some of the complicated structure seen at shorter timescales (e.g. Tofflemire et al., 2017a; Kóspál et al., 2018) may be due at least in part to variations in the exinction along the line of sight. Because of the degeneracy between extinction and accretion excess, it is impossible to reliably disentangle the two effects with photometry alone. Spectroscopy is essential to breaking this degeneracy by using the method of veiling characterization as a function of wavelength.
We acknowledge Steve Lubow, Jeff Bary, Ben Tofflemire, Bob Mathieu, and Bo Reipurth for helpful discussions and encouragement. J. M. extends a special thanks to the staff at IRTF, particularly Alan Tokunaga and John Rayner, for their generous scheduling flexibility and peerless remote observing support.
The reference list from the paper itself. Each links out to its DOI / PubMed record.
- 1Artymowicz & Lubow (1996) Artymowicz, P., & Lubow, S. H. 1996, Ap J, 467, L 77, doi: 10.1086/310200 · doi ↗
- 2Bailer-Jones et al. (2018) Bailer-Jones, C. A. L., Rybizki, J., Fouesneau, M., Mantelet, G., & Andrae, R. 2018, AJ, 156, 58, doi: 10.3847/1538-3881/aacb 21 · doi ↗
- 3Bans & Königl (2012) Bans, A., & Königl, A. 2012, Ap J, 758, 100, doi: 10.1088/0004-637X/758/2/100 · doi ↗
- 4Bary & Petersen (2014) Bary, J. S., & Petersen, M. S. 2014, Ap J, 792, 64, doi: 10.1088/0004-637X/792/1/64 · doi ↗
- 5Basri et al. (1997) Basri, G., Johns-Krull, C. M., & Mathieu, R. D. 1997, AJ, 114, 781, doi: 10.1086/118510 · doi ↗
- 6Bate (2000) Bate, M. R. 2000, MNRAS, 314, 33, doi: 10.1046/j.1365-8711.2000.03333.x · doi ↗
- 7Beck et al. (2012) Beck, T. L., Bary, J. S., Dutrey, A., et al. 2012, Ap J, 754, 72, doi: 10.1088/0004-637X/754/1/72 · doi ↗
- 8Boden et al. (2009) Boden, A. F., Akeson, R. L., Sargent, A. I., et al. 2009, Ap J, 696, L 111, doi: 10.1088/0004-637X/696/2/L 111 · doi ↗