Fluctuations of anisotropic flow in Pb+Pb collisions at $\sqrt{s_{\mathrm{NN}}}=5.02$ TeV with the ATLAS detector
ATLAS Collaboration
TL;DR
This study measures multi-particle azimuthal cumulants in Pb+Pb collisions at 5.02 TeV, revealing non-Gaussian flow fluctuations, harmonic correlations, and their dependence on collision centrality, providing insights into initial and final state effects.
Contribution
First observation of non-zero four-particle cumulant for dipolar flow and detailed analysis of harmonic flow fluctuations and correlations in ultra-central collisions.
Findings
Non-zero four-particle cumulant observed for dipolar flow $v_1$.
Sign change of cumulants for $v_2$ and $v_3$ in ultra-central collisions.
Anti-correlation between $v_2$ and $v_3$, positive correlation between $v_2$ and $v_4$.
Abstract
Multi-particle azimuthal cumulants are measured as a function of centrality and transverse momentum using 470 b of Pb+Pb collisions at TeV with the ATLAS detector at the LHC. These cumulants provide information on the event-by-event fluctuations of harmonic flow coefficients and correlated fluctuations between two harmonics and . For the first time, a non-zero four-particle cumulant is observed for dipolar flow, . The four-particle cumulants for elliptic flow, , and triangular flow, , exhibit a strong centrality dependence and change sign in ultra-central collisions. This sign change is consistent with significant non-Gaussian fluctuations in and . The four-particle cumulant for quadrangular flow, , is found to change sign in mid-central collisions. Correlations between two harmonics are studied…
Click any figure to enlarge with its caption.
 Figure 1
 Figure 2
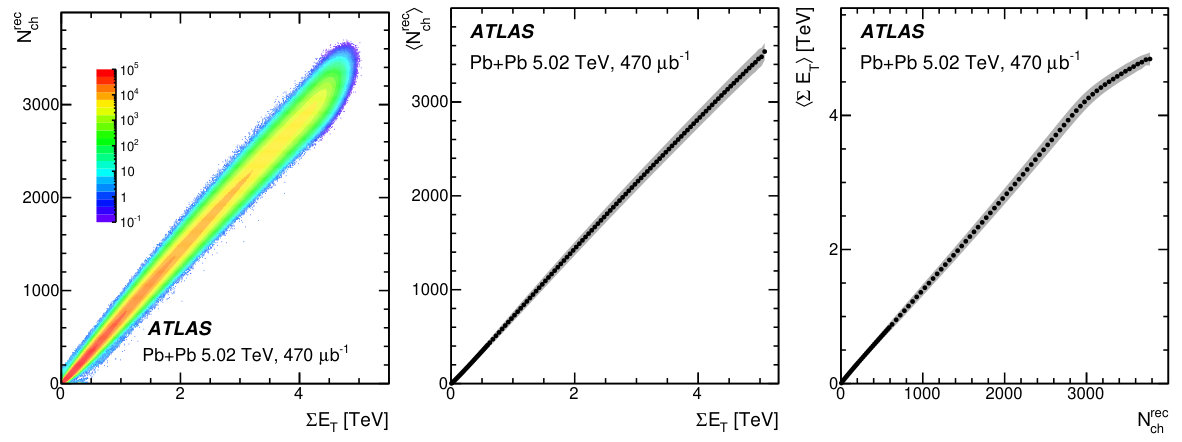 Figure 1
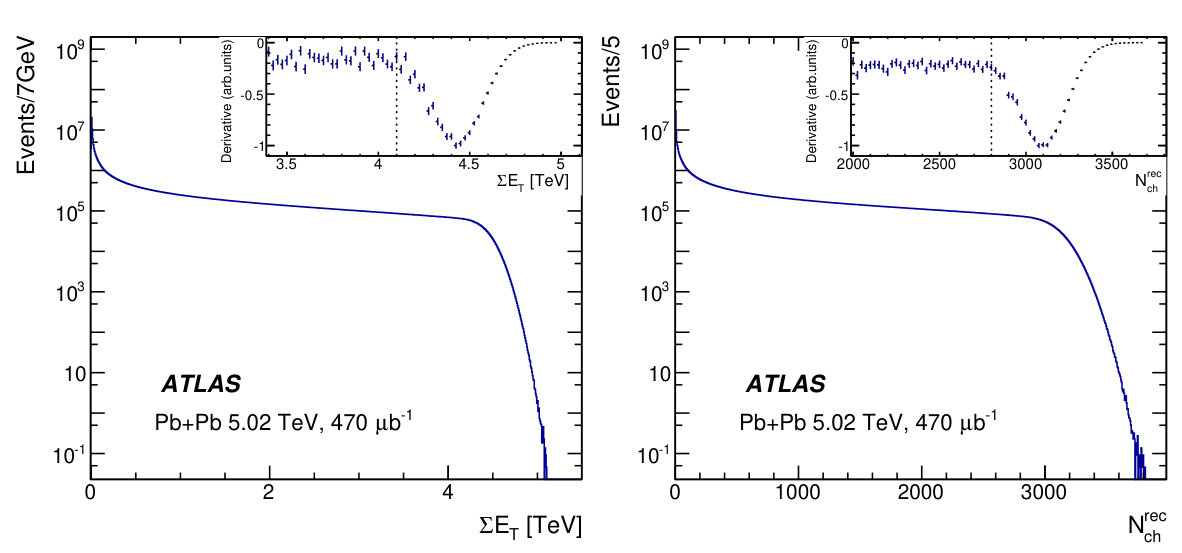 Figure 2
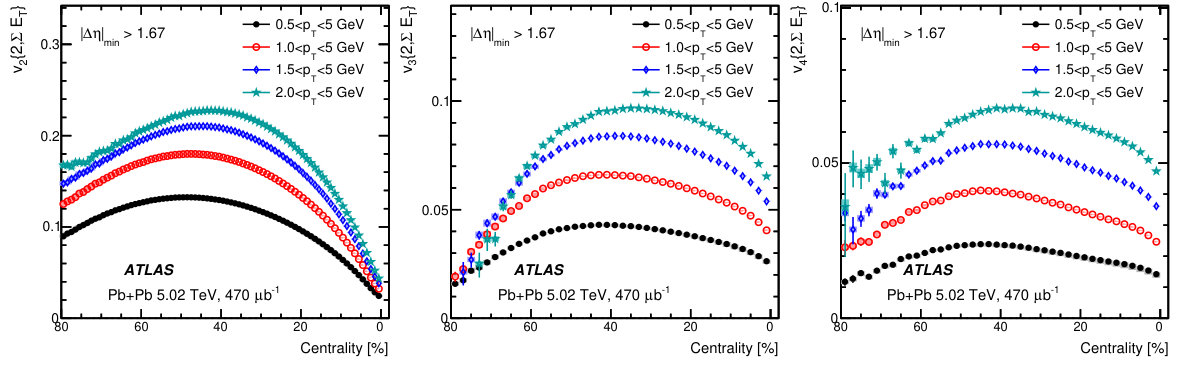 Figure 3
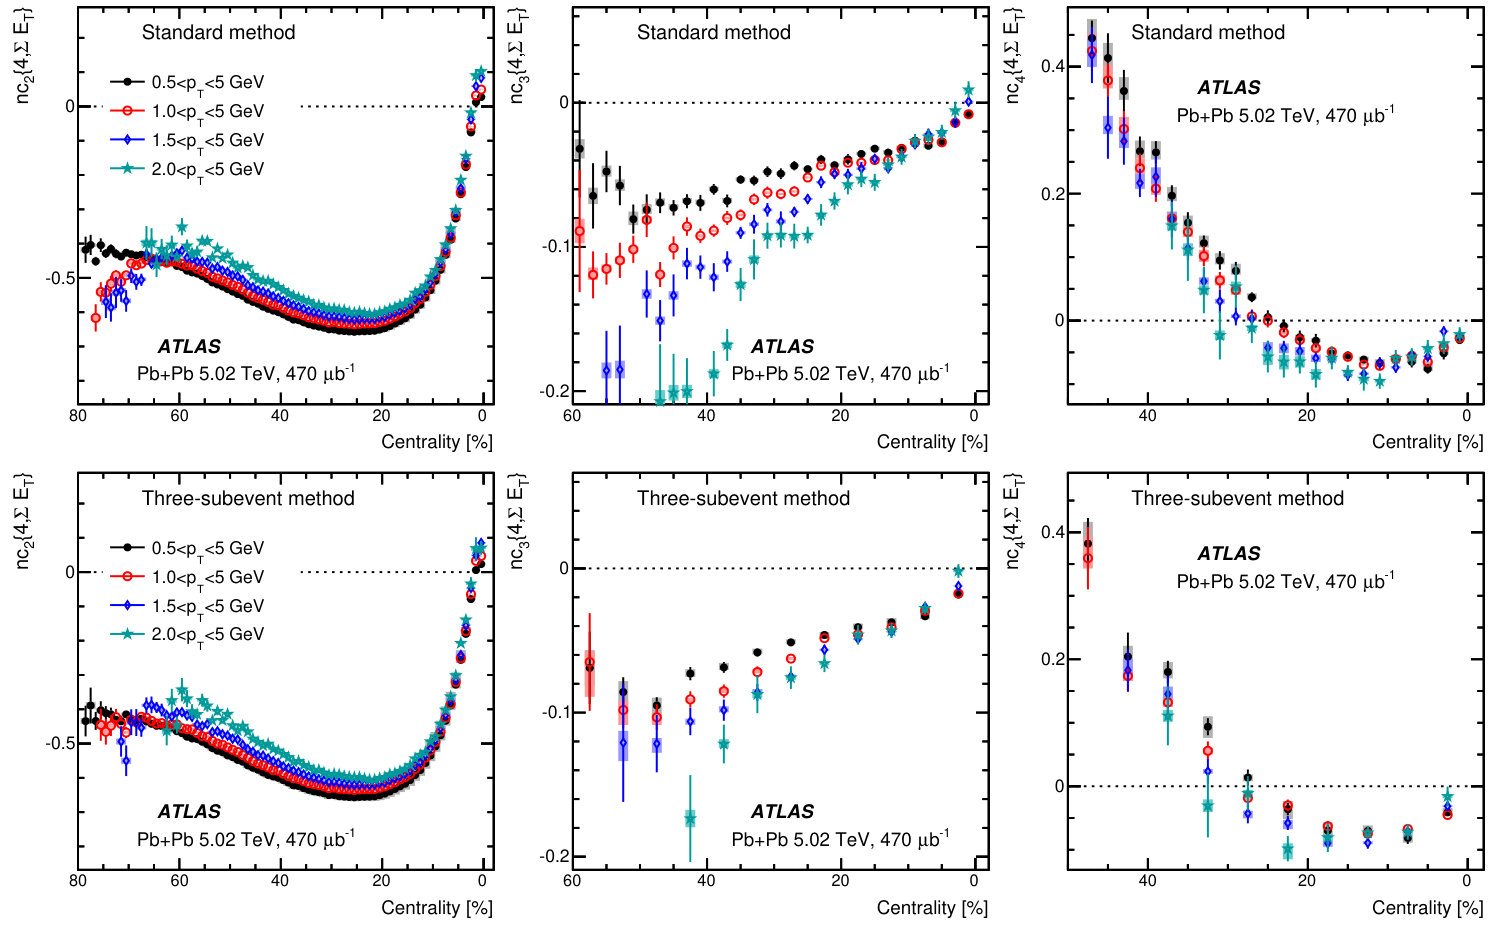 Figure 4
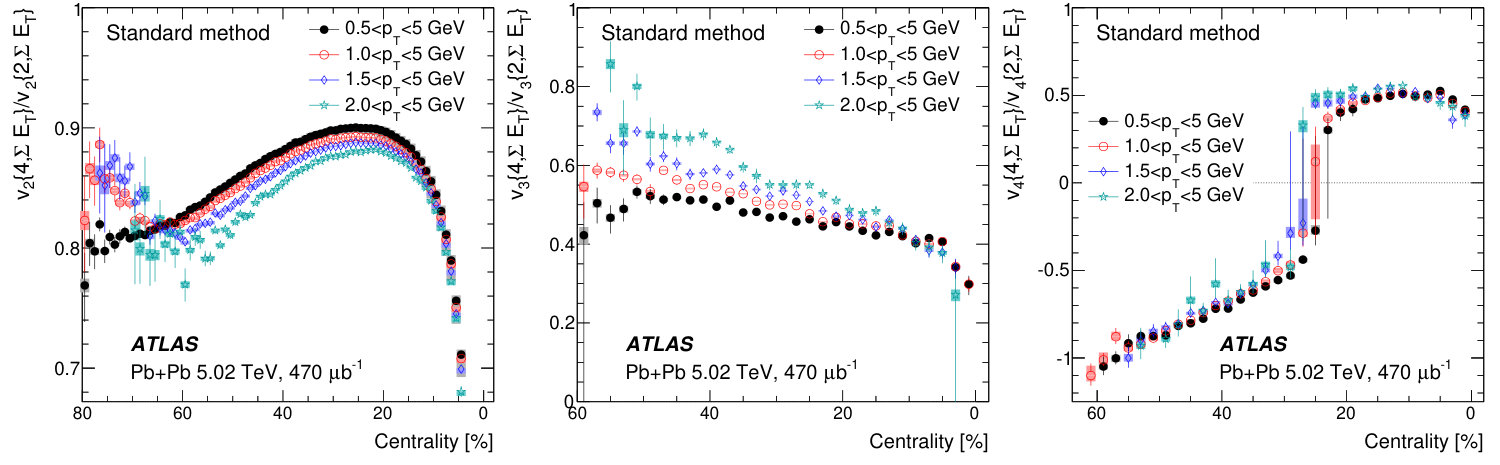 Figure 5
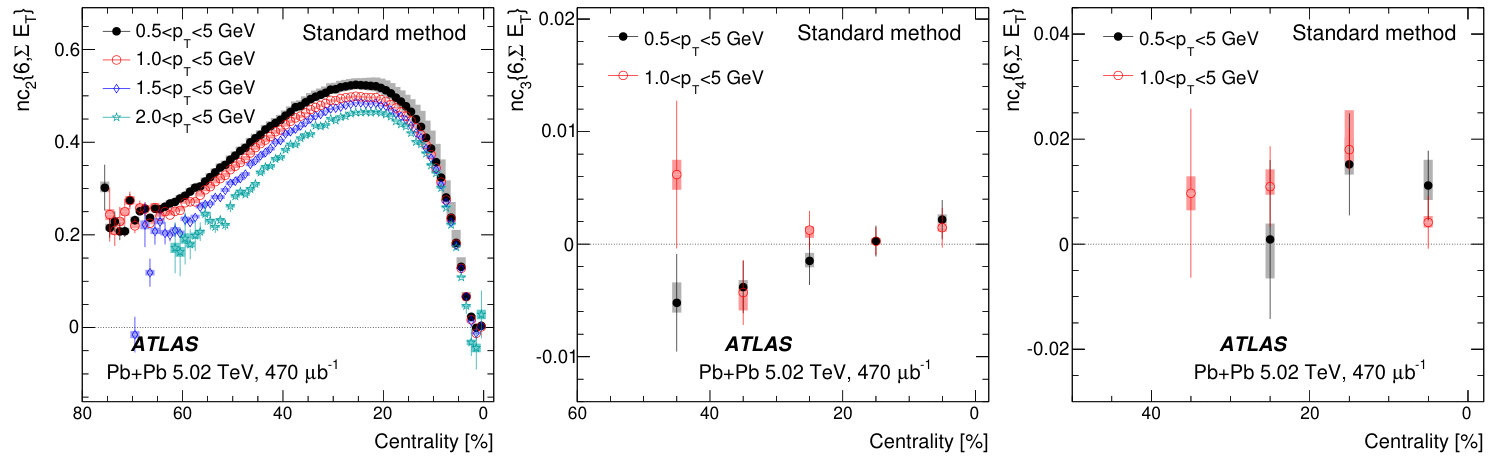 Figure 6
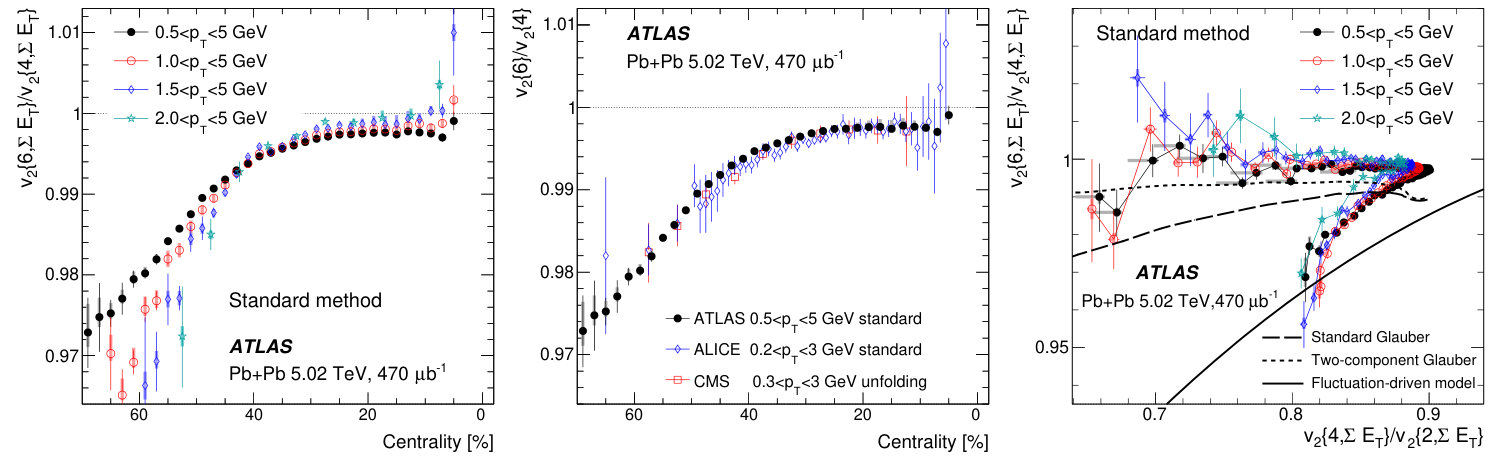 Figure 7
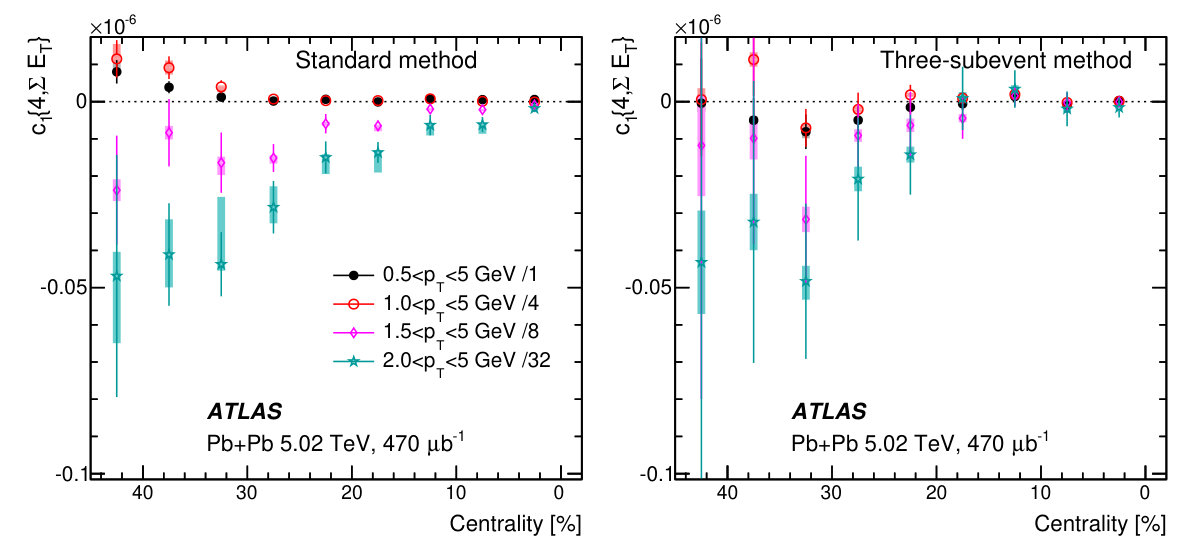 Figure 8
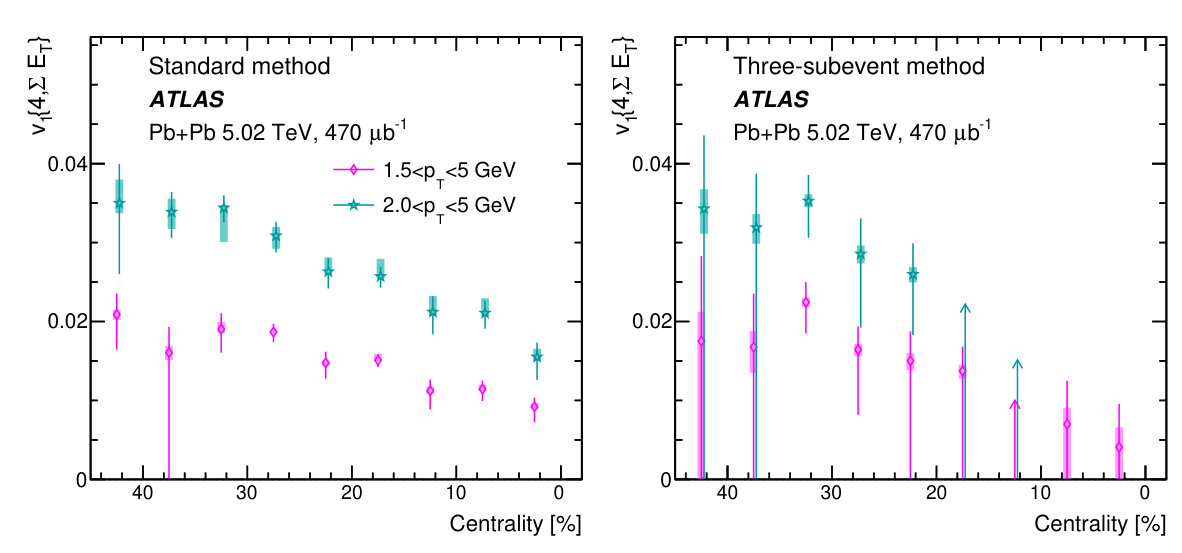 Figure 9
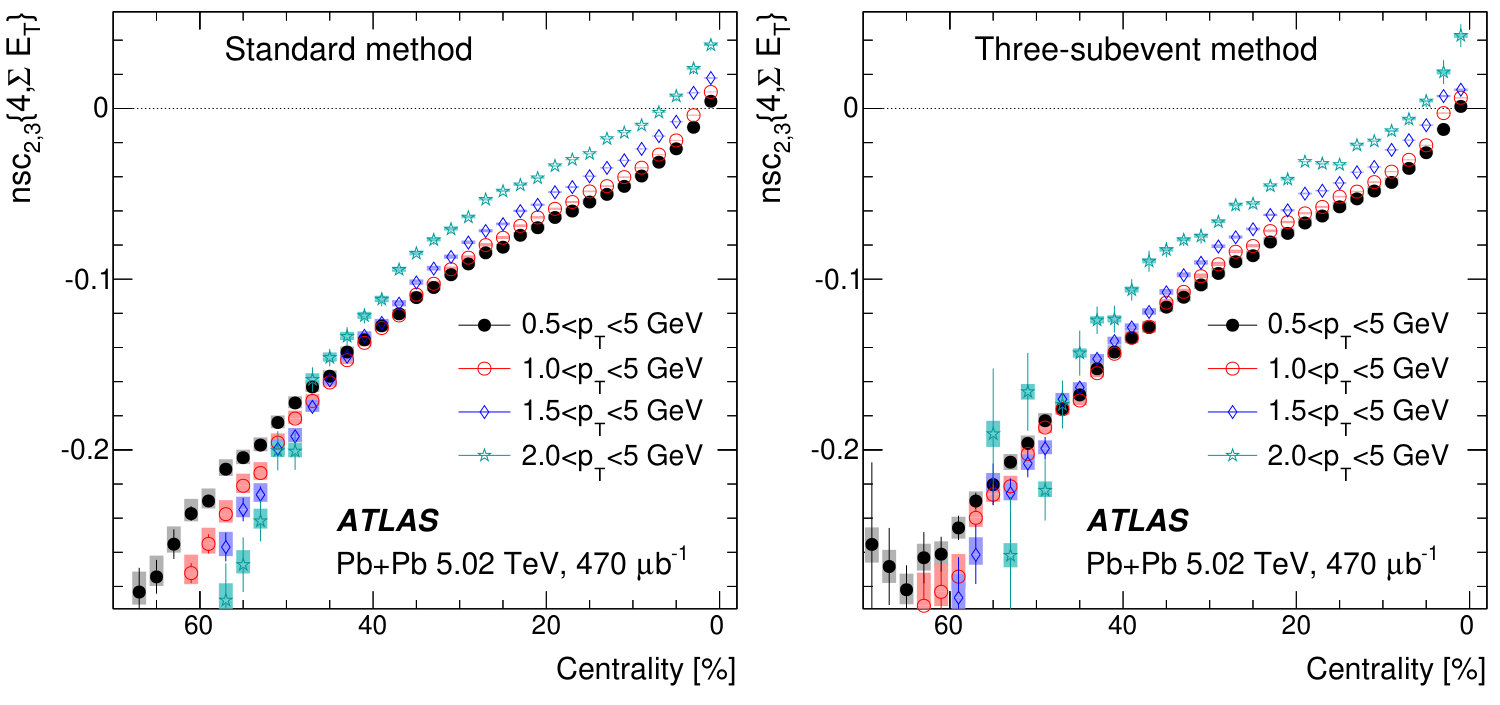 Figure 10
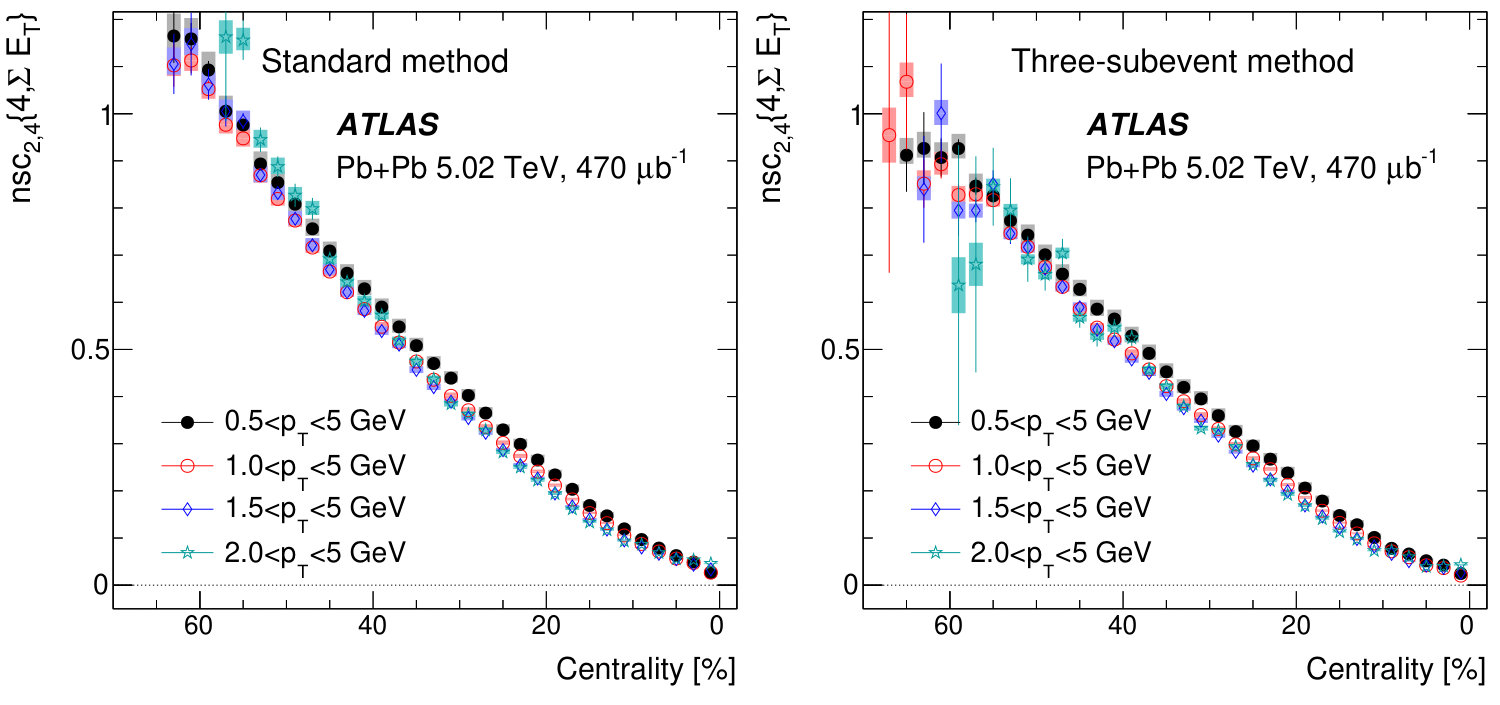 Figure 11
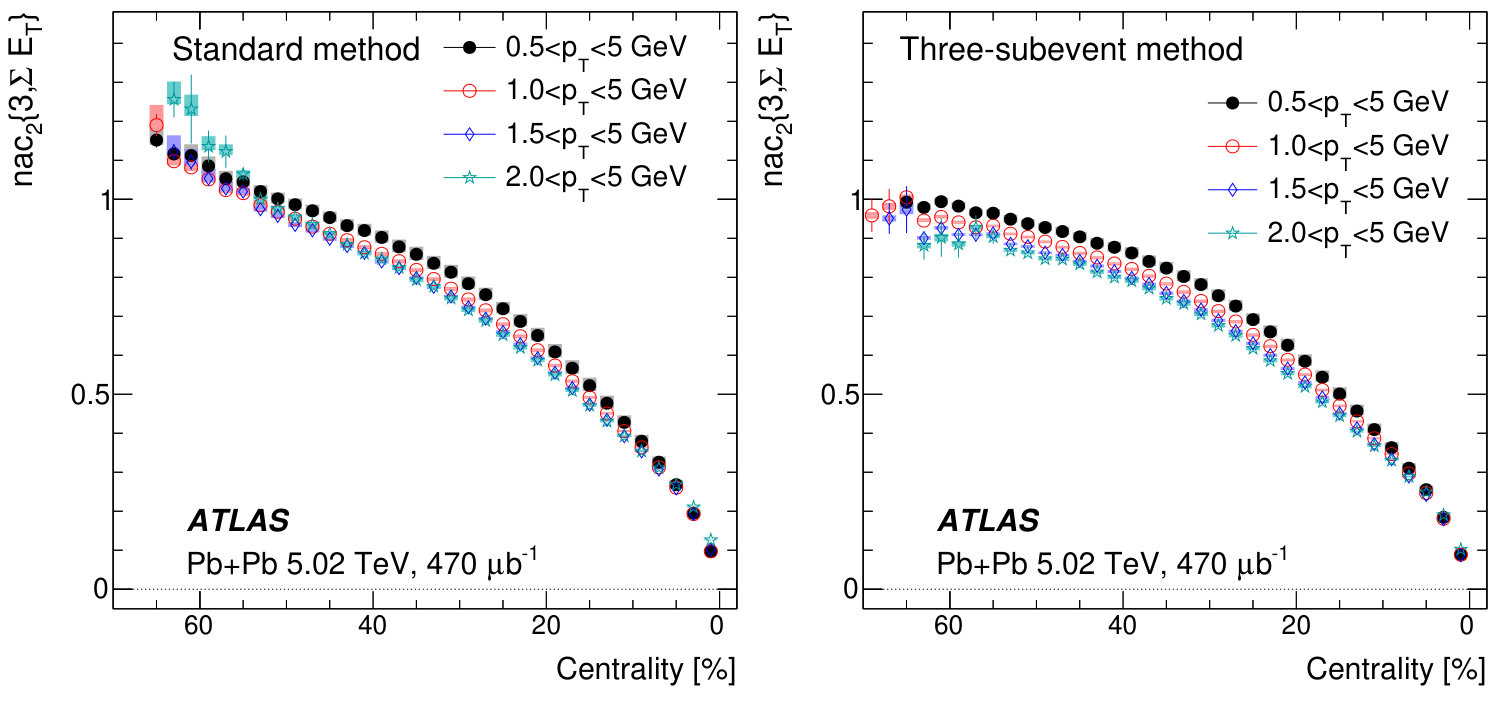 Figure 12
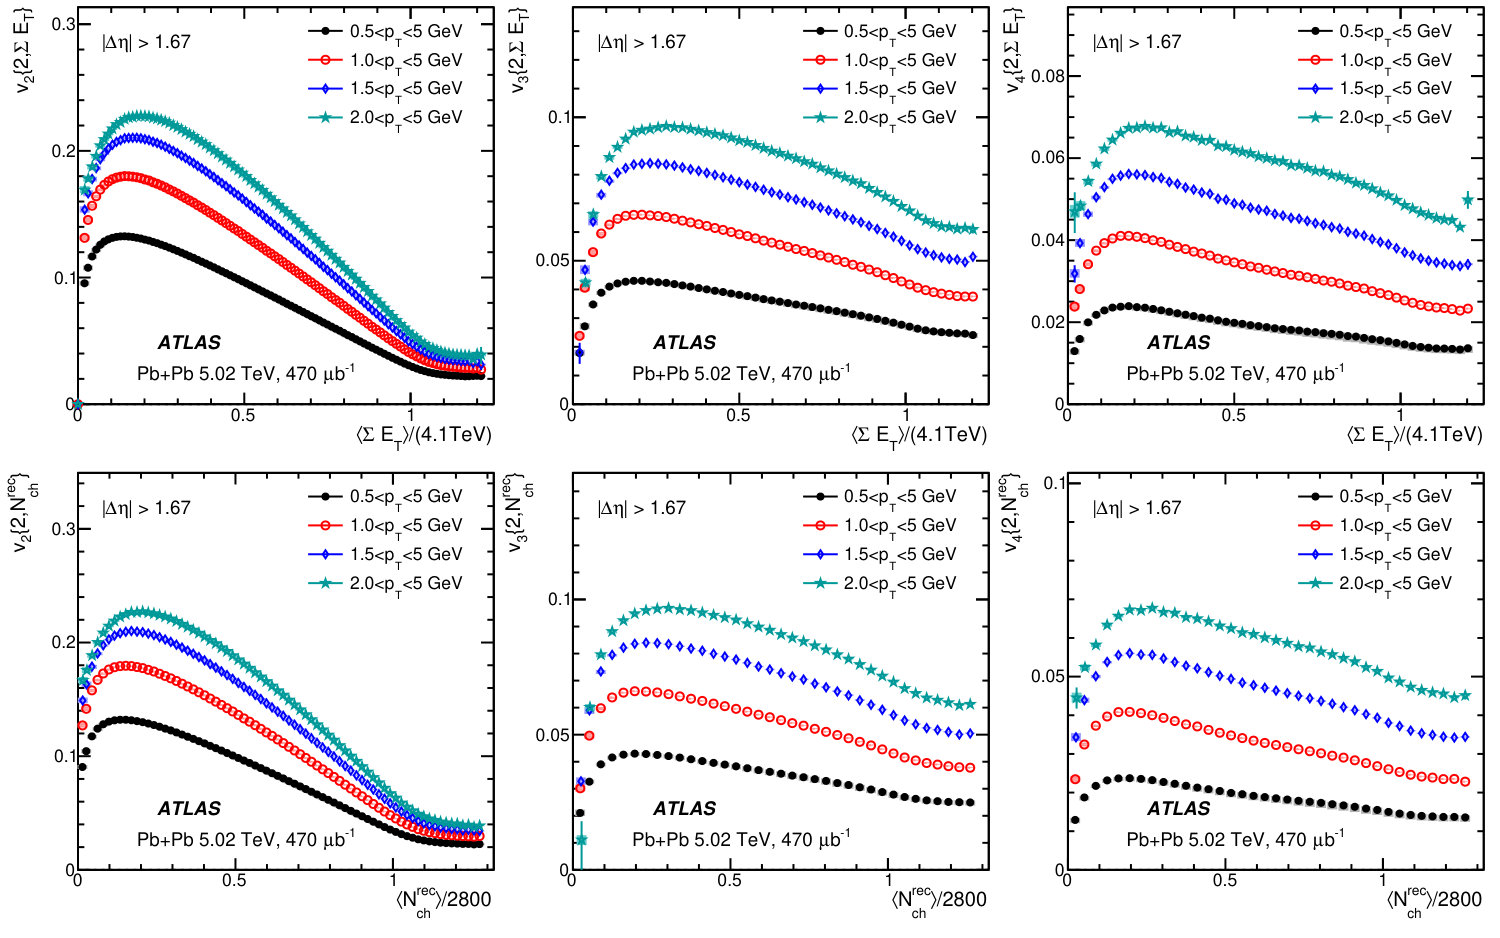 Figure 13
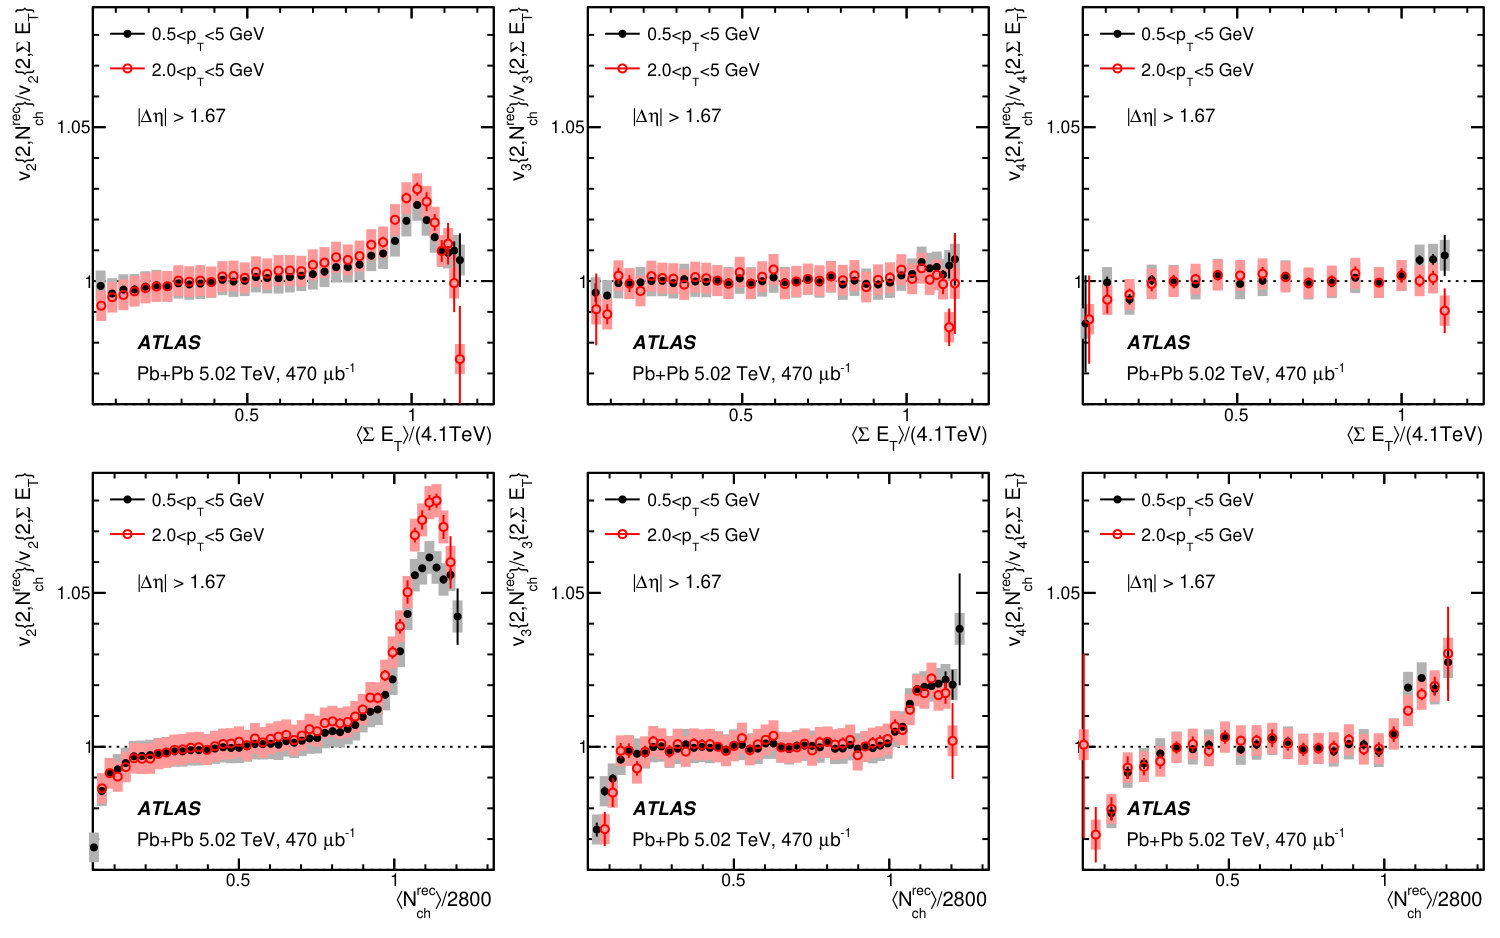 Figure 14
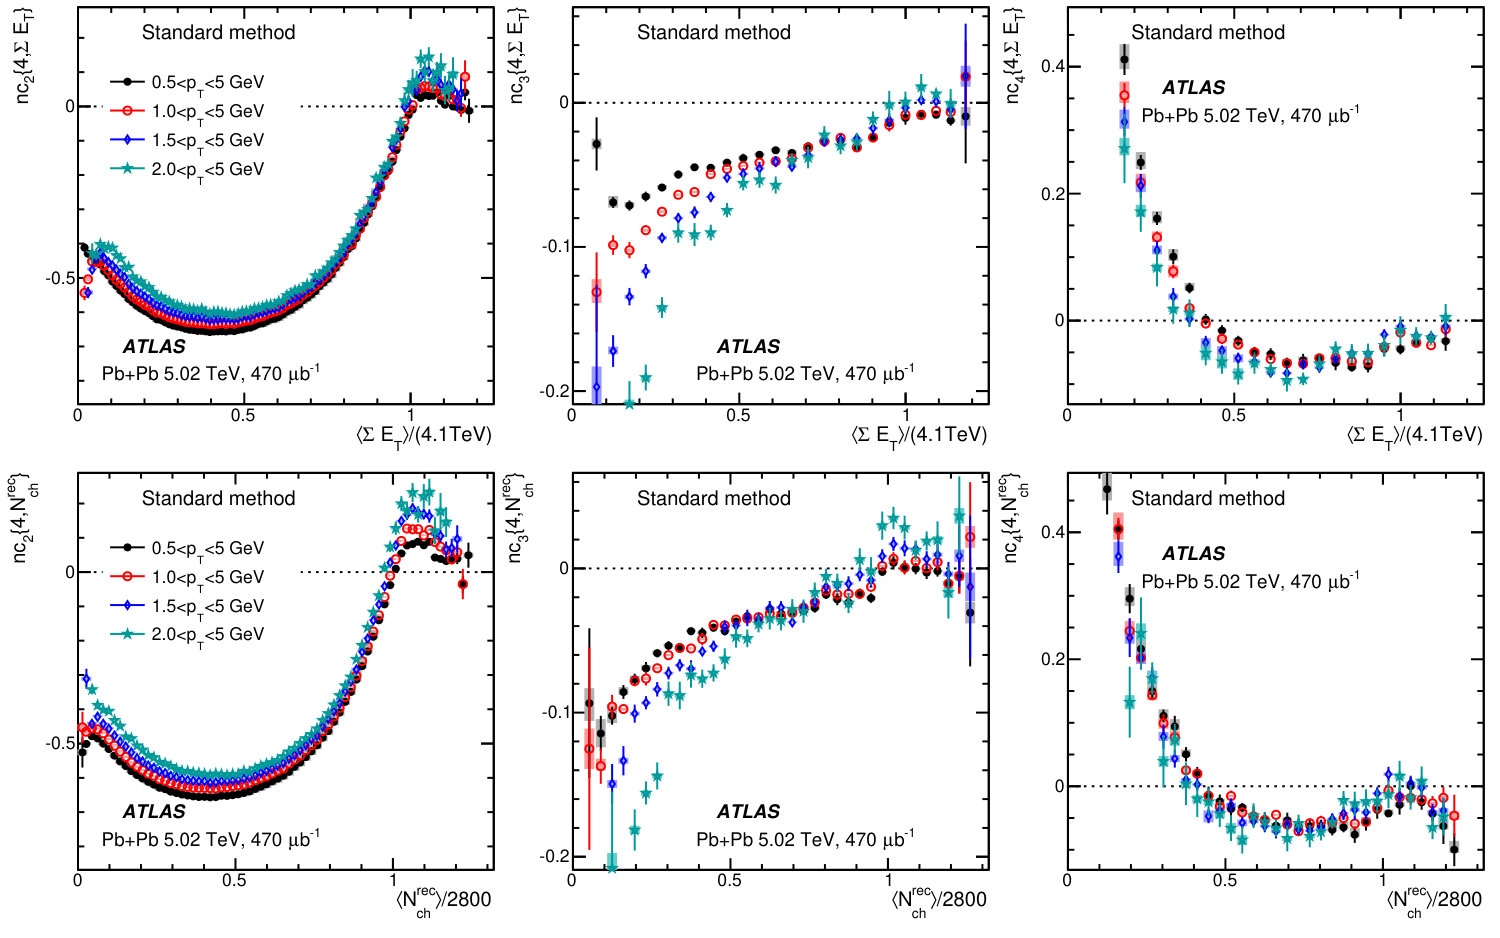 Figure 15
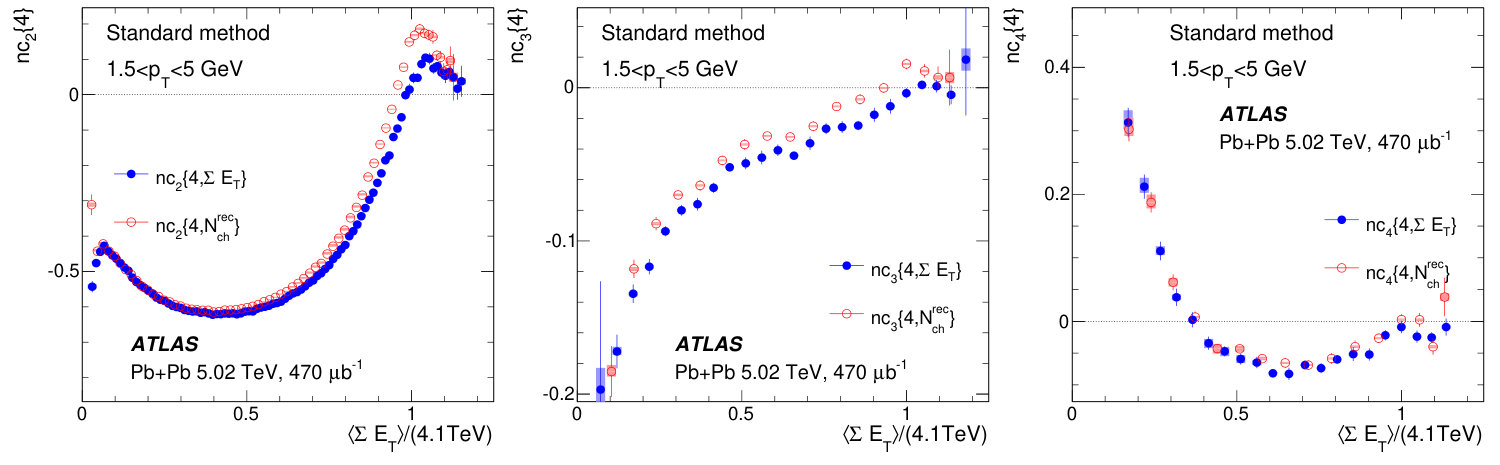 Figure 16
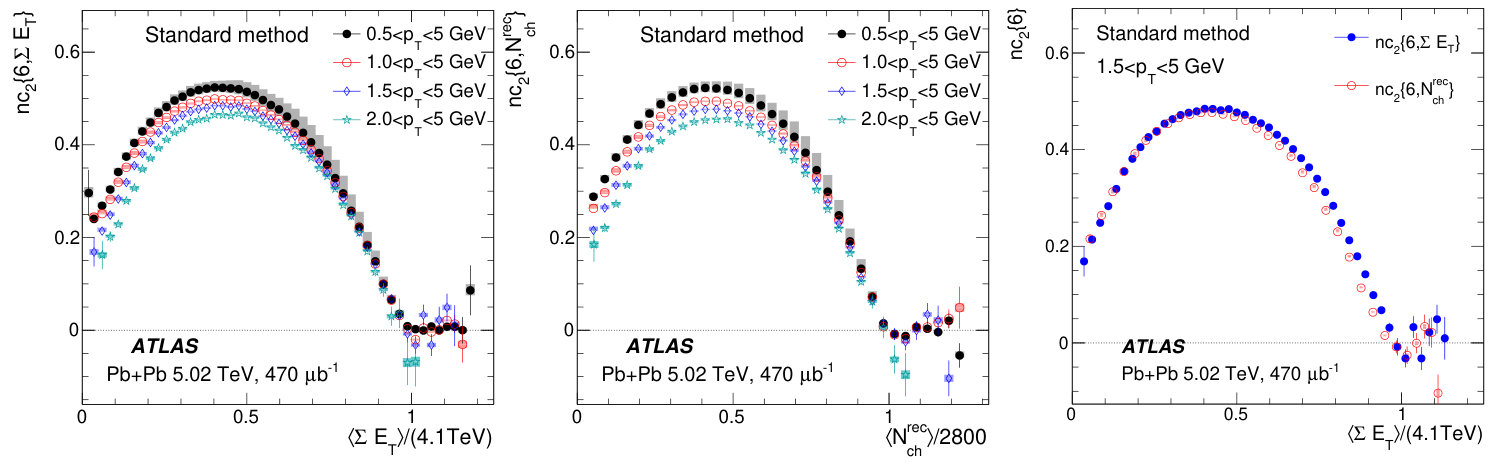 Figure 17
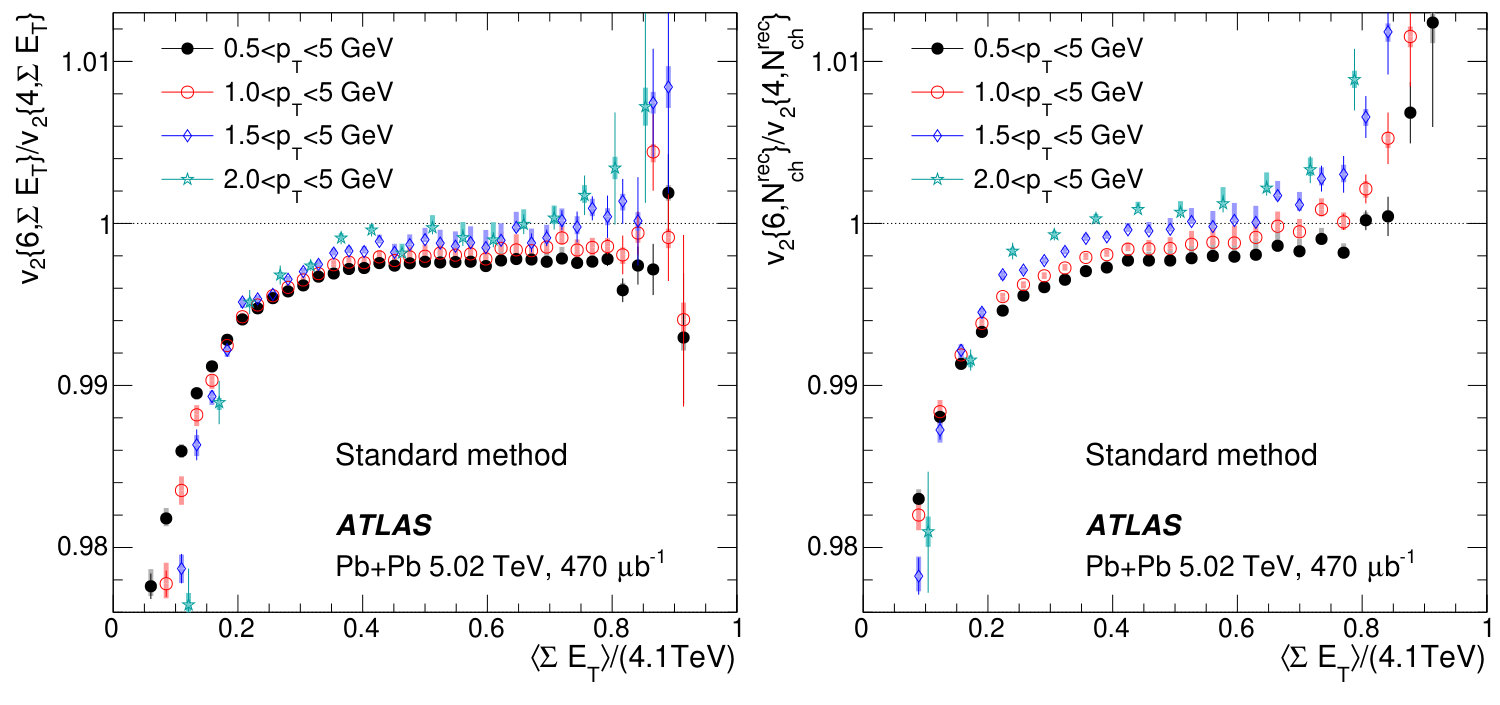 Figure 18
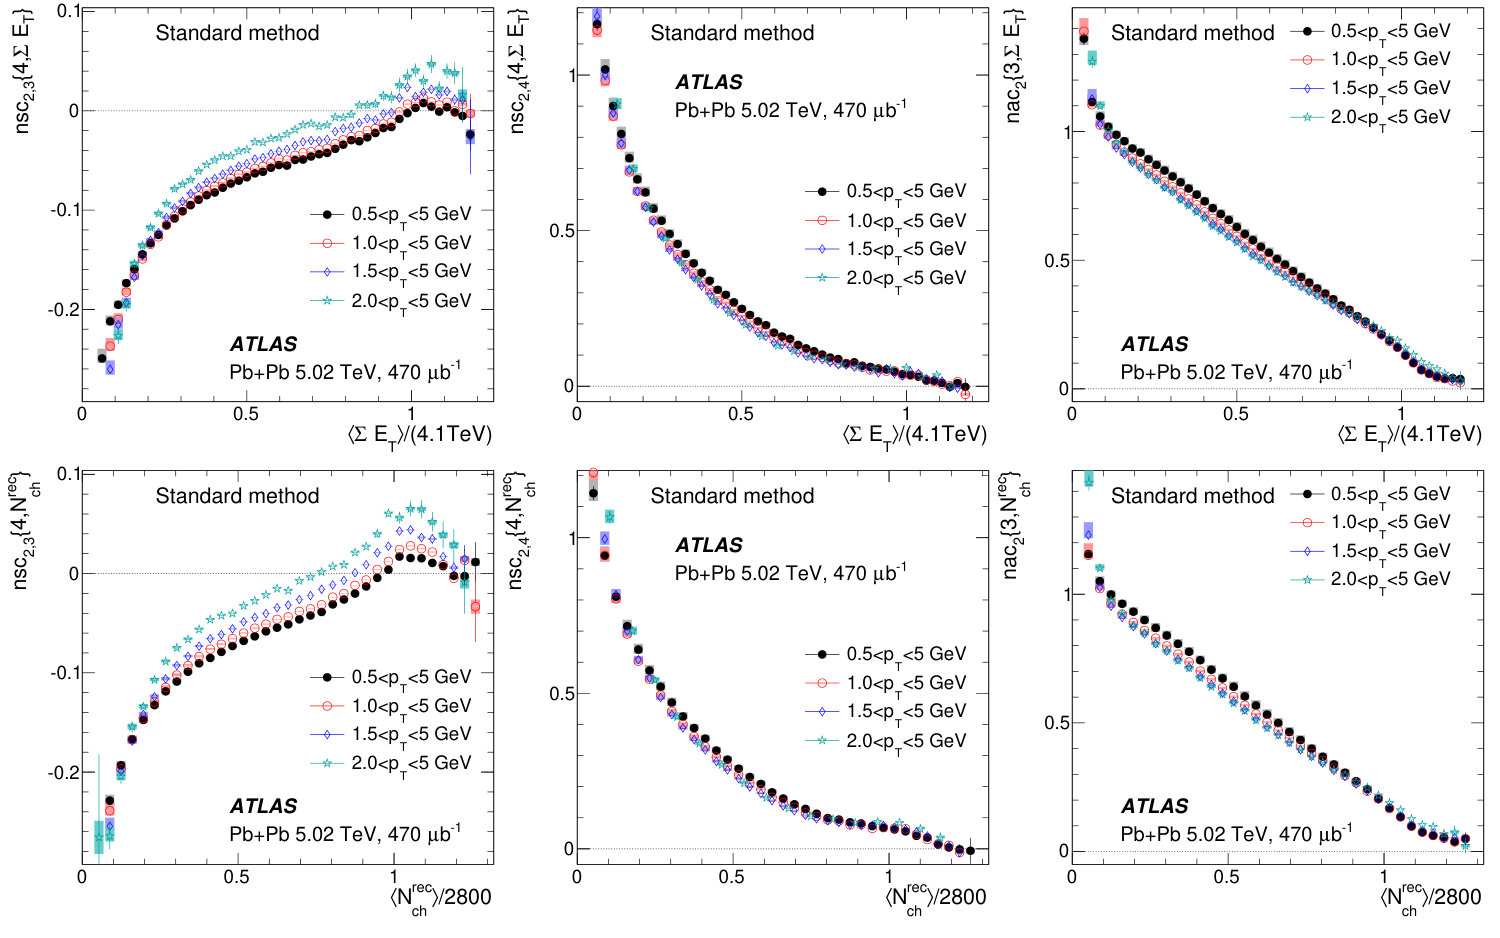 Figure 19
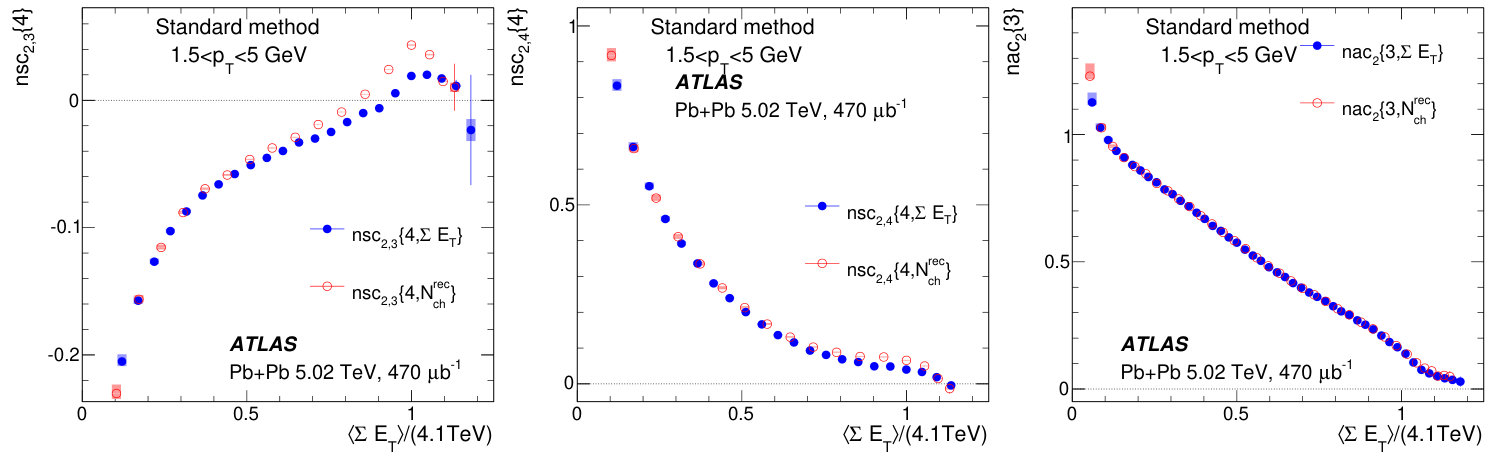 Figure 20
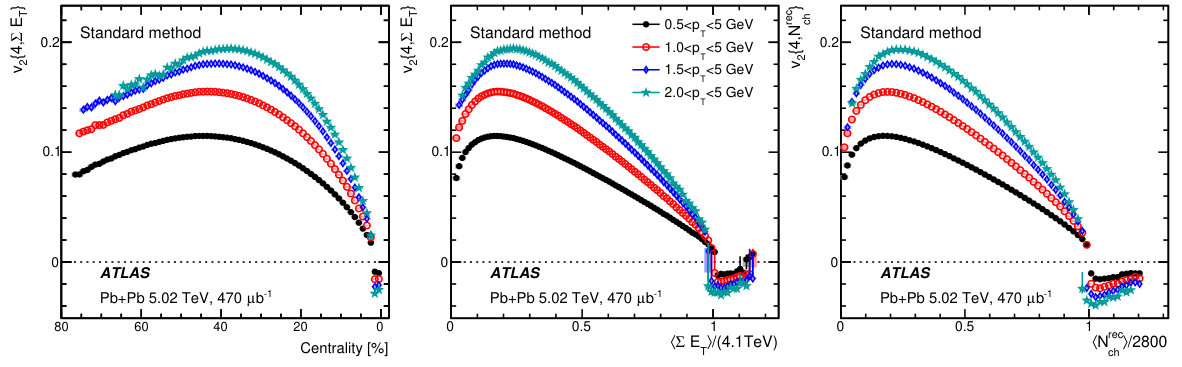 Figure 21
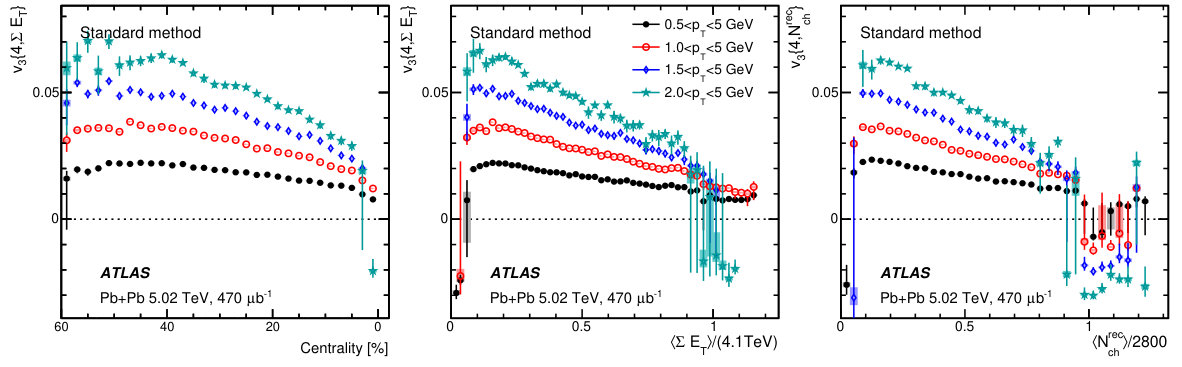 Figure 22
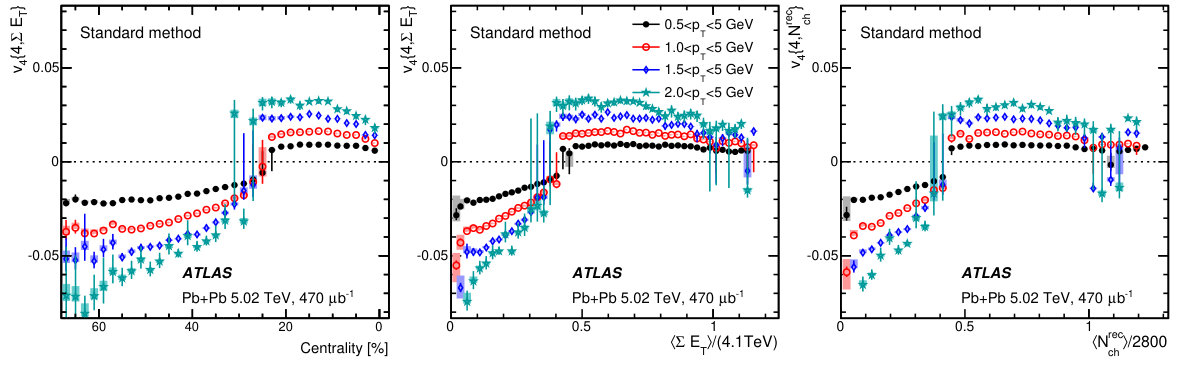 Figure 23
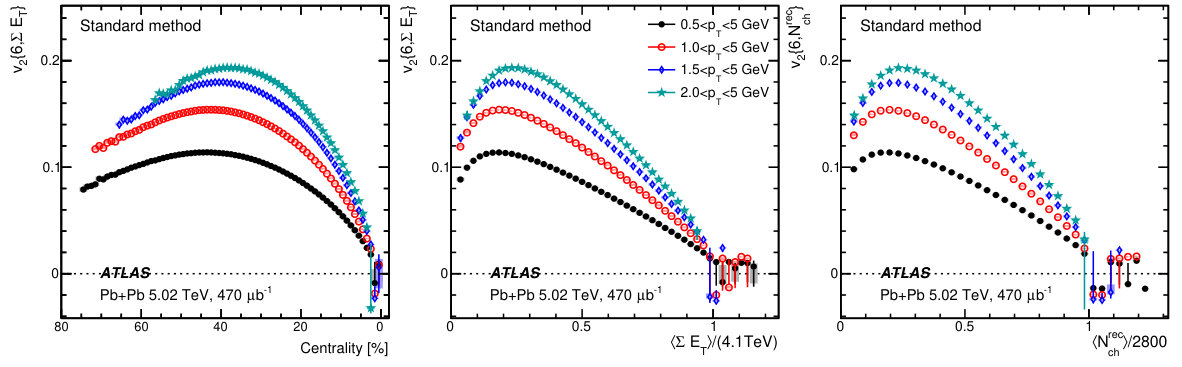 Figure 24
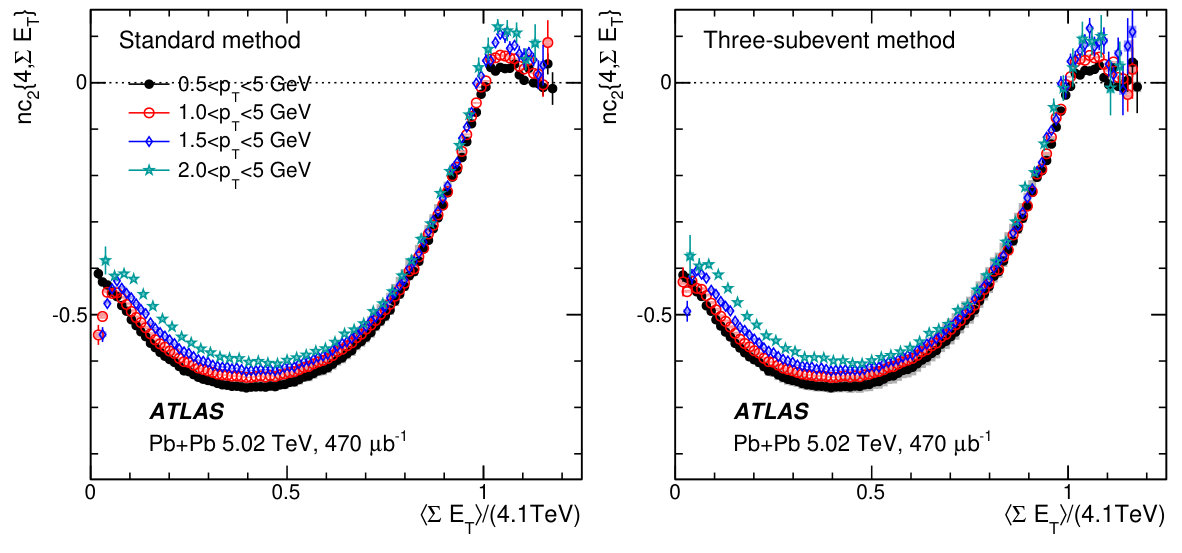 Figure 25
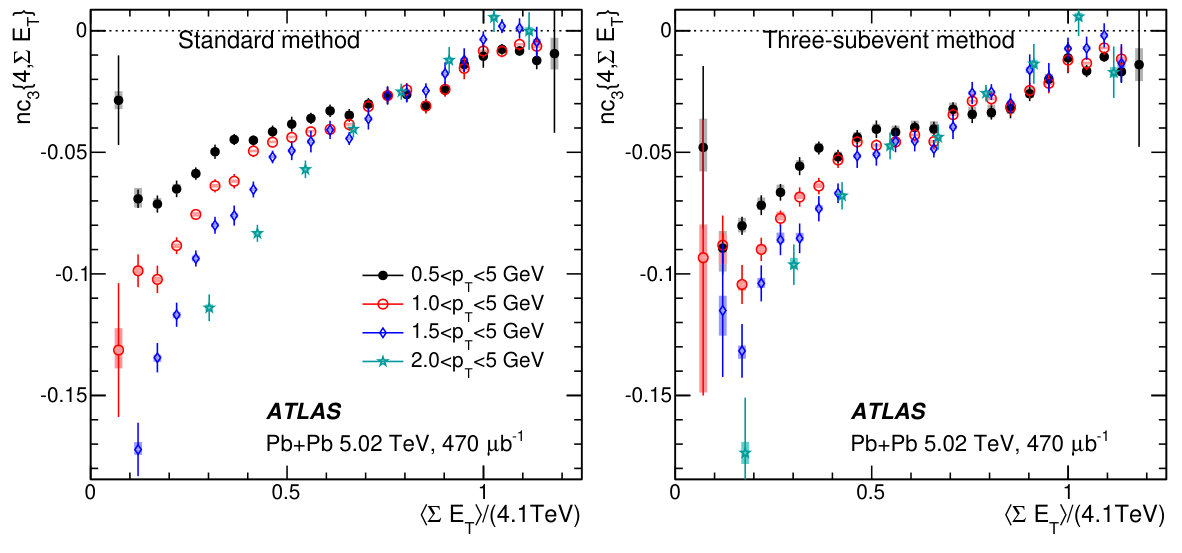 Figure 26
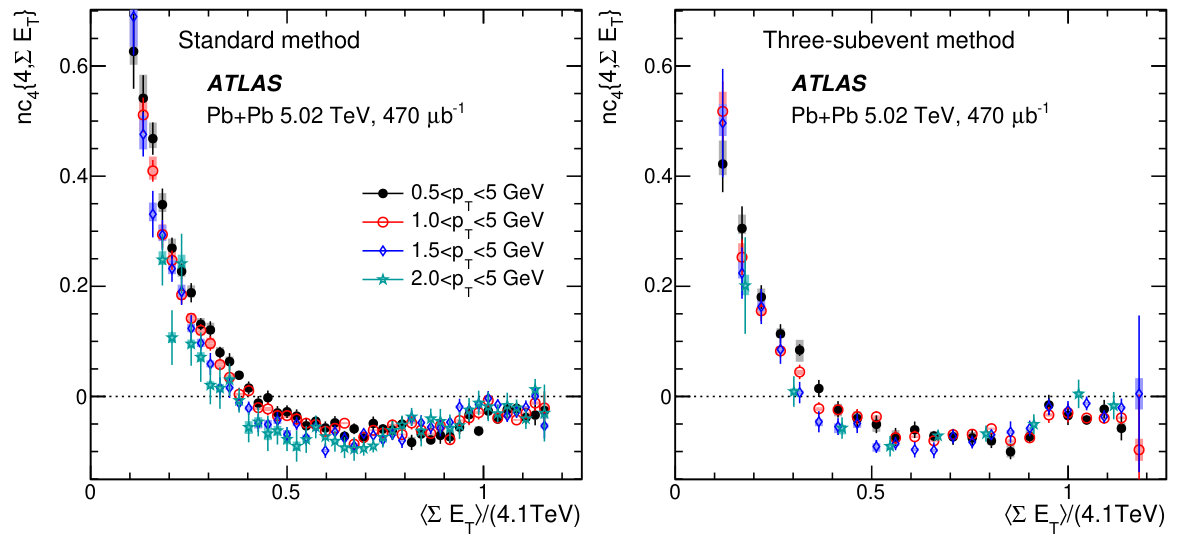 Figure 27
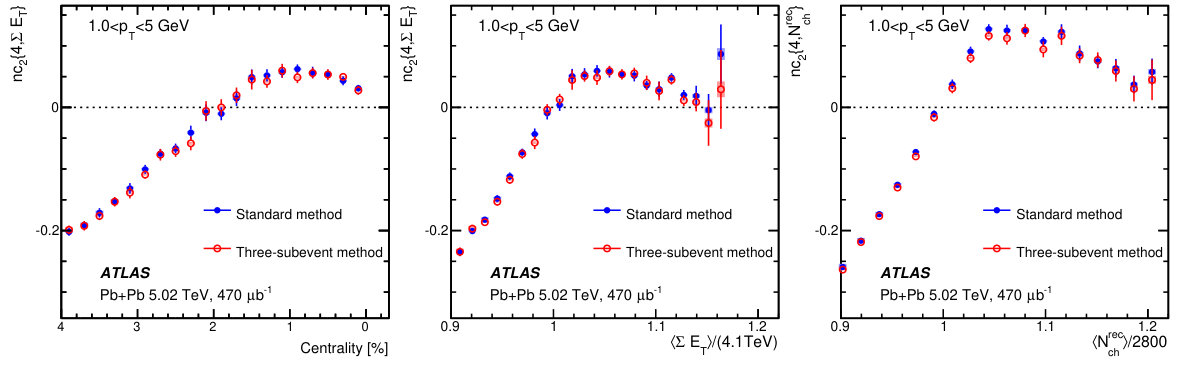 Figure 28
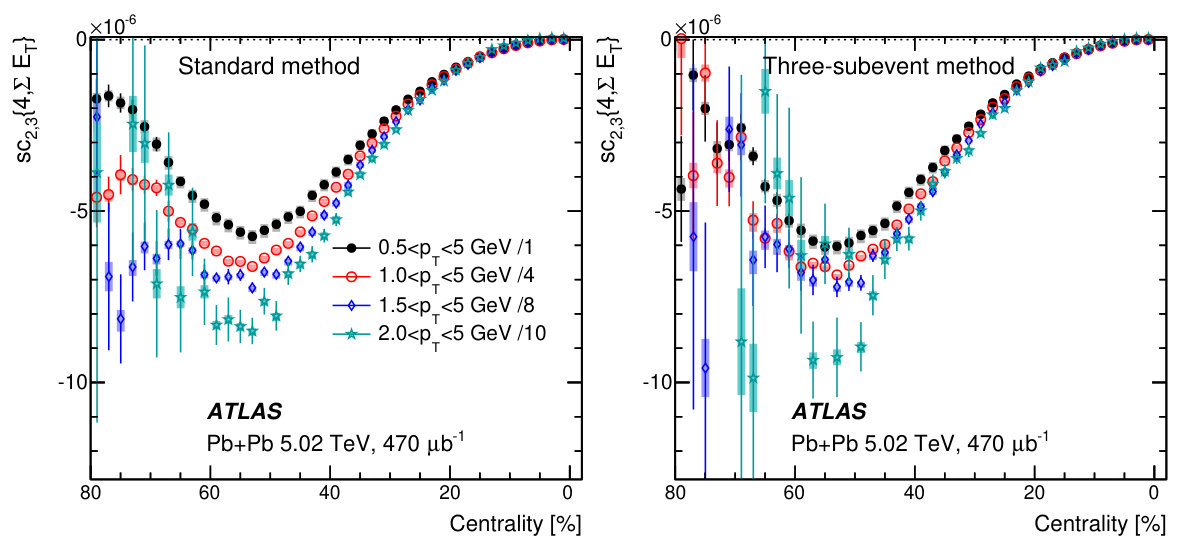 Figure 29
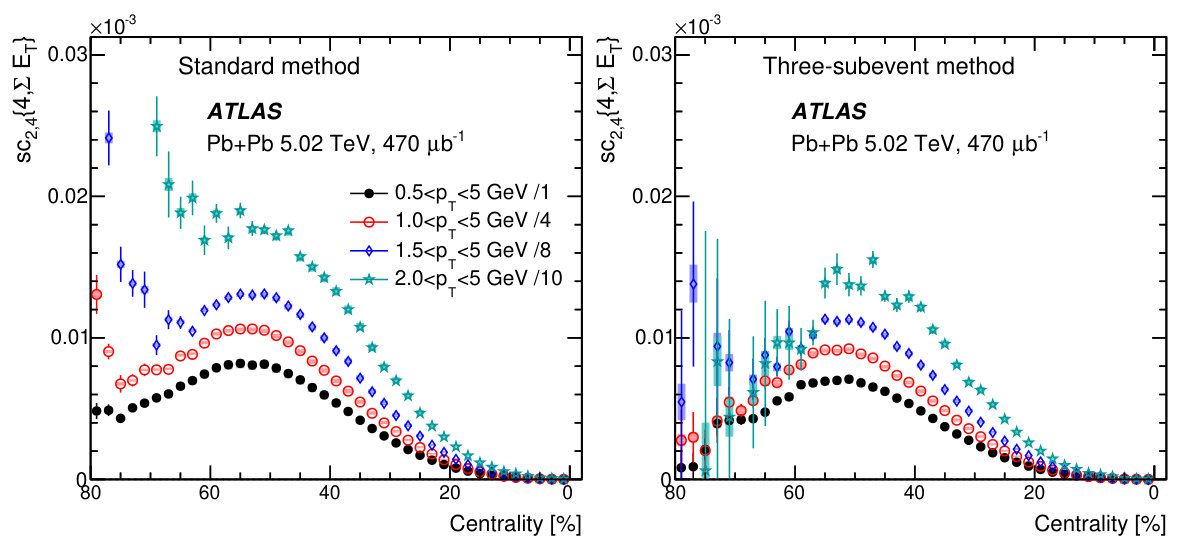 Figure 30
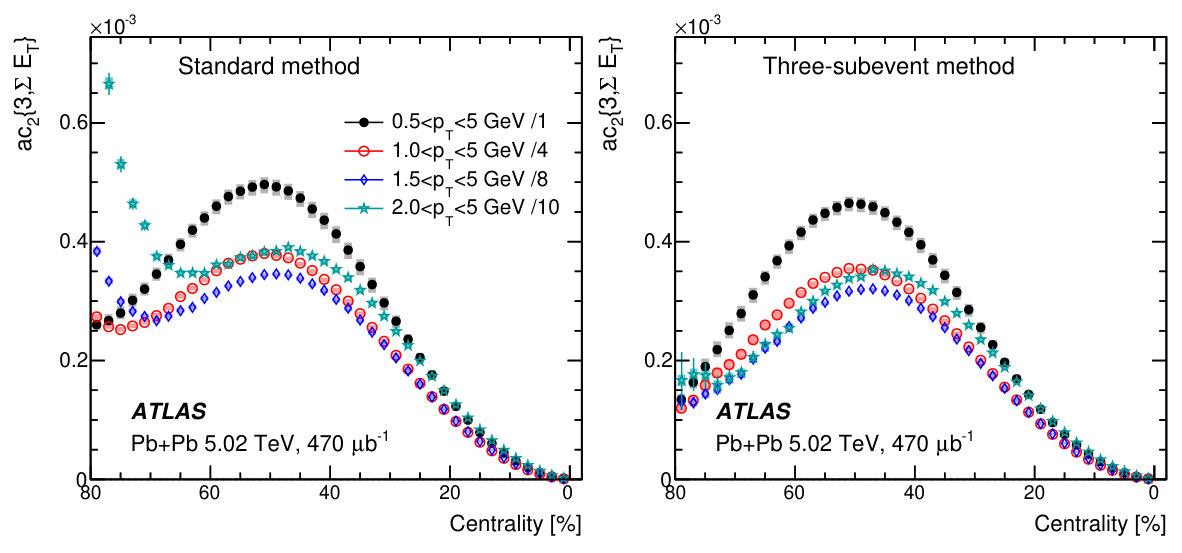 Figure 31
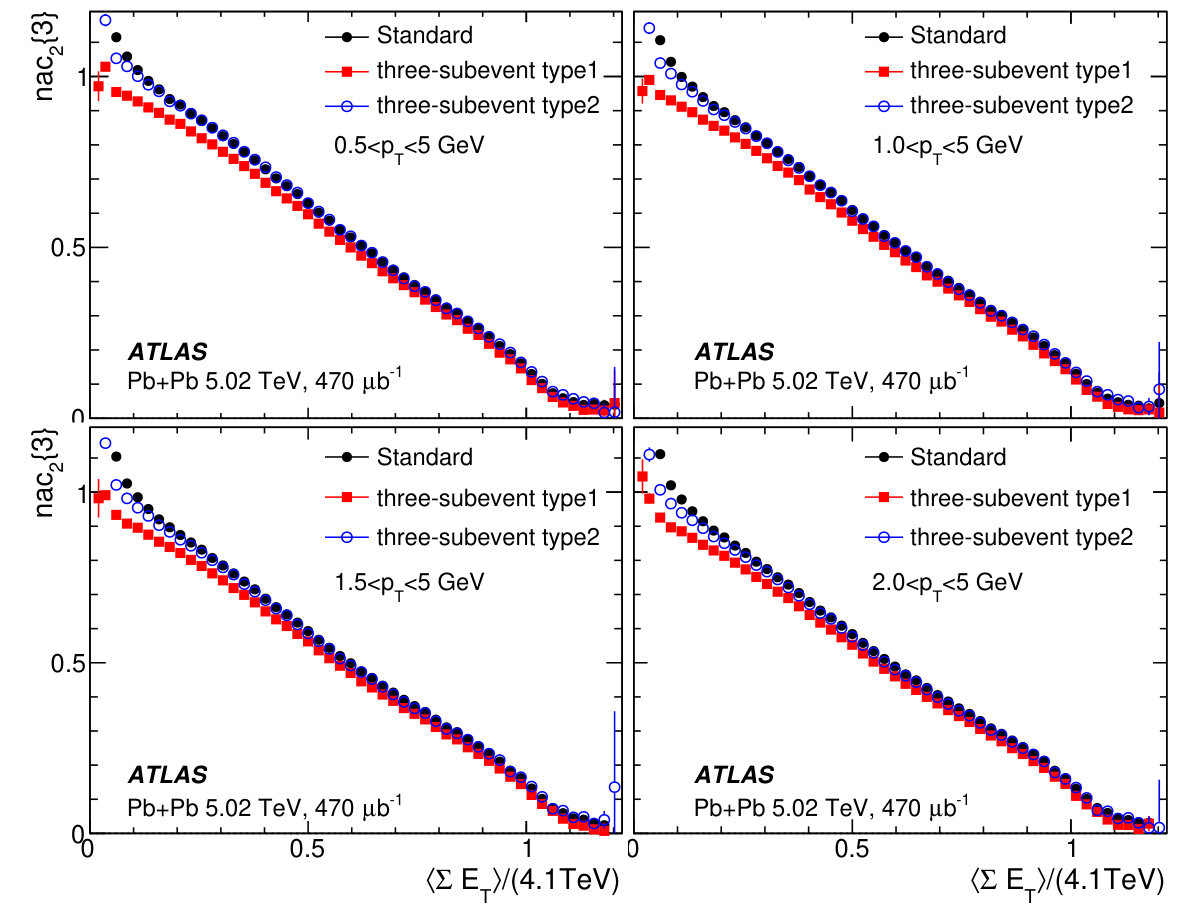 Figure 32
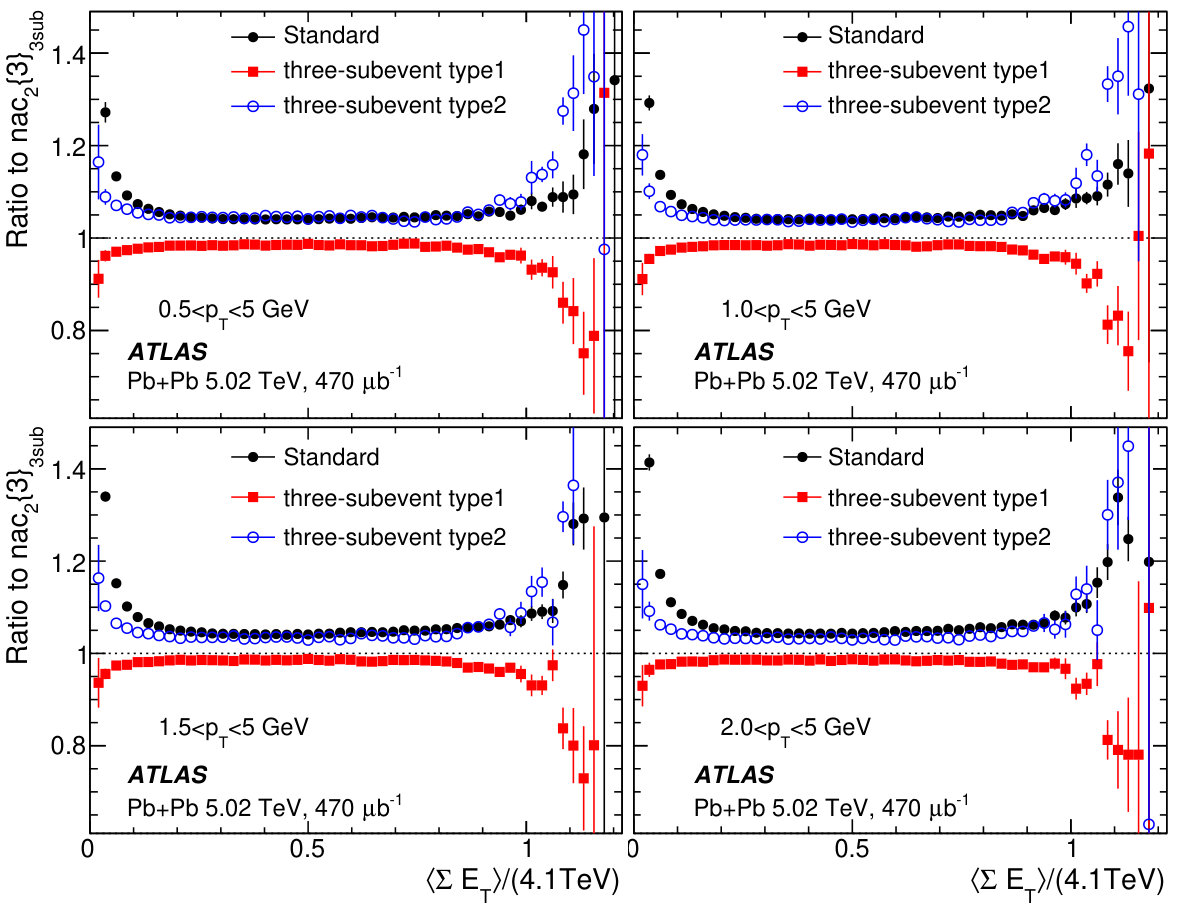 Figure 33
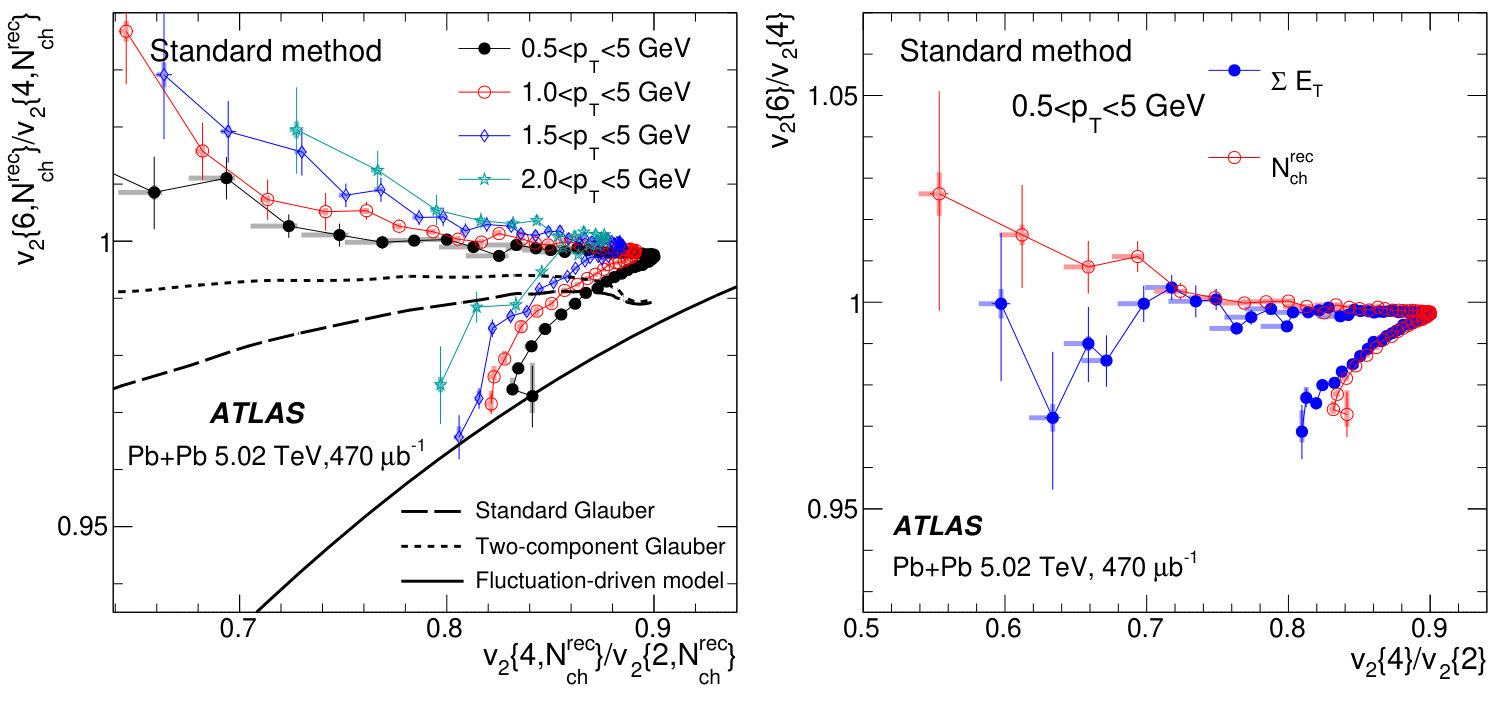 Figure 34
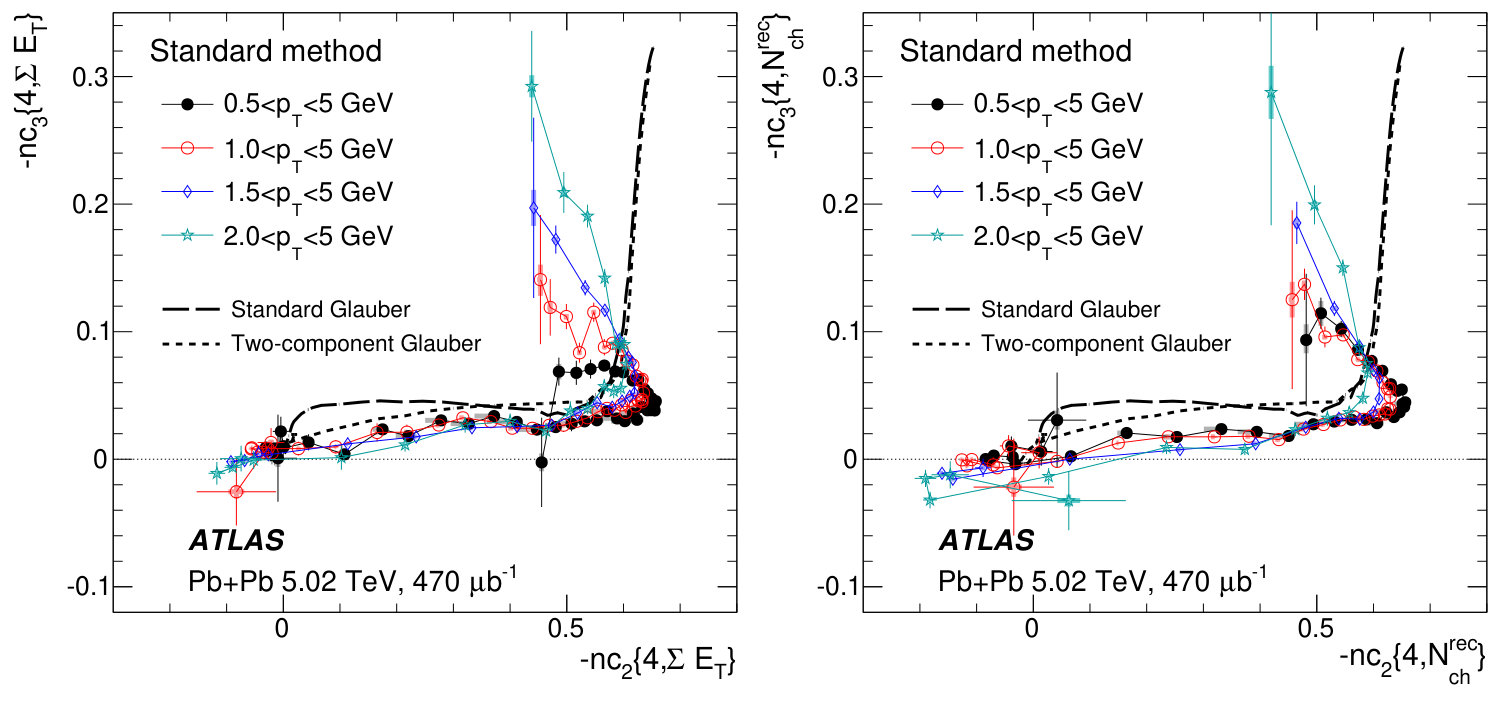 Figure 35
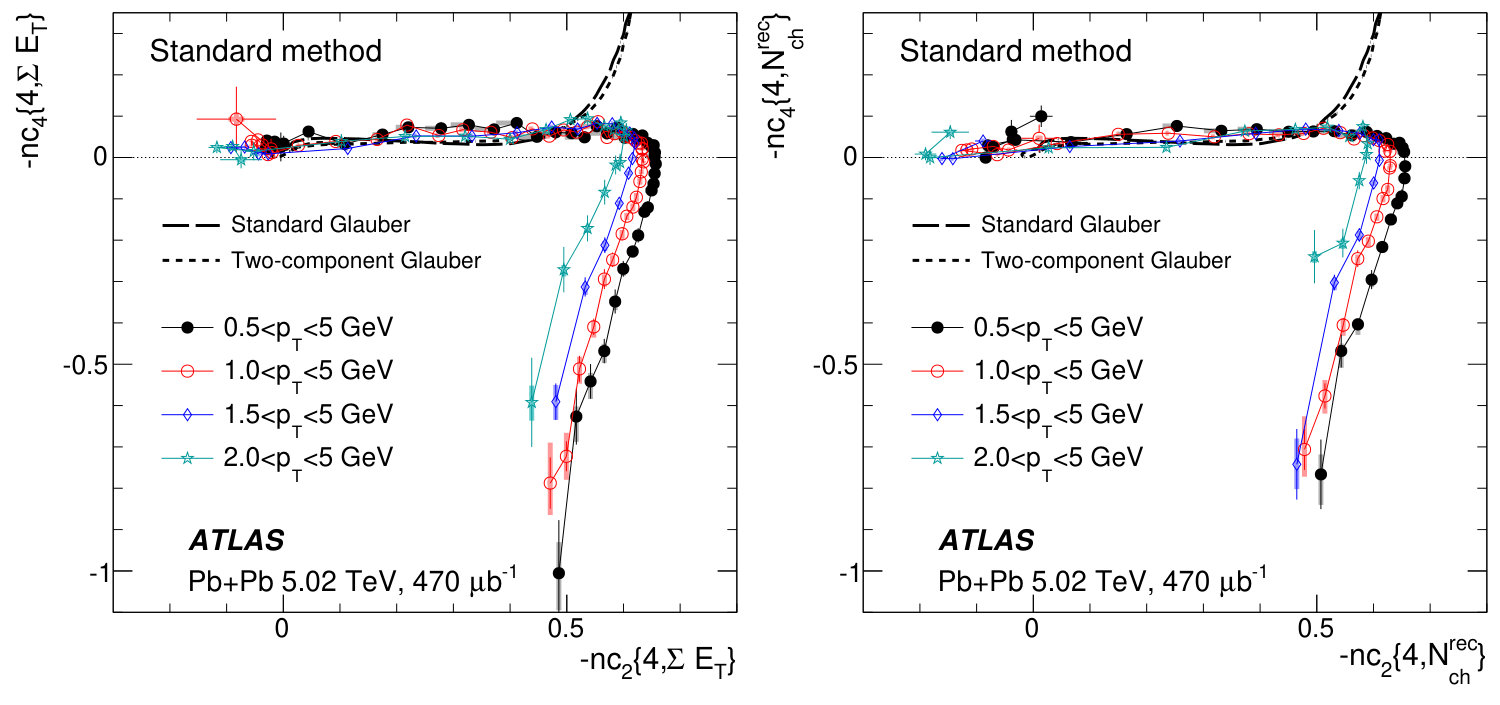 Figure 36
Peer Reviews
No public reviews on file for this paper yet. If you reviewed it on a platform where reviews are public (OpenReview, ICLR, NeurIPS, ICML), you can paste yours below so the community can read it here.
Videos
No videos yet. Explain this paper in a talk, walkthrough, or lecture? Add one.
\AtlasTitle
Fluctuations of anisotropic flow in Pb+Pb collisions at TeV with the ATLAS detector \AtlasAbstractMulti-particle azimuthal cumulants are measured as a function of centrality and transverse momentum using 470 b*-1* of Pb+Pb collisions at TeV with the ATLAS detector at the LHC. These cumulants provide information on the event-by-event fluctuations of harmonic flow coefficients and correlated fluctuations between two harmonics and . For the first time, a non-zero four-particle cumulant is observed for dipolar flow, . The four-particle cumulants for elliptic flow, , and triangular flow, , exhibit a strong centrality dependence and change sign in ultra-central collisions. This sign change is consistent with significant non-Gaussian fluctuations in and . The four-particle cumulant for quadrangular flow, , is found to change sign in mid-central collisions. Correlations between two harmonics are studied with three- and four-particle mixed-harmonic cumulants, which indicate an anti-correlation between and , and a positive correlation between and . These correlations decrease in strength towards central collisions and either approach zero or change sign in ultra-central collisions. To investigate the possible flow fluctuations arising from intrinsic centrality or volume fluctuations, the results are compared between two different event classes used for centrality definitions. In peripheral and mid-central collisions where the cumulant signals are large, only small differences are observed. In ultra-central collisions, the differences are much larger and transverse momentum dependent. These results provide new information to disentangle flow fluctuations from the initial and final states, as well as new insights on the influence of centrality fluctuations.
\AtlasRefCodeHION-2017-09 \PreprintIdNumberCERN-EP-2019-023 \AtlasJournalRefJHEP 01 (2020) 51 \AtlasDOI10.1007/JHEP01(2020)051
\size@chapter\sectfont
Contents
@afterheading@starttoc
toc
1 Introduction
Heavy-ion collisions at RHIC and the LHC create hot, dense matter whose space-time evolution is well described by relativistic viscous hydrodynamics [1, 2, 3]. Owing to strong event-by-event energy density fluctuations in the initial state, the distributions of the final-state particles also fluctuate event by event. These fluctuations produce an effect in the azimuthal angle distribution of the final-state particles, characterized by a Fourier expansion d, where and represent the magnitude and event-plane angle of the -order harmonic flow. These quantities also are conveniently represented by the ‘flow vector’ in each event. The value reflects the hydrodynamic response of the produced medium to the -order initial-state eccentricity vector [4, 5], denoted by . Model calculations show that is approximately proportional to in general for and 3, and for in the case of central collisions [6, 4, 7]. The measurements of and [8, 9, 10, 11, 12, 13, 14, 15] place important constraints on the properties of the medium and on the density fluctuations in the initial state [16, 6, 5, 7, 17, 18].
In order to disentangle the initial- and final-state effects, one needs detailed knowledge of the probability density distribution (or the event-by-event fluctuation) for single harmonics, , and two harmonics, . These distributions are often studied through multi-particle azimuthal correlations within the cumulant framework [19, 20, 21, 22, 23]. In this framework, the moments of the distributions are measured by the -particle cumulants, , for instance, and which are then used to define flow harmonics such as and . The four-particle cumulants and have been measured at RHIC and the LHC [24, 25, 26, 27, 28, 29, 30, 31]. Most models of the initial state of A+A collisions predict a with shape that is close to Gaussian, and these models predict zero or negative values for [32, 33]. The values of and are found to be negative, except that in very central Au+Au collisions at RHIC is positive [27]. Six- and eight-particle cumulants for have also been measured [24, 28, 34].
In the cumulant framework, the distribution is studied using the four-particle ‘symmetric cumulants’, [22], or the three-particle ‘asymmetric cumulants’, [35]. The asymmetric cumulants involve both the magnitude and phase of the flow vectors, and are often referred to as the ‘event-plane correlators’ [13]. The , and values have been measured in A+A collisions [13, 15, 14, 36, 37]. The values of are found to be negative, reflecting an anti-correlation between and , while the positive values of and suggest a positive correlation between and .
Assuming that the scaling between and is exactly linear, then and should be the same as and up to a global rescaling factor. In order to isolate the initial eccentricity fluctuations, it was proposed in Ref. [38] to measure the ratios of two cumulants of different order, for instance nc. Similar cumulant ratios can be constructed for symmetric and asymmetric cumulants such as and . In addition, hydrodynamic model calculations suggest strong -dependent fluctuations of and even in a single event [39, 40]. Such final-state intra-event flow fluctuations may change the shape of or in a -dependent way and can be quantified by comparing cumulant ratios using particles from different ranges.
In heavy-ion collisions, coefficients are calculated for events with similar centrality, defined by the particle multiplicity in a fixed pseudorapidity range, which is also referred to as the reference multiplicity. The event ensemble, selected using a given reference multiplicity, is referred to as a reference event class. Due to fluctuations in the particle production process, the true centrality for events with the same reference multiplicity still fluctuates from event to event. Since the values vary with centrality, the fluctuations of centrality can lead to additional fluctuations of and change the underlying and distributions [41]. Consequently, the cumulants , , and could be affected by the centrality resolution effects that are associated with the definition of the reference event class. Such centrality fluctuations, also known as volume fluctuations, have been shown to contribute significantly to event-by-event fluctuations of conserved quantities, especially in ultra-central collisions [42, 43, 44]. Recently, the centrality fluctuations were found to affect flow fluctuations as indicated by the sign change of measured in ultra-central collisions [41]. A detailed study of , and for different choices of the reference event class helps clarify the meaning of centrality and provides insight into the sources of particle production in heavy-ion collisions. In this paper, two reference event-class definitions are used to study the influence of centrality fluctuations on flow cumulants. The total transverse energy in the forward pseudorapidity range is taken as the default definition and a second definition uses the number of reconstructed charged particles in the mid-rapidity range .
This paper presents a measurement of for and , , , and in Pb+Pb collisions at \mbox{\sqrt{s_{\mathrm{NN}}}}=5.02 TeV with the ATLAS detector at the LHC. The corresponding normalized cumulants nc, cumulant ratios and , as well as normalized mixed-harmonic cumulants and , are calculated in order to shed light on the nature of and . Results are obtained with the standard cumulant method as well as with the recently proposed three-subevent cumulant method [35, 29] in order to quantify the influence of non-flow correlations such as resonance decays and jets. Results using the two reference event-class definitions are compared in order to understand the role of centrality fluctuations and to probe the particle production mechanism which directly influences the size of centrality fluctuations.
The paper is organized as follows. Sections 2 and 3 describe the detector, trigger and datasets, as well as event and track selections. The mathematical framework for the multi-particle cumulants and the list of cumulant observables are provided in Section 4. The correlation analysis and systematic uncertainties are described in Sections 5 and 6, respectively. Section 7 first presents the results for various cumulant observables and then investigates the role of centrality fluctuations by making a detailed comparison of the cumulants calculated using two reference event classes. A summary is given in Section 8.
2 ATLAS detector and trigger
The ATLAS detector [45] provides nearly full solid-angle coverage with tracking detectors, calorimeters, and muon chambers, and is well suited for measurements of multi-particle azimuthal correlations over a large pseudorapidity range.111ATLAS uses a right-handed coordinate system with its origin at the nominal interaction point (IP) in the centre of the detector and the -axis along the beam pipe. The -axis points from the IP to the centre of the LHC ring, and the -axis points upward. Cylindrical coordinates are used in the transverse plane, being the azimuthal angle around the beam pipe. The pseudorapidity is defined in terms of the polar angle as . The measurements are performed using the inner detector (ID), the forward calorimeters (FCal), and the zero-degree calorimeters (ZDC). The ID detects charged particles within using a combination of silicon pixel detectors, silicon microstrip detectors (SCT), and a straw-tube transition-radiation tracker, all immersed in a 2 T axial magnetic field [46]. An additional pixel layer, the ‘insertable B-layer’ [47, 48], was installed during the 2013–2015 shutdown between Run 1 and Run 2, and is used in the present analysis. The FCal consists of three sampling layers, longitudinal in shower depth, and covers . The ZDC, positioned at 140 m from the IP, detects neutrons and photons with .
The ATLAS trigger system [49] consists of a level-1 (L1) trigger implemented using a combination of dedicated electronics and programmable logic, and a high-level trigger (HLT), which uses software algorithms similar to those applied in the offline event reconstruction. Events for this analysis were selected by two types of trigger. The minimum-bias trigger required either a scalar sum, over the whole calorimeter system, of transverse energy greater than 0.05 TeV or the presence of at least one neutron on both sides of the ZDC in coincidence with a track identified by the HLT. This trigger selected 22 of Pb+Pb data. The number of recorded events from very central Pb+Pb collisions was increased by using a dedicated trigger selecting on the at L1 and , the total transverse energy in the FCal, at HLT. The combined trigger selects events with larger than one of the three threshold values: 4.21 TeV, 4.37 TeV and 4.54 TeV. This ultra-central trigger has a very sharp turn-on as a function of and for these thresholds was fully efficient for the 1.3%, 0.5% and 0.1% of events with the highest transverse energy in the FCal. The trigger collected 52 b*-1*, 140 b*-1* and 470 b*-1* of Pb+Pb collisions for the three thresholds, respectively.
In the offline data analysis, events from the minimum-bias and ultra-central triggers are combined as a function of by applying an event-by-event weight calculated as the ratio of the number of minimum-bias events to the total number of events. This procedure ensures that the weighted distribution as a function of for the combined dataset follows the distribution of the minimum-bias events, and the results measured as a function of or centrality (see Section 3) are not biased in their or centrality values.
3 Event and track selection
The analysis uses approximately 470 of \mbox{\sqrt{s_{\mathrm{NN}}}}=5.02 TeV Pb+Pb data collected in 2015. The offline event selection requires a reconstructed primary vertex with a position satisfying mm. A coincidence between the ZDC signals at forward and backward pseudorapidity rejects a variety of background processes such as elastic collisions and non-collision backgrounds, while maintaining high efficiency for inelastic processes. The contribution from events containing more than one inelastic interaction (pile-up) is studied by exploiting the correlation between the transverse energy, , measured in the FCal or the estimated number of neutrons in the ZDC and the number of tracks associated with a primary vertex . Since the distribution of or in events with pile-up is broader than that for the events without pile-up, pile-up events are suppressed by rejecting events with an abnormally large or as a function of . The remaining pile-up contribution after this procedure is estimated to be less than 0.1% in the most central collisions.
The Pb+Pb event centrality [50] is characterized by the deposited in the FCal over the pseudorapidity range . The FCal distribution is divided into a set of centrality intervals. A centrality interval refers to a percentile range, starting at 0% relative to the most central collisions at the largest value. Thus the 0–5% centrality interval, for example, corresponds to the most central 5% of the events. The ultra-central trigger mentioned in Section 2 enhances the number of events in the 0–1.3%, 0–0.5% and 0–0.1% centrality intervals with full efficiency for the three L1 thresholds, respectively. Centrality percentiles are set by using a Monte Carlo Glauber analysis [51, 50] to provide a correspondence between the distribution and the sampling fraction of the total inelastic Pb+Pb cross section.
Charged-particle tracks [52] are reconstructed from hits in the ID and are then used to construct the primary vertices. Tracks are required to have GeV and . They are required to have at least one pixel hit, with the additional requirement of a hit in the first pixel layer when one is expected, and at least six SCT hits. In order to reduce contribution from resonance decays, each track must have transverse and longitudinal impact parameters relative to the primary vertex which satisfy mm and mm, respectively [53].
The efficiency of the track reconstruction and track selection criteria is evaluated using Pb+Pb Monte Carlo events produced with the HIJING event generator [54]. The generated particles in each event are rotated in azimuthal angle according to the procedure described in Ref. [55] in order to produce a harmonic flow that is consistent with the previous ATLAS measurements [53, 10]. The response of the detector is simulated using Geant4 [56, 57] and the resulting events are reconstructed with the same algorithms as are applied to the data. For peripheral collisions, the efficiency ranges from 75% at to about 50% for for charged particles with GeV. The efficiency falls by about 5% for a of 0.5 GeV. The efficiency in central collisions ranges from 71% at to about 40% for for charged particles with GeV, falling by about 8% for a of 0.5 GeV. The rate of falsely reconstructed tracks (‘fake’ tracks) is also estimated and found to be significant only at GeV in central collisions where it ranges from 2% for to 8% at larger . The fake-track rate drops rapidly for higher and for more peripheral collisions. The fake-track rate is accounted for in the tracking efficiency correction following the procedure in Ref. [24].
4 Observables
Both the standard cumulant method [20] and the three-subevent cumulant method [35, 29, 58, 59] are used to calculate the cumulants , and . However, only the standard method is used to calculate the six-particle cumulants .
4.1 Cumulants in the standard method
The standard cumulant method calculates the -particle (,2…) cumulants from the -particle (,2…) azimuthal correlations , which are calculated for each event as [21, 22]
[TABLE]
where ‘’ denotes a single-event average over all pairs, quadruplets or sextuplets, respectively. The averages from Eq. (1) can be expressed in terms of per-particle normalized flow vectors with in each event [21]
[TABLE]
where the sum runs over all particles in the event and is a weight assigned to the particle. This weight is constructed to correct for both detector non-uniformity and tracking inefficiency as explained in Section 5.
The multi-particle cumulants are obtained from the azimuthal correlations using
[TABLE]
where ‘\left\llangle\right\rrangle’ represents a weighted average of over an event ensemble with similar or . In the absence of non-flow correlations, the values are related to the moments of the distribution by the expression given in the last part of each equation chain. In particular, the higher moments of can be obtained by combining the cumulants of different order, for example . If the amplitude of the flow vector does not fluctuate event by event, then Eq. (3) gives a negative and a positive and , which directly measure the true . Flow coefficients from multi-particle cumulants are defined in this analysis as
[TABLE]
[TABLE]
[TABLE]
which extends the standard definition [20] of to regions where and .
If the fluctuation of the event-by-event flow-vector is described in the plane transverse to the beam by a two-dimensional Gaussian function 222Also known as a Bessel-Gaussian function. given by
[TABLE]
then and [12, 60]. The parameter is the width of the Gaussian function and is related to the average geometry of the overlap region. However, if the shape of has significant non-Gaussian fluctuations at large , both and may change sign, giving negative values for and [61].
The four-particle symmetric cumulants and three-particle asymmetric cumulants are related to multi-particle azimuthal correlations for two flow harmonics of different order by [22, 58]
[TABLE]
The first average is over all distinct quadruplets, triplets or pairs in one event to obtain , , and , and the second average is over an event ensemble with the same or to obtain and . In the absence of non-flow correlations, and are related to the correlation between and or between and , respectively:
[TABLE]
Note that is also related to the correlation between and . This analysis measures three types of cumulants defined by Eq.(10): , and .
All the observables discussed above can be similarly defined for eccentricities by replacing and with and respectively. Denoted by , , and , they describe the properties of and . For example, and .
4.2 Cumulants in the subevent method
In the ‘standard’ cumulant method described so far, all the -particle multiplets involved in and are selected using charged tracks that are in the entire ID acceptance of . In order to further suppress the non-flow correlations that typically involve particles emitted within a localized region in , the charged tracks are grouped into three subevents, labelled , and , that each cover a unique range [35]:
[TABLE]
Various subevent cumulants are then constructed by correlating particles between different subevents:
[TABLE]
where
[TABLE]
The statistical precision is enhanced by interchanging the range for subevent with that for subevent or which results in three independent measurements for each of , and . They are averaged to obtain the final result.
It is well known that the values of and calculated using the standard cumulant method have a significant contribution from non-flow effects [60]. Therefore, in this analysis, they are measured using the two-subevent method following the expressions used in previous publications [62]:
[TABLE]
This definition ensures that the non-flow correlations in are greatly reduced by requiring a minimum pseudorapidity gap of 1.67 between subevents and . For -particle cumulants with , the standard method is used as the default since they are less influenced by non-flow correlations, and this assumption is additionally verified with the three-subevent method [35, 63, 64].
4.3 Normalized cumulants and cumulant ratios
Any quantity which is linearly proportional to has the same cumulants, up to a global factor. Therefore the shapes of and can be more directly probed using the ratio of the cumulants [65, 66]:
[TABLE]
where the two-particle cumulants in the denominator of these equations are calculated from subevents and using Eq. (11). If is exactly proportional to , the normalized cumulants defined above would be the same as the normalized cumulants calculated from eccentricities in the initial state, i.e. , and . In practice, final-state effects, such as -dependent fluctuations of and [39, 40], hydrodynamic noise [67] and non-linear mode-mixing between harmonics of different order [4, 68] can break this equality. Therefore, studying the dependence of these normalized cumulants can help in understanding the influence of dynamical effects from the final state.
The and cumulants defined above contain the same information as the previously proposed ratios of to and to [38] given by,
[TABLE]
[TABLE]
The and values still vary smoothly as a function of centrality even if the or values change sign as a function of centrality. However, due to the fractional power in Eq. (20), this is not true for and in the region where the sign changes. For this reason, the results in this paper are often presented using and instead of and .
5 Data analysis
The cumulants are calculated in three steps following examples from Refs. [29, 58] using the standard and subevent methods. Since these steps are the same for , and , they are explained using as an example.
In the first step, the multi-particle correlators are calculated for each event from particles in one of four ranges: GeV, GeV, GeV, and GeV. The upper cutoff is required to reduce the contribution from jet fragmentation. In the second step, the correlators are averaged over an event ensemble, defined as events in either a narrow interval of (0.002 TeV) or a narrow interval of (track bin width is 1) taken as the number of reconstructed charged particles in the range GeV. The values are then calculated separately for these two types of reference event classes, denoted by c_{n}\{2k,\mbox{\Sigma E_{\mathrm{T}}}\} and c_{n}\{2k,\mbox{N_{\mathrm{ch}}^{\mathrm{rec}}}\}, respectively. In order to obtain statistically significant results, in the final step the values from several neighbouring or intervals are combined, weighted by the number of events in each interval. The dependence of the cumulants is studied by simultaneously varying the range for all particles in each -multiplet in the cumulant analysis. This approach is different from previous studies where the range of only one particle in the multiplet is varied [20, 22, 69, 24, 28].
The left panel of Figure 1 shows the correlation between and . The two quantities have an approximately linear correlation, but events with the same have significant fluctuations in and vice versa. Due to these relative fluctuations, the reference event class based on may have centrality fluctuations that differ from those of the reference event class based on , even if both are matched to have the same \left\langle\mbox{\Sigma E_{\mathrm{T}}}\right\rangle or the same \left\langle\mbox{N_{\mathrm{ch}}^{\mathrm{rec}}}\right\rangle.
The correlation between and is studied using events divided into narrow intervals in either or . The mean and root-mean-square values of the () distributions are calculated for each () interval, and the results are shown in the middle and right panels of Figure 1, respectively. A linear relation is observed between \left\langle\mbox{N_{\mathrm{ch}}^{\mathrm{rec}}}\right\rangle and over the full range, while a significant non-linear relation is observed between \left\langle\mbox{\Sigma E_{\mathrm{T}}}\right\rangle and at large . This latter behaviour suggests that, in ultra-central collisions, retains sensitivity to the \left\langle\mbox{N_{\mathrm{ch}}^{\mathrm{rec}}}\right\rangle of the events, while has relatively poorer sensitivity to the \left\langle\mbox{\Sigma E_{\mathrm{T}}}\right\rangle of the events. This implies that the true centrality is more smeared for events with the same than for events with the same .
Since changes with centrality, any centrality fluctuations could lead to additional fluctuation of , and subsequently to a change in the flow cumulants. Indeed, previous ATLAS studies [62, 29, 58] have shown that the values depend on the definition of the reference event class used for averaging. A comparison of the results based on these two reference event classes can shed light on the details of flow fluctuations and how they are affected by centrality fluctuations.
Figure 2 shows the distributions of and obtained from the projections of the two-dimensional correlation shown in the left panel of Figure 1. The inserted panels show the local first-order derivatives of the one-dimensional or distributions in the most central collisions. The derivative for the distribution is relatively independent of up to 4.1 TeV and then decreases and reaches a local minimum at around 4.4 TeV. The derivative for the distribution is mostly flat up to 2800 and then decreases and reaches a local minimum at around 3100. The locations where the derivative starts to depart from a constant are defined as the knee of the or distribution and is given by (\mbox{\Sigma E_{\mathrm{T}}})_{\mathrm{knee}}=4.1 TeV and (\mbox{N_{\mathrm{ch}}^{\mathrm{rec}}})_{\mathrm{knee}}=2800. Events with \mbox{\Sigma E_{\mathrm{T}}}>(\mbox{\Sigma E_{\mathrm{T}}})_{\mathrm{knee}} correspond to the top 1.9% centrality and events with \mbox{N_{\mathrm{ch}}^{\mathrm{rec}}}>(\mbox{N_{\mathrm{ch}}^{\mathrm{rec}}})_{\mathrm{knee}} correspond to top 2.7% centrality when mapped to the equivalent \left\langle\mbox{\Sigma E_{\mathrm{T}}}\right\rangle. The knees mark the locations where multiplicity distributions start to decrease sharply and the underlying centrality fluctuations are expected to deviate significantly from a Gaussian distribution [44, 41]. The knee values are important in discussing the trends of cumulants in ultra-central collisions in Section 7.3.
The particle weights used in Eq. (2) that account for detector inefficiencies and non-uniformity are defined as [62]
[TABLE]
where is the efficiency for reconstructing charged particles from Monte Carlo. The additional weight factor , determined from data, accounts for non-uniformities in the efficiency as a function of in each range. All reconstructed charged particles with GeV are entered into a two-dimensional histogram , and the weight factor is then obtained as , where is the track density averaged over in the given interval. This procedure corrects most of the -dependent non-uniformity that results from track reconstruction [62].
6 Systematic uncertainties
The systematic uncertainties of the measurements presented in this paper are evaluated by varying different aspects of the analysis and comparing , , and with their baseline values. The main sources of systematic uncertainty are track selection, the track reconstruction efficiency, the pile-up contribution, and differences between data and Monte Carlo simulation. The uncertainties are generally small when the absolute values of the cumulants are large. The relative uncertainties are larger in central or very peripheral collisions where the signal is small. The uncertainties also decrease rapidly with increasing , due to a larger flow signal at higher and are typically less than a few percent for GeV. Therefore, the following discussion focuses mainly on the results obtained for charged particles in the GeV range. The systematic uncertainties are also found to be similar between the standard method and the three-subevent method.
The systematic uncertainty associated with track selection is evaluated by applying more restrictive requirements. The requirement on and is changed to be less than mm instead of the nominal value of mm. The numbers of pixel and SCT hits required are also increased, to two and eight respectively, to further reduce the fake-track rates. The uncertainties are less than 2% for , less than 3% for , and , less than 5% for and , and are in the range of 1–5% for , and .
Previous measurements [10] show that the signal has a strong dependence on but a relatively weak dependence on . Therefore, a -dependent uncertainty in the track reconstruction efficiency could affect the measured cumulants through the particle weights in Eqs. (2) and (21). The uncertainty of arises from differences in the detector conditions and known differences in the material between data and simulations. This uncertainty varies between 1% and 4%, depending on and [24]. Its impact on cumulants is evaluated by repeating the analysis with the tracking efficiency varied up and down by its corresponding uncertainty. The impact on cumulants is in the range of 1–5% for , 0.5–12% for and , and in the range of 2–8% for and .
Pile-up events are suppressed by exploiting the correlation, discussed in Section 3, between measured in the FCal and the number of neutrons in the ZDC. In the ultra-central collisions, where the pile-up fraction is the largest, the residual pile-up is estimated to be less than 0.1%. The impact of the pile-up is evaluated by tightening and relaxing pile-up rejection criteria, and the resulting variation is included in the systematic uncertainty. The uncertainty is in the range of 0.1–1% for all cumulants.
The analysis procedure is also validated through Monte Carlo studies by comparing the observables calculated with generated particles with those obtained from reconstructed particles, using the same analysis chain and correction procedure as for data. In the low region, where tracking performance suffers from low efficiency and high fake-track rates, systematic differences are observed between the cumulants calculated at the generator level and at the reconstruction level. These differences are included as part of the systematic uncertainty. They amount to 0.1–3% in mid-central and peripheral collisions and up to 10% in the most central collisions.
The systematic uncertainties from different sources are added in quadrature to determine the total systematic uncertainties. These uncertainties for two-particle cumulants are in the range of 1–5% for , 2–7% for and 4–9% for . For multi-particle cumulants, the total uncertainties are in the range of 8–12% for , 2–7 % for , 1–9% for , 4–15% for and 4–15 % for . For symmetric and asymmetric cumulants, the total uncertainties are in the range of 2–7% for , 2–9% for and 2–7% for . The total systematic uncertainties for the three-subevent cumulant method are comparable. The uncertainties in the flow coefficients are obtained from the total uncertainties of by using Eq. (3).
The uncertainties for normalized cumulants, , , , and , are calculated separately for each source of systematic uncertainty discussed above, and are similar to the baseline results. Most of the systematic uncertainties cancel out in these ratios. In mid-central and peripheral collisions, the total uncertainties are in the range of 1–5% depending on the observables. However, the total uncertainties are larger in ultra-central collisions, reaching as high as 10% for and .
7 Results
The results for various cumulant observables are presented in Sections 7.1 and 7.2. The cumulants are calculated using the reference event class based on and with the procedure discussed in Section 5. The results are presented as a function of centrality calculated from . Section 7.1 discusses the cumulants related to single harmonics: c_{n}\{2k,\mbox{\Sigma E_{\mathrm{T}}}\}, v_{n}\{2k,\mbox{\Sigma E_{\mathrm{T}}}\}, and nc{}_{n}\{2k,\mbox{\Sigma E_{\mathrm{T}}}\}. Section 7.2 presents correlations between two flow harmonics: \mathrm{nsc}_{2,3}\{4,\mbox{\Sigma E_{\mathrm{T}}}\}, \mathrm{nsc}_{2,4}\{4,\mbox{\Sigma E_{\mathrm{T}}}\} and \mathrm{nac}_{2}\{3,\mbox{\Sigma E_{\mathrm{T}}}\}. The results are shown for four ranges: GeV, GeV, GeV, and GeV. The default results are obtained using the standard cumulant method and are compared with those obtained using the three-subevent cumulant method. The comparisons are shown only if significant differences are observed; otherwise, they are included in Appendix B.
Section 7.3 discusses the influence of centrality fluctuations on flow cumulants. Each cumulant observable is calculated using both the -based reference event class and the -based reference event class. The results from the two reference event classes, for example c_{n}\{2k,\mbox{\Sigma E_{\mathrm{T}}}\} and c_{n}\{2k,\mbox{N_{\mathrm{ch}}^{\mathrm{rec}}}\}, are compared as a function of \left\langle\mbox{\Sigma E_{\mathrm{T}}}\right\rangle or \left\langle\mbox{N_{\mathrm{ch}}^{\mathrm{rec}}}\right\rangle. The differences are sensitive to the centrality fluctuations.
While most of the results are presented for , , and , the results for , , and , as well as , and , are not shown explicitly (although some are included in Appendix A). However, they can be obtained directly from , normalized cumulants and normalized mixed-harmonic cumulants according to Eqs. (12)–(20).
7.1 Flow cumulants for
Figure 3 shows the values for for charged particles in several ranges, calculated for the event class based on FCal and then plotted as a function of centrality. The values are obtained from two-particle cumulants with a pseudorapidity gap according to Eq. (11). For all ranges, first increases and then decreases toward central collisions, reflecting the typical centrality dependence behaviour of the eccentricity [60]. The magnitude of also increases strongly with . The centrality and dependences of and are similar, but the tendency to decrease from mid-central toward central collisions is less pronounced.
Figure 4 shows the centrality dependence of normalized four-particle cumulants nc, nc, and nc in four ranges using the standard method (top row) and the three-subevent method (bottom row). The advantage of using nc instead of is that the dependence of , seen in Figure 3, is largely cancelled out and that nc directly reflects the shape of the distributions [12]. Overall, the results based on the three-subevent method behave similarly to those from the standard cumulant method, implying that the influence of non-flow correlations is small. Therefore, the remaining discussion is focused on the standard method in the top row.
Figure 4 shows that the values of nc and nc are negative in most of the centrality range. The values of increase and then decrease toward central collisions, while the values of decrease continuously toward central collisions. These centrality-dependent trends are shown in Refs. [70, 24, 25] to be driven by the centrality dependence of the four-particle cumulants for and , respectively. The normalized cumulants still show some residual dependence on . Namely, the values are smaller for the higher- particles, while the values of are larger for the higher range. Furthermore, the values of nc are also observed to change sign in ultra-central collisions and the pattern of these sign changes also has significant dependence. The observed behaviour of nc in ultra-central collisions is closely related to centrality fluctuations and is discussed further in Section 7.3.
The nc values, as shown in the right panels of Figure 4, are negative in central collisions but change sign around a centrality range of 25–30%. The centrality value at which the sign change occurs shifts towards more peripheral collisions as the of the particles increases. It is well established that in Pb+Pb collisions contains a linear contribution associated with the initial geometry and a mode-mixing contribution from lower-order harmonics due to the non-linear hydrodynamic response [4, 68, 13, 14, 17],
[TABLE]
where the linear component is driven by the corresponding eccentricity in the initial geometry [6], and is a constant. Previous measurements [13, 14] show that the term dominates in central collisions, while the term dominates in more peripheral collisions. Therefore, the sign change of nc could reflect an interplay between these two contributions [71]. In central collisions, nc is dominated by a negative contribution from , while in peripheral collisions nc is dominated by a positive contribution from . The change of the crossing point with suggests that the relative contribution from these two sources is also a function of .
If the value is driven only by , then should have the same shape as . On the other hand, the significant dependence of nc in Figure 4 suggests that the shape of also changes with . Such -dependent behaviour implies that the eccentricity fluctuations in the initial state are not the only source for flow fluctuations. Dynamical fluctuations in the momentum space in the initial or final state may also change .
Figure 5 shows the cumulant ratio, , obtained from the nc data shown in Figure 4 using Eq. (20). This ratio is directly related to the magnitude of the relative fluctuation of the distribution. For the Gaussian fluctuation model given in Eq. (9), it is . A ratio close to one suggests a small flow fluctuation , while a ratio close to zero implies a large fluctuation . The results for imply that flow fluctuations are small relative to , but become larger in the most central collisions. The results for suggest that the relative fluctuation of grows gradually from peripheral to central collisions. The values of are around 0.4–0.5 in the 0–20% centrality range, comparable to slightly larger than the values of . In peripheral collisions, is negative and its magnitude increases and reaches minus one in very peripheral collisions, suggesting a significant departure of from a Gaussian shape. The large statistical uncertainties around the sign-change region is due to the divergence in the first derivative of the function around .
Figure 6 shows the centrality dependence of normalized six-particle cumulants nc, nc and nc. According to Eq. (20), these quantities are directly related to the cumulant ratios . The values of nc are positive over most of the centrality range, but reach zero in ultra-central collisions. The centrality dependence of is very similar to that of in the left panel of Figure 4. The values of nc and nc are much smaller and have larger statistical uncertainties. Therefore, only the results from the two ranges with lower thresholds, which have the best statistical precision, are shown. The values are smaller than 0.005 and 0.01 for nc and nc, which correspond to an upper limit of and , respectively.
From the measured nc and nc, the ratio of the six-particle cumulant to the fourth-particle cumulant, , can be obtained. The results are shown in the left panel of Figure 7. For the Gaussian fluctuation model in Eq. (9), this ratio is expected to be one. The apparent deviation of the ratio from one suggests non-Gaussianity of over a broad centrality range. The results for different ranges are close to each other, but nevertheless show systematic- and centrality-dependent differences. In general, the results from higher are larger in central collisions and smaller in peripheral collisions than those from lower . The middle panel of Figure 7 compares the results for GeV with those obtained from ALICE and CMS Collaborations. Despite slight differences in the selections, good consistency is observed, although the ATLAS results have much smaller statistical and systematic uncertainties.
To further understand the nature of the and its relation to , the right panel of Figure 7 shows directly the correlation between and . Each data point is obtained by combining the information from the left panels of Figures 5 and 7 from the same centrality range. The central region corresponds to the left-most points, while peripheral region corresponds to points near the bottom-middle of the panel. If values are driven by , this correlation should be directly comparable to analogous correlation calculated directly from initial-state elliptic eccentricity: vs . The data are compared to correlations from three initial state models: the standard Glauber model with calculated from the participating nucleons (long-dashed line) [51, 41], a two-component Glauber model with calculated from a combination of participating nucleons and binary nucleon-nucleon collisions (short-dashed line) [51, 41], or a fluctuation-driven model with calculated from random sources (solid line) [32]. These models fail to describe quantitatively the overall correlation pattern, although the two-component Glauber model is closest to the data in central collisions, while the fluctuation-driven model is closest to the data in peripheral collisions.
The multi-particle correlations are also calculated to obtain cumulants for the dipolar flow, . Figure 8 shows the centrality dependence of in several ranges, which is obtained from the reference event class based on . In the hydrodynamic picture, is sensitive to event-by-event fluctuations of the dipolar eccentricity associated with initial-state geometry [6]. This measurement has a large uncertainty because both \left\llangle\{4\}_{1}\right\rrangle and \left\llangle\{2\}_{1}\right\rrangle in Eq. (3) contain a significant contribution from global momentum-conservation effects [72, 10]. This contribution cancels out for but leads to a large statistical uncertainty. A negative for GeV is observed in both the standard and three-subevent cumulant methods, which reflects the event-by-event fluctuations of the dipolar eccentricity.
Previously, ATLAS measured using the two-particle correlation method in Pb+Pb collisions at \mbox{\sqrt{s_{\mathrm{NN}}}}=2.76 TeV where an explicit procedure was employed to subtract the global momentum-conservation effects [10]. The values was observed to be negative at low , change sign at GeV and increase quickly for higher . Therefore, a signal is expected to be larger and easier to measure at higher . Figure 9 shows the values calculated from for the two highest ranges: GeV and GeV. The values increase both with and in more peripheral collisions, and are in the range of 0.02–0.04 for GeV.
7.2 Flow cumulants for
The correlation between flow harmonics of different order is studied using the four-particle normalized symmetric cumulant nsc and nsc, and the three-particle normalized asymmetric cumulant nac. Figure 10 shows the centrality dependence of in several ranges which probes the correlation between the and . The is negative in most of the centrality range, indicating an anti-correlation between the and . This anti-correlation has been observed in previous studies based on the same observable [15] and using an event-shape engineering technique [14]. The strength of the anti-correlation has significant dependence. For higher- particles, the anti-correlation is stronger in peripheral collisions and weaker in central collisions. In the ultra-central collisions, changes sign and becomes positive. This positive correlation is related to centrality fluctuations and is discussed further in Section 7.3. The behaviour of the overall centrality and dependence is also found to be similar between the standard cumulant method and the three-subevent cumulant method. This suggests that these features are not caused by non-flow correlations.
Figure 11 shows the centrality dependence of in several ranges which probes the correlation between and . The value is positive over the entire centrality range, indicating a positive correlation between and . The signal is very small in central collisions but increases rapidly towards peripheral collisions. The correlations are similar among different ranges in central collisions but are slightly weaker for higher- particles in mid-central collisions. This behaviour is also predicted by hydrodynamic models [7, 73]. Compared with the three-subevent method, the values from the standard method have better statistical precision but slightly higher values in peripheral collisions, indicating that the non-flow effects may become significant for events beyond 60% centrality.
Figure 12 shows the centrality dependence of in several ranges which also probes the correlation between and . The value is positive over the entire centrality range. The correlation is weak in the central collisions, increases rapidly as the centrality approaches about 20–30% and then increases slowly toward more peripheral collisions. The correlation patterns for different ranges are similar in central collisions but are slightly weaker for higher- particles in mid-central collisions. Compared with results obtained from the three-subevent method, the results from the standard method are slightly larger in peripheral collisions, indicating that non-flow fluctuations may contribute for events beyond 60% centrality. The similar and centrality dependences for and are related to the non-linear mode-mixing effects between and described by Eq. (22) [65].
7.3 Dependence on reference event class and the role of centrality fluctuations
This section presents the \left\langle\mbox{\Sigma E_{\mathrm{T}}}\right\rangle or \left\langle\mbox{N_{\mathrm{ch}}^{\mathrm{rec}}}\right\rangle dependence of various cumulants for the two reference event classes. Section 5 describes how the role of centrality fluctuations associated with the reference event class used in the calculation of the cumulants can be understood by extracting the results for each observable in narrow ranges of and . These results are presented as a function of \left\langle\mbox{\Sigma E_{\mathrm{T}}}\right\rangle/(\mbox{\Sigma E_{\mathrm{T}}})_{\mathrm{knee}} and \left\langle\mbox{N_{\mathrm{ch}}^{\mathrm{rec}}}\right\rangle/(\mbox{N_{\mathrm{ch}}^{\mathrm{rec}}})_{\mathrm{knee}}, where (\mbox{\Sigma E_{\mathrm{T}}})_{\mathrm{knee}}=4.1 TeV and (\mbox{N_{\mathrm{ch}}^{\mathrm{rec}}})_{\mathrm{knee}}=2800 are the knee values of the and distributions shown in Figure 2. It should be noted that c_{n}\{2k,\mbox{\Sigma E_{\mathrm{T}}}\} (and other observables as well) as a function of \left\langle\mbox{\Sigma E_{\mathrm{T}}}\right\rangle/(\mbox{\Sigma E_{\mathrm{T}}})_{\mathrm{knee}} contains the same information as the centrality dependence of c_{n}\{2k,\mbox{\Sigma E_{\mathrm{T}}}\} shown in two previous sections. However, -axes based on \left\langle\mbox{\Sigma E_{\mathrm{T}}}\right\rangle/(\mbox{\Sigma E_{\mathrm{T}}})_{\mathrm{knee}} and \left\langle\mbox{N_{\mathrm{ch}}^{\mathrm{rec}}}\right\rangle/(\mbox{N_{\mathrm{ch}}^{\mathrm{rec}}})_{\mathrm{knee}} more naturally characterize the size of the overlap region in Pb+Pb collisions and allow a more detailed visualization of the ultra-central region, where the impacts of centrality fluctuations is strongest.
7.3.1 Two-particle cumulants
The top panels of Figure 13 show v_{n}\{2,\mbox{\Sigma E_{\mathrm{T}}}\} as a function of \left\langle\mbox{\Sigma E_{\mathrm{T}}}\right\rangle. The v_{n}\{2,\mbox{\Sigma E_{\mathrm{T}}}\} values are reflecting the same centrality and dependence behaviour already shown in Figure 3. In ultra-central collisions, the v_{n}\{2,\mbox{\Sigma E_{\mathrm{T}}}\} values are nearly constant. Similar trends are also observed for v_{n}\{2,\mbox{N_{\mathrm{ch}}^{\mathrm{rec}}}\} which are shown in the bottom panels of Figure 13 as a function of \left\langle\mbox{N_{\mathrm{ch}}^{\mathrm{rec}}}\right\rangle. These results suggest that the underlying initial geometry, in terms of , is quite similar between the two reference event classes.
In order to quantify differences between the two reference event classes, v_{n}\{2,\mbox{N_{\mathrm{ch}}^{\mathrm{rec}}}\} is mapped to a \left\langle\mbox{\Sigma E_{\mathrm{T}}}\right\rangle dependence and v_{n}\{2,\mbox{\Sigma E_{\mathrm{T}}}\} is mapped to a \left\langle\mbox{N_{\mathrm{ch}}^{\mathrm{rec}}}\right\rangle dependence. The ratio v_{n}\{2,\mbox{N_{\mathrm{ch}}^{\mathrm{rec}}}\}/v_{n}\{2,\mbox{\Sigma E_{\mathrm{T}}}\} is then calculated at a given \left\langle\mbox{\Sigma E_{\mathrm{T}}}\right\rangle or at a given \left\langle\mbox{N_{\mathrm{ch}}^{\mathrm{rec}}}\right\rangle. The top row of Figure 14 shows v_{n}\{2,\mbox{N_{\mathrm{ch}}^{\mathrm{rec}}}\}/v_{n}\{2,\mbox{\Sigma E_{\mathrm{T}}}\} as a function of \left\langle\mbox{\Sigma E_{\mathrm{T}}}\right\rangle. The ratios are very close to unity for and but show a few percent deviation in ultra-central collisions for , i.e v_{2}\{2,\mbox{N_{\mathrm{ch}}^{\mathrm{rec}}}\}>v_{2}\{2,\mbox{\Sigma E_{\mathrm{T}}}\}. This result implies that events in a narrow range have slightly larger than events in a narrow , when the two ensembles have the same \left\langle\mbox{\Sigma E_{\mathrm{T}}}\right\rangle. This would be the case if the centrality resolution of was poorer than the centrality resolution of . Consequently, v_{2}\{2,\mbox{N_{\mathrm{ch}}^{\mathrm{rec}}}\} is expected to contain more events from less central regions, where is larger.
The bottom row of Figure 14 shows the same ratio, v_{n}\{2,\mbox{N_{\mathrm{ch}}^{\mathrm{rec}}}\}/v_{n}\{2,\mbox{\Sigma E_{\mathrm{T}}}\}, but instead as a function of \left\langle\mbox{N_{\mathrm{ch}}^{\mathrm{rec}}}\right\rangle. Compared with the upper row of Figure 14, the ratio for shows a larger deviation from unity which reaches 7% in ultra-central collisions. Smaller, but significant differences are also observed for and in ultra-central collisions. This is probably because v_{n}\{2,\mbox{N_{\mathrm{ch}}^{\mathrm{rec}}}\} has even more contributions from less central events than v_{n}\{2,\mbox{\Sigma E_{\mathrm{T}}}\} when both are matched to the same \left\langle\mbox{N_{\mathrm{ch}}^{\mathrm{rec}}}\right\rangle instead of the same \left\langle\mbox{\Sigma E_{\mathrm{T}}}\right\rangle. This is consistent with the hypothesis in which has poorer centrality resolution and therefore larger centrality fluctuations than , when mapped to the same average event activity in the final state.
Due to the steep decrease of the and distributions in the ultra-central region, the centrality fluctuations and the shapes of the and distributions are expected to exhibit a significant departure from a Gaussian shape [42, 41]. The flow cumulants with four or more particles are more sensitive to a non-Gaussian shape of than the two-particle cumulants. Therefore, they are expected to exhibit larger differences between the two reference event classes. This is the topic of the next section.
7.3.2 Multi-particle cumulants
The top panels of Figure 15 show nc{}_{n}\{4,\mbox{\Sigma E_{\mathrm{T}}}\} as a function of \left\langle\mbox{\Sigma E_{\mathrm{T}}}\right\rangle. This figure contains the same information as the results shown in Figure 4, except for a change in the scale of the -axis which shows the central region in more detail. The nc{}_{2}\{4,\mbox{\Sigma E_{\mathrm{T}}}\} value changes sign for \left\langle\mbox{\Sigma E_{\mathrm{T}}}\right\rangle\gtrsim(\mbox{\Sigma E_{\mathrm{T}}})_{\mathrm{knee}}, where it first increases, reaches a maximum and then decreases to close to zero. The value of the maximum also increases with the of the particles. The nc{}_{3}\{4,\mbox{\Sigma E_{\mathrm{T}}}\} value is negative and approaches zero in ultra-central collisions and only changes sign for the highest range used in this analysis. The \mathrm{nc}_{4}\{4,\mbox{\Sigma E_{\mathrm{T}}}\} value changes from positive in peripheral collisions to negative in mid-central collisions, reaches a minimum and then turns back and approaches zero in the ultra-central collisions.
The bottom panels of Figure 15 show nc{}_{n}\{4,\mbox{N_{\mathrm{ch}}^{\mathrm{rec}}}\} as a function of \left\langle\mbox{N_{\mathrm{ch}}^{\mathrm{rec}}}\right\rangle. The overall \left\langle\mbox{N_{\mathrm{ch}}^{\mathrm{rec}}}\right\rangle and -dependent trends are similar to those in the top panels. However, the maximum of nc{}_{2}\{4,\mbox{N_{\mathrm{ch}}^{\mathrm{rec}}}\} is more than a factor of two larger, and nc{}_{3}\{4,\mbox{N_{\mathrm{ch}}^{\mathrm{rec}}}\} shows a clear sign change for the two highest ranges used in this analysis. Furthermore, nc{}_{4}\{4,\mbox{N_{\mathrm{ch}}^{\mathrm{rec}}}\} shows a local maximum in ultra-central collisions, a feature absent for nc{}_{4}\{4,\mbox{\Sigma E_{\mathrm{T}}}\}.
If is valid, then the shape of should be the same as the shape of and nc [38, 41]. The values can be estimated from a simple Glauber model framework using participating nucleons in the overlap region. The value is found to be always negative when the reference event class is defined using the number of participating nucleons or the impact parameter of the collisions [70]. However, a positive nc is observed in ultra-central collisions when the reference event class is defined using the final-state particle multiplicity [74, 41]. Due to multiplicity smearing, events with the same final-state multiplicity can have different , and therefore different . The positive nc reflects the non-Gaussian shape of due to the smearing in for events with the same final-state multiplicity. The larger values of nc{}_{n}\{4,\mbox{N_{\mathrm{ch}}^{\mathrm{rec}}}\} in comparison with nc{}_{n}\{4,\mbox{\Sigma E_{\mathrm{T}}}\} in ultra-central collisions could be due to stronger multiplicity smearing for nc{}_{n}\{4,\mbox{N_{\mathrm{ch}}^{\mathrm{rec}}}\}. Figure 16 compares nc{}_{n}\{4,\mbox{\Sigma E_{\mathrm{T}}}\} and nc{}_{n}\{4,\mbox{N_{\mathrm{ch}}^{\mathrm{rec}}}\} as a function of \left\langle\mbox{\Sigma E_{\mathrm{T}}}\right\rangle obtained for GeV. In both cases, the normalized cumulants for and show significant differences between the two reference event classes, while the difference is smaller for . The values of nc{}_{n}\{4,\mbox{N_{\mathrm{ch}}^{\mathrm{rec}}}\} for and 3 are significantly larger than those for nc{}_{n}\{4,\mbox{\Sigma E_{\mathrm{T}}}\} over a broad centrality range, not only limited to the ultra-central collisions. This implies that the influence of centrality fluctuations on flow fluctuations is potentially important even in mid-central collisions.
The left two panels of Figure 17 show the six-particle normalized cumulants for obtained using the two reference event classes, nc{}_{2}\{6,\mbox{\Sigma E_{\mathrm{T}}}\} and nc{}_{2}\{6,\mbox{N_{\mathrm{ch}}^{\mathrm{rec}}}\}, respectively. The nc values are positive in most of the centrality range but decrease to zero at around \left\langle\mbox{\Sigma E_{\mathrm{T}}}\right\rangle=(\mbox{\Sigma E_{\mathrm{T}}})_{\mathrm{knee}} or \left\langle\mbox{N_{\mathrm{ch}}^{\mathrm{rec}}}\right\rangle=(\mbox{N_{\mathrm{ch}}^{\mathrm{rec}}})_{\mathrm{knee}} and stay close to zero above that. The right panel of Figure 17 compares nc{}_{2}\{6,\mbox{\Sigma E_{\mathrm{T}}}\} and nc{}_{2}\{6,\mbox{N_{\mathrm{ch}}^{\mathrm{rec}}}\} as a function of \left\langle\mbox{\Sigma E_{\mathrm{T}}}\right\rangle. The values of nc{}_{2}\{6,\mbox{N_{\mathrm{ch}}^{\mathrm{rec}}}\} are smaller than those for nc{}_{2}\{6,\mbox{\Sigma E_{\mathrm{T}}}\} in central and mid-central collisions, suggesting that the centrality fluctuations influence the multi-particle cumulants of over a broad centrality range.
The left panel in Figure 18 shows the cumulant ratio obtained using the event class based on . This panel contains the same information as shown in Figure 7 except for a change in the scale of the -axis made in order to show more detail in the central region. The data show significant differences between the four ranges. The value of is larger for higher and even exceeds one in ultra-central collisions. This behaviour is expected, as and therefore , changes sign in ultra-central collisions. The right panel of Figure 18 shows obtained using the event class based on but then mapped onto \left\langle\mbox{\Sigma E_{\mathrm{T}}}\right\rangle. The differences between the results for the various ranges are larger for most of the centrality range, which again implies that the centrality fluctuations influence the ratios between multi-particle cumulants over a broad centrality range.
7.3.3 Multi-particle mixed-harmonic cumulants
The sensitivity to the choice of reference event class is also studied for the symmetric cumulants and and the asymmetric cumulant . The results obtained with the event class based on are shown in the top row of Figure 19 as a function of \left\langle\mbox{\Sigma E_{\mathrm{T}}}\right\rangle. The \mathrm{nsc}_{2,3}\{4,\mbox{\Sigma E_{\mathrm{T}}}\} values change sign and become positive in ultra-central collisions, and are larger for higher . At the largest \left\langle\mbox{\Sigma E_{\mathrm{T}}}\right\rangle values, \mathrm{nsc}_{2,4}\{4,\mbox{\Sigma E_{\mathrm{T}}}\} reaches zero or even becomes slightly negative while \mathrm{nac}_{2}\{3,\mbox{\Sigma E_{\mathrm{T}}}\} reaches a value of around 0.05. The bottom three panels of Figure 19 show the results obtained with the event class based on for \mathrm{nsc}_{2,3}\{4,\mbox{N_{\mathrm{ch}}^{\mathrm{rec}}}\}, \mathrm{nsc}_{2,4}\{4,\mbox{N_{\mathrm{ch}}^{\mathrm{rec}}}\} and \mathrm{nac}_{2}\{3,\mbox{N_{\mathrm{ch}}^{\mathrm{rec}}}\}, respectively. The positive \mathrm{nsc}_{2,3}\{4,\mbox{N_{\mathrm{ch}}^{\mathrm{rec}}}\} values in the ultra-central region are larger than those for \mathrm{nsc}_{2,3}\{4,\mbox{\Sigma E_{\mathrm{T}}}\}. The trends of the other two cumulants are similar to those obtained with the event class based on .
The direct comparison of , and obtained with the two reference event classes is shown in Figure 20 as a function of \left\langle\mbox{\Sigma E_{\mathrm{T}}}\right\rangle for particles with GeV. The values of \mathrm{nsc}_{2,3}\{4,\mbox{N_{\mathrm{ch}}^{\mathrm{rec}}}\} are larger than those for \mathrm{nsc}_{2,3}\{4,\mbox{\Sigma E_{\mathrm{T}}}\} in central and mid-central collisions. However, the values of the other two cumulants are similar between the two reference event classes.
8 Summary
Measurements of multi-particle cumulants for harmonic flow coefficients are presented using 470 b*-1* of Pb+Pb collisions at TeV with the ATLAS detector at the LHC. The cumulants are designed to provide information about the event-by-event fluctuations of one harmonic, , and two different harmonics, . The distribution is studied using -particle cumulants and normalized cumulants nc, which provide an estimate of the flow coefficients and cumulant ratios and . The distribution is studied using the so-called normalized symmetric cumulant and asymmetric cumulant . These normalized cumulants are directly sensitive to fluctuations of the collision geometry in the initial state. In order to investigate the influence of centrality fluctuations on the flow fluctuations, the cumulants are calculated using events selected with two different reference event-class definitions.
A first observation of a negative , and therefore a positive is presented, which sheds light on the nature of the dipolar-eccentricity fluctuation in the initial-state geometry. The values of are found to be negative in central collisions but change sign around a centrality of 20–25% and increase quickly for more peripheral collisions. This behaviour is consistent with a non-linear contribution to that is proportional to . This non-linear contribution increases for more peripheral collisions and makes a positive contribution to . Over most of the centrality range the and values are found to be negative but change sign towards the most central collisions, suggesting that the and distributions deviate significantly from a Gaussian shape. The cumulant ratios, , , and exhibit a small but significant dependence, suggesting flow fluctuations may also arise directly in the momentum space through the initial-state correlations or final-state interactions.
This paper also presents a detailed measurement of the four-particle symmetric cumulants and and the three-particle asymmetric cumulant . The symmetric cumulants probe the correlation between the magnitudes of two flow harmonics, while the asymmetric cumulant is sensitive to correlations involving both the magnitude and phase of flow. Over most of the centrality range, is found to be negative, reflecting an anti-correlation between and . The and values are found to be positive, and their dependence on centrality is consistent with non-linear mode-mixing effects between and .
In experimental measurements, the flow cumulants are always calculated for events with similar activity. However, for a given activity measure, fluctuations in the particle production process lead to irreducible centrality fluctuations, also known as volume fluctuations. Since changes with centrality, centrality fluctuations lead to an additional fluctuation of , and consequently a change in the flow cumulants. In order to study the influence of centrality fluctuations, cumulant observables are calculated for two reference event classes with different centrality resolution: the total transverse energy in , and number of reconstructed charged particles with and GeV. In ultra-central collisions, the cumulants nc, nc, and are observed to change sign, indicating a significant influence of centrality fluctuations on the multi-particle cumulants of , and . The sign change patterns are more pronounced for the event class based on \left\langle\mbox{N_{\mathrm{ch}}^{\mathrm{rec}}}\right\rangle, consistent with larger centrality fluctuations. The differences between the two event classes are found to extend, with decreasing magnitude, to mid-central collisions, which may suggest that the centrality fluctuations influence the flow fluctuations over a broad centrality range. The sign-change patterns are found to be more pronounced at higher , which may indicate that the flow fluctuations have significant dependence. Such dependence cannot be explained by considering only fluctuations in the initial geometry.
These results provide comprehensive information about the nature of flow fluctuations and the contributions coming from both the initial state and the final state. They also shed light on the influence of centrality fluctuations on flow fluctuations, especially in the ultra-central collisions, which can help to clarify the meaning of centrality and provide insights into the sources of particle production in heavy-ion collisions.
Appendix
Appendix A Flow harmonics from -particle correlations
Figures 21–23 show the flow coefficients from the four-particle cumulants , and , respectively. Figure 24 shows the elliptic flow coefficient from the six-particle cumulant, . They are all obtained from Eq. (8) and are shown as a function of centrality, and . The apparent discontinuities correspond to the locations where the corresponding changes sign.
Appendix B Comparison between standard method and three-subevent method
This appendix shows a comparison between the standard cumulant method and the three-subevent method for various cumulant observables. Figures 25–28 show this comparison for the normalized cumulants nc, nc, and nc calculated with event class based on . Figures 29–31 show the comparisons for , and , respectively. Figures 32 and 33 compares the standard method and different types of subevent methods. As discussed in [58], part of the differences between the standard method and subevent methods can be partially attributed to longitudinal flow decorrelations [75].
Appendix C Correlation of cumulant ratios
This appendix shows the correlation between different cumulant ratios. Figure 34 shows the correlation between and for event class based on ; and this is a complementary plot to the right panel of Figure 7. Figures 35 and 36 show the correlation between normalized cumulants nc and nc, these correlations are compared directly with model calculations based on initial-state eccentricities [51, 32, 41].
Acknowledgements
We thank CERN for the very successful operation of the LHC, as well as the support staff from our institutions without whom ATLAS could not be operated efficiently.
We acknowledge the support of ANPCyT, Argentina; YerPhI, Armenia; ARC, Australia; BMWFW and FWF, Austria; ANAS, Azerbaijan; SSTC, Belarus; CNPq and FAPESP, Brazil; NSERC, NRC and CFI, Canada; CERN; CONICYT, Chile; CAS, MOST and NSFC, China; COLCIENCIAS, Colombia; MSMT CR, MPO CR and VSC CR, Czech Republic; DNRF and DNSRC, Denmark; IN2P3-CNRS, CEA-DRF/IRFU, France; SRNSFG, Georgia; BMBF, HGF, and MPG, Germany; GSRT, Greece; RGC, Hong Kong SAR, China; ISF and Benoziyo Center, Israel; INFN, Italy; MEXT and JSPS, Japan; CNRST, Morocco; NWO, Netherlands; RCN, Norway; MNiSW and NCN, Poland; FCT, Portugal; MNE/IFA, Romania; MES of Russia and NRC KI, Russian Federation; JINR; MESTD, Serbia; MSSR, Slovakia; ARRS and MIZŠ, Slovenia; DST/NRF, South Africa; MINECO, Spain; SRC and Wallenberg Foundation, Sweden; SERI, SNSF and Cantons of Bern and Geneva, Switzerland; MOST, Taiwan; TAEK, Turkey; STFC, United Kingdom; DOE and NSF, United States of America. In addition, individual groups and members have received support from BCKDF, CANARIE, CRC and Compute Canada, Canada; COST, ERC, ERDF, Horizon 2020, and Marie Skłodowska-Curie Actions, European Union; Investissements d’ Avenir Labex and Idex, ANR, France; DFG and AvH Foundation, Germany; Herakleitos, Thales and Aristeia programmes co-financed by EU-ESF and the Greek NSRF, Greece; BSF-NSF and GIF, Israel; CERCA Programme Generalitat de Catalunya, Spain; The Royal Society and Leverhulme Trust, United Kingdom.
The crucial computing support from all WLCG partners is acknowledged gratefully, in particular from CERN, the ATLAS Tier-1 facilities at TRIUMF (Canada), NDGF (Denmark, Norway, Sweden), CC-IN2P3 (France), KIT/GridKA (Germany), INFN-CNAF (Italy), NL-T1 (Netherlands), PIC (Spain), ASGC (Taiwan), RAL (UK) and BNL (USA), the Tier-2 facilities worldwide and large non-WLCG resource providers. Major contributors of computing resources are listed in Ref. [76].
The reference list from the paper itself. Each links out to its DOI / PubMed record.
- 1[1] C. Gale, S. Jeon, and B. Schenke, Hydrodynamic Modeling of Heavy-Ion Collisions , Int. J. Mod. Phys. A 28 (2013) 1340011 , ar Xiv:1301.5893 [nucl-th] . · doi ↗
- 2[2] U. Heinz and R. Snellings, Collective Flow and Viscosity in Relativistic Heavy-ion Collisions , Ann. Rev. Nucl. Part. Sci. 63 (2013) 123 , ar Xiv:1301.2826 [nucl-th] . · doi ↗
- 3[3] W. Busza, K. Rajagopal, and W. van der Schee, Heavy Ion Collisions: The Big Picture, and the Big Questions , Ann. Rev. Nucl. Part. Sci. 68 (2018) 339–376 , ar Xiv:1802.04801 [hep-ph] . · doi ↗
- 4[4] F. G. Gardim, F. Grassi, M. Luzum, and J.-Y. Ollitrault, Mapping the hydrodynamic response to the initial geometry in heavy-ion collisions , Phys. Rev. C 85 (2012) 024908 , ar Xiv:1111.6538 [nucl-th] . · doi ↗
- 5[5] C. Gale, S. Jeon, B. Schenke, P. Tribedy, and R. Venugopalan, Event-by-Event Anisotropic Flow in Heavy-ion Collisions from Combined Yang-Mills and Viscous Fluid Dynamics , Phys. Rev. Lett. 110 (2013) 012302 , ar Xiv:1209.6330 [nucl-th] . · doi ↗
- 6[6] D. Teaney and L. Yan, Triangularity and dipole asymmetry in relativistic heavy ion collisions , Phys. Rev. C 83 (2011) 064904 , ar Xiv:1010.1876 [nucl-th] . · doi ↗
- 7[7] H. Niemi, G. S. Denicol, H. Holopainen, and P. Huovinen, Event-by-event distributions of azimuthal asymmetries in ultrarelativistic heavy-ion collisions , Phys. Rev. C 87 (2013) 054901 , ar Xiv:1212.1008 [nucl-th] . · doi ↗
- 8[8] PHENIX Collaboration, Measurements of Higher-Order Flow Harmonics in Au+Au Collisions at s N N = 200 subscript 𝑠 𝑁 𝑁 200 \sqrt{s_{NN}}=200 Ge V , Phys. Rev. Lett. 107 (2011) 252301 , ar Xiv:1105.3928 [nucl-ex] . · doi ↗