Nonsticky Ice at the Origin of the Uniformly Polarized Submillimeter Emission from the HL Tau Disk
Satoshi Okuzumi, Ryo Tazaki

TL;DR
This study explains the small dust particles in HL Tau's disk by proposing CO2 ice mantles reduce sticking efficiency, aligning models with observations and revealing dust growth limitations near snow lines.
Contribution
The paper introduces a dust evolution model incorporating CO2 ice mantles, explaining the small particle sizes and polarization patterns observed in HL Tau's disk.
Findings
CO2 ice mantles reduce dust particle sticking efficiency.
Models with CO2 ice better match polarimetric observations.
Dust growth is limited between H2O and CO2 snow lines.
Abstract
Recent (sub)millimeter polarimetric observations toward the young star HL Tau have successfully detected polarization emission from its circumstellar disk. The polarization pattern observed at 0.87 mm is uniform and parallel to the disk's minor axis, consistent with the self-scattering of thermal emission by dust particles whose maximum radius is . However, this maximum size is considerably smaller than anticipated from dust evolution models that assume a high sticking efficiency for icy particles. Here, we propose that the unexpectedly small particle size can be explained if CO ice covers the particles in the outer region of the HL Tau disk. CO ice is one of the most major interstellar ices, and laboratory experiments show that it is poorly sticky. Based on dust evolution models accounting for CO ice mantles as well as aggregate sintering and…
Click any figure to enlarge with its caption.
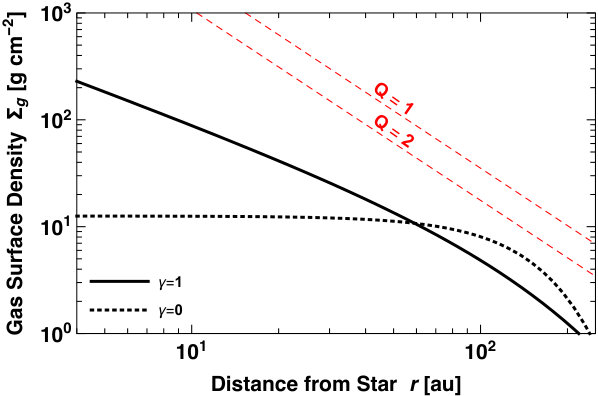 Figure 1
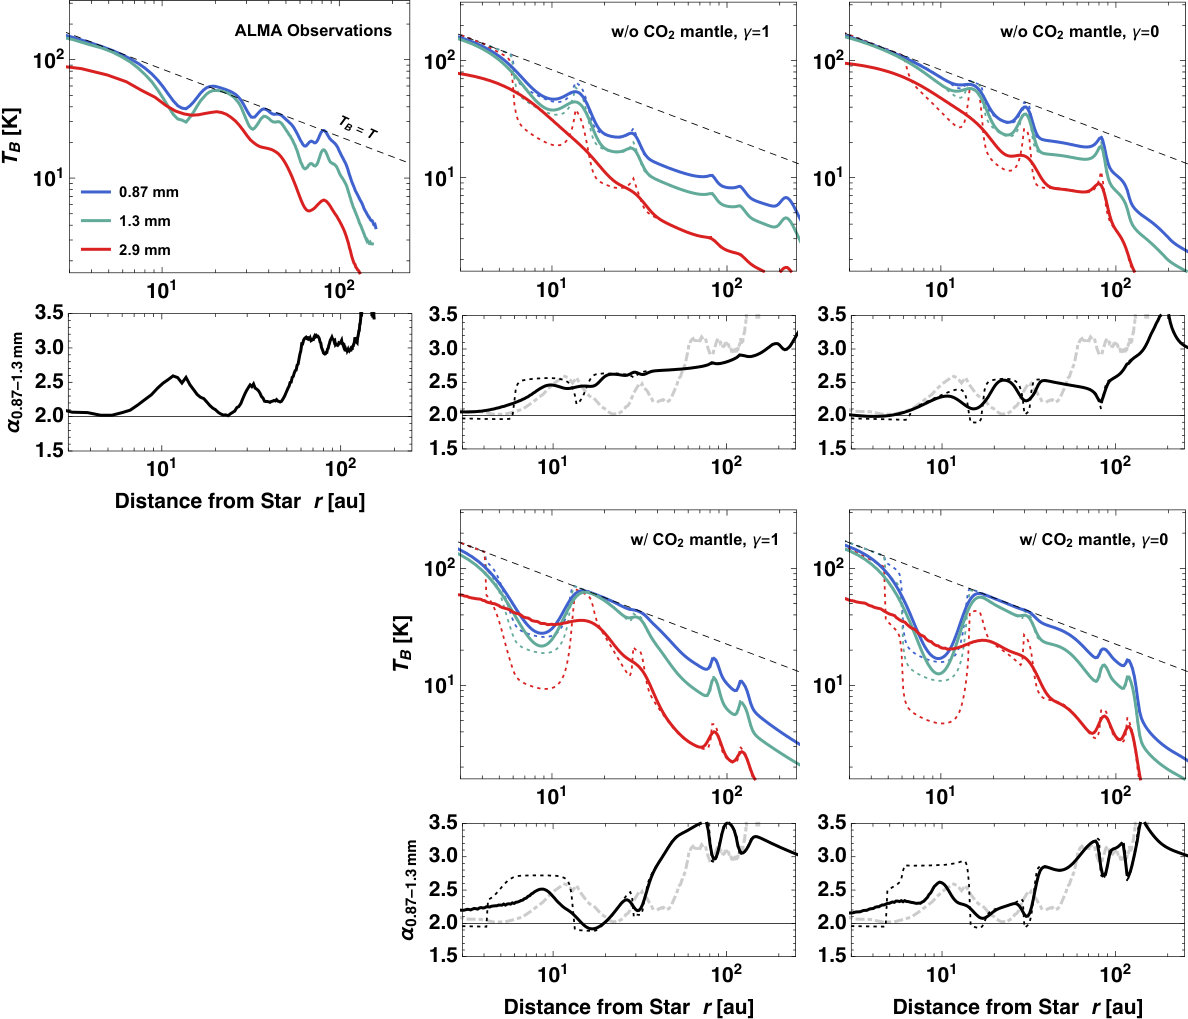 Figure 2
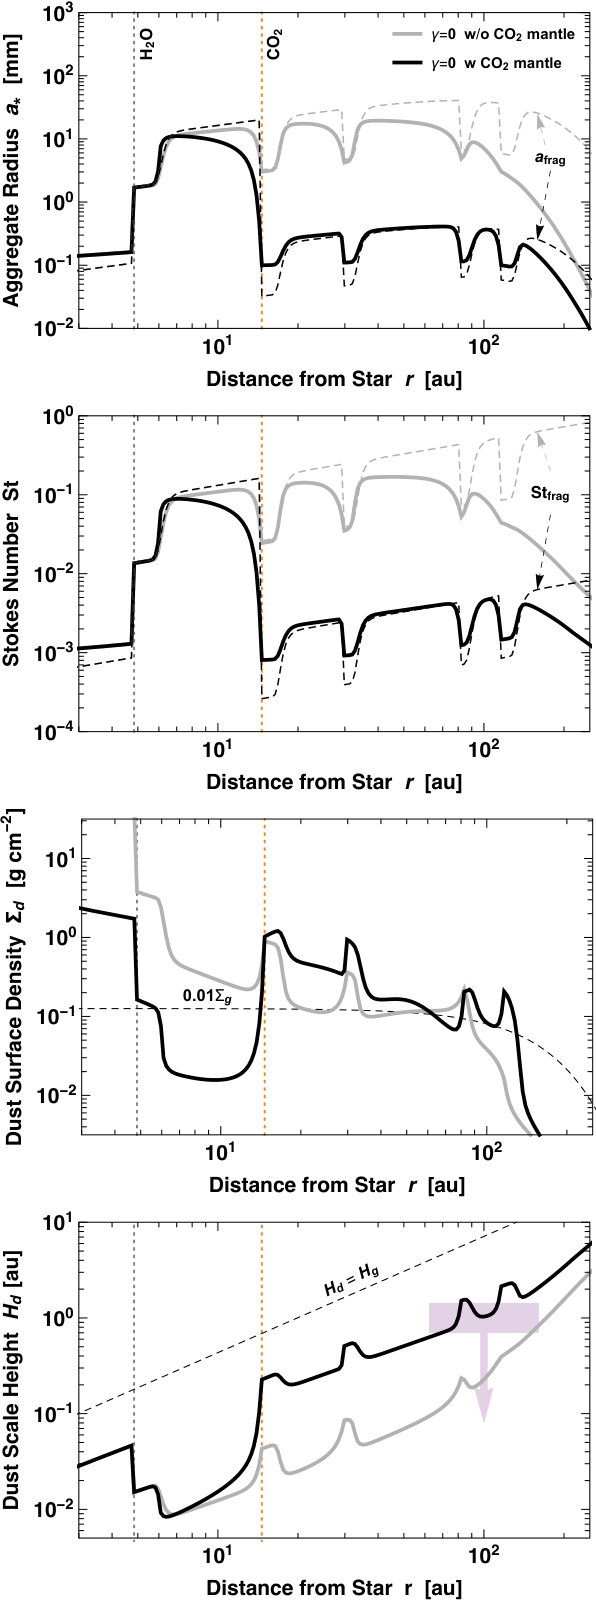 Figure 3
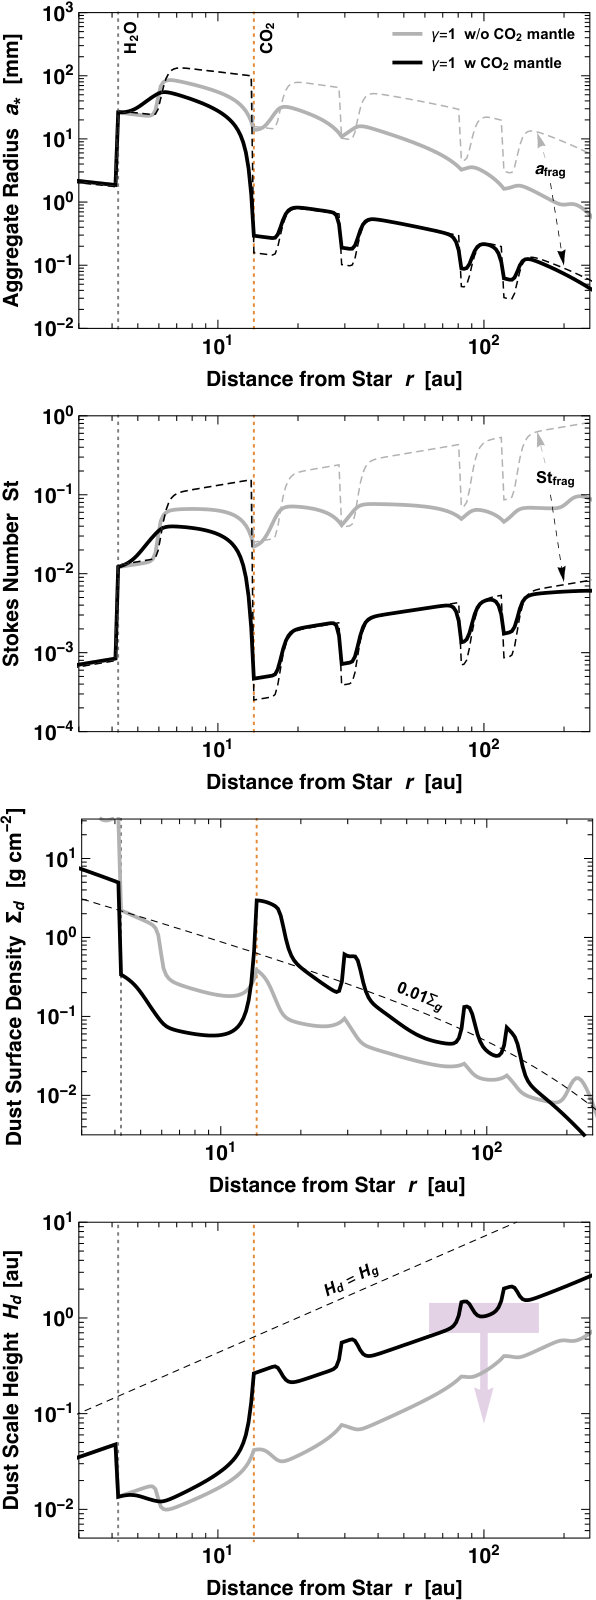 Figure 4
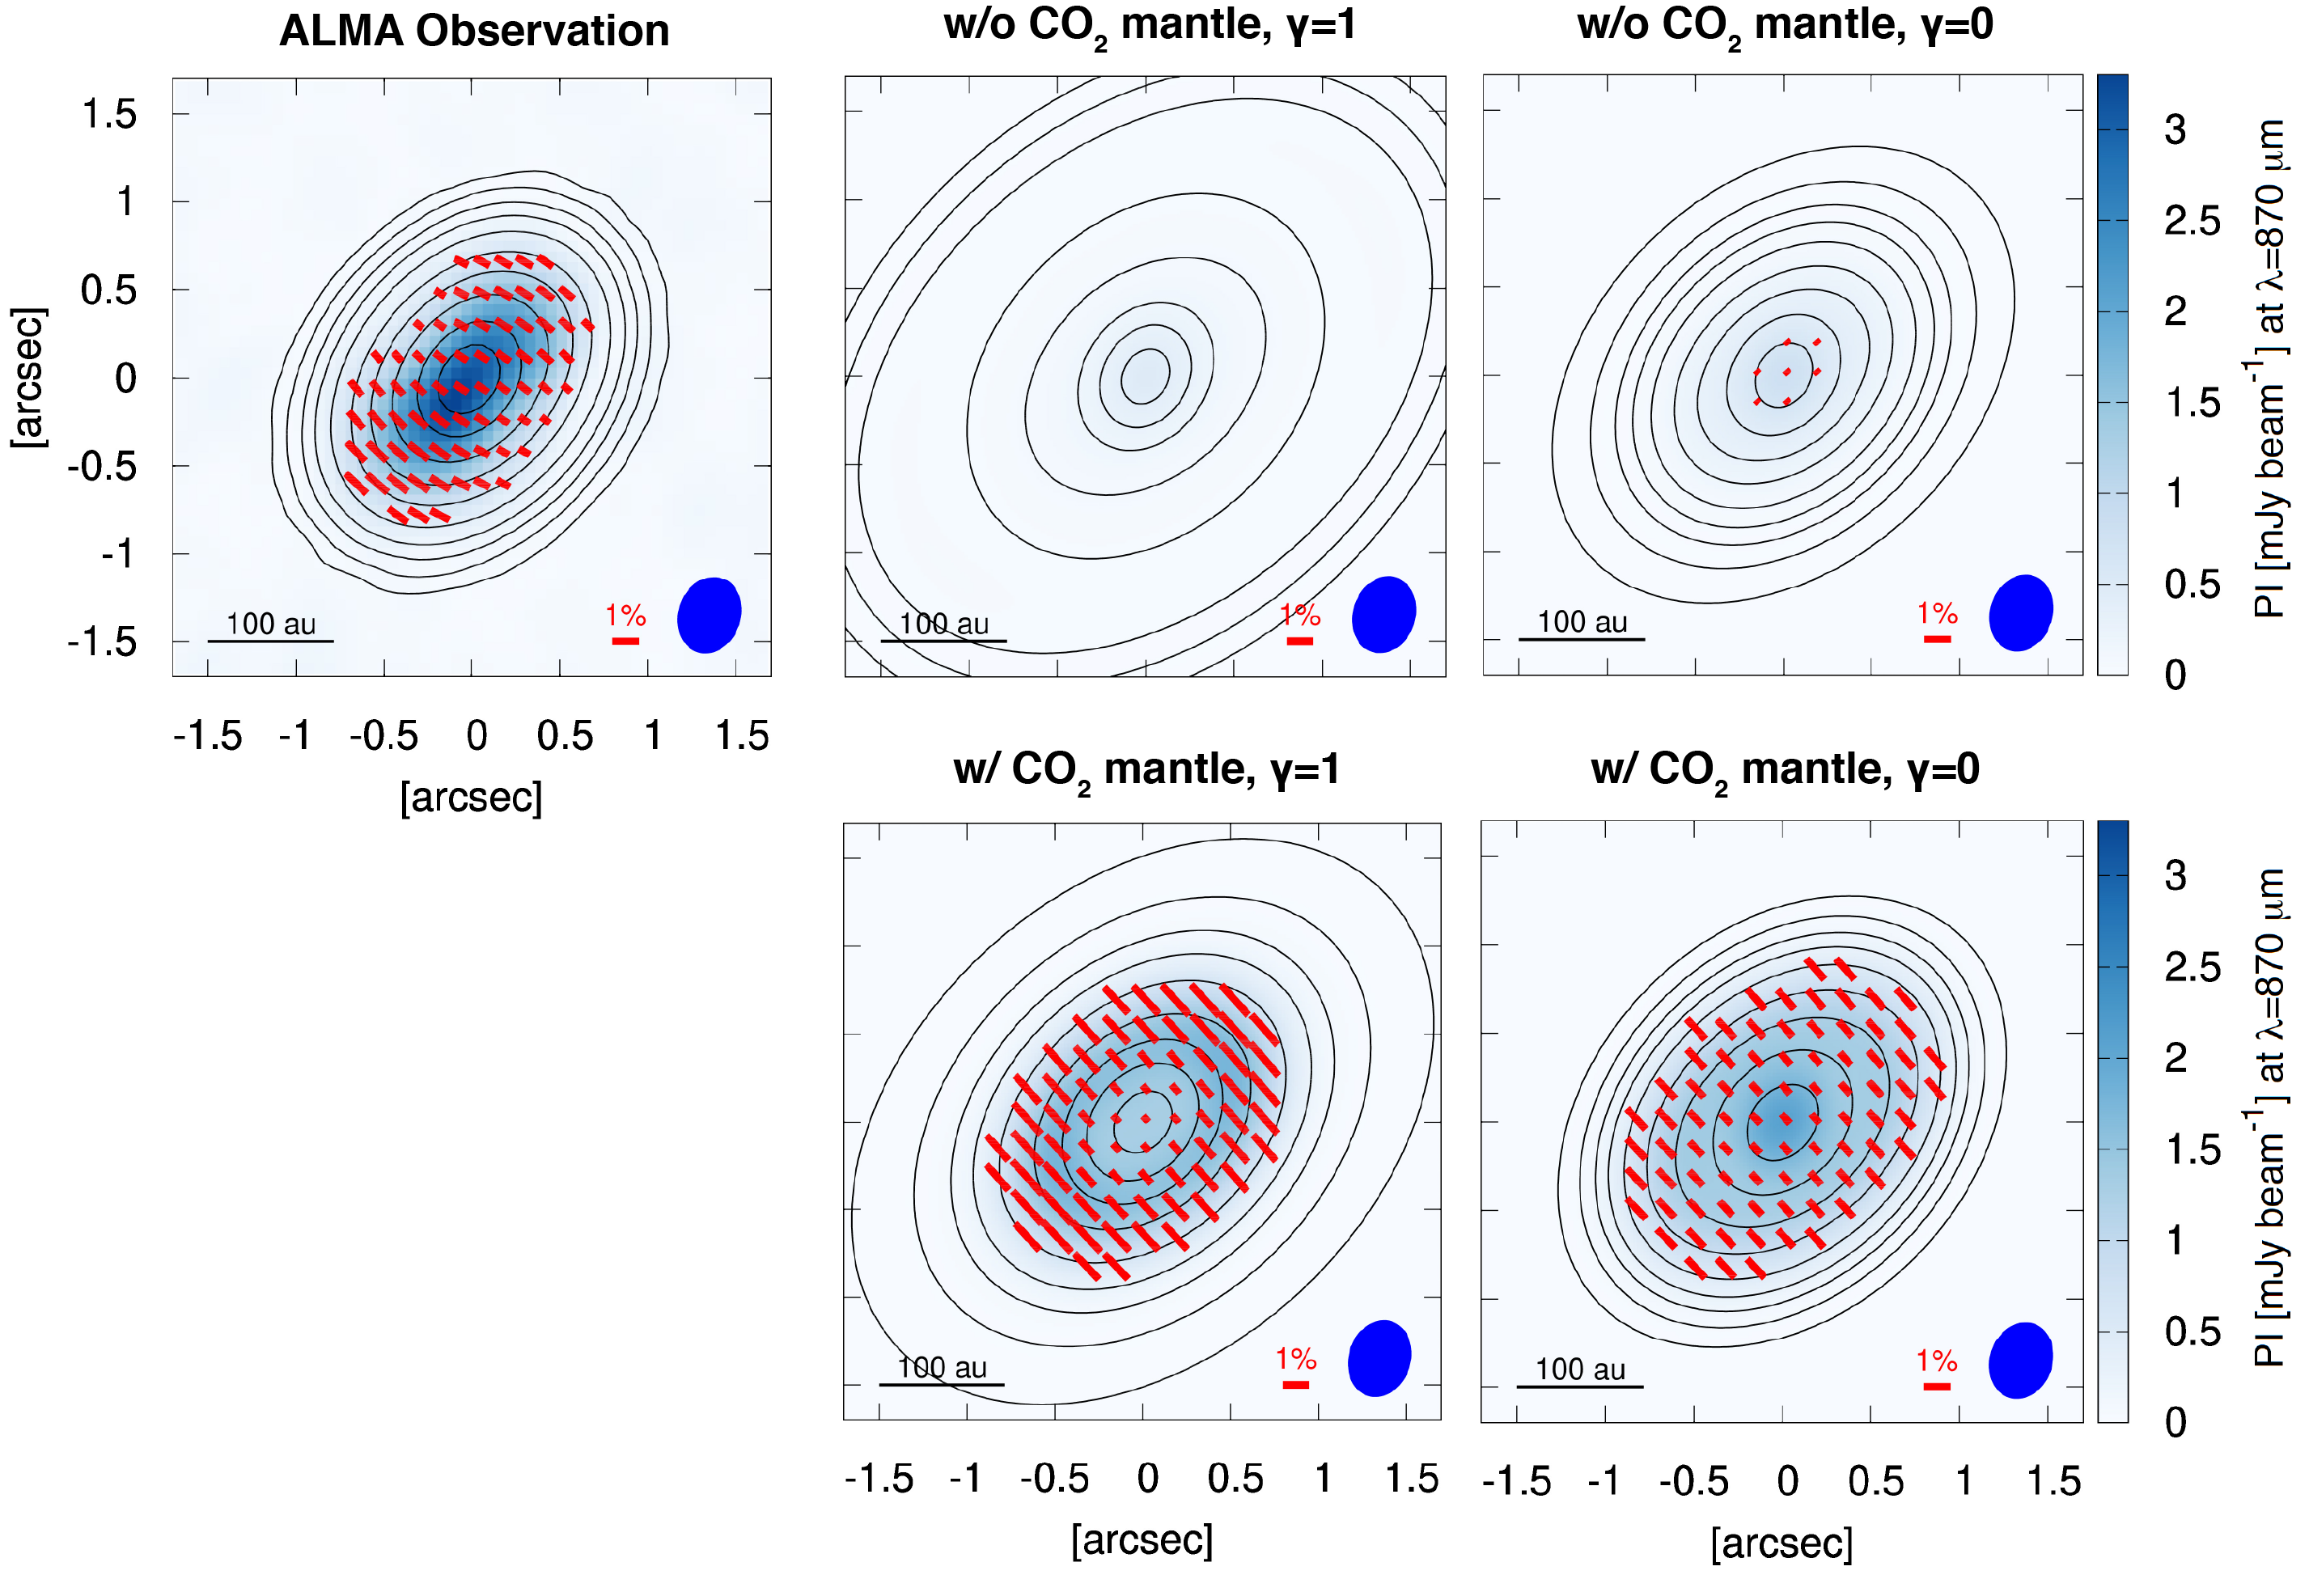 Figure 5
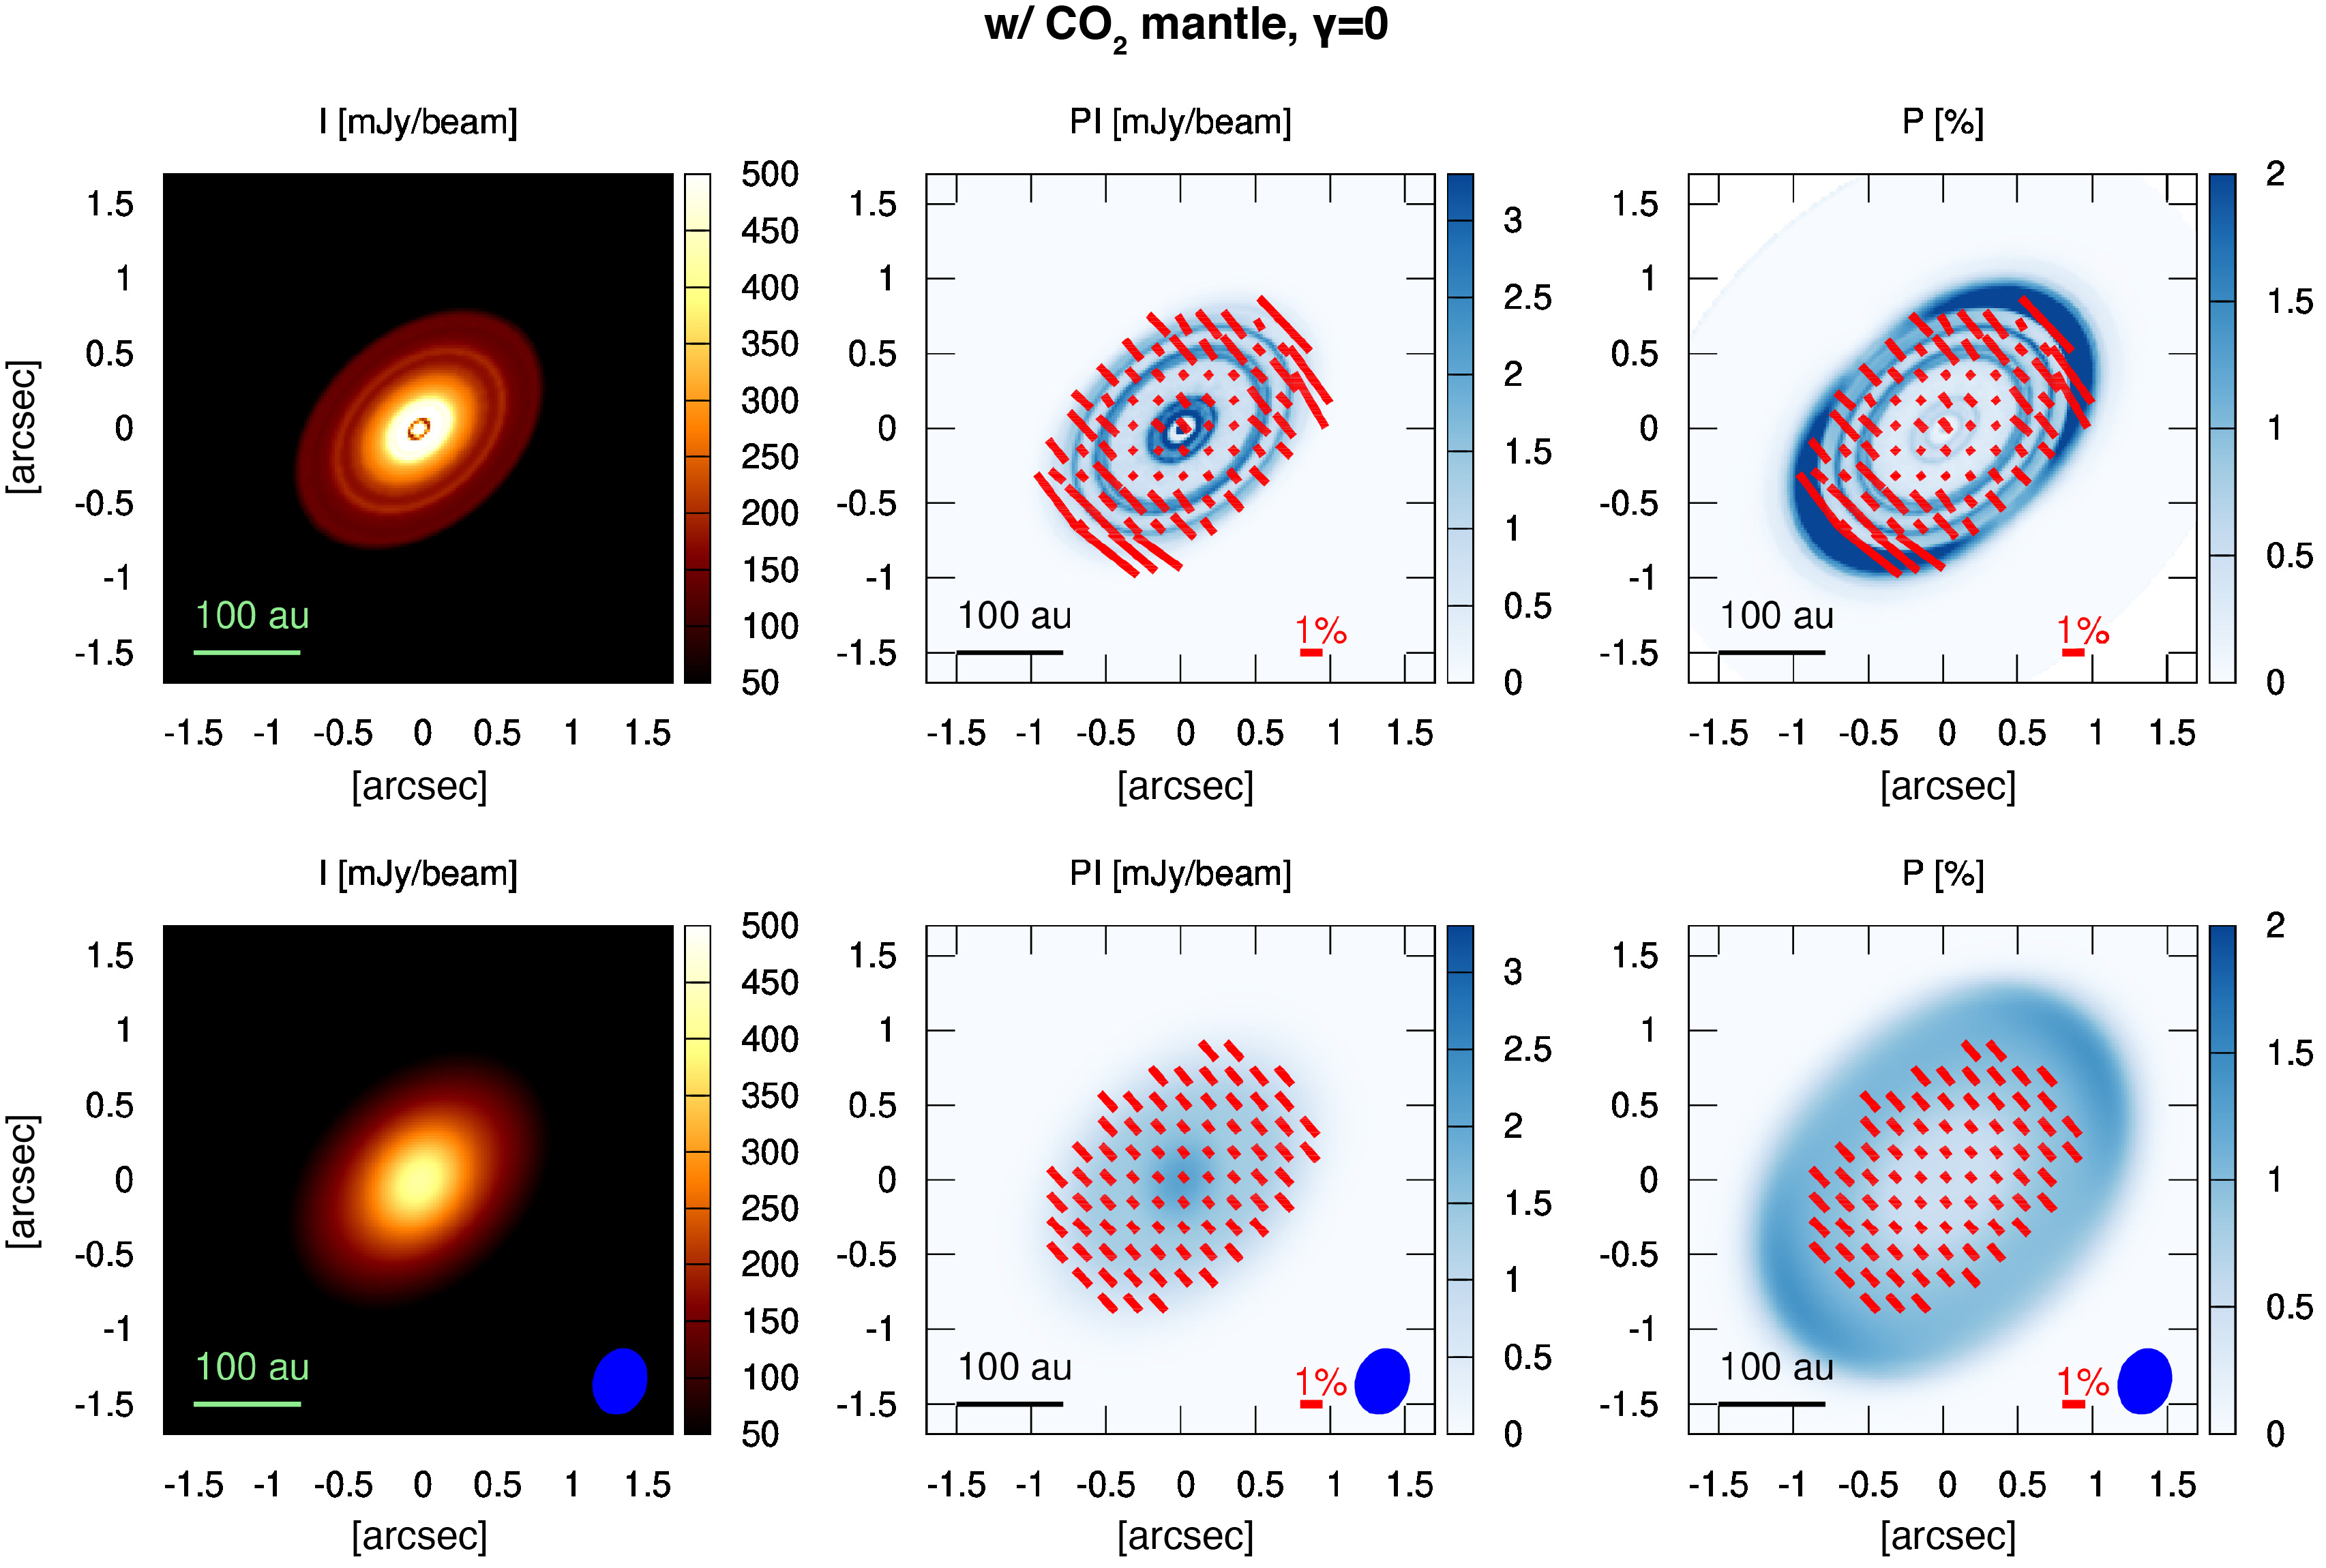 Figure 6
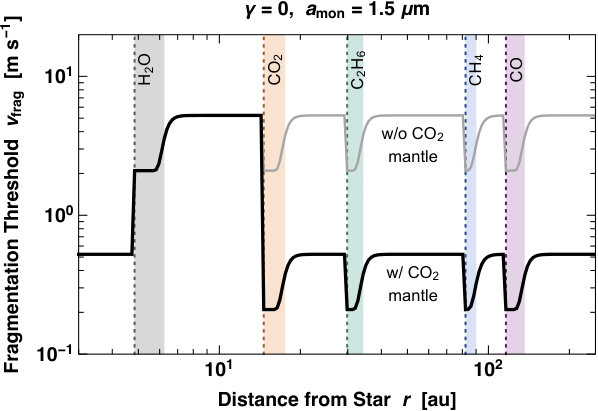 Figure 7
Peer Reviews
No public reviews on file for this paper yet. If you reviewed it on a platform where reviews are public (OpenReview, ICLR, NeurIPS, ICML), you can paste yours below so the community can read it here.
Videos
No videos yet. Explain this paper in a talk, walkthrough, or lecture? Add one.
Nonsticky Ice at the Origin of
the Uniformly Polarized Submillimeter Emission from the HL Tau Disk
Satoshi Okuzumi
Department of Earth and Planetary Sciences, Tokyo Institute of Technology, Meguro, Tokyo 152-8551, Japan
Ryo Tazaki
Astronomical Institute, Tohoku University, Sendai 980-8578, Japan Satoshi Okuzumi [email protected]
Abstract
Recent (sub)millimeter polarimetric observations toward the young star HL Tau have successfully detected polarization emission from its circumstellar disk. The polarization pattern observed at 0.87 mm is uniform and parallel to the disk’s minor axis, consistent with the self-scattering of thermal emission by dust particles whose maximum radius is . However, this maximum size is considerably smaller than anticipated from dust evolution models that assume a high sticking efficiency for icy particles. Here, we propose that the unexpectedly small particle size can be explained if CO2 ice covers the particles in the outer region of the HL Tau disk. CO2 ice is one of the most major interstellar ices, and laboratory experiments show that it is poorly sticky. Based on dust evolution models accounting for CO2 ice mantles as well as aggregate sintering and post-processing radiative transfer, we simulate the polarimetric observation of HL Tau at 0.87 mm. We find that the models with CO2 ice mantles better match the observation. These models also predict that only particles lying between the H2O and CO2 snow lines can grow to millimeter to centimeter sizes, and that their rapid inward drift results in a local dust gap similar to the 10 au gap of the HL Tau disk. We also suggest that the millimeter spectral index for the outer part of the HL Tau disk is largely controlled by the optical thickness of this region and does not necessarily indicate dust growth to millimeter sizes.
dust, extinction — planets and satellites: formation — polarization — protoplanetary disks — stars: individual (HL Tau) — submillimeter: planetary systems
1 Introduction
Dust particles in protoplanetary disks are the ultimate building blocks of planets and also the primary opacity sources in the disks. Understanding how dust grows in the disks is essential to understanding how planet formation begins.
The disk around the young star HL Tau is an interesting object for studying how dust particles in young disks grow and evolve. The HL Tau disk is well known for its spectacular multiple dust rings revealed by ALMA (ALMA Partnership et al., 2015), but is also known for its detectable polarized emission at millimeter and submillimeter wavelengths (Stephens et al., 2014; Kataoka et al., 2017; Stephens et al., 2017). The morphology of the (sub)millimeter polarization patterns of this system is particularly interesting because it is highly wavelength dependent. The polarization map at 0.87 mm shows a uniformly polarized pattern in which the polarization vectors are parallel to the disk’s minor axis (Stephens et al., 2017). In contrast, the map at 3.1 mm shows a completely different polarization pattern with azimuthally aligned polarization vectors (Kataoka et al., 2017). The polarization pattern at 1.3 mm is a mix of the unidirectional and azimuthal patterns (Stephens et al., 2017), indicating that the uniformly polarized emission component diminishes as the wavelength increases from 0.87 mm. There is growing evidence that many other disks also produce uniformly polarized emission at (sub)millimeter wavelengths (Lee et al., 2018; Cox et al., 2018; Sadavoy et al., 2018; Hull et al., 2018; Harris et al., 2018; Bacciotti et al., 2018; Dent et al., 2019; Takahashi et al., 2019).
A likely mechanism for producing such uniformly polarized emission is self-scattering of thermal radiation by dust particles (Kataoka et al. 2015; Yang et al. 2016, see also Sengupta & Krishan 2001; Marley & Sengupta 2011 for a similar polarization mechanism for brown dwarfs and self-luminous planets). This mechanism well explains the wavelength-dependent nature of the uniform polarization for the HL Tau disk because dust particles can only efficiently produce polarized scattered light at a wavelength similar to their own size (Kataoka et al., 2015). Kataoka et al. (2016, 2017) and Stephens et al. (2017) conclude that the uniformly polarized emission seen in the 0.87 and 1.3 mm images of the HL Tau disk are most likely produced by dust particles of radii . Kataoka et al. (2016, 2017) also conclude that millimeter- to centimeter-sized particles should be much less abundant than 100 -sized particles, at least in the region where the polarized emission is observed, because such large particles would produce unpolarized thermal emission with little polarized scattered light at these wavelengths (Kataoka et al., 2016, 2017). The uniform (sub)millimeter polarization seen in other disks also gives a similar constraint on the maximum particle size (see the references listed in the previous paragraph).
The above interpretation for the uniform (sub)millimeter polarization raises the question why the -sized particles are so prevalent. Theoretically, it has long been believed that icy grains in the cold outer part of the disks are highly sticky thanks to strong hydrogen bonding between H2O molecules (e.g., Chokshi et al., 1993; Dominik & Tielens, 1997; Wada et al., 2009, 2013). Dust growth models assuming a high sticking efficiency for icy particles generally predict that the particles should grow to 1 mm or even larger (e.g., Brauer et al., 2008; Birnstiel et al., 2010; Okuzumi et al., 2012; Dra̧żkowska & Dullemond, 2014; Banzatti et al., 2015), thus unable to explain the observed (sub)millimeter polarization of the HL Tau disk with the dust self-scattering mechanism.
To summarize, the uniformly polarized (sub)millimeter emission observed toward the HL Tau disk and many other protoplanetary disks imply that the growth of icy particles in the outer regions of the disks may not be as efficient as previously anticipated. It could merely indicate that the previous dust growth models underestimated the stickiness of water ice. In fact, some recent experiments (Gundlach et al., 2018; Musiolik & Wurm, 2019) question a high adhesion energy for water ice at temperatures below 150–200 K. However, these new experiments are apparently inconsistent with earlier experiments (Gundlach & Blum, 2015) that confirmed efficient sticking of H2O-ice grains at temperatures down to 100 K. Alternatively, it is possible that 100--sized aggregates made of -sized grains are considerably less sticky than the grains themselves. For instance, experiments show that macroscopic aggregates made of silica grains do not stick but bounce off at moderate collision velocities (e.g. Güttler et al., 2010). In principle, aggregates of water ice grains could also experience bouncing at similar velocities if they are compact (Wada et al., 2011). If this is the case, bouncing could limit the growth of icy particles more severely than fragmentation (e.g., Zsom et al., 2010, 2011).
In this study, we explore another possibility that the growth of of -sized particles in the outer part of the disks is suppressed by a nosticky solid material—CO2 ice. Models of interstellar and circumstellar ices suggest that dust grains in dense and cold environments are covered by “apolar” ices of CO2 and CO (e.g., Boogert et al., 2015). Recent laboratory experiments by Musiolik et al. (2016a, b) show that CO2 ice particles are considerably less sticky than H2O particles of the same size, presumably because of the absence of hydrogen bonding. Musiolik et al. (2016a) and Pinilla et al. (2017) point out that the CO2 ice mantles can suppress dust growth in the outer part of protoplanetary disks. Here, we incorporate the low stickiness of CO2 ice mantles into our previous dust evolution model for the HL Tau disk (Okuzumi et al. 2016; henceforth O16), and demonstrate that this effect can indeed cause the uniform submillimeter polarimetric pattern seen in the HL Tau disk.
The structure of this paper is as follows. Section 2 describes our dust evolution model and radiative transfer approach used to synthesize disk polarimetric images. Section 3 presents main results from the dust evolution calculations and compares them with the submillimeter polarimetric observation of the HL Tau disk. Section 4 presents some implications for the ring–gap substructure of the HL Tau disk and also discusses model and parameter dependences. Section 5 presents a summary.
2 Model
To produce synthetic polarimetric images of the HL Tau disk, we perform global dust evolution simulations and post-processing radiative transfer calculations. In this section, we describe the assumptions made in the calculations.
2.1 Gas Disk Model
Following O16, we use simple prescriptions for the gas surface density and temperature profiles of the HL Tau disk. The gas surface density is given by
[TABLE]
where is the distance from the central star, and are the characteristic radius and total mass of the gas disk, respectively, and is a dimensionless number characterizing the radial slope of . Equation (1) is motivated by the similarity solution for evolving viscous accretion disks (Lynden-Bell & Pringle, 1974; Hartmann et al., 1998), although we do not follow the evolution of the gas disk for simplicity. The values of and are taken to be and , respectively.
The actual profile of in the HL Tau disk may not be smooth. Yen et al. (2016) suggest that the distribution of HCO+ in the HL Tau disk has radial gaps, indicating that the profile of (which is dominated by H2) might also have gaps. Hu et al. (2019) show that the combined effects of non-ideal magnetohydrodynamics and dust-dependent ionization chemistry can produce gas gaps at dust gaps. Such complications are not considered in this study.
The value of is taken to be either 1 or 0. The model with corresponds to the classical viscous accretion disk model with a radially constant viscosity- parameter (Hartmann et al., 1998). The model with has a flat surface density profile at . Such a flat profile can be see in some recent simulations of dust accretion including magnetically driven disk winds (Suzuki et al., 2016). In fact, HL Tau is accompanied by strong jets and winds (Klaassen et al., 2016), and the winds may significantly contribute to the evolution of the HL Tau disk (Hasegawa et al., 2017). We note, however, that the global picture of wind-driven accretion is still uncertain and likely depends on the assumed radial distribution of magnetic field strength (Bai, 2016). In any case, the gas distribution of the HL Tau disk is essentially unknown, and therefore it is important to assume different surface density profiles.
The temperature profile is given by
[TABLE]
O16 derived this profile based on the assumption that the bright central part and rings of the HL Tau disk are optically thick at the wavelength of 0.87 mm. Similar midplane temperature profiles were also derived by previous radiative transfer models for the HL Tau disk (Men’shchikov et al., 1999; Kwon et al., 2015).
The disk is assumed to be vertically isothermal, and the vertical distribution of the gas is given by a Gaussian with the scale height , where and are the sound speed and local Keplerian frequency, respectively. The Keplerian frequency depends on the stellar mass, which we take to be following recent mass estimates (Pinte et al., 2016; Yen et al., 2017).
Figure 1 shows the radial distribution of for and 0. Both disk models are gravitationally stable because the Toomre parameter is greater than unity at all .
2.2 Dust Model
We use a modified version of the dust evolution model O16, which was originally developed to explain the multiple dust ring structure of the HL Tau disk.
The model tracks the growth, fragmentation, and radial inward drift of dust aggregates at different distances from the central star. The single-size approach (Sato et al., 2016) is adopted, in which aggregates at each radial distance are characterized by a single radius . Effectively, this approach tracks the evolution of the largest, mass-dominating aggregates, and the characteristic size corresponds to the size of the largest aggregates. Aggregates smaller than the largest are neglected in the calculations of dust evolution, but are taken into account in radiative transfer calculations (see Section 2.3). Each aggregate is composed of icy dust grains whose composition changes with temperature and hence with radial distance. The grain composition controls the stickiness of aggregates, thus central to this study. Aggregate sintering (Sirono 2011; O16) is also included to reproduce multiple dust rings as seen in the high-resolution image of the HL Tau disk (ALMA Partnership et al., 2015).
In the following subsections, we describe the main aspects of our dust model. We refer interested readers to Sections 3 and 4 of O16 for a more detailed description of the model.
2.2.1 Grain and Aggregate Structure
Dust particles are assumed to be initially in the form of micron-sized spherical grains. Each grain consists of a silicate core and ice mantles. The ice mantles are mainly composed of H2O, CO2, and CO with a molar ratio of 1:0.1:0.1. We also consider less abundant CH4 and C2H6 ice but only in modeling aggregate sintering (see below). The initial solid-to-gas mass ratio of the disk is set to 0.01, and the positions of the snow lines for all ices are computed by comparing their equilibrium vapor pressures and partial pressures in the initial state. The equilibrium vapor pressures depend on the sublimation energies, which are typically uncertain to . Following O16, we take the sublimation energies of H2O and C2H6 to be lower than the fiducial values to tune the locations of their snow lines within the uncertainty of the sublimation energies (see Section 3.2 of O16 for details). We do not track the evolution of the snow lines for simplicity.
The core–mantle grains stick together to form aggregates. To distinguish between initial core–mantle grains and their aggregates, we refer to the former as monomers as well as grains. The internal density of the aggregates is taken to be assuming a mean material density of and an aggregate porosity of 50%. In protoplanetary disks, aggregates could have much lower porosities, in particular when they grow through mutual collisions without fragmentation (Suyama et al., 2008; Okuzumi et al., 2012; Kataoka et al., 2013). Some issues with our assumption on the aggregate porosity are discussed in Section 4.3.
The stickiness of grains and their aggregates depends on the materials coating the grain surfaces (Dominik & Tielens, 1997). The structure of the ice mantles is therefore of particular importance in our model. According to the experiments by Musiolik et al. (2016b), pure CO2 ice is poorly sticky, whereas a homogeneous mixture of H2O and CO2 ices with a ratio of 1:0.1 would be almost as sticky as pure H2O ice (see their Figure 6). The original model of O16 did not account for the low stickiness of CO2 ice, and therefore effectively assumed a homogeneous H2O–CO2 ice mantle. In this study, we also consider a two-layer mantle model in which the silicate cores are covered with an H2O-dominated lower mantle and a CO2-dominated upper mantle, similar to models for interstellar ice grains (see, e.g., Figure 10 of Boogert et al., 2015). We refer to the former and latter models as the models with and without CO2 ice mantles, respectively. The H2O and CO2 ice mantles are assumed to sublimate instantaneously at the corresponding snow lines.
2.2.2 Fragmentation Threshold
The grain aggregates are assumed to fragment rather than stick if they collide at velocities greater than a threshold . Bouncing collisions, often observed in laboratory collision experiments for rocky aggregates (e.g., Güttler et al., 2010), are not considered in this study to focus on the role of CO2 mantles. Our future modeling will take in account bouncing collisions.
The value of is primarily determined by the material that covers the grains. For aggregates of H2O-mantled grains, we follow O16 in adopting the following relation between and ,
[TABLE]
This scaling is based on collision simulations for equal-sized H2O ice aggregates (Wada et al., 2009). Equation (3) is consistent with the experiments by Gundlach & Blum (2015), which suggest for aggregates of -sized H2O-ice grains at –200 K (see Figure 9 and 10 of Gundlach & Blum 2015; note that there is a factor of 2 uncertainty in the experimental data shown in these figures). For aggregates of bare silicates, collision simulations by Wada et al. (2009, 2013) show that the sticking threshold is about 10 times higher than that for H2-ice aggregates, so we adopt
[TABLE]
Experiments by Poppe et al. (2000) show a capture velocity of for silica grains of radius ( diameter), consistent with Equation (4) ( for ). For aggregates of CO2-mantled grains, experiments by Musiolik et al. (2016a, b) suggest that the fragmentation threshold is close to that for silicate grain aggregates, and therefore we use Equation (4).
Our model also accounts for a decrease in due to sintering (Sirono, 1999; Sirono & Ueno, 2017). We assume that volatiles included in monomer grains are able to desorb from or diffuse over the grain surface when the temperature is close to their sublimation points. Sintering refers to the phenomenon in which the mobile volatile molecules recondense around the contact points of the monomers and thereby fuse them together (see, e.g., Poppe 2003; Blackford 2007). This phenomenon makes the aggregates harder but less liable to stick upon high-speed collisions (Sirono, 1999; Sirono & Ueno, 2017). Sintering only requires a small amount of materials (see Figure 2 of Sirono & Ueno, 2017) and can in principle occur near the snow lines of various volatiles (Sirono, 2011). As shown by O16, the local reduction of the fragmentation threshold in the sintering zones can lead to the formation of the multiple dust rings observed in the HL Tau disk. Inclusion of this effect thus allows us to model the submillimeter polarization of this disk consistently with its dust ring structure. We emphasize, however, that the goal of this study is to explain the submillimeter polarization pattern, not to reproduce the multiple ring structure in full detail. We also note that sintering may not be the common origin of the dust rings observed in many protoplanetary disks (Long et al., 2018; Huang et al., 2018; van der Marel et al., 2019). In any case, our CO2 mantle model for submillimeter polarization is in principle compatible with other ring formation mechanisms, such as planet–disk interaction (e.g., Dong et al., 2015; Dipierro et al., 2015), gas–dust instabilities (e.g., Takahashi & Inutsuka, 2014), and disk dynamics (e.g., Flock et al., 2015).
Our treatment of sintering is similar to that by O16, but some simplifications are applied given its relatively minor importance in this study. We consider sintering by H2O, CO2, C2H6, CH4, and CO. Unlike O16, we neglect NH3 and H2S because their sintering zones are close to the snow line of of CO2 (in particular, the NH3 sintering zone overlaps with the CO2 snow line). Neglecting these species allows us to highlight the effects of CO2 sublimation on dust growth near the CO2 snow line. The sintering zones are defined by the locations where the timescale of sintering is shorter than the mean collision interval. In these zones, we use the analytic prescription presented in Section 4.4 of O16 to reduce the value of by up to 60% (Sirono & Ueno, 2017). Note that sintering is assumed to further reduce the sticking efficiency of CO2-mantled grain aggregates111 This assumption is based on the finding by Sirono & Ueno (2017) that the sticking threshold for sintered aggregates is determined by the strength of non-sintered contacts, and hence by the material that dominates the monomer surface (CO2 ice in this context). When two sintered aggregates collide, they temporary stick by forming new, non-sintered contact points. However, the aggregates immediately separate if the tensile forces acting between the aggregates are large enough to break the non-sintered contacts. The role of sintering here is to hinder the monomers from dissipating kinetic energy through rolling friction. . For simplicity, the mean collision interval is approximated by (Takeuchi & Lin, 2005; Brauer et al., 2008). This approximation hardly affects the locations of the sintering zones because the sintering timescale is a very strong function of (see Figure 4 of O16).
The fragmentation thresholds as well as the widths of the sintering zones depend on the uncertain monomer size . Our sintering model only requires for the sintering zones to have a non-zero width (O16). Near-infrared polarimetry of HL Tau suggests that the maximum grain sizes in the surrounding envelope is more or less (Lucas et al., 2004; Murakawa et al., 2008), so it may be reasonable to assume . In this study, we adopt for simulations, but also present an analytic estimate of how the simulation results depend on .
In Figure 2, we plot the fragmentation threshold for as a function of for two models with and without CO2 ice mantles.
In the former model, the fragmentation threshold outside the CO2 snow line falls in the range 0.2–. Figure 2 also shows the locations of the snow lines and sintering zones. This locations and widths of the sintering zones are almost the same as those in our previous model La0-tuned (see Figure 18 of O16), which adopted the same sublimation energies and a similar monomer size. Because we neglect NH3 and H2S, our sintering zone at is narrower than in the previous model by a factor of –3.
2.2.3 Dust Evolution
We calculate the time evolution of and the dust surface density as a function of by solving a set of differential equations with advection and collision terms (Equations (7) and (8) of O16). The radial advection is due to the drift motion of dust in the sub-Keplerian rotating gas disk (Whipple, 1972; Adachi et al., 1976; Weidenschilling, 1977). Turbulent diffusion of dust in the radial direction is neglected assuming that turbulence in the HL Tau disk is weak. This assumption may be justified by the observational evidence for a significant level of dust settling in this disk (Pinte et al., 2016). The computational domain is taken to be .
The motion of an aggregate in the gas disk is characterized by its dimensionless Stokes number defined as the product of the aggregate’s stopping time and . We use the expression (e.g., Birnstiel et al., 2010)
[TABLE]
that applies to aggregates smaller than the gas mean free path. In our simulations, all aggregates fulfill this criterion.
The collision velocity of aggregates is induced by their Brownian motion, radial and azimuthal drift (Whipple, 1972; Adachi et al., 1976; Weidenschilling, 1977), and gas turbulence. We assume that collisions with similar-sized aggregates determine the evolution of the largest aggregates, and take the ratio of the Stokes numbers of two colliding aggregates to be 0.5 (Sato et al., 2016). Analytic expressions by Ormel & Cuzzi (2007) are used to calculate the turbulence-induced collision velocity .
The dust scale height is determined by the balance between dust settling and turbulent diffusion (Dubrulle et al., 1995; Youdin & Lithwick, 2007).
As long as , can be written as
[TABLE]
where is the vertical diffusion coefficient for dust normalized by .
The strength of turbulence is parametrized by a dimensionless number , which is defined so that the velocity dispersion of the turbulent gas is given by . The vertical diffusion coefficient for dust is assumed to be based on the results of MHD simulations for disk turbulence (Okuzumi & Hirose, 2011). We assume a low level of turbulence with to allow dust settling (see Section 3.1). In our models, the turbulence parameter only affects the collision velocity and vertical diffusion of dust; the gas surface density and temperature are given independently of by Equations (1) and (2).
2.3 Radiative Transfer
The simulation results are converted into polarimetric images using the 3D Monte Carlo radiative transfer code radmc-3d (Dullemond et al., 2012). The dust opacity is calculated using the method detailed in Section 4.5 of O16. In short, we assume that aggregates at each obeys a power-law size distribution whose total surface density and maximum cut-off size are given by and , respectively. The optical properties of the aggregates are computed using the Mie theory combined with the Maxwell–Garnett mixing rule (Bohren & Huffman, 1983). We use the same effective refractive index for the ice–dust mixture as in O16. For non-fractal aggregates considered in this study, the absorption and scattering opacities obtained from the effective medium approach agree with those from the more rigorous T-matrix method to an accuracy of unless the aggregates are much larger than the wavelength (see Section 4.1.2 of Tazaki & Tanaka, 2018). The inclination angle of the HL Tau disk is assumed to be (ALMA Partnership et al., 2015). Each synthetic polarimetric image is produced using photon packets.
We calculate the thermal emission and scattering by dust particles at the wavelength of 0.87 mm under the prescribed temperature profile given by Equation (2). Because the actual disk temperature profile should depend on the dust distribution in the disk, our current modeling is not self-consistent. Our calculations do not treat radiative transfer of starlight at visible wavelengths, and therefore cannot be used to derive the disk temperature profile. In the particular case of the HL Tau system, modeling the temperature structure with radiative transfer calculations is difficult, if not impossible, because the reflected light from the surrounding envelope can contribute to disk heating (Men’shchikov et al., 1999; Kikuchi et al., 2002).
3 Results
We carried out four simulation runs with and without CO2 ice mantles, and with and 0. In all simulations, the radial profiles of aggregate size and surface density relax into a quasi-steady state in which the mass accretion rate of inward drifting aggregates stays approximately constant in space (e.g., see Figure 8 of O16). This quasi-steady state lasts until the outer part of the disk becomes depleted of dust. We find that the quasi-steady state is sustained over 1–3 Myr and over –0.4 Myr in the models with and without CO2 ice mantles, respectively, where is the time after the start of dust evolution. The CO2 mantles slow down dust depletion because they induce collisional fragmentation: smaller aggregates drift more slowly (Birnstiel et al., 2009). In the following, we select the snapshots at and as the representative results for the models with and without CO2 ice mantles, respectively.
3.1 Radial Profiles of , , and
The top row of Figure 3 shows the radial distribution of the aggregate size in the quasi-steady state from all simulation runs.
We find that the models with CO2 ice mantles successfully produce outside the CO2 snow line. The aggregate size is particularly close to in the sintering zones (see Figure 2) owing to the combined effects of CO2 mantles and sintering.
Without CO2 ice mantles, the aggregates grow beyond 1 mm except interior to the H2O snow line and at the outer edge of the disk.
The results presented here can be understood with simple analytic arguments (Birnstiel et al. 2009, 2012; O16). In the simulations with CO2 ice mantles, the maximum aggregate size is predominantly determined by collisional fragmentation. For intermediate-sized aggregates, the collision velocity is mainly induced by turbulence, and can be approximately written as (Ormel & Cuzzi, 2007).222 Here, the factor assumes that the Stokes number of the smaller aggregate is 0.5 times that of the larger aggregate (O16). For a collision of equal-sized aggregates, the prefactor is (Ormel & Cuzzi, 2007).
Since fragmentation dominates over sticking for , aggregates can only grow to , where
[TABLE]
Using Equation (5), the above expression can be translated into the maximum aggregate size in the fragmentation-limit growth,
[TABLE]
Expressions similar to Equation (7) and (8) can also be found in the literature (e.g., Birnstiel et al., 2009, 2012; Pinilla et al., 2017). Equation (8) implies that the ten-fold decrease in due to the presence of CO2 ice mantles leads to a 100-fold decrease in outside the CO2 snow line. In the first and second rows of Figure 3, we compare and from the simulations with and . For the models with CO2 ice mantles, we find that well explains the aggregate size outside the CO2 snow line. This confirms our expectation that fragmentation induced by CO2 mantle controls the aggregate size in the outer part of the disk.333 Strictly speaking, given by Equation (7) slightly overestimates the maximum Stokes number in the sintering zones. In these regions, is too small for the approximate expression for the turbulence-induced collision velocity to be valid.
Note that falls below when dust growth is limited by radial drift. This can be seen in the models without CO2 ice mantles.
Since , the choice of affects the radial slope of as can be seen in the top panels of Figure 3. In the case of , increases toward the disk center, and therefore considerably deviates from at even with CO2 ice mantles. In contrast, the gas disk model with produces a flatter radial profile for and thus ensures that CO2-mantled grain aggregates have a size of all the way down to the CO2 snow line. As we see in Section 3.2, this difference affects the polarized emission from the inner region of the disk.
The third row of Figure 3 shows the radial profiles of the dust surface density . In a quasi-steady flow of radially drifting aggregates, is inversely proportional to their drift speed, and hence to when (see Equation (25) of O16, ). Thus, fragmentation induced by sintering causes enhancements of in the sintering zones, as already pointed out by O16. The models with CO2 ice mantles predict a deep gap in between the H2O and CO2 snow lines. In these models, the inward mass flux of solids across the CO2 snow line is low because the aggregates outside the snow line are small. This causes a large deficit of solids between the H2O and CO2 snow lines, where the aggregates grow large and drift rapidly thanks to sticky H2O mantles. This gap formation mechanism was also pointed out by Pinilla et al. (2017).
The bottom panels of Figure 3 show the dust scale height as well as the gas scale height . The well-separated dust rings of the HL Tau disk suggest that the dust rings are vertically thin, with at (Pinte et al., 2016). With the choice of , all our models reproduce dust settling at the observed level.
3.2 Synthetic Polarimetric Images
Figure 4 presents the synthetic polarimetric images of the HL Tau disk at wavelength 0.87 mm derived from the four models. The ALMA polarimetric image of the same object at the same wavelength (Stephens et al., 2017) is also shown for comparison. To allow direct comparison with the observation, we have produced the synthetic images by convolved the “raw” images from radiation transfer calculations with an elliptic Gaussian kernel of size , which is equal to the beam size for the corresponding ALMA observation (see Figure 5 for a raw image). At this wavelength, the observed polarimetric map shows a uniform polarization pattern with and , where and are the linear polarized intensity and the degree of linear polarization, respectively. We find that the models with CO2 ice mantles successfully reproduce a similar unidirectional polarization pattern. The mechanism responsible for this polarization is the self-scattering by -sized aggregates. In contrast, the models without CO2 ice mantles predict much weaker polarized emission. This is not surprising since the aggregate size in those models is in much excess of over almost the entire part of the disk.
Of the two models with CO2 ice mantles, the one with better reproduces the observed polarized emission in the central region of . In this region, the polarization degree of the observed emission is spatially uniform to within a factor of . The model with successfully reproduces this feature because the aggregate size in the model stays at all the way down to the CO2 snow line. In contrast, the model with predicts that the aggregate size in the central part well exceeds , and consequently underestimates the polarization degree there. We note, however, the latter model could also provide an equall good match to the observation if , , and are allowed to vary with . For instance, according to Equation (8), a model with and would yield the same radial dependence for as the model with radially constant and .
Given their relatively low angular resolutions (), the previous polarimetric observations of the HL Tau disk were not able to resolve any substructure on 10 au scales, where multiple dust rings are visible (ALMA Partnership et al., 2015). However, for future high-resolution polarimetric observations, it is important to predict how the polarization pattern of the disk would look like on the substructure scale. We show in the first row of Figure 5 the raw maps of , , and for the model with CO2 ice mantles and directly obtained form the radiative transfer calculation. For comparison, we also show in the first row of Figure 5 the maps after Gaussian smoothing with resolution , which are essentially the same as the lower right panel of Figure 3. The bright rings visible in the total intensity map before smoothing (the upper left panel of Figure 5) correspond to the pileups of dust in the sintering zones. The map for (the upper center panel of Figure 5) indicates that these bright rings are also responsible for the dominant fraction of the polarized emission. The emission from the dust rings has high and high , because the aggregate size in the sintering zones is particularly close to . However, this correlation between and is model-dependent; if in the model were smaller by a factor of 3 at all , the degree of polarization would be lower in brighter regions than in darker regions. In any case, future polarimetric observations of the HL Tau disk with higher angular resolutions may test these predictions. More detailed comparisons between our models and the long-baseline observations of HL Tau are presented in Section 4.1.
We also performed radiative transfer calculations at longer wavelengths and confirmed that polarization due to dust self-scattering diminishes at , even with CO2 ice mantles. This is in qualitative agreement with the fact that the uni-directional polarized emission is not observed at (Kataoka et al., 2017). We avoid more quantitative comparisons at these wavelengths because our current models do not include mechanisms that can produce an azimuthal polarization pattern as seen in the observed images.
4 Discussion
4.1 Implications for the Ring–Gap Substructure and Millimeter
Spectral Slope of the HL Tau Disk
So far we have focused on the polarized emission of the HL Tau disk on a scale. It is also interesting to see what our model implies for the ring–gap intensity profiles observed in the earlier ALMA observations (ALMA Partnership et al., 2015). In the center and right panels of Figure 6, we plot the radial profiles of the Planck brightness temperatures at 0.87, 1.3, and 2.9 mm (corresponding to ALMA Bands 7, 6, and 3) obtained from our dust evolution models. Here, the three-band brightness temperatures are calculated using Equations (21) and (22) of O16, which assume slab geometry and neglect scattering. This approach gives an accurate estimate for the total intensities unless the disk is optically thick and has a high albedo (Rybicki & Lightman, 1979; Birnstiel et al., 2018; Liu, 2019; Zhu et al., 2019). This is the case at least in the model with CO2 mantles and , where the aggregates in the optically thick sintering zones have a relatively low albedo of . The solid and dotted lines in Figure 6 show the profiles before and after Gaussian smoothing at the spatial resolutions of the corresponding ALMA observations. The local bumps visible in the model profiles correspond to the dust rings in the sintering zones. For comparison, we also show in the left panel Figure 6 the radial brightness temperature profiles of the HL Tau disk derived from the ALMA high-resolution images (ALMA Partnership et al., 2015). O16 produces these profiles by azimuthally averaging the observed maps (see Section 2.1 of O16 for more details).
The most prominent feature in the intensity profiles caused by CO2 ice mantles is a deep gap at 10 au. Interestingly, the location of this deep gap coincides with that of HL Tau’s innermost gap (ALMA Partnership et al., 2015). In these models, the deep gap is caused by the rapid growth and depletion of H2O-mantled grain aggregates between the H2O and CO2 snow lines as described in Section 3.1.
The models with CO2 ice mantles generally predict that the 10 au gap is the deepest among the multiple dust rings, in qualitative agreement with the ALMA images of the HL Tau disk. However, these models overestimate the depth of the 10 au gap, implying that further tuning of model parameters is needed to achieve a more quantitative match. Sintering also produces a 10 au gap O16 as seen in the models without CO2 ice mantles. However, this sintering-induced is substantially shallower than the 10 au gap in the models with CO2 ice mantles.
Our results also offer an important interpretation for the millimeter spectral slope of the HL Tau disk. We define the spectral index at 0.87–1.3 mm (i.e., between ALMA Bands 7 and 6) as , where and are the intensities and frequencies at 1.3 and 0.87 mm. The radial profiles of from the observations and models are shown in Figure 6 (for comparison, the observed profile is also overplotted in the panels for the model profiles). The profile from the observations shows –2.5 at and farther out (see also Zhang et al., 2015). A millimeter spectral index of –3 is commonly attributed either to dust growth to millimeter sizes, or to a moderately large optically thickness (e.g., Ricci et al., 2010). The model with CO2 ice mantles and suggests that the latter interpretation applies to the HL Tau disk, except at the 10 au gap. In fact, this model predicts at but still successfully reproduces in this outer part (optically thin emission from particles would have ). Only the spectral index of the optically thin emission from the 10 au gap reflects the presence of mm-sized aggregates between the H2O and CO2 snow lines.
Our interpretation is consistent with the optical depth estimates by Carrasco-González et al. (2016), who suggest the HL Tau disk is marginally optically thick (with optical depth –3) at and 1.3 mm (see their Figure 3).
4.2 Parameter Dependence
We have demonstrated that the low stickiness of CO2-mantled grain aggregates reasonably explains the abundant presence of -sized particles in disks. However, it is clear from Equation (8) that the maximum particle size depends not only on the sticking threshold but also on other parameters such as turbulence strength and aggregate porosity. In this subsection, we show that a low fragmentation threshold is still the most likely explanation for -sized particles in the particular case of the HL Tau disk.
A key constraint comes from the evidence for dust settling in the HL Tau disk. The distinct morphology of the observed dust rings suggests at in this disk (Pinte et al., 2016), which translates into in our disk model (see also Section 3.1). This can be used to constrain turbulence strength . From Equation (6) with , one has for . When dust growth is limited by turbulence-induced fragmentation, is given by Equation (7), and we obtain
[TABLE]
Equation (9) can in turn be used to eliminate from the maximum aggregate size given by Equation (8). The result is
[TABLE]
The weak temperature dependence of the right-hand side of Equation (10) is negligible as long as we consider 10–100 au.
Equation (10) indicates that any model reproducing the two observational constraints and must satisfy the condition
[TABLE]
Any realistic dust aggregate has –3, and the high millimeter flux from the HL Tau disk points to at –100 au unless the dust-to-gas mass ratio is well above 0.01 (e.g., Kwon et al. 2011, 2015; Pinte et al. 2016; see also O16). Therefore, we conclude that only fragmentation thresholds as low as – can explain and simultaneously.
The requirement – translates into monomers sizes of for CO2-mantled grain aggregates and for H2O ice aggregates. The former is more consistent with the maximum grain size for the HL Tau envelope inferred from near-infrared polarimetry (Lucas et al., 2004; Murakawa et al., 2008), suggesting that CO2-mantles offer a more reasonable explanation for the origin of 100 -sized aggregates.
4.3 Are Aggregates Compact or Fluffy?
We have assumed that the aggregates in the HL Tau disk have a moderately high filling factor of 50%. If the aggregates are fluffy, i.e., , Equation (11) demands an even lower value of . The question is then whether such a low fragmentation threshold is realistic for fluffy aggregates. Although aggregate collision simulations do show a trend of decreasing with increasing aggregate porosity (Wada et al., 2009; Gunkelmann et al., 2016), it is unclear at the present whether this trend can compensate for the decrease of in Equation (11).
A more fundamental question about fluffy aggregates is whether they can produce strongly polarized scattered light. The effective medium approach adopted in this study is inapplicable to fluffy aggregates, in particular to fractal aggregates of fractal dimension (Tazaki & Tanaka, 2018). For such aggregates, a more accurate scattering theory, such as the modified mean field theory (Tazaki et al., 2016, 2019; Tazaki & Tanaka, 2018), should be used to obtain optical properties. We leave this extension for future publication.444 Our preliminary calculations using the modified mean field theory seem to show that polarized intensity due to self-scattering diminishes as the aggregate porosity increases (Tazaki et al., in prep.).
From mechanical point of view, it is also unclear how icy aggregates in the disk could become compact. Okuzumi et al. (2012) and Kataoka et al. (2013) showed that neither aerodynamical nor collisional compression is efficient enough to compress icy aggregates in protoplanetary disks to a filling factor of . However, these previous studies assumed that the ice aggregates are sticky and grow without fragmentation. It is yet to be explored how the porosity of aggregates evolves when they experience highly destructive collisions and subsequently reaccrete a large amount of small fragments. Poorly sticky aggregates may also lose a high porosity through bouncing collisions (Weidling et al., 2009; Zsom et al., 2011).
5 Conclusions
We have demonstrated that aggregates with a low sticking efficiency can reasonably produce the uniformly polarized emission seen in the HL Tau disk. In our scenario, the growth of the icy aggregates is primarily limited by the mantles of nonsticky CO2 ice, and to a less extent by aggregate sintering. Dust aggregates still can grow beyond 1 mm between the H2O and CO2 snow lines, where CO2 ice mantles are absent and the sticky H2O mantle facilitates dust growth. The efficient growth and subsequent rapid infall of the dust in this region might explain the 10 au dust gap in the HL Tau disk. The models with CO2 ice mantles also suggest that the low spectral index of the HL Tau disk at 0.87–1.3 mm primarily reflects the optical thickness at this wavelength, not the size of opacity-dominating particles, except in the 10 au gap.
If our interpretation is correct, the polarimetric observation of HL Tau may provide the first evidence for the dust fragmentation barrier induced by CO2 ice (Musiolik et al., 2016a, b; Pinilla et al., 2017). The CO2-induced fragmentation barrier may also solve the long-standing problem of dust retention in protoplanetary disks over several million years, which requires substantial particle fragmentation to slow down their radial infall (Dullemond & Dominik, 2005; Birnstiel et al., 2009). Future applications of our model to other disks with a similar (sub)millimeter polarization pattern will enable us to better understand the role of CO2 ice on dust evolution in protoplanetary disks.
Although we have assumed that H2O ice is stickier than CO2 ice, recent laboratory experiments suggest that H2O ice might also be poorly sticky at low temperatures (Gundlach et al., 2018; Musiolik & Wurm, 2019). The two scenarios would equally well reproduce the uniformly polarized submillimeter emission from many protoplanetary disk, but the latter scenario would predict no deep dust gap between the H2O and CO2 snow lines. Therefore, the two scenarios could be tested by observing the dust continuum emission from the vicinity of these snow lines in different protoplanetary disks.
Bouncing collisions, which we neglected in this study, could also cause a low sticking thresholds for icy aggregates and should be taken into account in future work. Compaction of aggregates through bouncing collisions (Weidling et al., 2009; Zsom et al., 2011) could also justify our assumption that icy aggregates have a relatively high filling factor.
It should be noted that whether CO2 ice suppresses dust growth depends on how CO2 ice is distributed inside grains. As already mentioned in Section 2.2.1, the sticking efficiency of mixtures CO2 and H2O ices would be similar to that of pure H2O ice if CO2/H2O (Musiolik et al., 2016b). Therefore, it is possible that CO2 ice does not produce grains in every protoplanetary disk. Such a variety can also be expected from recent ALMA observations of disk substructures. While not all observed disks possess substructures clearly associated with snow lines (Long et al., 2018; Huang et al., 2018; van der Marel et al., 2019), some systems (HD 135544 B, HD 169142, and HD 97048) do appear to have a deficit of dust interior to the CO2 snow line (see Figure 9 of van der Marel et al. 2019).
We also note here that sintering may not lead to the formation of dust rings in all protoplanetary disks. Sirono (2011) suggests that icy aggregates can be sintered over a wide region of a protoplanetary disk if they are temporally transported to the disk surface and get heated there. If this is the case, sintering would not lead to local concentration of dust in the radial direction. This might be another reason why not all spatially resolved protoplanetary disks seem to have dust rings associated with snow lines. The HL Tau disk is perhaps an ideal environment for sintering-induced ring formation because vertical mixing of dust is ineffective in this disk (Pinte et al., 2016).
Finally, we note that the models presented in this paper do not address the origin of the polarized emission of the HL Tau disk at 3.1 mm. At this wavelength, the polarimetric image exhibit no unidirectional polarization pattern, only showing azimuthal polarization (Kataoka et al., 2017). Mechanisms that can produce azimuthally polarized emission, such as radiative and aerodynamic grain alignment (Tazaki et al., 2017; Kataoka et al., 2019), must also be taken into account to fully understand the polarized emission from the HL Tau disk, and perhaps from other protoplanetary disks as well.
We are grateful to Ian Stephens and Akimasa Kataoka for kindly providing us with the FITS image of the HL Tau disk (Stephens et al., 2017). We also thank Kota Higuchi, Kenji Furuya, Takahiro Ueda, Carlos Carrasco-González, Zhaohuan Zhu, Munetake Momose, and Tomoko Suzuki for useful discussions, and the anonymous referee for comments that significantly improved the paper. S.O. was supported by JSPS KAKENHI Grant Numbers JP16H04081, JP16K17661, JP17K18812, JP18H05438, and JP19K03926. R.T. was supported by a Research Fellowship for Young Scientists from the Japan Society for the Promotion of Science (JSPS) (17J02411).
The reference list from the paper itself. Each links out to its DOI / PubMed record.
- 1Adachi et al. (1976) Adachi, I., Hayashi, C., & Nakazawa, K. 1976, Progress of Theoretical Physics, 56, 1756, doi: 10.1143/PTP.56.1756 · doi ↗
- 2ALMA Partnership et al. (2015) ALMA Partnership, Brogan, C. L., Pérez, L. M., et al. 2015, Ap J, 808, L 3, doi: 10.1088/2041-8205/808/1/L 3 · doi ↗
- 3Bacciotti et al. (2018) Bacciotti, F., Girart, J. M., Padovani, M., et al. 2018, Ap J, 865, L 12, doi: 10.3847/2041-8213/aadf 87 · doi ↗
- 4Bai (2016) Bai, X.-N. 2016, Ap J, 821, 80, doi: 10.3847/0004-637X/821/2/80 · doi ↗
- 5Banzatti et al. (2015) Banzatti, A., Pinilla, P., Ricci, L., et al. 2015, Ap J, 815, L 15, doi: 10.1088/2041-8205/815/1/L 15 · doi ↗
- 6Birnstiel et al. (2009) Birnstiel, T., Dullemond, C. P., & Brauer, F. 2009, A&A, 503, L 5, doi: 10.1051/0004-6361/200912452 · doi ↗
- 7Birnstiel et al. (2010) —. 2010, A&A, 513, A 79, doi: 10.1051/0004-6361/200913731 · doi ↗
- 8Birnstiel et al. (2012) Birnstiel, T., Klahr, H., & Ercolano, B. 2012, A&A, 539, A 148, doi: 10.1051/0004-6361/201118136 · doi ↗