TL;DR
This paper systematically reviews twelve R packages for automated exploratory data analysis, highlighting current capabilities and identifying future development directions to enhance data analysis automation.
Contribution
It provides a comprehensive analysis of existing autoEDA tools in R and suggests new avenues for improving automation in data analysis workflows.
Findings
Identifies key features of 12 popular R autoEDA packages.
Highlights automation gaps in current autoEDA tools.
Suggests directions for future autoEDA development.
Abstract
The increasing availability of large but noisy data sets with a large number of heterogeneous variables leads to the increasing interest in the automation of common tasks for data analysis. The most time-consuming part of this process is the Exploratory Data Analysis, crucial for better domain understanding, data cleaning, data validation, and feature engineering. There is a growing number of libraries that attempt to automate some of the typical Exploratory Data Analysis tasks to make the search for new insights easier and faster. In this paper, we present a systematic review of existing tools for Automated Exploratory Data Analysis (autoEDA). We explore the features of twelve popular R packages to identify the parts of analysis that can be effectively automated with the current tools and to point out new directions for further autoEDA development.
Click any figure to enlarge with its caption.
 Figure 1
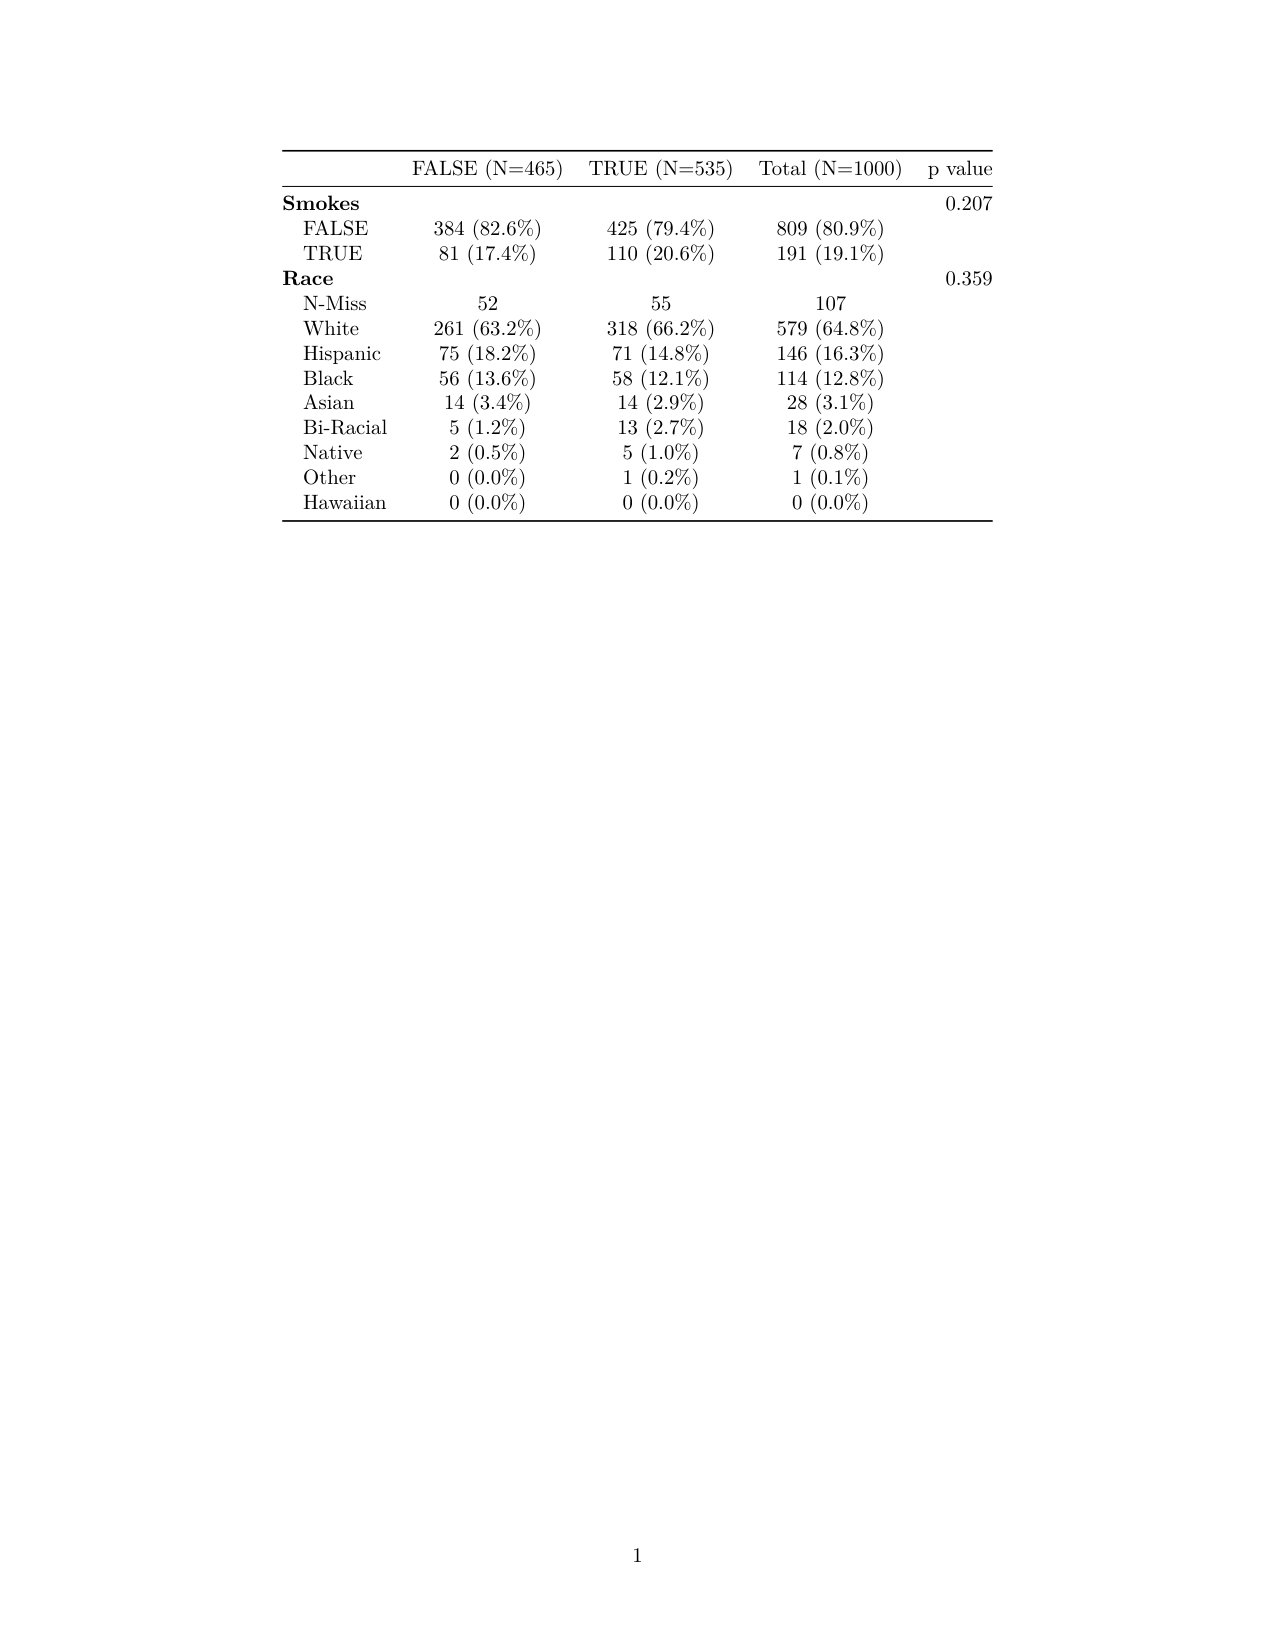 Figure 2
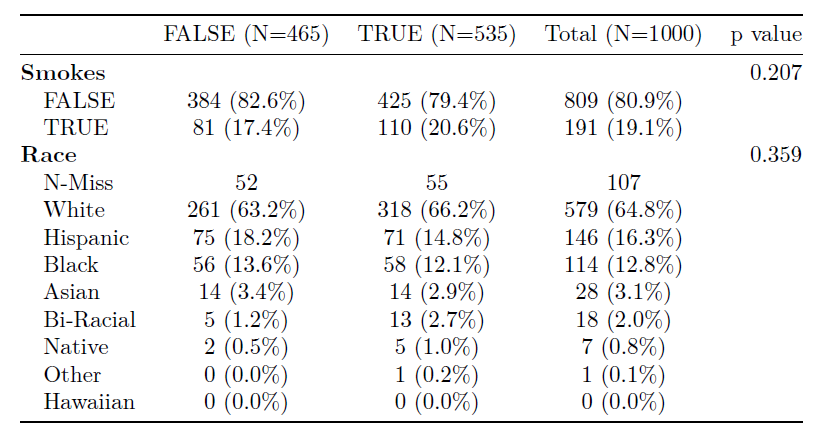 Figure 3
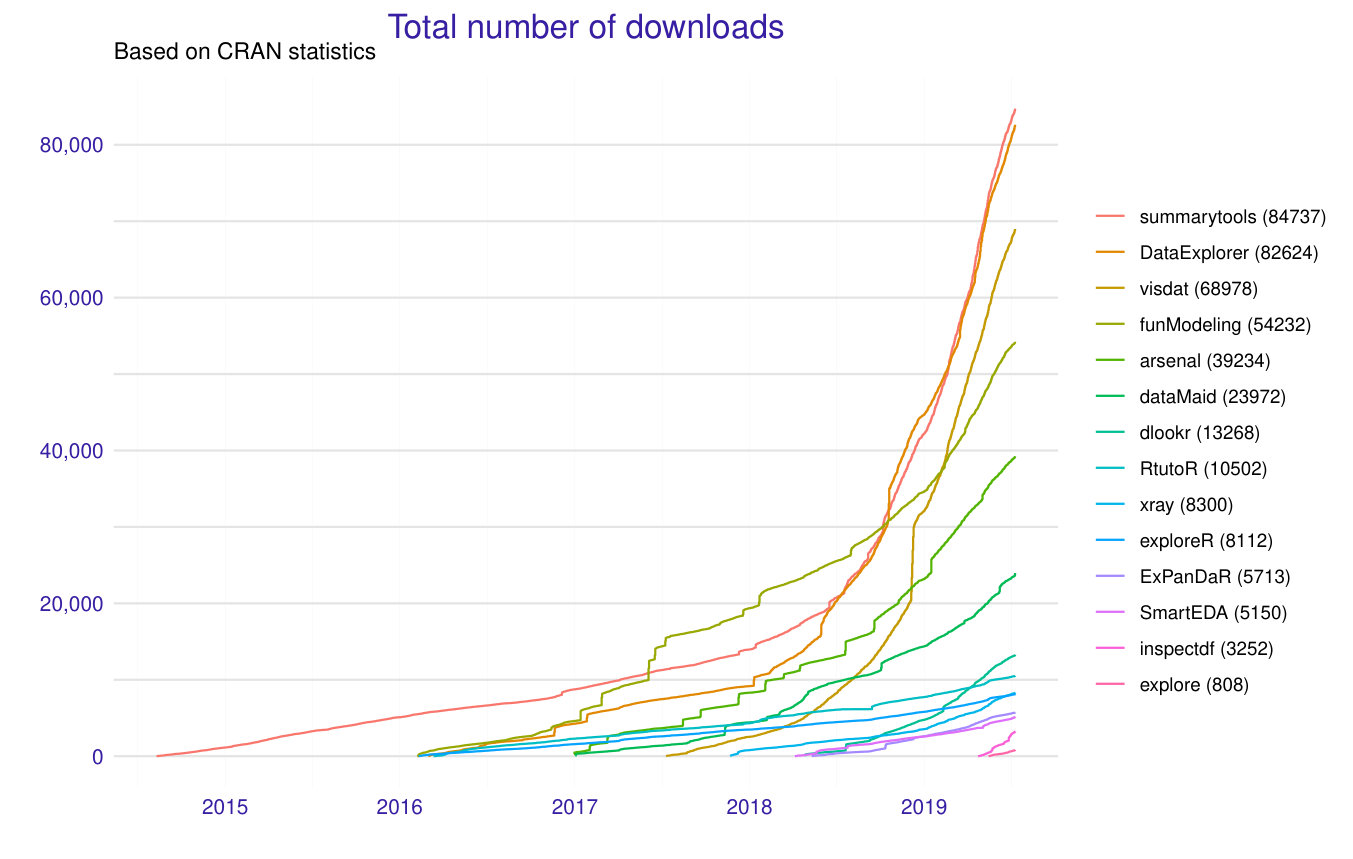 Figure 4
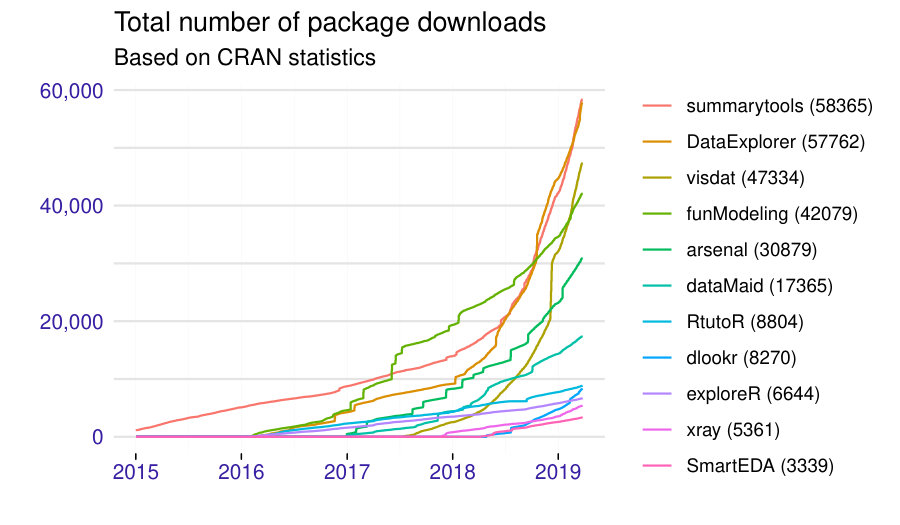 Figure 5
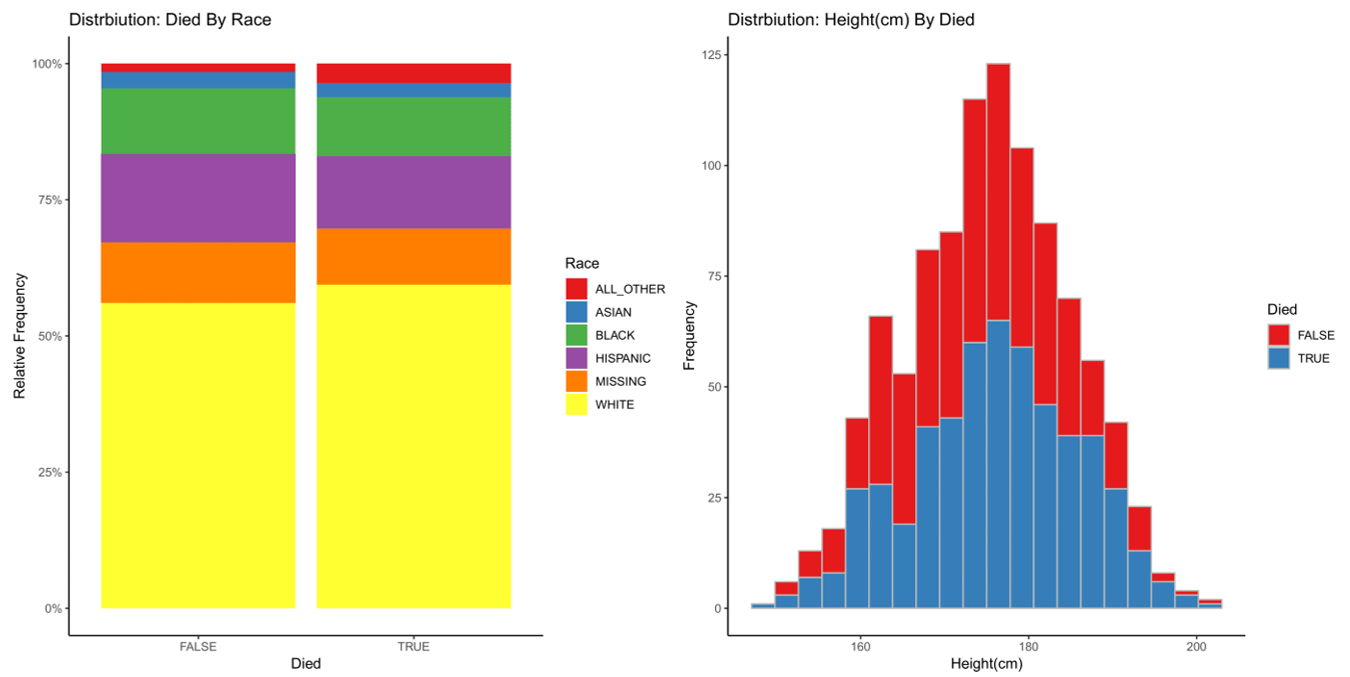 Figure 6
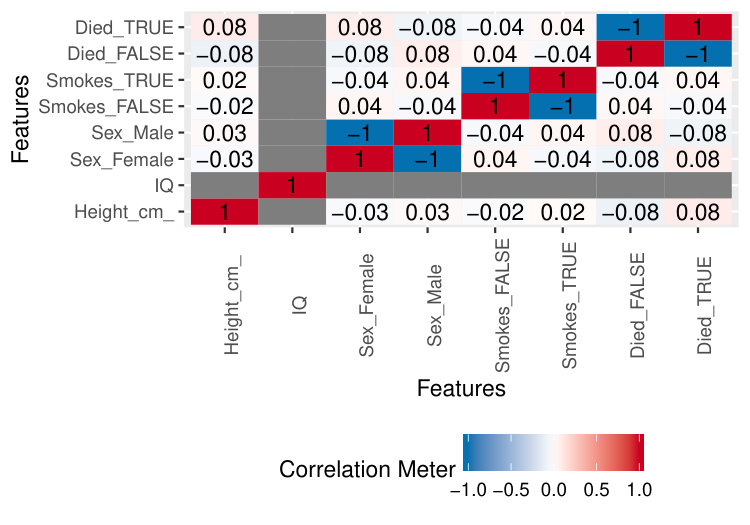 Figure 7
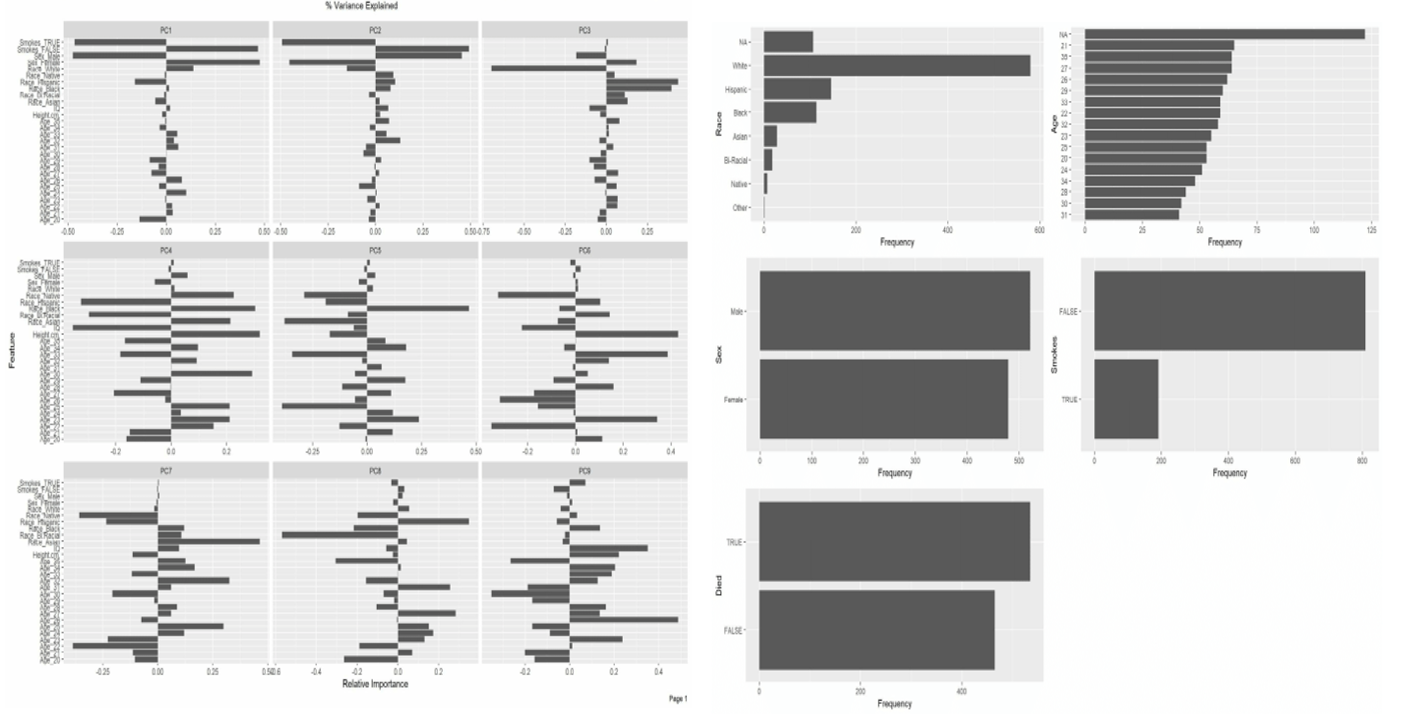 Figure 8
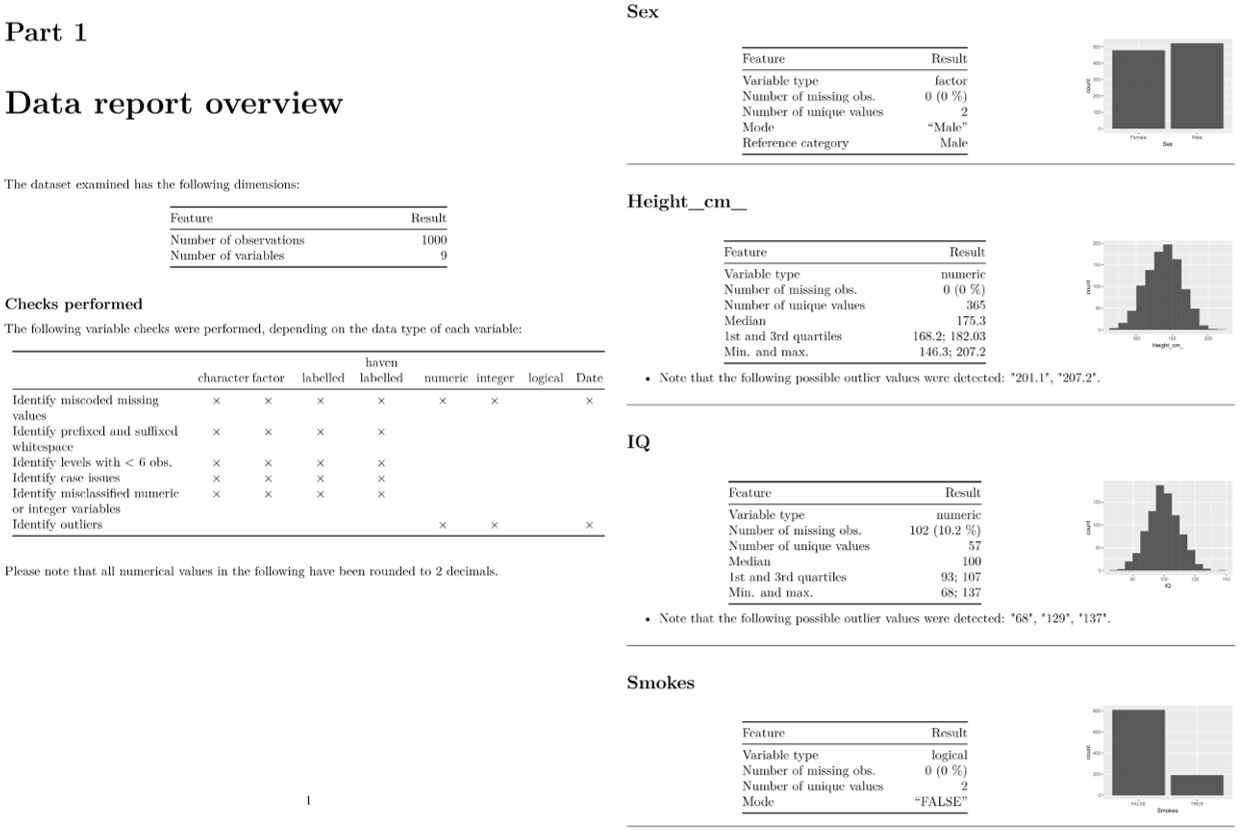 Figure 9
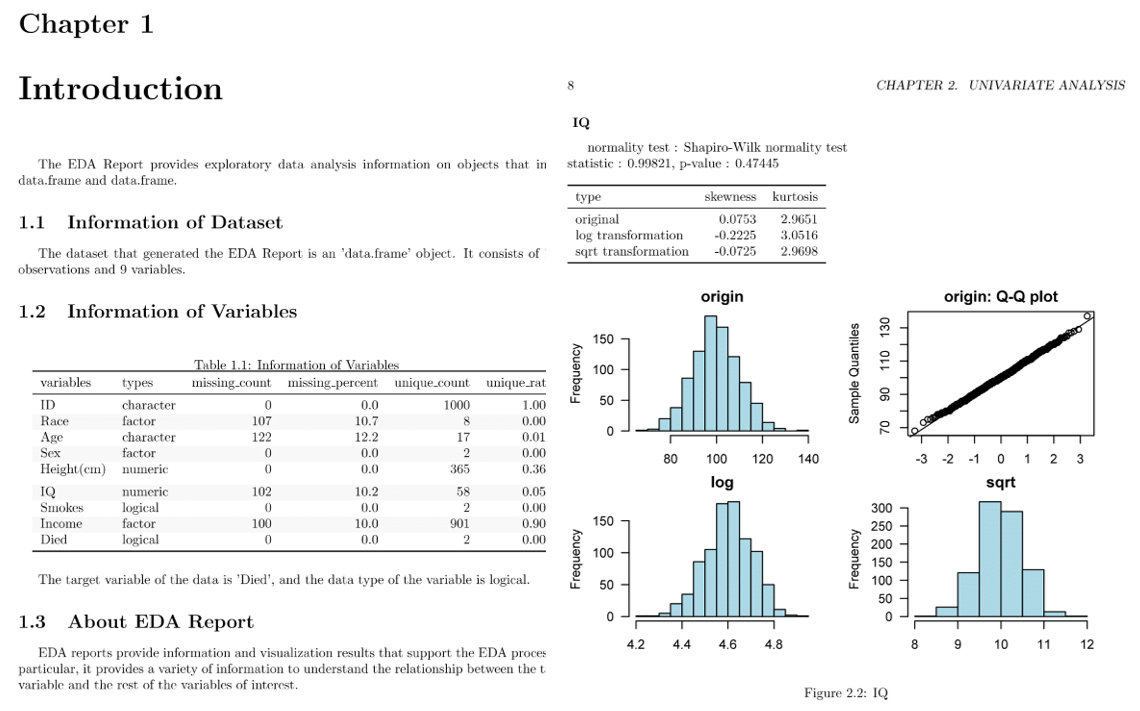 Figure 10
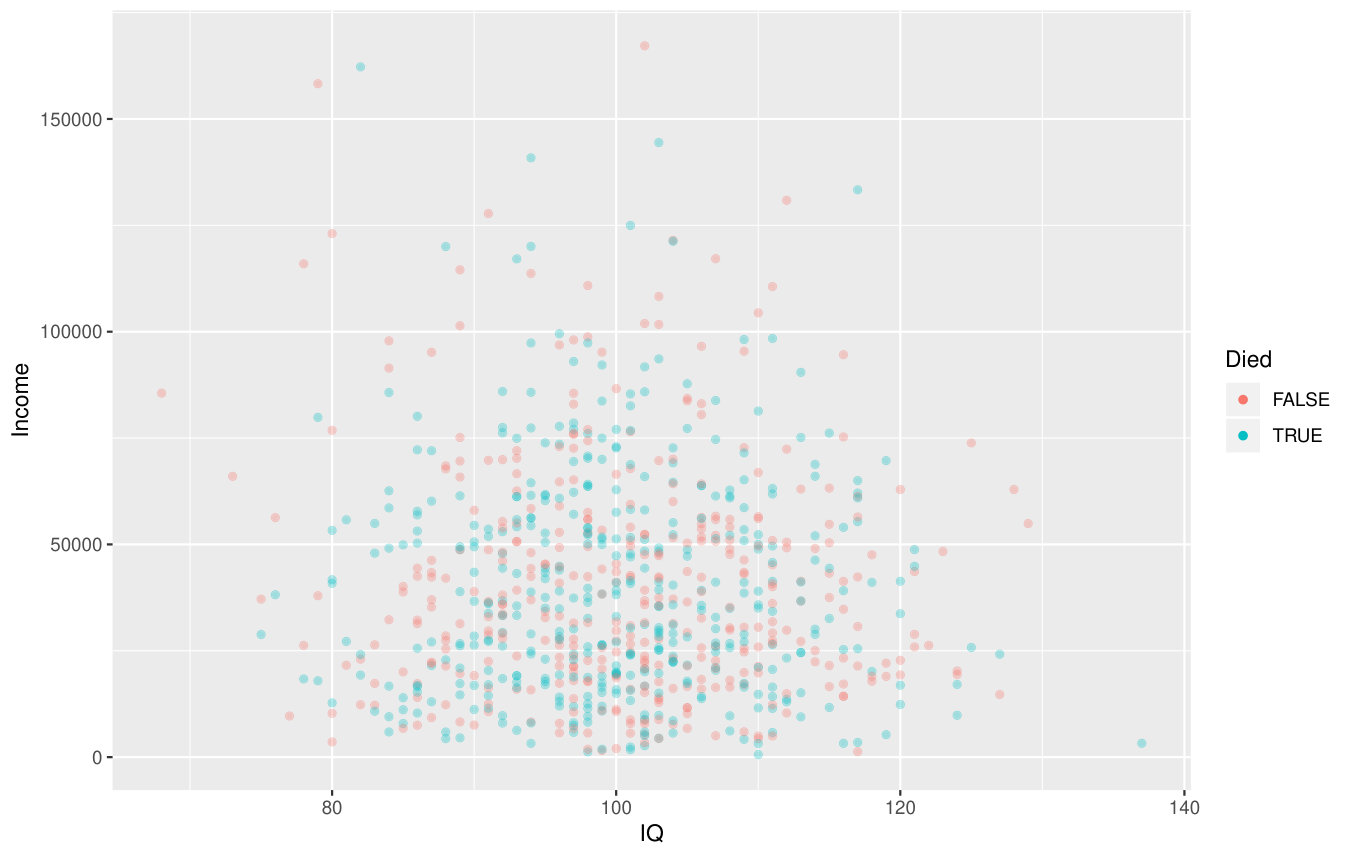 Figure 11
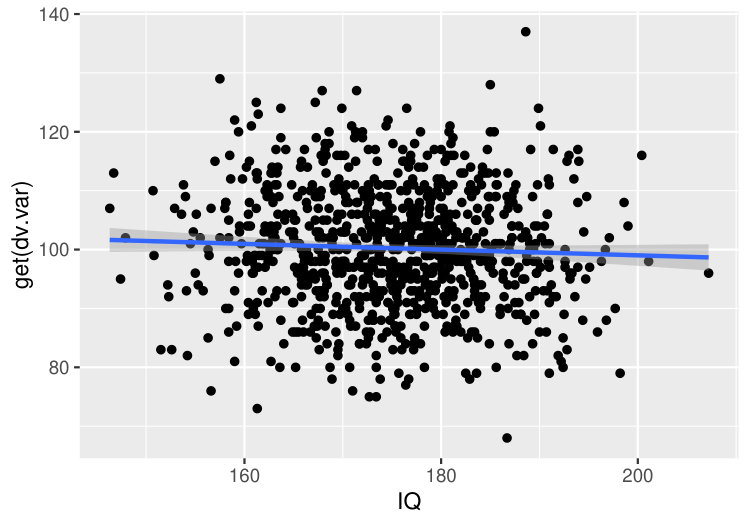 Figure 12
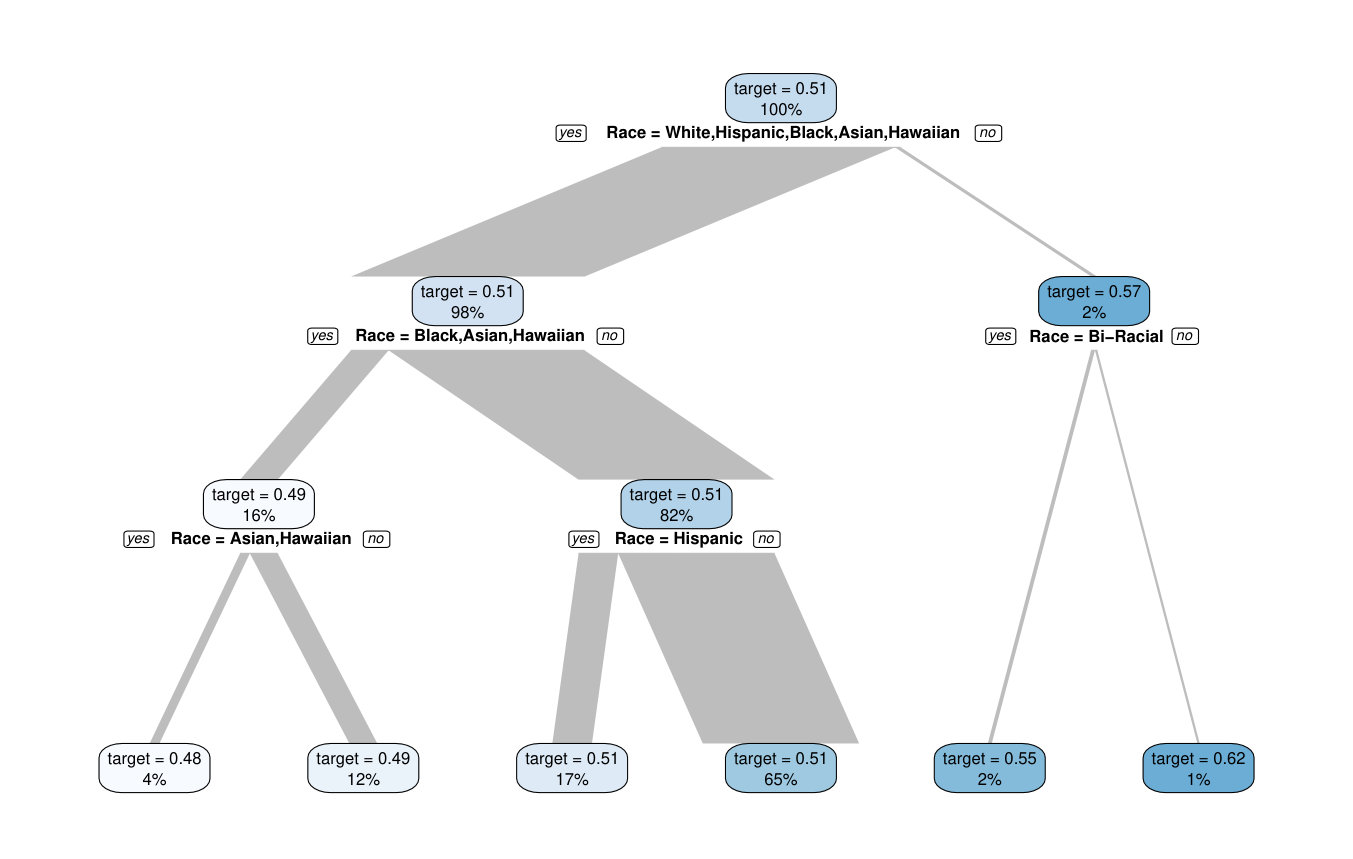 Figure 13
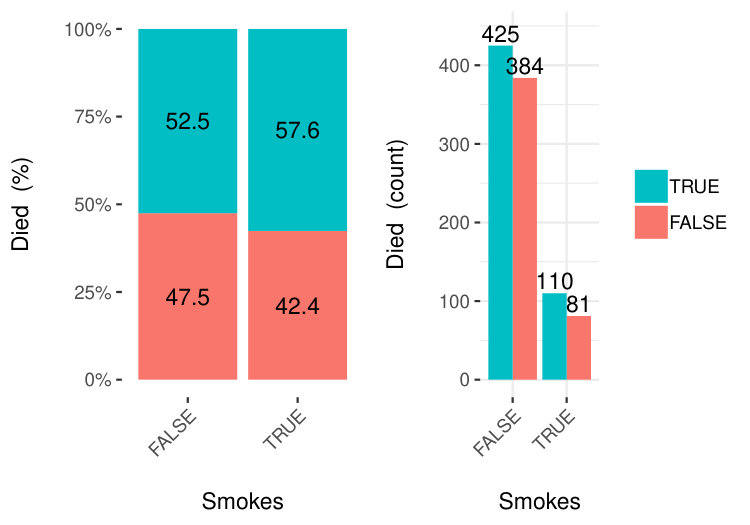 Figure 14
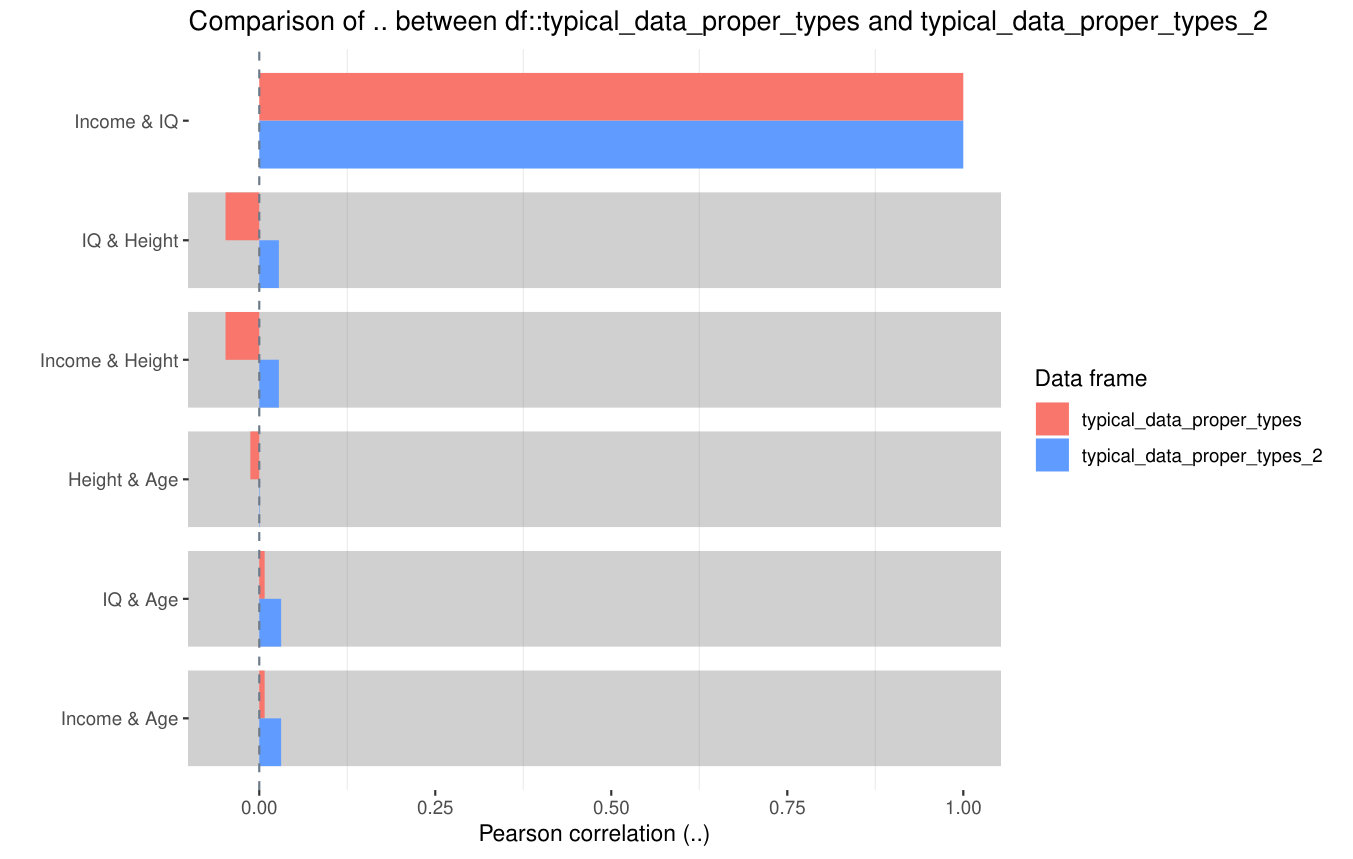 Figure 15
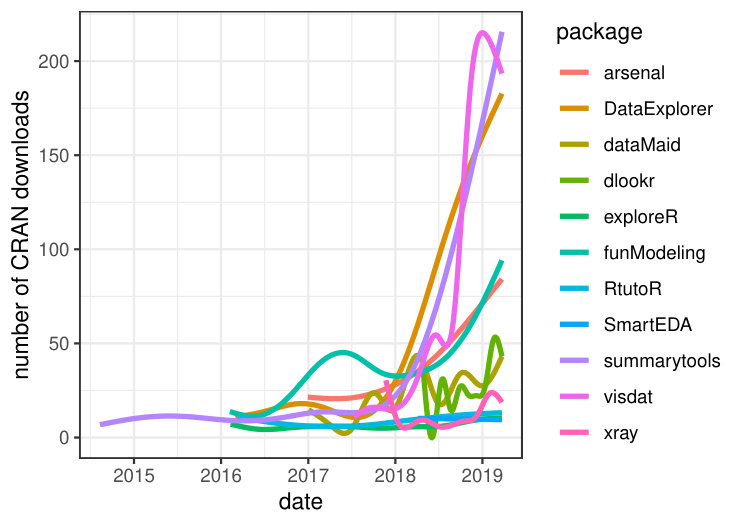 Figure 16
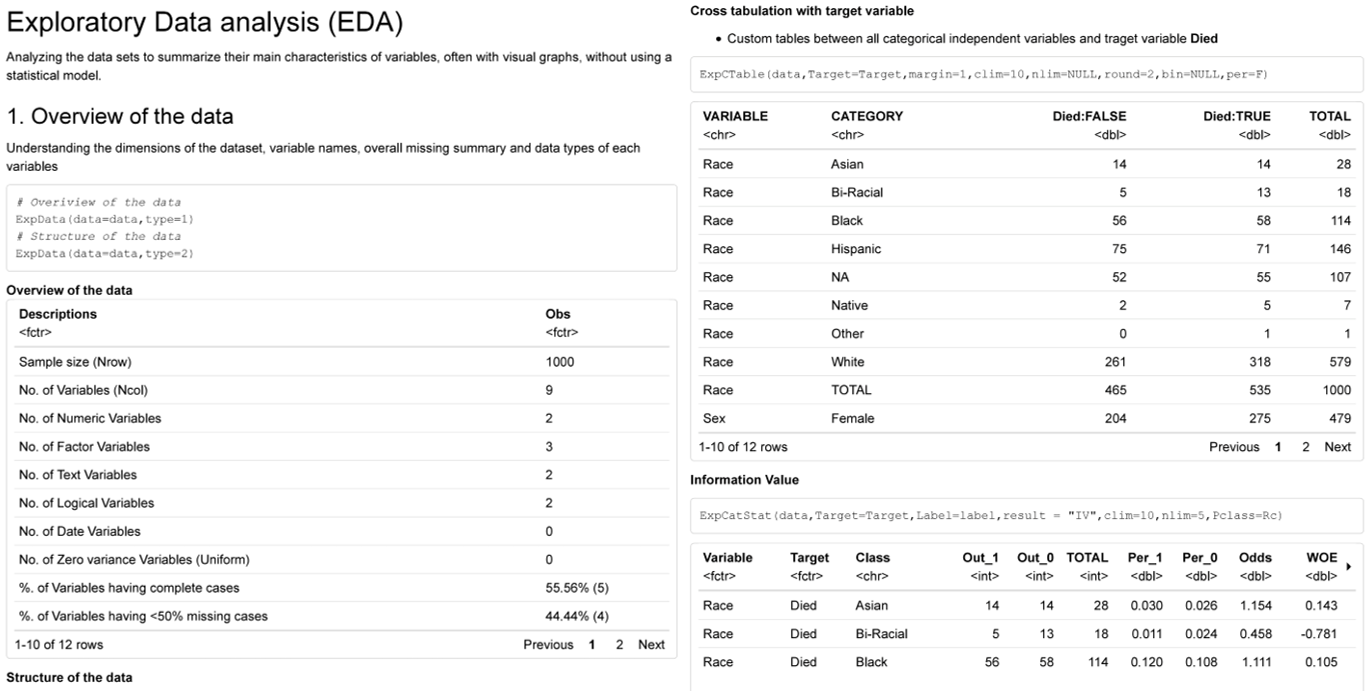 Figure 17
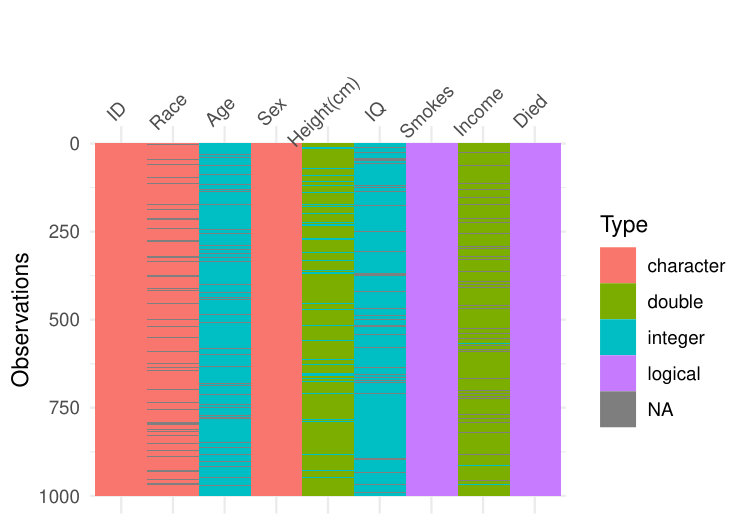 Figure 18
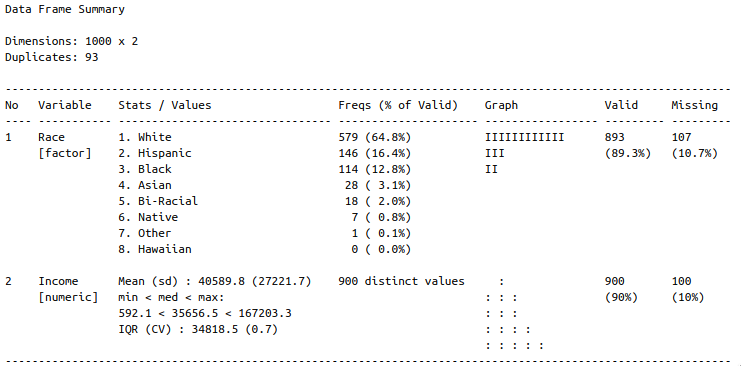 Figure 19
 Figure 20
| CRAN | GitHub | |||||||
|---|---|---|---|---|---|---|---|---|
| package | downl. | debut | age | stars | commits | contrib. | issues | forks |
| arsenal | 39234 | 2016-12-30 | 2y 6m | 59 | 637 | 3 | 200 | 4 |
| autoEDA | - | - | - | 41 | 20 | 1 | 4 | 12 |
| DataExplorer | 82624 | 2016-03-01 | 3y 4m | 235 | 187 | 2 | 121 | 44 |
| dataMaid | 23972 | 2017-01-02 | 2y 6m | 68 | 473 | 2 | 45 | 18 |
| dlookr | 13268 | 2018-04-27 | 1y 2m | 35 | 54 | 3 | 9 | 12 |
| ExPanDaR | 5713 | 2018-05-11 | 1y 2m | 32 | 197 | 2 | 3 | 14 |
| explore | 808 | 2019-05-16 | 0y 1m | 15 | 114 | 1 | 1 | 0 |
| exploreR | 8112 | 2016-02-10 | 3y 5m | 1 | 1 | 1 | 0 | 0 |
| funModeling | 54232 | 2016-02-07 | 3y 5m | 58 | 126 | 2 | 13 | 18 |
| inspectdf | 3252 | 2019-04-24 | 0y 2m | 117 | 200 | 2 | 12 | 11 |
| RtutoR | 10502 | 2016-03-12 | 3y 3m | 13 | 7 | 1 | 4 | 8 |
| SmartEDA | 5150 | 2018-04-06 | 1y 3m | 4 | 4 | 1 | 1 | 2 |
| summarytools | 84737 | 2014-08-11 | 4y 11m | 255 | 981 | 6 | 76 | 33 |
| visdat | 68978 | 2017-07-11 | 2y 0m | 313 | 426 | 12 | 122 | 39 |
| xray | 8300 | 2017-11-22 | 1y 7m | 63 | 33 | 4 | 10 | 5 |
| Phase | Task | Type | Examples |
|---|---|---|---|
| Data understanding | Data description | dimensions | variables number |
| variables | variable type | ||
| meta-data | size in RAM | ||
| Data validity | invalid values | typos | |
| missing values | NA count | ||
| atypical values | outliers | ||
| Data exploration | univariate | histogram | |
| bivariate | scatter plot | ||
| multivariate | Parallel coord. plot | ||
| Data preparation | Data cleaning | Imputation | Impute mean |
| Outlier treatment | Impute median | ||
| Derived attributes | Dimension reduction | PCA | |
| Continuous | Box-Cox transform | ||
| Binning | |||
| Categorical | Merge rare factors |
| Height(cm) | IQ | |
|---|---|---|
| Mean | 175.09 | 100.23 |
| Std.Dev. | 9.83 | 10.03 |
| Min | 146.30 | 68.00 |
| Q1 | 168.20 | 93.00 |
| Median | 175.30 | 100.00 |
| Q3 | 182.05 | 107.00 |
| Max | 207.20 | 137.00 |
| MAD | 10.38 | 10.38 |
| IQR | 13.83 | 14.00 |
| CV | 0.06 | 0.10 |
| Skewness | -0.08 | 0.08 |
| SE.Skewness | 0.08 | 0.08 |
| Kurtosis | -0.30 | -0.04 |
| N.Valid | 1000.00 | 898.00 |
| % Valid | 100.00 | 89.80 |
| Task type | Task | a | aE | DE | dM | d | EPD | e | eR | fM | i | R | SE | s | v | x |
| Dataset | Variable types | x | x | x | x | x | x | x | x | x | x | |||||
| Dimensions | x | x | x | x | x | x | x | x | x | |||||||
| Other info | x | x | x | |||||||||||||
| Compare datasets | x | x | x | x | ||||||||||||
| Validity | Missing values | x | x | x | x | x | x | x | x | x | x | x | x | |||
| Redundant col. | x | x | x | x | x | x | x | x | ||||||||
| Outliers | x | x | x | x | x | |||||||||||
| Atypical values | x | x | x | |||||||||||||
| Level encoding | x | |||||||||||||||
| Univar. | Descriptive stat. | x | x | x | x | x | x | x | x | x | x | x | ||||
| Histograms | x | x | x | x | x | x | x | x | x | x | x | |||||
| Other dist. plots | x | x | ||||||||||||||
| Bar plots | x | x | x | x | x | x | x | x | x | x | x | |||||
| QQ plots | x | x | x | |||||||||||||
| Bivar. | Descriptive stat. | x | x | x | x | x | x | |||||||||
| Correlation matrix | x | x | x | x | x | |||||||||||
| 1 vs each corr. | x | x | x | x | ||||||||||||
| Time-dependency | x | x | x | |||||||||||||
| Bar plots by target | x | x | x | x | x | x | x | x | ||||||||
| Num. plots by target | x | x | x | x | x | x | ||||||||||
| Scatter plots | x | x | x | x | x | |||||||||||
| Contigency tables | x | x | x | x | ||||||||||||
| Other stats. (factor) | x | x | x | |||||||||||||
| Multivar. | PCA | x | ||||||||||||||
| Stat. models | x | x | x | |||||||||||||
| PCP | x | |||||||||||||||
| Transform. | Imputation | x | x | x | ||||||||||||
| Scaling | x | x | x | |||||||||||||
| Skewness | x | |||||||||||||||
| Outlier treatment | x | x | x | x | ||||||||||||
| Binning | x | x | x | |||||||||||||
| Merging levels | x | x | ||||||||||||||
| Reporting | Reports | x | x | x | x | x | x | x | ||||||||
| Saving outputs | x | x | x | x | x |
Peer Reviews
No public reviews on file for this paper yet. If you reviewed it on a platform where reviews are public (OpenReview, ICLR, NeurIPS, ICML), you can paste yours below so the community can read it here.
Code & Models
Videos
No videos yet. Explain this paper in a talk, walkthrough, or lecture? Add one.
The Landscape of R Packages for Automated Exploratory Data Analysis
by Mateusz Staniak and Przemysław Biecek
Abstract
The increasing availability of large but noisy data sets with a large number of heterogeneous variables leads to the increasing interest in the automation of common tasks for data analysis. The most time-consuming part of this process is the Exploratory Data Analysis, crucial for better domain understanding, data cleaning, data validation, and feature engineering.
There is a growing number of libraries that attempt to automate some of the typical Exploratory Data Analysis tasks to make the search for new insights easier and faster. In this paper, we present a systematic review of existing tools for Automated Exploratory Data Analysis (autoEDA). We explore the features of fifteen popular R packages to identify the parts of the analysis that can be effectively automated with the current tools and to point out new directions for further autoEDA development.
Introduction
With the advent of tools for automated model training (autoML), building predictive models is becoming easier, more accessible and faster than ever. Tools for R such as mlrMBO (Bischl et al., 2017), parsnip (Kuhn and Vaughan, 2019); tools for python such as TPOT (Olson et al., 2016), auto-sklearn (Feurer et al., 2015), autoKeras (Jin et al., 2018) or tools for other languages such as H2O Driverless AI (H2O.ai, 2019; Cook, 2016) and autoWeka (Kotthoff et al., 2017) supports fully- or semi-automated feature engineering and selection, model tuning and training of predictive models.
Yet, model building is always preceded by a phase of understanding the problem, understanding of a domain and exploration of a data set. Usually, in the process of the data analysis much more time is spent on data preparation and exploration than on model tuning. This is why the current bottleneck in data analysis is in the exploratory data analysis (EDA) phase. Recently, a number of tools were developed to automate or speed up the part of the summarizing data and discovering patterns. Since the process of building predictive models automatically is referred to as autoML, we will dub the automation of data exploration autoEDA. The surge in interest in autoEDA tools111Access the raw data with archivist::aread("mstaniak/autoEDA-resources/autoEDA-paper/aec9") is evident in the Figure 1. Table 1 describes the popularity of autoEDA tools measured as the number of downloads from CRAN and usage statistics from Github222Access the data with archivist::aread("mstaniak/autoEDA-resources/autoEDA-paper/50a7").
There is an abundance of R libraries that provide functions for both graphical and descriptive data exploration. Here, we restrict our attention to packages that aim to automatize or significantly speed up the process of exploratory data analysis for tabular data. Such tools usually work with full data frames, which are processed in an automatic or semi-automatic manner, for example by guessing data types, and return summary tables, groups of plots or full reports. Currently, there is no CRAN Task View dedicated to packages for automated Exploratory Data Analysis and neither was there any repository that would catalog them333The first author maintains a list of papers related to autoEDA and software tools in different languages at https://github.com/mstaniak/autoEDA-resources. Here, we make a first attempt to comprehensively describe R tools for autoEDA. We chose two types of packages. The first group explicitly aims to automate EDA, as stated in the description of the package. These includes packages for fast, easy, interactive or automated data exploration. The second group contains packages that create data summaries. These packages were included, as long as they address at least two analysis goals listed in Table 2. We do not describe in detail packages that are either restricted to one area of application (for example RBioPlot (Zhang and Storey, 2016) package dedicated to biomolecular data or intsvy (Caro and Biecek, 2017) package focused on international large-scale assessments), designed for one specific task (for example creating tables), or in an early development phase. Some of the more task-specific packages are briefly discussed in Section 0.2.16. Some packages, such as radiant (Nijs, 2019) cover the full analysis pipeline and, as such, are too general for our purposes, even though they include an EDA module.
This paper has two main goals. First is to characterize existing R packages for automated Exploratory Data Analysis and compare their ranges of capabilities. To our best knowledge, this is first such a review. Previously, a smaller comparison of seven packages was done in Putatunda et al. (2019). Second is to identify areas, where automated data exploration could be improved. In particular, we are interested in gauging the potential of AI-assisted EDA tools.
The first goal is addressed in Sections 0.2 R packages for automated EDA and 0.3 Feature comparison where we first briefly describe each package and the compare, how are different EDA tasks are tackled by these packages. Then, in Section 0.4 Summary, we compile a list of strong and weak points of the automated EDA software and detail some open problems.
The tasks of Exploratory Data Analysis
Exploratory Data Analysis is listed as an important step in most methodologies for data analysis (Biecek, 2019; Grolemund and Wickham, 2019). One of the most popular methodologies, the CRISP-DM (Wirth, 2000), lists the following phases of a data mining project:
Business understanding. 2. 2.
Data understanding. 3. 3.
Data preparation. 4. 4.
Modeling. 5. 5.
Evaluation. 6. 6.
Deployment.
Automated EDA tools aim to make the Data understanding phase as fast and as easy as possible. This part of a project can be further divided into smaller tasks. These include a description of a dataset, data exploration, and data quality verification. All these tasks can be achieved both by providing descriptive statistics and numerical summaries and by visual means. AutoEDA packages provide functions to deal with these challenges. Some of them are also concerned with simple variable transformations and data cleaning. Both these tasks belong in the Data preparation phase, which precedes and supports the model building phase. Let us notice that business understanding is affected by data understanding, which makes this part of the analysis especially important.
Goals of autoEDA tools are summarised in Table 2. The Phase and Tasks columns are taken from the CRISP-DM standard, while Type and Examples columns provide examples based on current functionalities of autoEDA packages.
Each task should be summarised in a report, which makes reporting another relevant problem of autoEDA. Uni- and bivariate data exploration is a part of the analysis that is most thoroughly covered by the existing autoEDA tools. The form of univariate summaries depends on the variable type. For numerical variables, most packages provide descriptive statistics such as centrality and dispersion measures. For categorical data, unique levels and associated counts are reported. Bivariate relationships descriptions display either dependency between one variable of interest and all other variables, which includes contingency tables, scatter plots, survival curves, plots of distribution by values of a variable (histograms, bar plots, box plots), or between all pairs of variables (correlation matrices and plots), or chosen pairs of variables.
R packages for automated EDA
In this section, fifteen R libraries are shortly summarised. One of them is only available on GitHub (autoEDA), all others are available at CRAN. For each library, we include example outputs. The exact versions of packages that were used to create them can be found in the reference section. All examples are based on a subset of typical_data444Access the data with archivist::aread("mstaniak/autoEDA-resources/autoEDA-paper/278c7") dataset from visdat package. Whenever possible, archivist (Biecek and Kosinski, 2017) hooks are provided for easy access to the presented objects. When a function call only gives side-effects, a link is provided to the full result (PDF/PNG files). Tables were prepared with the xtable package (Dahl et al., 2018).
The arsenal package
The arsenal package (Heinzen et al., 2019) is a set of four tools for data exploration:
table of descriptive statistics and p-values of associated statistical tests, grouped by levels of a target variable (the so-called Table 1). Such a table can also be created for paired observation, for example longitudinal data (tableby and paired functions), 2. 2.
comparison of two data frames that can detect shared variables (compare function), 3. 3.
frequency tables for categorical variables (freqlist function), 4. 4.
fitting and summarizing simple statistical models (linear regression, Cox model, etc) in tables of estimates, confidence intervals and p-values (modelsum function).
Results of each function can be saved to a short report using the write2 function. An example555Access the table with archivist::aread("mstaniak/autoEDA-resources/autoEDA-paper/d951") can be found in Figure 2.
A separate vignette is available for each of the functions. arsenal is the most statistically-oriented package among reviewed libraries. It borrows heavily from SAS-style procedures used by the authors at the Mayo Clinic.
The autoEDA package
autoEDA package (Horn, 2018a) is a GitHub-based tool for univariate and bivariate visualizations and summaries. The dataOverview function returns a data frame that describes each feature by its type, number of missing values, outliers and typical descriptive statistics. Values proposed for imputation are also included. Two outlier detection methods are available: Tukey and percentile-based. A PDF report can be created using the autoEDA function. It consists of the plots of distributions of predictors grouped by outcome variable or distribution of outcome by predictors.
The package can be found on Xander Horn’s GitHub page: https://github.com/XanderHorn/autoEDA. It does not include a vignette, but a short introductory article was published to LinkedIn (Horn, 2018b) and similar examples can be found in the readme of the project. Plots from a report666Find the full report at https://github.com/mstaniak/autoEDA-resources/blob/master/autoEDA-paper/plots/autoEDA/autoEDA_report.pdf generated by autoEDA are displayed in Figure 3.
The DataExplorer package
DataExplorer (Cui, 2019) is a recent package that helps automatize EDA and simple data transformations. It provides functions for:
whole dataset summary: dimensions, types of variables, missing values, etc (introduce and plot_intro functions), 2. 2.
missing values profile as a plot of missing values fraction per column (plot_missing function) or summary statistics and suggested actions (profile_missing function), 3. 3.
plotting distributions of variables, separately numerical and categorical (plot_histogram and plot_bar functions), 4. 4.
QQ Plots (plot_qq function), 5. 5.
plotting correlation matrices (plot_correlation function), 6. 6.
visualizing PCA results by plotting percentage of explained variance and correlations with each original feature for every principal component (plot_prcomp function), 7. 7.
plotting relationships between the target variable and predictors - scatterplots and boxplots (plot_scatterplot and plot_boxplot functions), 8. 8.
data transformation: replacing missing values by a constant (set_missing function), grouping sparse categories (group_category function), creating dummy variables, dropping columns (dummify, drop_features functions) and modifying columns (update_columns function).
The create_report function generates a report. By default, it consists of all the above points except for data transformations and it can be further customized. An introductory vignette Introduction to DataExplorer that showcases all the functionalities is included in the package. It is noticeable that the package almost entirely relies on visual techniques. Plots taken from an example report777Access the full report https://github.com/mstaniak/autoEDA-resources/blob/master/autoEDA-paper/plots/DataExplorer/dataexplorer_example.pdf are presented in Figure 4.
The dataMaid package
The dataMaid (Petersen and Ekstrom, 2018) package has two central functions: the check function, which performs checks of data consistency and validity, and summarize, which summarizes each column. Another function, makeDataReport, automatically creates a report in PDF, DOCX or HTML format. The goal is to detect missing and unusual - outlying or incorrectly encoded - values. The report contains a whole dataset summary: variables and their types, number of missing values, and univariate summaries in the form of descriptive statistics, histograms/bar plots and an indication of possible problems.
User-defined checks and summaries can be also included in the analysis. The vignette Extending dataMaid explains how to define them. It is also possible to customize the report. In particular, variables for which no problems were detected can be omitted. An example report888Find the full report at https://github.com/mstaniak/autoEDA-resources/blob/master/autoEDA-paper/plots/dataMaid/dataMaid_report.pdf can be found in Figure 5.
The dlookr package
The dlookr (Ryu, 2019) package provides tools for 3 types of analysis: data diagnosis including correctness, missing values, outlier detection; exploratory data analysis; and variable transformations: imputation, dichotomization, and transformation of continuous features. It can also automatically generate a PDF report for all these analyses.
For data diagnosis, types of variables are reported along with counts of missing values and unique values. Variables with a low proportion of unique values are described separately. All the typical descriptive statistics are provided for each variable. Outliers are detected and distributions of variables before and after outlier removal are plotted. Both missing values and outliers can be treated using impute_na and impute_outlier functions.
In the EDA report, descriptive statistics are presented along with normality tests, histograms of variables and their transformations that reduce skewness: logarithm and root square. Correlation plots are shown for numerical variables. If the target variable is specified, plots that show the relationship between the target and each predictor are also included.
A transformation report compares descriptive statistics and plots for each variable before and after imputation, skewness-removing transformation and binning. If the right transformation is found among the candidate transformations, it can be applied to the feature through one of the binning, binning_by, or transform functions.
Every operation or summary presented in the reports can also be performed manually. A dedicated vignette explains each of the main functionalities (Data quality diagnosis, Data Transformation, Exploratory Data Analysis vignettes). An example999Access the full report at https://github.com/mstaniak/autoEDA-resources/blob/master/autoEDA-paper/plots/dlookr/dlookr_eda.pdf taken from one of the reports can be found in Figure 6.
The ExPanDaR package
Notably, while the ExPanDaR package (Gassen, 2018) was designed for panel data exploration, it can also be used for standard EDA after adding an artificial constant time index. In this case, the package offers interactive shiny application for exploration. Several types of analysis are covered:
missing values and outlier treatment, 2. 2.
univariate summaries (descriptive statistics) and plots (histograms/bar plots), 3. 3.
bivariate analysis via correlation matrices and plots. Interestingly, scatter plots can be enriched by associating size and color of points with variables, 4. 4.
multivariate regression analysis.
For each functionality of the application, there is a corresponding standalone function.
Three vignettes describe how the library can be used for data exploration (Using the functions of the ExPanDaR package), how to customize it (Customize ExPanD) and how to analyze panel data (* Using ExPanD for Panel Data Exploration*) Example instances of ExPanDaR shiny applications are available online. Links and other examples can be found in the GitHub repository of the package: https://github.com/joachim-gassen/ExPanDaR. An example of a scatter plot101010Access the R object with the archivist::aread("mstaniak/autoEDA-resources/autoEDA-paper/9c5d") created by the package can be found in Figure 7.
The explore package
The functionalities of the explore package (Krasser, 2019) can be accessed in three ways: through an interactive shiny (Chang et al., 2019) application, through an automatically generated HTML report or via standalone functions. In addition to data exploration, relationships with a binary target can be explored. The package includes functions for
full dataset summaries - dimensions, data types, missing values and summary statistics (describe function), 2. 2.
uni- and bivariate visualizations, including density plots, bar plots and boxplots (a family of explore functions, in particular explore_all function that creates plots for all variables), 3. 3.
modeling based on decision trees or logistic regression (explain_tree and explain_logreg functions).
All result can be saved to HTML via the report function. Dataset and variable summaries can also be save to an MD file using the data_dict_md function111111Find examples at https://github.com/mstaniak/autoEDA-resources/tree/master/autoEDA-paper/plots/explore. The explore vignette includes a thorough description of the package. An example decision tree121212Access the R object with the archivist::aread("mstaniak/autoEDA-resources/autoEDA-paper/dc47"). can be found in Figure 8.
The exploreR package
The exploreR package (Coates, 2016) takes a unique approach to data exploration compared to other packages. The analysis is based on linear regression. There are three functionalities:
fitting univariate regression model for each independent variable and summarizing the results in a table that consists of estimated parameters, p-values, and values (masslm function), 2. 2.
plotting target variable against each independent variable along with the fitted least-squares line (massregplot function), 3. 3.
feature standardization by scaling to the interval or subtracting mean and dividing by standard deviation.
Regression plots can be saved to a PDF file. A vignette called The How and Why of Simple Tools explains all the functions and provides examples. One of the regression plots131313A PDF file with all the plots can be found at https://github.com/mstaniak/autoEDA-resources/blob/master/autoEDA-paper/plots/exploreR.pdf is presented in Figure 9.
The funModeling package
The package funModeling (Casas, 2019) is a rich set of tools for EDA connected to the book Casas (2018). These tools include
dataset summary (df_status function), 2. 2.
plots and descriptive statistics for categorical and numerical variables (plot_num, profiling_num and freq functions), 3. 3.
classical and information theory-based correlation analysis for target variable vs other variables - (correlation_table function for numerical predictors, var_rank_info function for all predictors), 4. 4.
plots of distribution of target variables vs predictors (bar plots, box plots and histograms via cross_plot and plotar functions), 5. 5.
quantitative analysis for binary target variables (categ_analysis function), 6. 6.
different methods of binning continuous features (discretize_df, convert_df_to_categoric and discretize_rgr functions), 7. 7.
variable normalization by transforming to the interval (range01 function), 8. 8.
outlier treatment (prep_outliers, tukey_outlier and hampel_outlier functions), 9. 9.
gain and lift curves (gain_lift function).
It is the only library that encompasses visualizations related to predictive models and non-standard correlation analysis. The range of tools covered by funModeling is very wide. The package includes an exhaustive introduction vignette called funModeling* quick-start*. One of the bivariate visualizations141414Find all the plots at https://github.com/mstaniak/autoEDA-resources/tree/master/autoEDA-paper/plots/funmodeling offered by the package can be found in Figure 10.
The inspectdf package
The inspectdf package (Rushworth, 2019) provides several tools for basic data exploration with a consistent interface. Each of the inspect_* functions returns a data frame with summaries (and additional attributes). The results can be then plotted using the show_plot function. The functions are related to three aspects of EDA:
whole dataset can be summarised by numbers of missing values, number of variables of each type and memory used by each variable (inspect_na, inspect_types and inspect_mem functions), 2. 2.
univariate analysis is done via summary statistics and histograms for numerical variables (inspect_num function), bar plots for categorical variables (inspect_cat function). Additionally, factors dominated by a single level can be found with the inspect_imb function, 3. 3.
bivariate relationships are described by Pearson correlation coefficient for numerical variables (inspect_cor function).
Notably, each function can take two data frames as parameters and return their comparison. An example of a correlation analysis plot comparing two data frames can be found in Figure 11 While the library does not include a vignette, extensive documentation with examples is provided on the GitHub webpage of the project: https://github.com/alastairrushworth/inspectdf.
The RtutoR package
The RtutoR package (Nair, 2018a) is a tool for automated reporting. There are three options for creating a report that contains univariate and bivariate data summaries:
plots can be created interactively in a shiny app (launch_plotter function), 2. 2.
the whole report can be generated from a shiny app that allows the user to tweak the report (gen_exploratory_report_app function), 3. 3.
the report can be created by a direct call to the generate_exploratory_analysis_ppt function.
The report is saved in the PPTX format. Notably, this package can identify the top k relevant variables based on a chosen criterion, for example, information gain, and display plots only for these variables. An example report can be found in the GitHub repository of the package151515Find the report at https://github.com/anup50695/RtutoR/blob/master/titanic_exp_report_2.pptx. The package was introduced in an R-Bloggers blog post (Nair, 2018b).
The SmartEDA package
The SmartEDA package (Ubrangala et al., 2018), is focused entirely on data exploration through graphics and descriptive statistics. It does not provide any functions which modify existing variables. The range of tools it includes is wide:
dataset summary (ExpData function), 2. 2.
descriptive statistics that may include correlation with target variable and density or bar plots (ExpNumStat, ExpNumViz, ExpCatStat and ExpCatViz functions). All visualizations may include the target variable, 3. 3.
QQ plots (ExpOutQQ function), 4. 4.
contingency tables (ExpCTable function), 5. 5.
information value and Weight of the Evidence coding (ExpWoETable, ExpInfoValue functions), 6. 6.
parallel coordinate plot for multivariate visualization (ExpParcoord function).
Plotting functions return grids of ggplot2 object. The results can be written to a HTML report (ExpReport function). There are also additional functionalities dedicated to data.table objects from data.table package (Dowle and Srinivasan, 2019). An introductory vignette called Explore data using SmartEDA (Intro) is attached to the library. Another vignette Custom summary statistics describe customizing output tables. The package is also described in the Putatunda et al. (2019) paper. Examples161616A full report is available at https://github.com/mstaniak/autoEDA-resources/blob/master/autoEDA-paper/plots/SmartEDA/smarteda_report_target.pdf can be found in Figure 12.
The summarytools package
The summarytools package (Comtois, 2019) builds summary tables for whole datasets, individual variables, or pairs of variables. In addition, the output can be formatted to be included in knitr(Xie, 2015) or plain documents, HTML files and shiny apps (Chang et al., 2019). There are four main functionalities:
whole dataset summary including variable types and a limited number of descriptive statistics, counts of unique values and missing values and univariate plots within the output table (dfSummary function), 2. 2.
descriptive statistics, including skewness and kurtosis, for numerical variables, possibly grouped by levels of a factor (descr, stby functions), 3. 3.
counts and proportions for levels of categorical features (freq function), 4. 4.
contingency tables for pairs of categorical variables (ctable function).
All results can be saved and displayed in different formats. The package includes a vignette titled Introduction to summarytools. An example of univariate summaries171717Access the R object with archivist::aread("mstaniak/autoEDA-resources/autoEDA-paper/9e12"). can be found in Figure 3.
The visdat package
The package visdat (Tierney, 2017) is maintained by rOpenSci. It consists of six functions that help visualize:
variables types and missing data (vis_dat function), 2. 2.
types of each value in each column (vis_guess function), 3. 3.
clusters of missing values (vis_miss function), 4. 4.
differences between the two datasets (vis_compare function), 5. 5.
where given conditions are satisfied in the data (vis_expect function), 6. 6.
correlation matrix for the numerical variables (vis_cor function).
Each of these functions returns a single ggplot2 (Wickham, 2016) plot that shows a rectangular representation of the dataset where the expected information is denoted by colors. An example of this visualization181818Access the plot object with archivist::aread("mstaniak/autoEDA-resources/autoEDA-paper/3cfd") can be seen in Figure 13.
The package includes a vignette Using visdat that provides examples for all package options. Interestingly, it is the only package that uses solely visual means of exploring the data.
The xray package
The xray (Seibelt, 2017) package has three functions for the analysis of data prior to statistical modeling:
detecting anomalies: missing data, zero values, blank strings, and infinite numbers (anomalies function), 2. 2.
drawing and printing univariate distributions of each variable through histograms, bar plots and quantile tables (distributions function), 3. 3.
drawing plots of variables over time for a specified time variable (timebased function).
Examples are presented in the readme file in the GitHub repository of the project (https://github.com/sicarul/xray), but no vignette is attached to it. Plots191919Access the associated table with archivist::aread("mstaniak/autoEDA-resources/autoEDA-paper/a3a3") generated by the package are presented in Figure 14.
Other packages
As mentioned before, there are numerous R packages that aim to make data exploration faster or the outputs more polished.
For table summaries of data that often include statistical tests, there are a few packages worth mentioning. The package tableone (Yoshida and Bohn., 2018) provides a CreateTableOne function to make publication-ready tables referred to as Table 1 - traditional name of tables that describe patients’ characteristics, usually stratified and including p-values from significance tests. The describe function from describer package (Hendricks, 2015) prints a summary of a data.frame or a vector which includes data types, counts and descriptive statistics. Similarly, the skimr (Quinn et al., 2019) package summarises data frames, vectors, and matrices. It can also handle grouped data frames. The summary consists of data dimensions, missing and complete value counts, typical descriptive statistics and simple histograms. A function of the same name from prettyR (Lemon and Grosjean, 2018) returns descriptive statistics for each column in a data.frame. This package is focused on improving the aesthetics of R statistical outputs. Similarly, the package Hmisc (Harrell Jr et al., 2019) includes a describe function that displays typical descriptive statistics and number of unique and missing values for each column. The plot method called on the result of the describe function returns a dot plot for each categorical and a spike histogram for each continuous column. The scope of this package is bigger than just Exploratory Data Analysis, as it includes many tools related to regression models.
There are also many packages related to data visualization. Two of them are particularly worth mentioning. The ggfortify package (Tang et al., 2016) serves as a uniform interface to plots of different statistical objects, including PCA results that can be used for data exploration and time series plots. The autoplotly library (Tang, 2018) was built on top of ggfortify to provide automatically generated, interactive visualizations of many statistical models. While these two packages are focused on statistical modeling, they can be helpful in exploratory analysis and exemplify the potential of quick and interactive visualization in R.
Two more packages are relevant to our interest. gpairs (Emerson and Green, 2014) and GGally (Schloerke et al., 2018) packages implement the generalized pairs plot (Emerson et al., 2013). This type of plot extends well known scatter plot matrices, that visualize bivariate relationships for many variables, by handling both numerical and categorical variables. It is helpful in data exploration and shares similarities to walls of histograms that can be found in automated EDA libraries.
Feature comparison
In this section, we compare how different packages address autoEDA tasks as described in Section 0.1.1. A quick overview of the functionalities of different packages can be found in Table 4.
Data description
Almost all packages contain functions for summarizing datasets. Tools that support data validity analysis are less common.
Whole dataset summaries
Most packages that provide a whole dataset summary take a similar approach and present names and types of variables, number of missing values and sometimes unique values or other statistics. This is true for summarytools (dfSummary function), autoEDA (dataOverview function), dataMaid (makeDataReport result), funModeling (df_status function), explore (describe function), ExPanDaR (prepare_descriptive_table function), and DataExplorer (introduce function). These outputs are sometimes mixed with univariate summaries. That is the case for one of the most popular summary-type functions: the dfSummary functions from the summarytools package. An example is given in Figure 15.
In the dlookr package, summaries for numerical variables and categorical variables are only presented separately in the report (describe function).
The visdat package introduces the most original summaries of the full dataset. The drawback of this approach is that it is not well suited for high dimensional data. But for a smaller number of variables, it gives a good overview of the dataset.
Data validity
Some packages can perform automated checks for the data, including at least outlier detection. The dataMaid package’s main purpose is to find inconsistencies and errors in the data. It finds possible outliers, missing values, low-frequency and possibly miscoded factor levels. All this information can be summarised in a quality report. The dlookr package covers similar functionality. There are two main differences: the report does not describe possibly miscoded factors, but outlier analysis is supplemented with plots showing variable distribution before and after removing the outliers. In all cases, the analysis is rather simple, for example in zero-inflated variables non-zero values are treated as outliers (dlookr). The ExPanDaR package handles outliers by providing a function that calculates winsorized or trimmed mean. Other packages only provide information about the number of missing values/outliers and identify columns that consist of a single value.
Data exploration
While multivariate analysis is rarely supported, there are many tools for descriptive and graphical exploration of uni- and bivariate patterns in the data.
Univariate statistics
All the tools that support univariate analysis take a similar approach to univariate analysis. For categorical variables, counts are reported and bar plots are presented, while histogram or boxplots and typical descriptive statistics (including quantiles, sometimes skewness) are used for continuous variables.
In dataMaid and dlookr packages, these plots are presented variable-by-variable in the report. In other packages (DataExplorer, funModeling, SmartEDA, inspectdf) groups of plots of the same type are shown together - as a wall of histograms or bar plots. Similarly, the explore package present all the plots at once. The ExPanDaR package allows user to choose variables to display in a shiny applications. Notably, dlookr reports skewness of variables and in case a skewed variable is found, it shows the distribution after some candidate transformations to reduce the skewness have been applied. This library also reports normality. The SmartEDA package also reports skewness and displays QQ plots against normal distribution, but it does not provide any means of reducing skewness.
Bivariate statistics
The funModeling and SmartEDA packages only support calculating correlations between variables and a specified target. DataExplorer and visdat packages can plot correlation matrices. They differ in categorical variables treatment. Some packages require only numerical features (visdat). Interestingly, in DataExplorer202020Access the plot with archivist::aread("mstaniak/autoEDA-resources/autoEDA-paper/0526"), low-cardinality categorical features are converted to 0-1 variables and plotted alongside numerical variables, as seen in Figure 16.
The arsenal package only presents variable summaries by levels of a chosen categorical variable. The report from the autoEDA package consists of a limited number of bar plots/boxplots with target variable as one of the dimensions. Similarly, in DataExplorer, dlookr, funModeling and SmartEDA, scatter plots and box plots or histograms with a specified target variable on one of the axis can be plotted. Additionally, funModeling and dlookr draw histograms/densities of continuous features by the target. In shiny applications provided by ExPanDaR and explore packages, the user can choose target variables and explanatory variables to display bivariate plots. Interestingly, scatter plots provided by the ExPanDaR package can be extended to display multivariate dependencies by mapping variables to the size and color of the points. The funModeling package also has unique options: drawing bar plots of discretized variables by the target and quantitative analysis for binary outcome based on representativeness and accuracy. arsenal, summarytools and SmartEDA also feature contingency tables. Moreover, exploreR and ExPanDaR packages use linear regression plots and statistics to find relationships between the target and other variables. The explore package can only handle binary targets, but it allows the user to fit and plot a decision tree model.
Data cleaning and data transformation
The dataMaid package assumes that every decision regarding the data should be made by the analyst and does not provide any tools for data manipulation after diagnosis. Most of the packages only provide exploration tools. Exceptions are dlookr, funModeling, DataExplorer and exploreR. DataExplorer provides tools for normalization, imputation by a constant, merging levels of factors, creating dummy variables and transforming columns.
The dlookr package can create a report that presents different possible transformations of features. Missing values can be imputed by mean/median/mode and distributions of variables before and after the procedure can be compared. The same is done for imputation of outliers. Logarithmic and root square transforms are proposed for skewed variables. Different methods of binning continuous variables are also presented, including Weight of the Evidence.
The funModeling package can perform discretization of a variable using an equal frequency criterion or gain ratio maximization. It can also scale variables to the interval . Outliers can be treated using the Tukey or Hampel method.
Reporting
DataExplorer, dlookr, dataMaid, SmartEDA, explore and RtutoR have an option of generating a report and saving it to a file. Such a report usually consists of all or most possible outputs of the package. The plots and summaries are organized by the exploration task (for example univariate, then bivariate analysis) and either simply variable-by-variable (dataMaid, dlookr) or grouped by variable type (DataExplorer, SmartEDA). The autoEDA package generates a minimal report with bivariate plots. Packages arsenal, funModeling, xray, summarytools and exploreR have an option of saving outputs - plots or tables - to files.
Discussion
Automated EDA can be either directed towards a general understanding of a particular dataset or be more model-oriented, serving as a foundation for good modeling. While presented packages include some tools related to simple variable transformations, they are more focused on data understanding. For this task, they have many advantages. In this section, we summarize the strong points of existing tools and point out some possible improvements and new directions for autoEDA.
Strengths of autoEDA packages
The packages dlookr, dataMaid, DataExplorer, SmartEDA are capable of creating good quality reports. 2. 2.
DataExplorer has very good visualizations for PCA. 3. 3.
DataExplorer handles categorical variables on correlation plots by creating dummy features, which is a unique idea compared to other packages. 4. 4.
The visdat package, while probably not the best choice for high dimensional data, features interesting take on initial whole dataset exploration. 5. 5.
The dlookr package is capable of selecting skewed variables and proposing transformations. Some of the other packages display binned continuous variables, which can also help in seeing visualizing dependencies. 6. 6.
dataMaid is a good tool for finding problems in the data. Thanks to the structure of check and summarize functions results, discovered issues can be treated effectively. 7. 7.
For datasets with a moderate number of features, DataExplorer, funModeling, dlookr and SmartEDA give a reasonable insight into variables distributions and simple relationships. 8. 8.
SmartEDA package provides a method of visualizing multivariate relationships - parallel coordinate plot. 9. 9.
The exploreR package provides usefuls tool for assessing bivariate relationship through linear regression.
We can see that tasks related to data quality and whole dataset summary are well by the existing libraries. Getting the big picture of the data and finding possible data quality problems is easy, especially with the dataMaid package. For classical applications, for example, statistical analyses in medicine, the current tools provide very good tables, such as the ones from tableone or arsenal packages, and uni-/bivariate plots. The inspectdf and summarytools packages can also provide quick insights into a dataset. Univariate analysis can be performed either variable-after-variable (dlookr, dataMaid), where we can see the statistical properties of each variable, or as groups of plots based on variable type (DataExplorer, funModeling). Both ways can be useful for a reasonable number of predictors. While multivariate tools are scarce, the available tools, PCA in DataExplorer and PCP in SmartEDA, are very well done. Notably, the ExPanDaR package provides very high flexibility thanks to the possibility of interactively choosing variables to display, adding new variables on-the-fly and customizing plots in the shiny application.
Future directions and possible improvements
The field of autoEDA is growing. New packages are being developed rapidly - there are recent additions from April and May. Features are added to existing packages and bugs are corrected, as new issues are suggested by users on GitHub. At this moment, we can identify the following problems and challenges.
All the presented tools can fail in situations with imperfect data. In particular, they are usually not robust to issues like zero-variance/constant variables. Such problems are expected to be solved in the nearest future, as suggested for example by issues in the GitHub repo of the DataExplorer package. In general, error messages can be uninformative. Moreover, in some situations, they lack flexibility. For example, in DataExplorer arguments can be passed to cor function, but not to corrplot function.
In the case of walls of histograms (or bar plots), no selection is being done and no specific order is chosen to promote most interesting distributions. The same is true for automatically created reports. This problem is only addressed by the RtutoR package, which allows to select top k relevant variables. Moreover, for high-dimensional data or high-cardinality factors, the plots often become unreadable or impractical. Partial solutions to these problems are applied. For example, DataExplorer removes too large factors from the panels. More generally, many GitHub issues for the described packages are related to customizing and improving plots and output tables. It is a challenging task due to the diversity of possible input data and a major concern for developers of autoEDA packages.
Typical EDA tasks are limited to exploring bivariate relationships. Searching for higher dimensional dependencies would be interesting, for example by adding color and size dimensions to the plots, which was already done in the ExPanDaR package. For wall of plots type of display, such an addition would result in a large number of new plots. Thus, it would require a proper method of finding the most relevant visualization. Interactivity partially helps address this issue. PCA, parallel coordinate plots and model summaries are supported, but each by a separate package. It is evident that there is a shortage of multivariate tools. Univariate regression models can be plotted by the exploreR package. The explore package plots decision trees for binary target variables. In other cases, exploration based on simple statistical models (such as scatter plot smoothing) is not an option. Using regression models and feature transformations to identify and measure relevant relationships could improve bivariate or multivariate analyses supported by automated EDA.
Regarding variable transformation, only one of the packages addresses the issue of skewed variables. Proposing transformations of continuous features other than binning would be helpful and could improve visualizations, for example, scatter plots with skewed variables. Missing data imputation more advanced than imputing a constant is delegated to other packages, although, it is known that imputation by a constant is usually not the best method of missing values treatment. Some of the above issues limit the packages’ usefulness in iterative work. Though, the comparisons of transform and original features and the possibility of applying discovered transformations to data in dlookr package are steps in the right direction.
Support for time-varying variables and non-classical (not IID) problems such as survival analysis is limited or non-existent. For survival analysis, the automation level is low, but there are two notable tools for summarizing dependencies. First is the recognized package survminer (Kassambara and Kosinski, 2018), which helps visualize survival curves, while also displaying survival tables and other information. The other tool is the cr17 package (Młynarczyk and Biecek, 2017), which includes summarizeCR function that returns several tables and plots for competing risks analysis. More tools for fast visualization of at least bivariate relationships in such problems would be a big help for analysts. Cluster analysis is sometimes regarded as a part of the EDA process, but it is not available in any of the packages.
The tools available in R have a similar range to other languages’ libraries, for example from Python. Python packages such as Dora (Epstein, 2017) or lens (Zabalza and Engineers, 2018) also cover feature-by-feature descriptive statistics and plots, bivariate visualizations of the relationships between predictors and target variable, contingency tables, basic data transformations, and imputation. Tools for visual data exploration supports also tools for visual model exploration like DALEX (Biecek, 2018) or iml (Molnar et al., 2018). In both cases, visual summaries help to quickly grasp key relations between variables or between input features and model predictions.
Since EDA is both closely connected to feature engineering and based on visual insights, automated EDA can draw from existing tools for automated feature extraction like SAFE ML (Gosiewska et al., 2019) or TPOT (Olson et al., 2016) and visualization recommendations. When it comes to aiding visual exploration of a dataset, standalone software carries possibilities beyond what we can expect from R packages or analogous libraries in other languages. A recent notable example is DIVE (Hu et al., 2018). It is an example of a growing number of tools for visual data exploration that aim to distinguish between relevant and irrelevant visualization and help the analyst find the most interesting plots. DIVE is one of the mixed-initiative visualization systems, meaning it uses both statistical properties of the dataset and user interactions to find the relevant plots. Building recommendation systems into autoEDA tools can help address the issue of dealing with high-dimensional data and multivariate dependencies by letting the ML-based system deal with the complexity of a large number of candidate visualizations. AI-assisted data exploration can be even faster and more efficient.
As autoEDA tools are still maturing, the efforts in the field are somewhat fragmented. Many packages try to achieve similar goals, but they can be quite inconsistent. It is especially visible in the multiplicity of names for the summary-type function to describe a whole data frame. As the libraries develop, new standards and conventions should be proposed.
Acknowledgement
This work was financially supported by the NCN Opus grant 2016/21/B/ST6/02176.
The reference list from the paper itself. Each links out to its DOI / PubMed record.
- 1Biecek (2018) P. Biecek. DALEX: Explainers for Complex Predictive Models in R. Journal of Machine Learning Research , 19(84):1–5, 2018. URL http://jmlr.org/papers/v 19/18-416.html .
- 2Biecek (2019) P. Biecek. Model Development Process. ar Xiv e-prints , Jul 2019. URL https://arxiv.org/abs/1907.04461 .
- 3Biecek and Kosinski (2017) P. Biecek and M. Kosinski. archivist: An R package for managing, recording and restoring data analysis results. Journal of Statistical Software , 82(11):1–28, 2017. doi: 10.18637/jss.v 082.i 11 .
- 4Bischl et al. (2017) B. Bischl, J. Richter, J. Bossek, D. Horn, J. Thomas, and M. Lang. mlr MBO: A Modular Framework for Model-Based Optimization of Expensive Black-Box Functions , 2017.
- 5Caro and Biecek (2017) D. H. Caro and P. Biecek. intsvy: An R package for analyzing international large-scale assessment data. Journal of Statistical Software , 81(7):1–44, 2017. doi: 10.18637/jss.v 081.i 07 .
- 6Casas (2018) P. Casas. Data Science Live Book. https://livebook.datascienceheroes.com/ , 2018. Retrieved on 14 March 2019.
- 7Casas (2019) P. Casas. fun Modeling: Exploratory Data Analysis and Data Preparation Tool-Box Book , 2019. URL https://CRAN.R-project.org/package=fun Modeling . R package version 1.7.
- 8Chang et al. (2019) W. Chang, J. Cheng, J. Allaire, Y. Xie, and J. Mc Pherson. shiny: Web Application Framework for R , 2019. URL https://CRAN.R-project.org/package=shiny . R package version 1.3.2.
