TL;DR
This paper introduces BPPart and BPMax, fast algorithms for RNA-RNA interaction prediction based on a simple base pair counting model, offering significant speed improvements over previous thermodynamic models.
Contribution
The study presents novel, simplified algorithms BPPart and BPMax for RNA-RNA interaction prediction that are much faster and require less memory than existing thermodynamic-based methods.
Findings
BPPart and BPMax are 225 and 1350 times faster than piRNA.
High correlation with piRNA predictions (over 0.85) at different temperatures.
Discovery of potential RNA partners SNORD3D and TRAF3.
Abstract
RNA-RNA interaction (RRI) is ubiquitous and has complex roles in the cellular functions. In human health studies, miRNA-target and lncRNAs are among an elite class of RRIs that have been extensively studied. Bacterial ncRNA-target and RNA interference are other classes of RRIs that have received significant attention. In recent studies, mRNA-mRNA interaction instances have been observed, where both partners appear in the same pathway without any direct link between them, or any prior knowledge about their relationship. Those recently discovered cases suggest that RRI scope is much wider than those aforementioned elite classes. We revisit our RNA-RNA interaction partition function algorithm, piRNA, which computes the partition function, base-pairing probabilities, and structure for the comprehensive Turner energy model using 96 different dynamic programming tables. In this study, we…
Click any figure to enlarge with its caption.
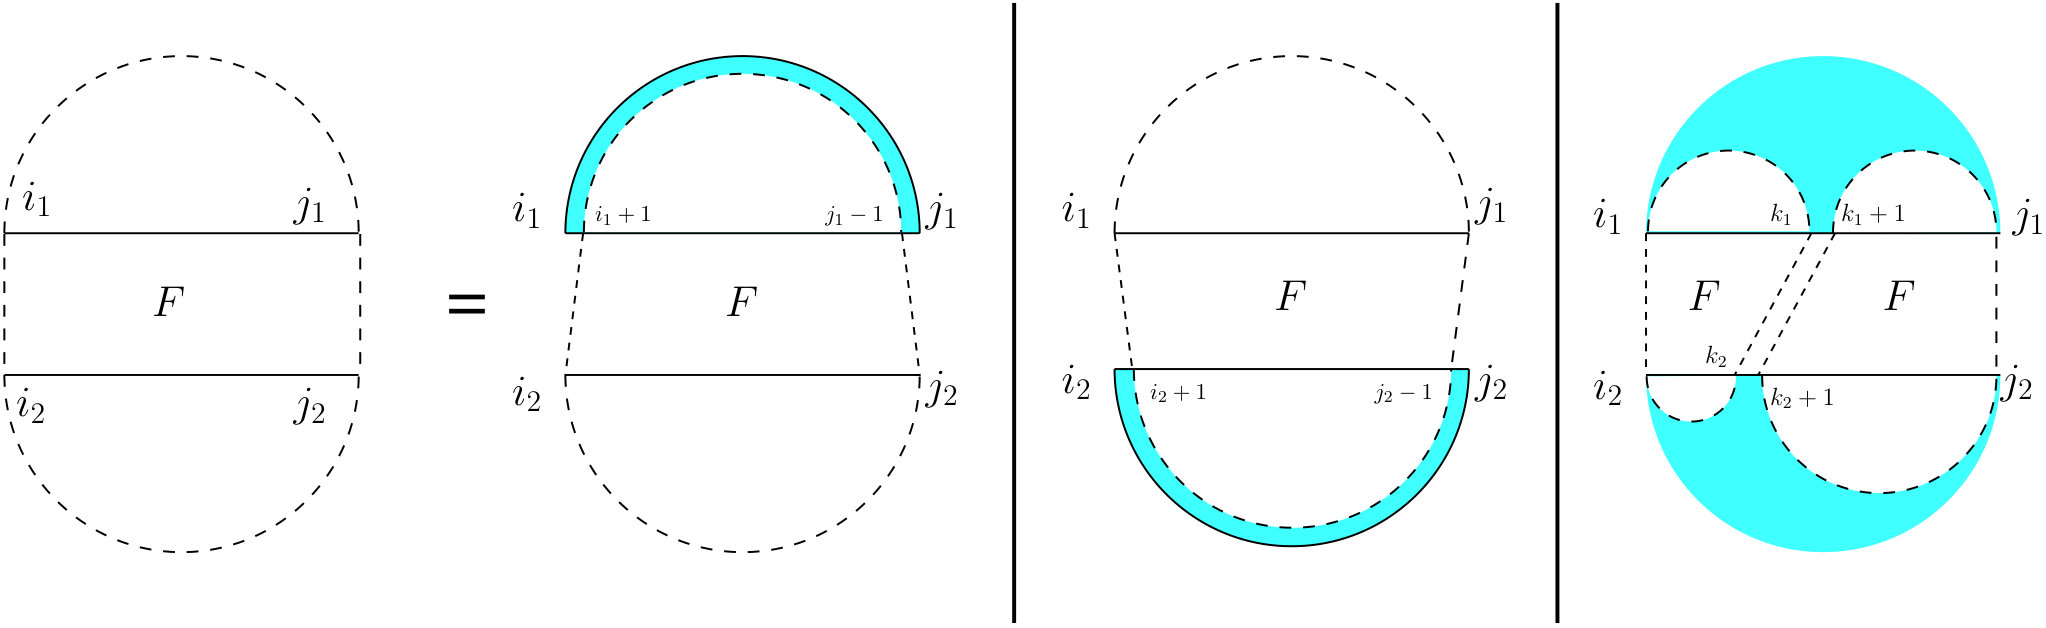 Figure 1
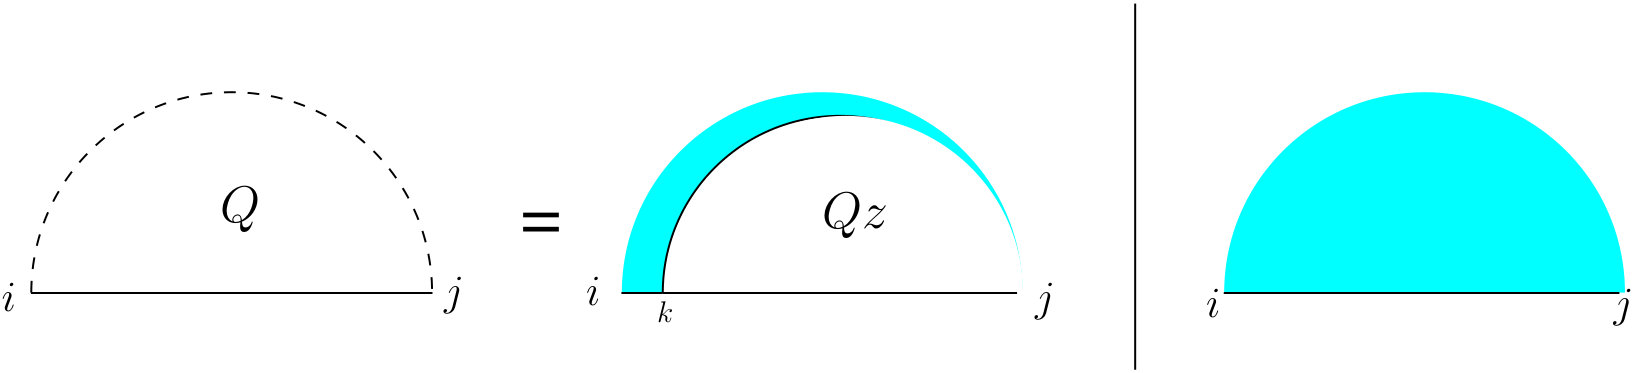 Figure 2
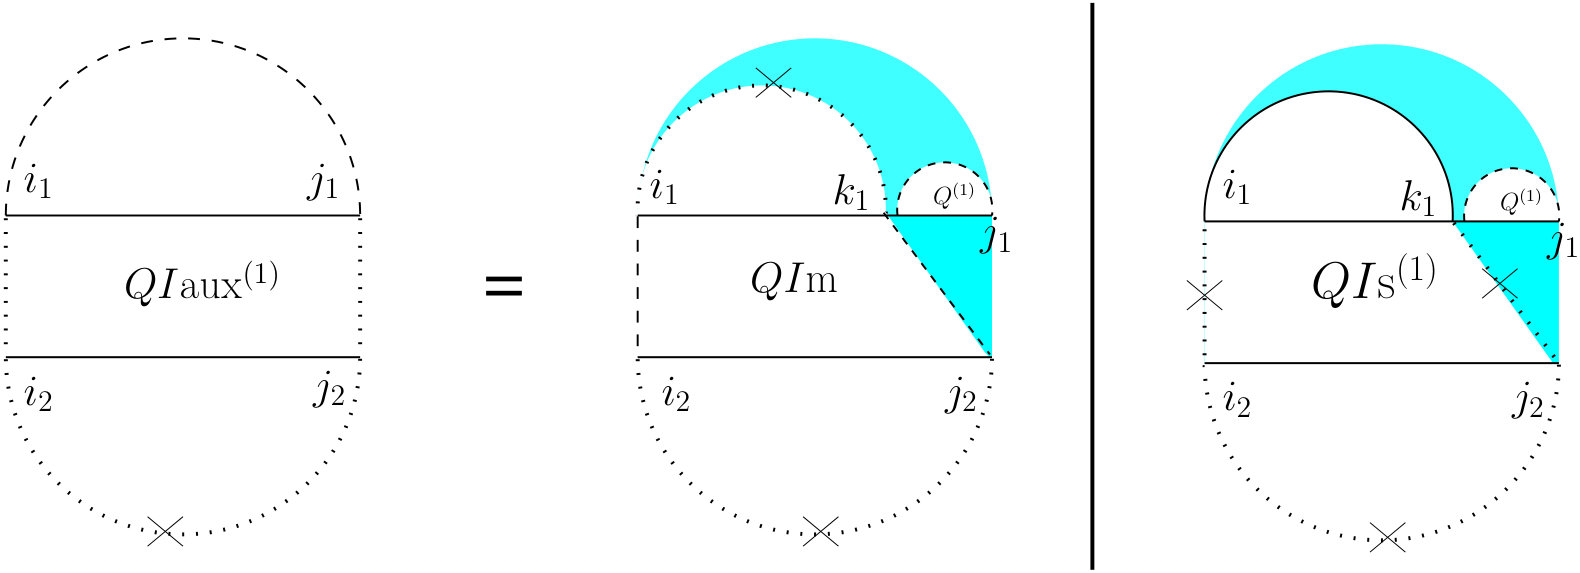 Figure 3
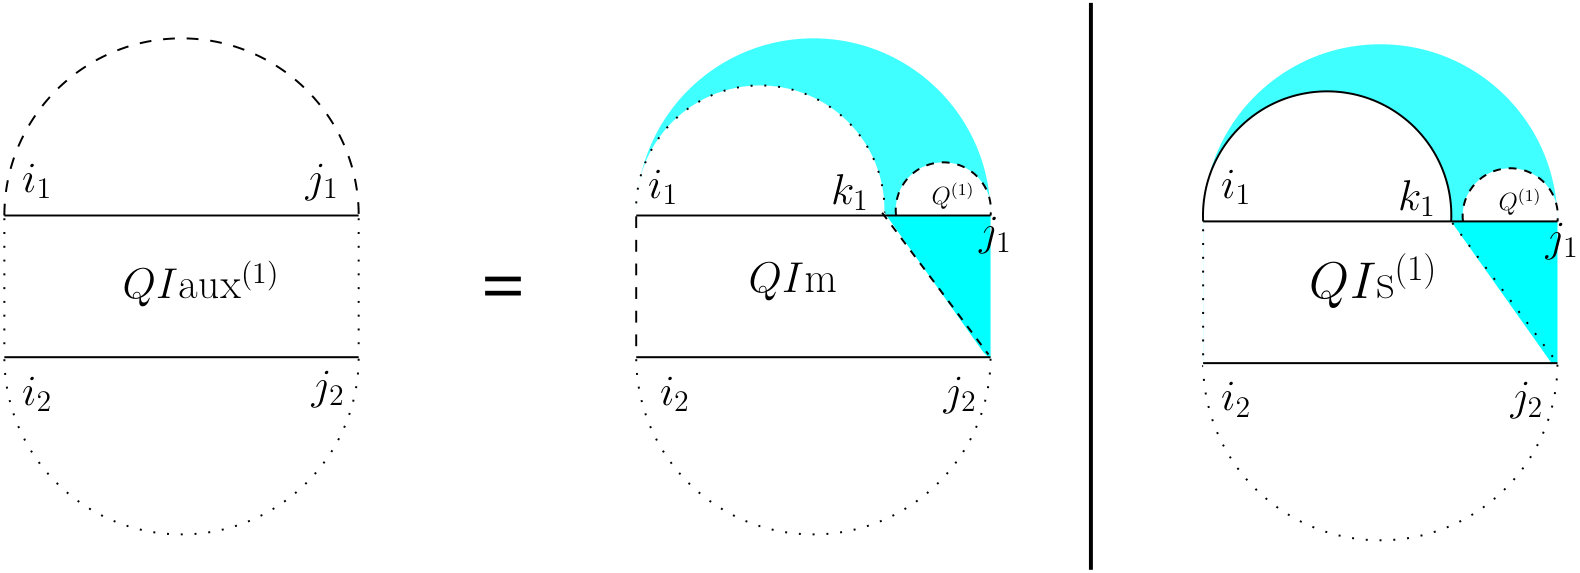 Figure 4
 Figure 5
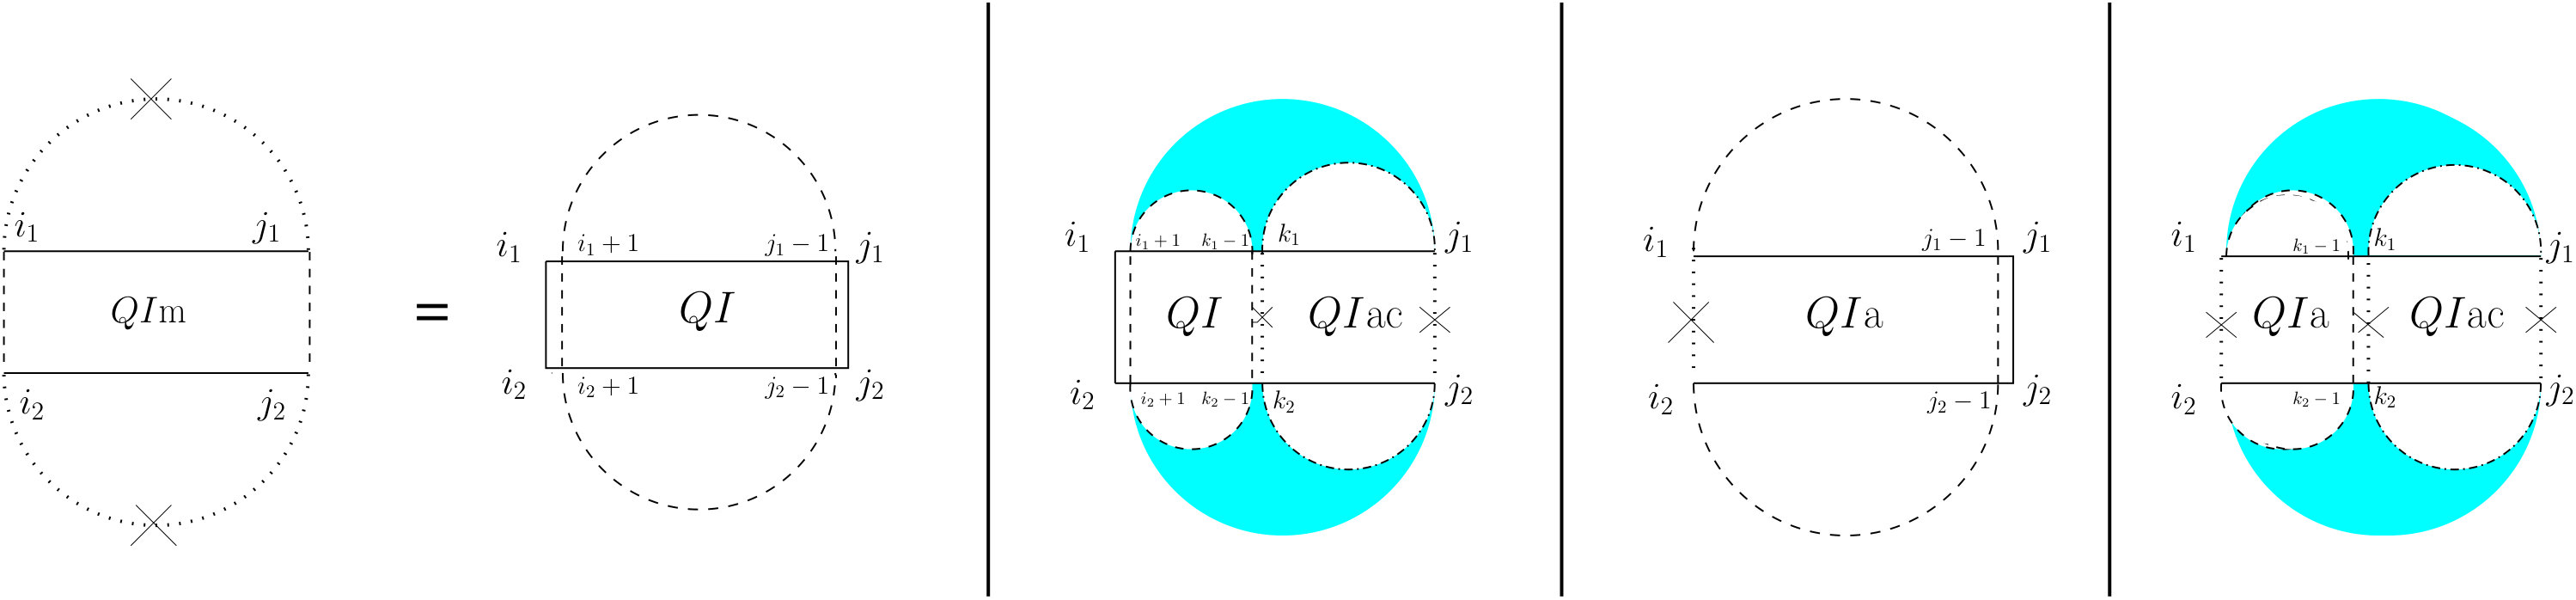 Figure 6
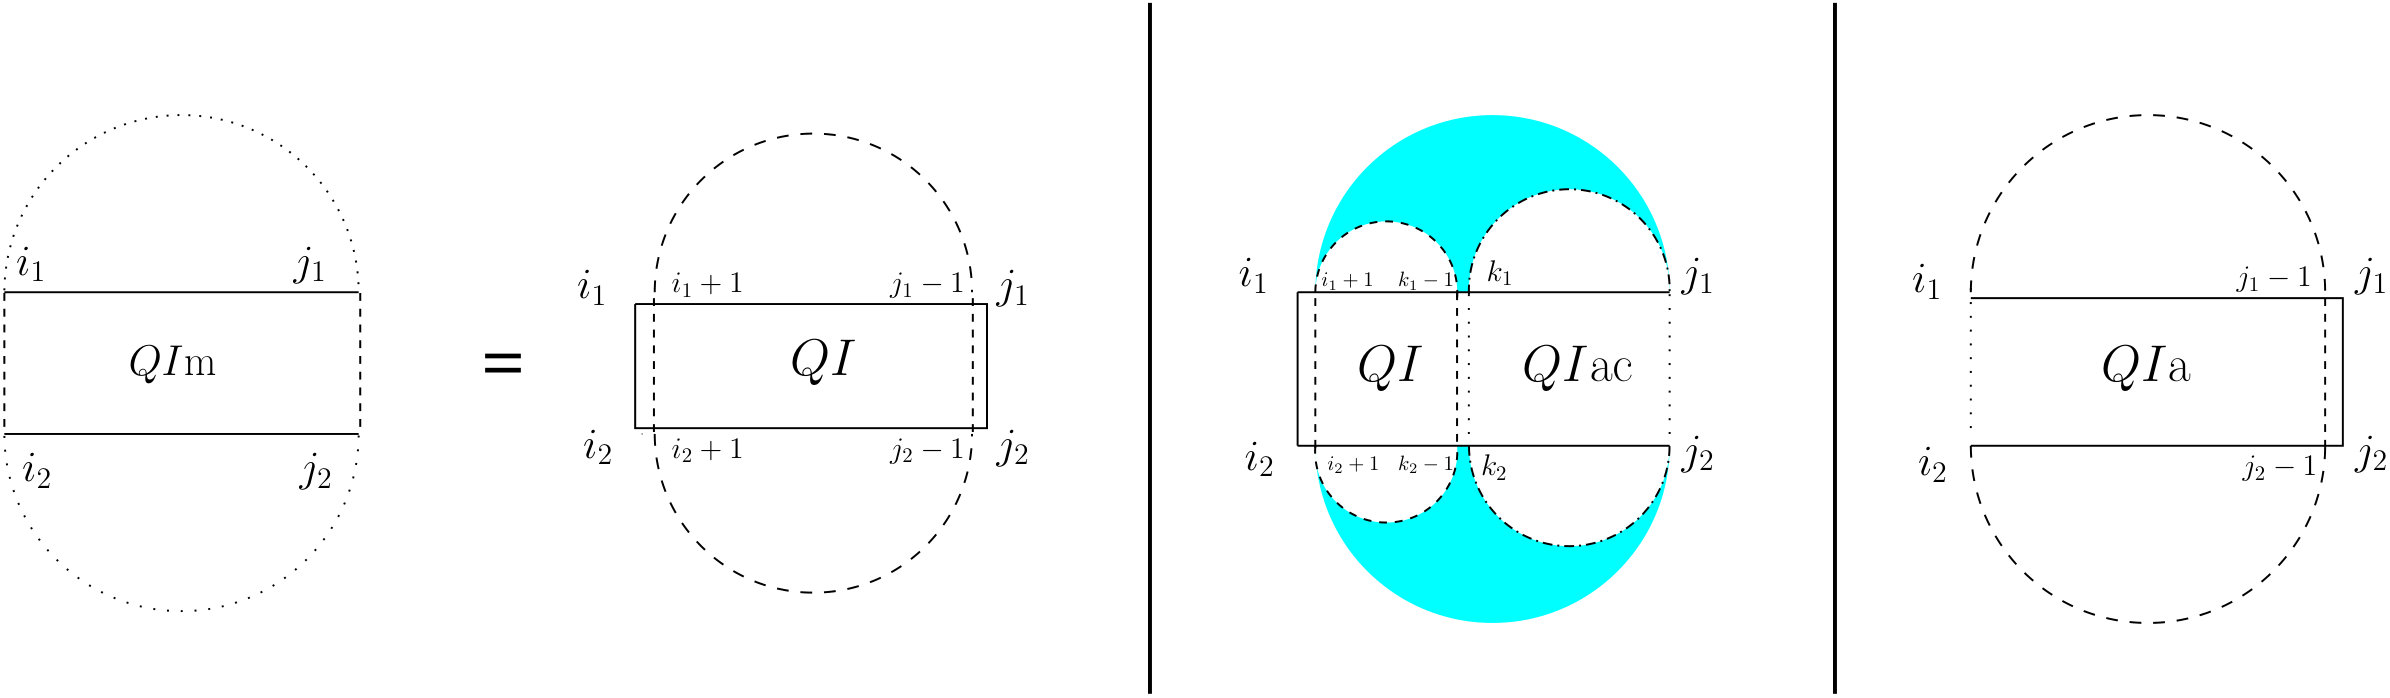 Figure 7
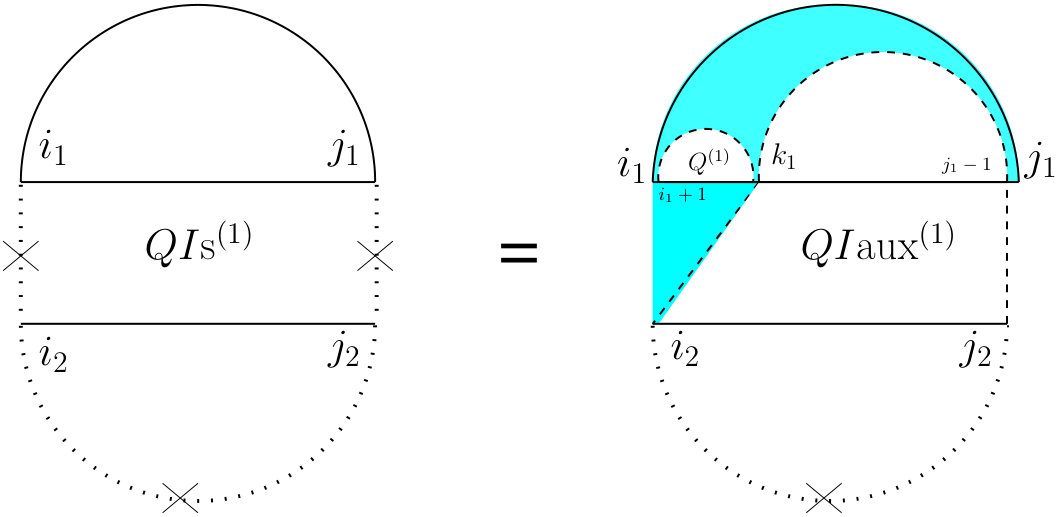 Figure 8
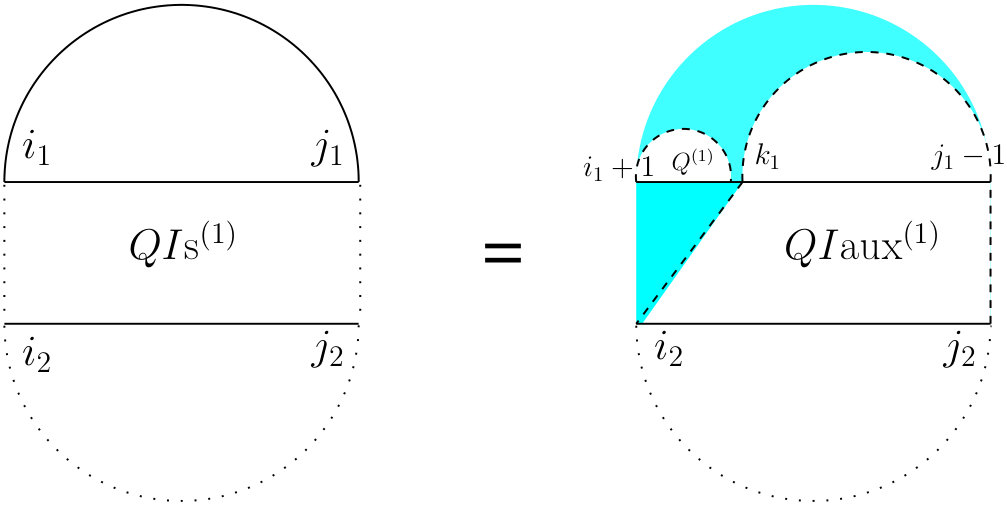 Figure 9
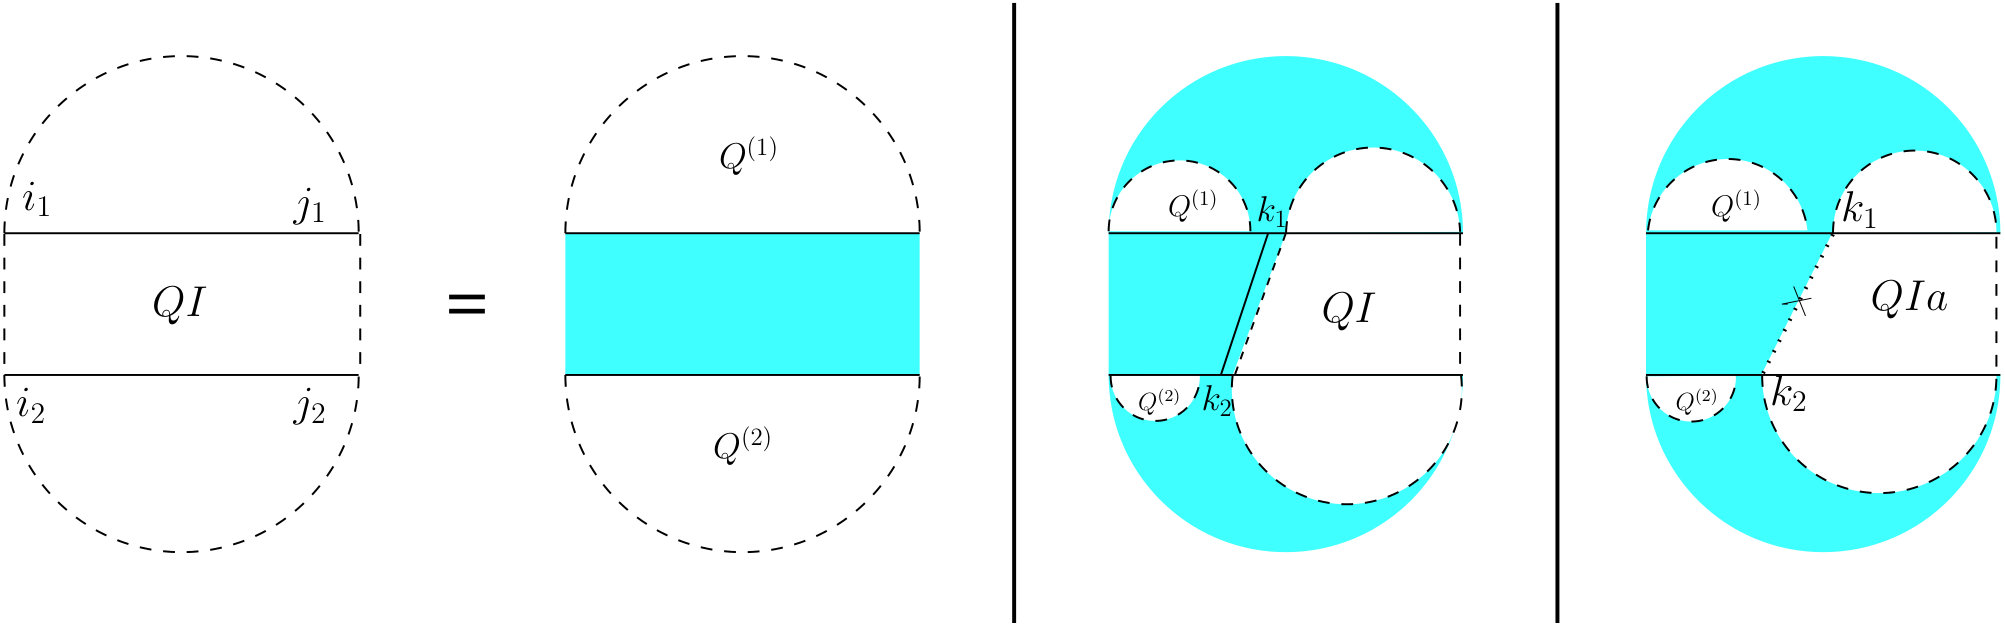 Figure 10
 Figure 11
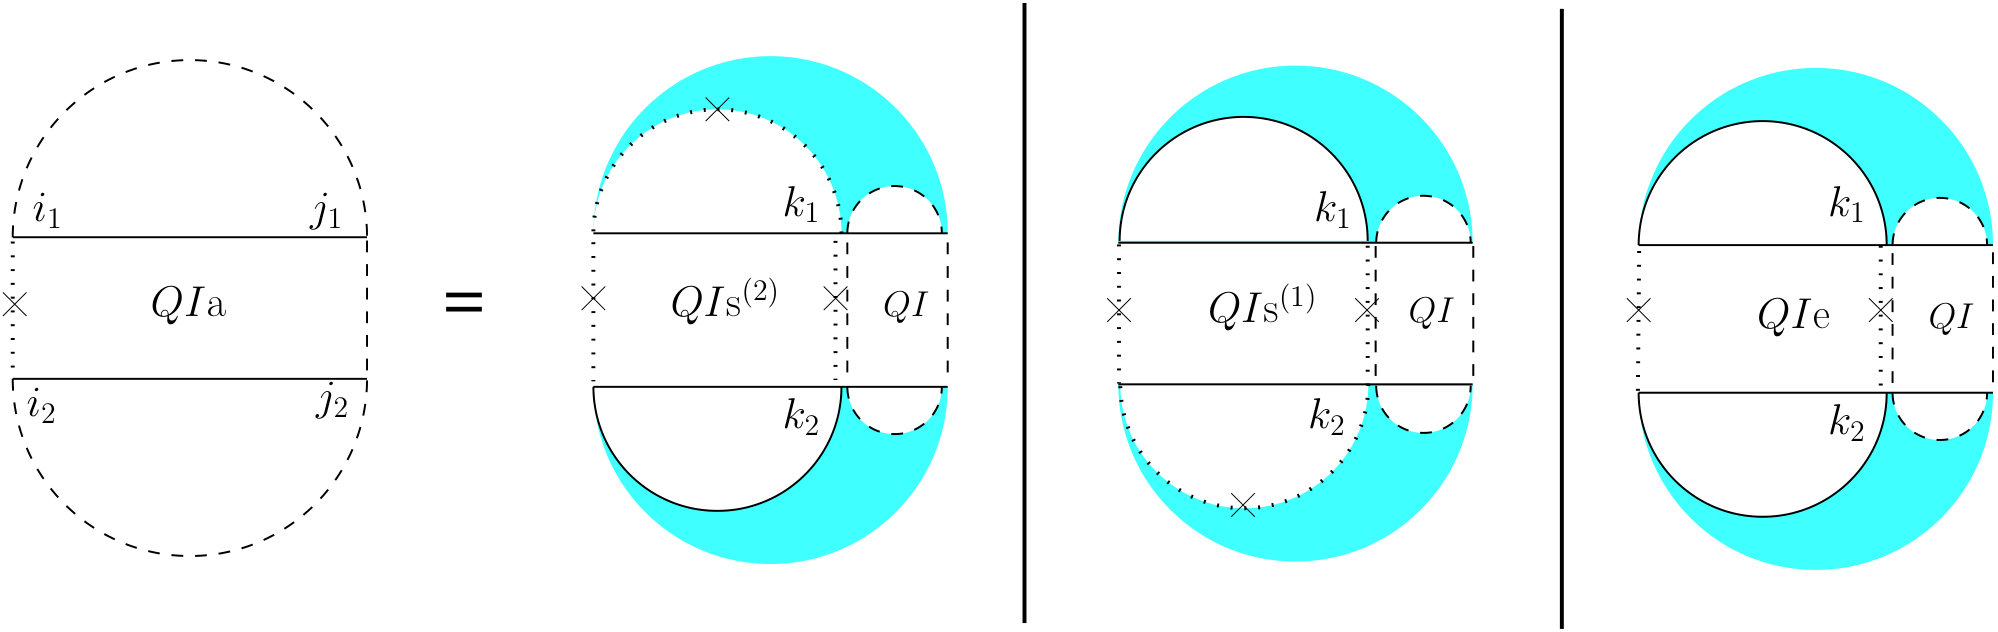 Figure 12
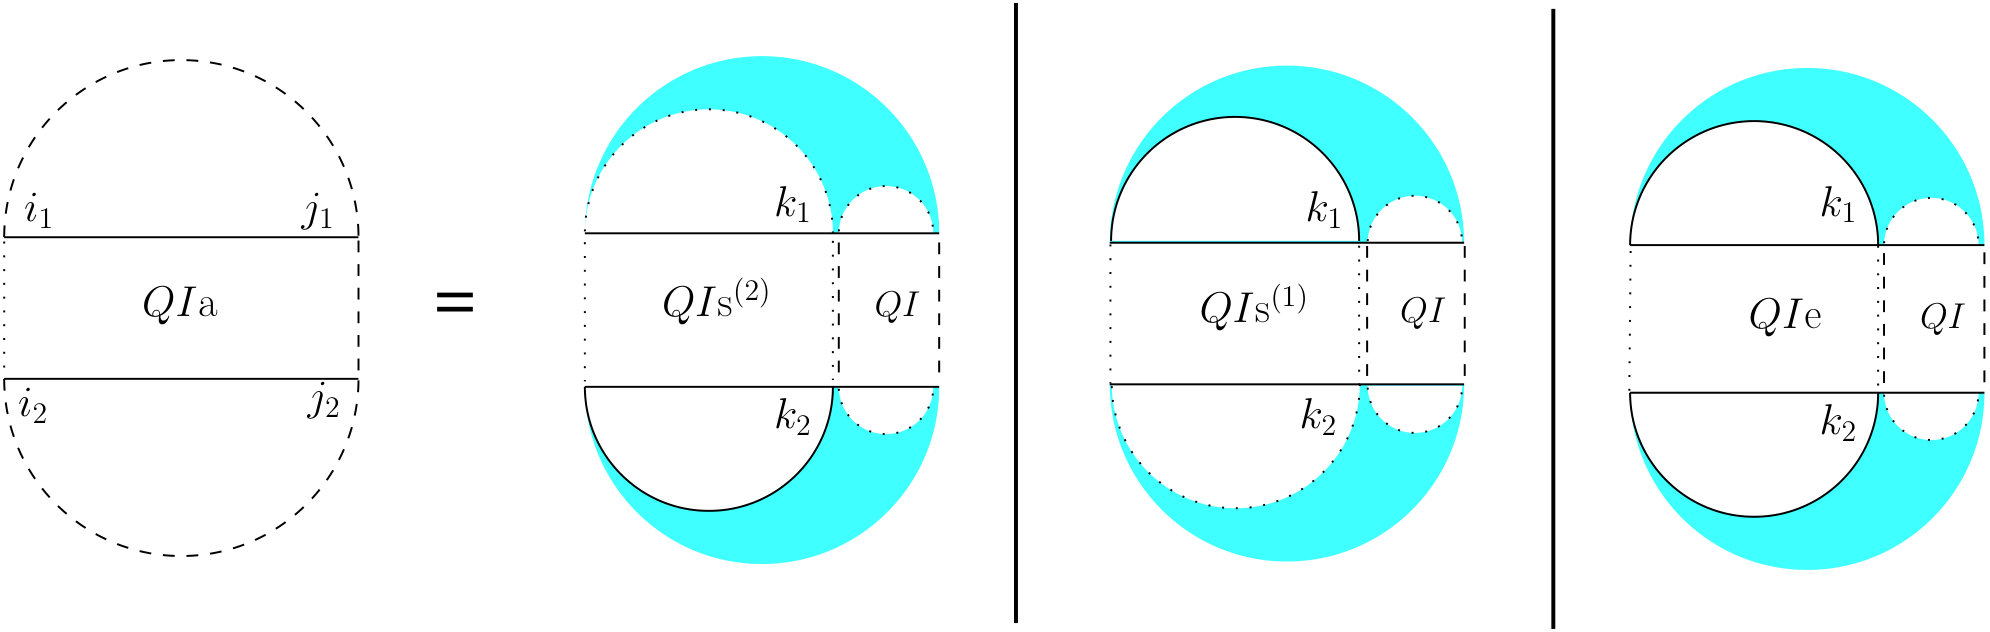 Figure 13
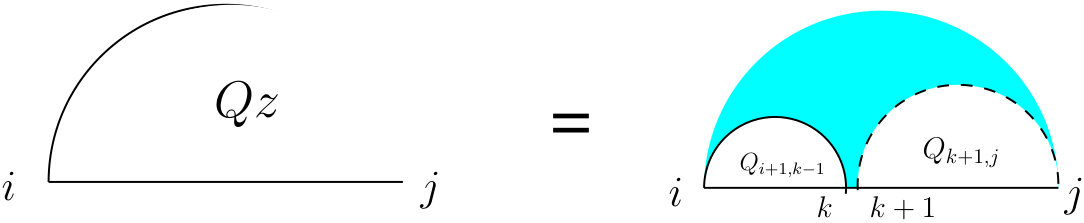 Figure 14
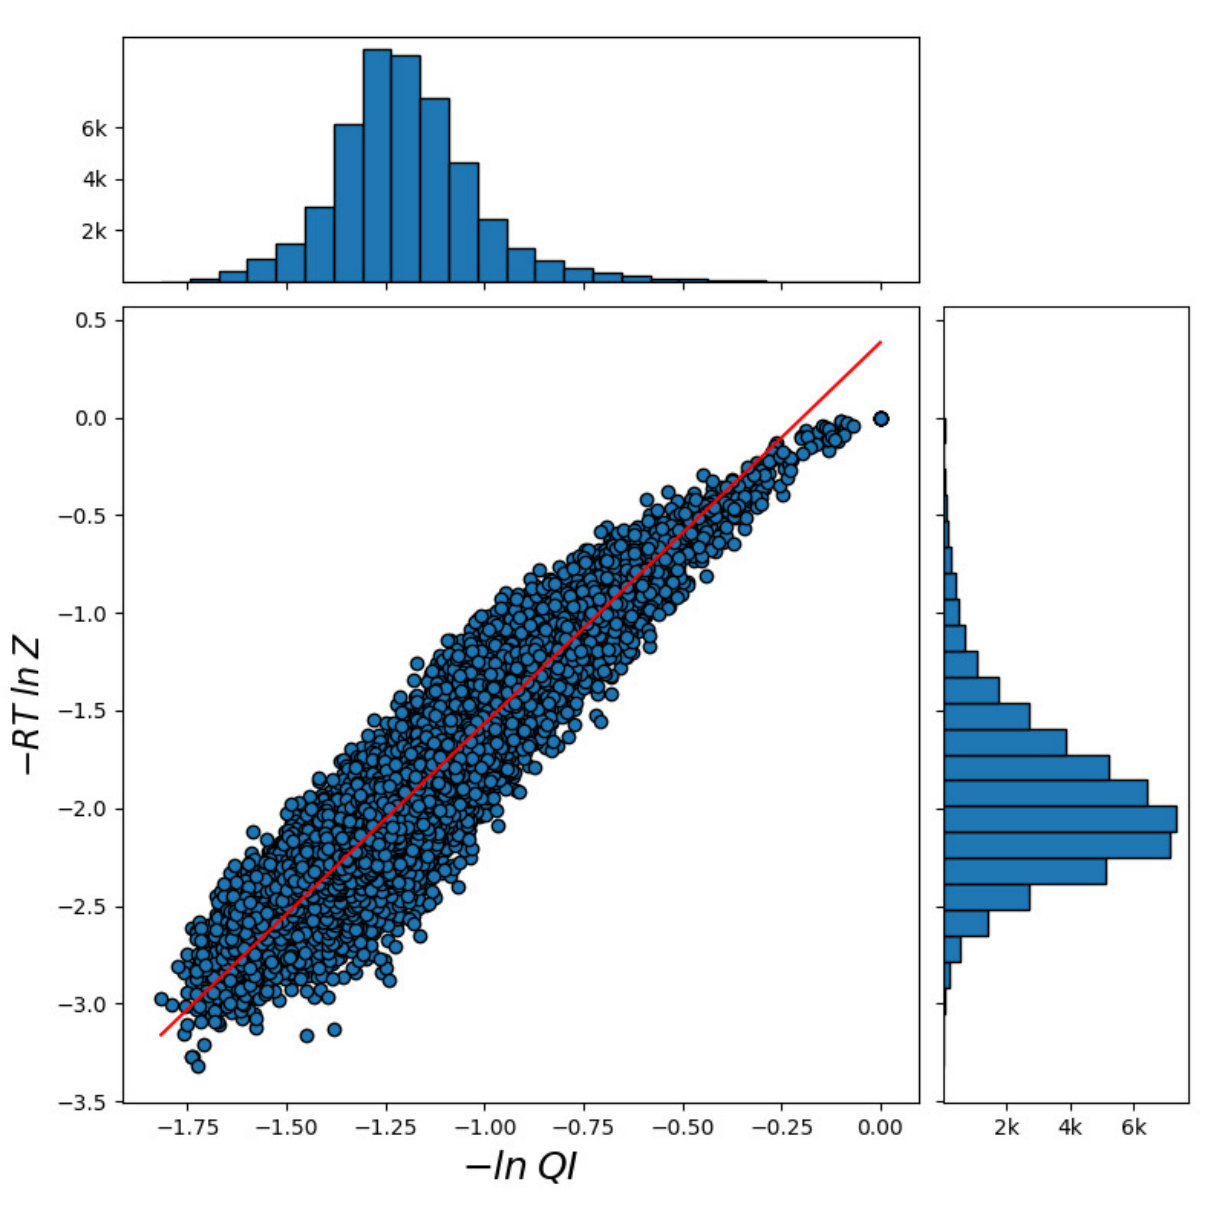 Figure 15
 Figure 16
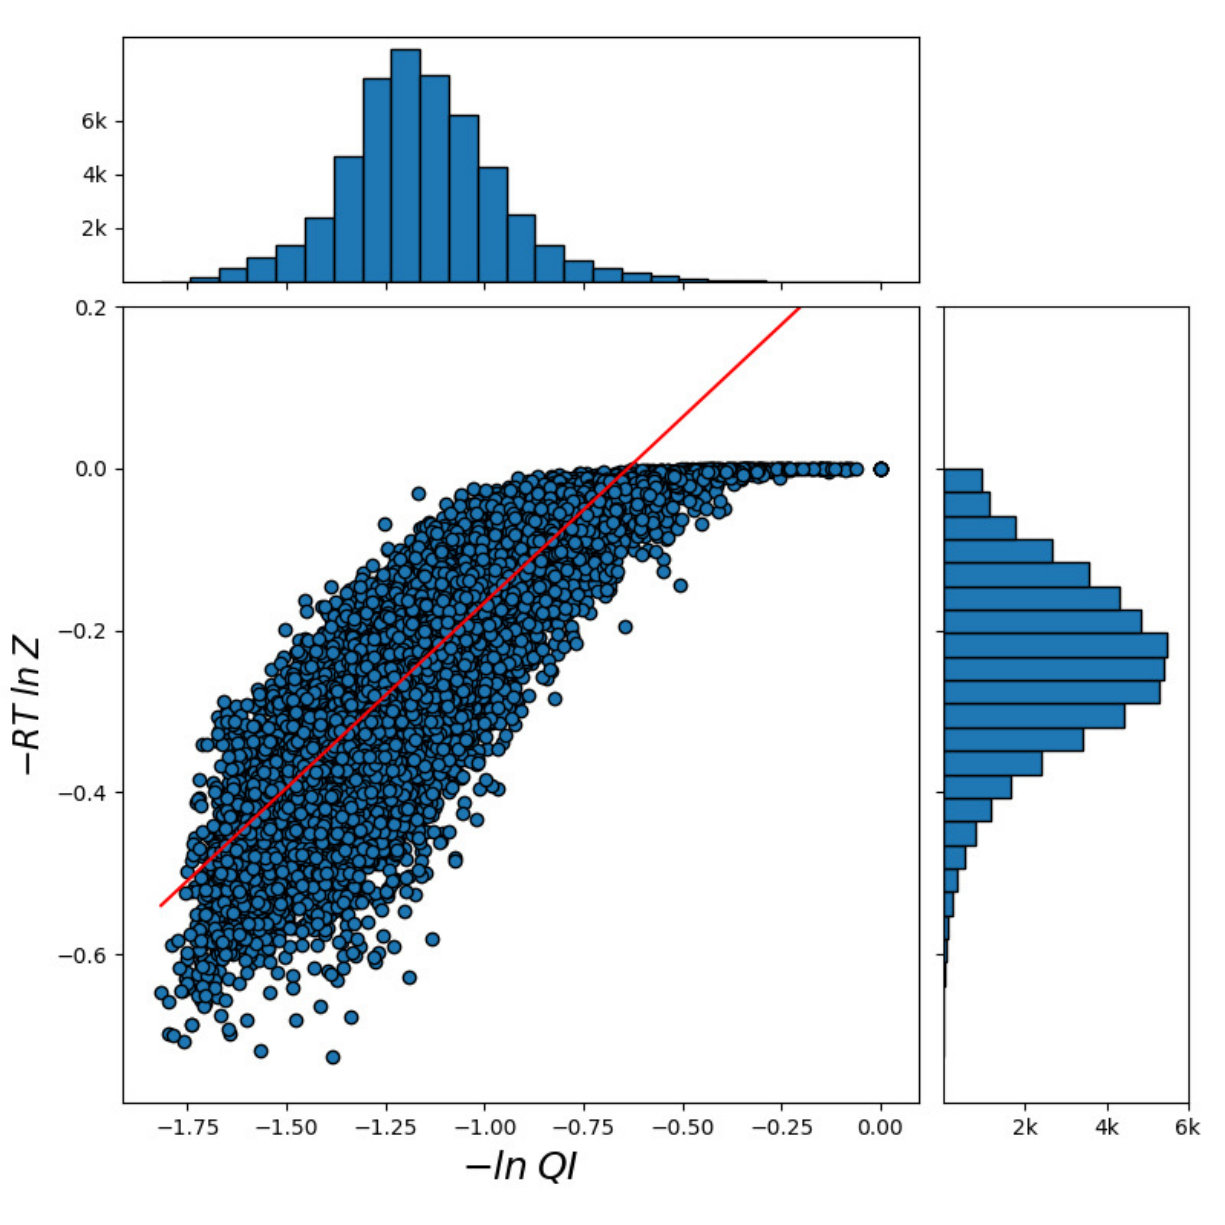 Figure 17
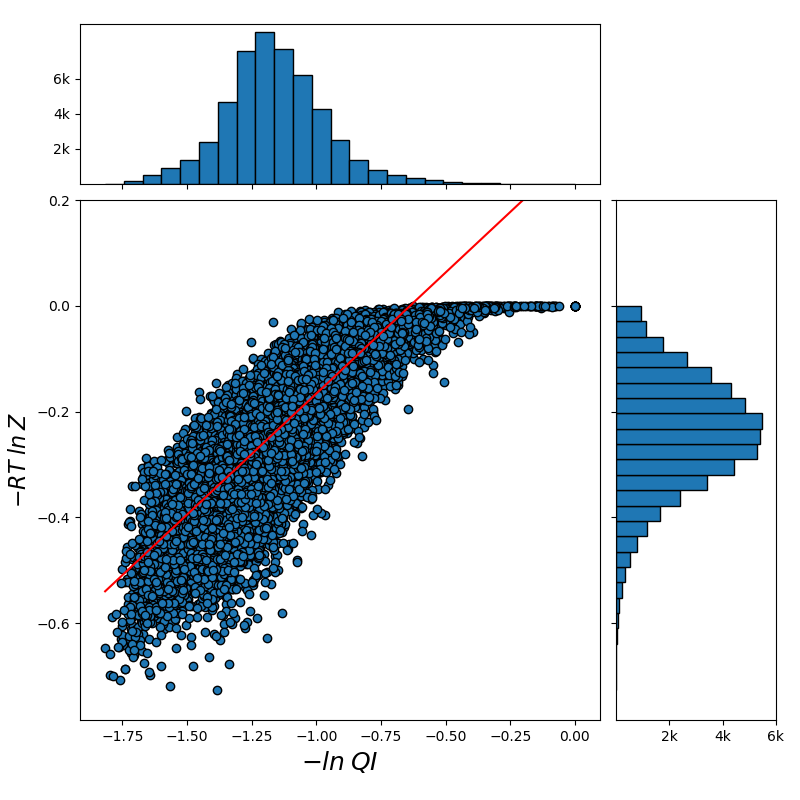 Figure 18
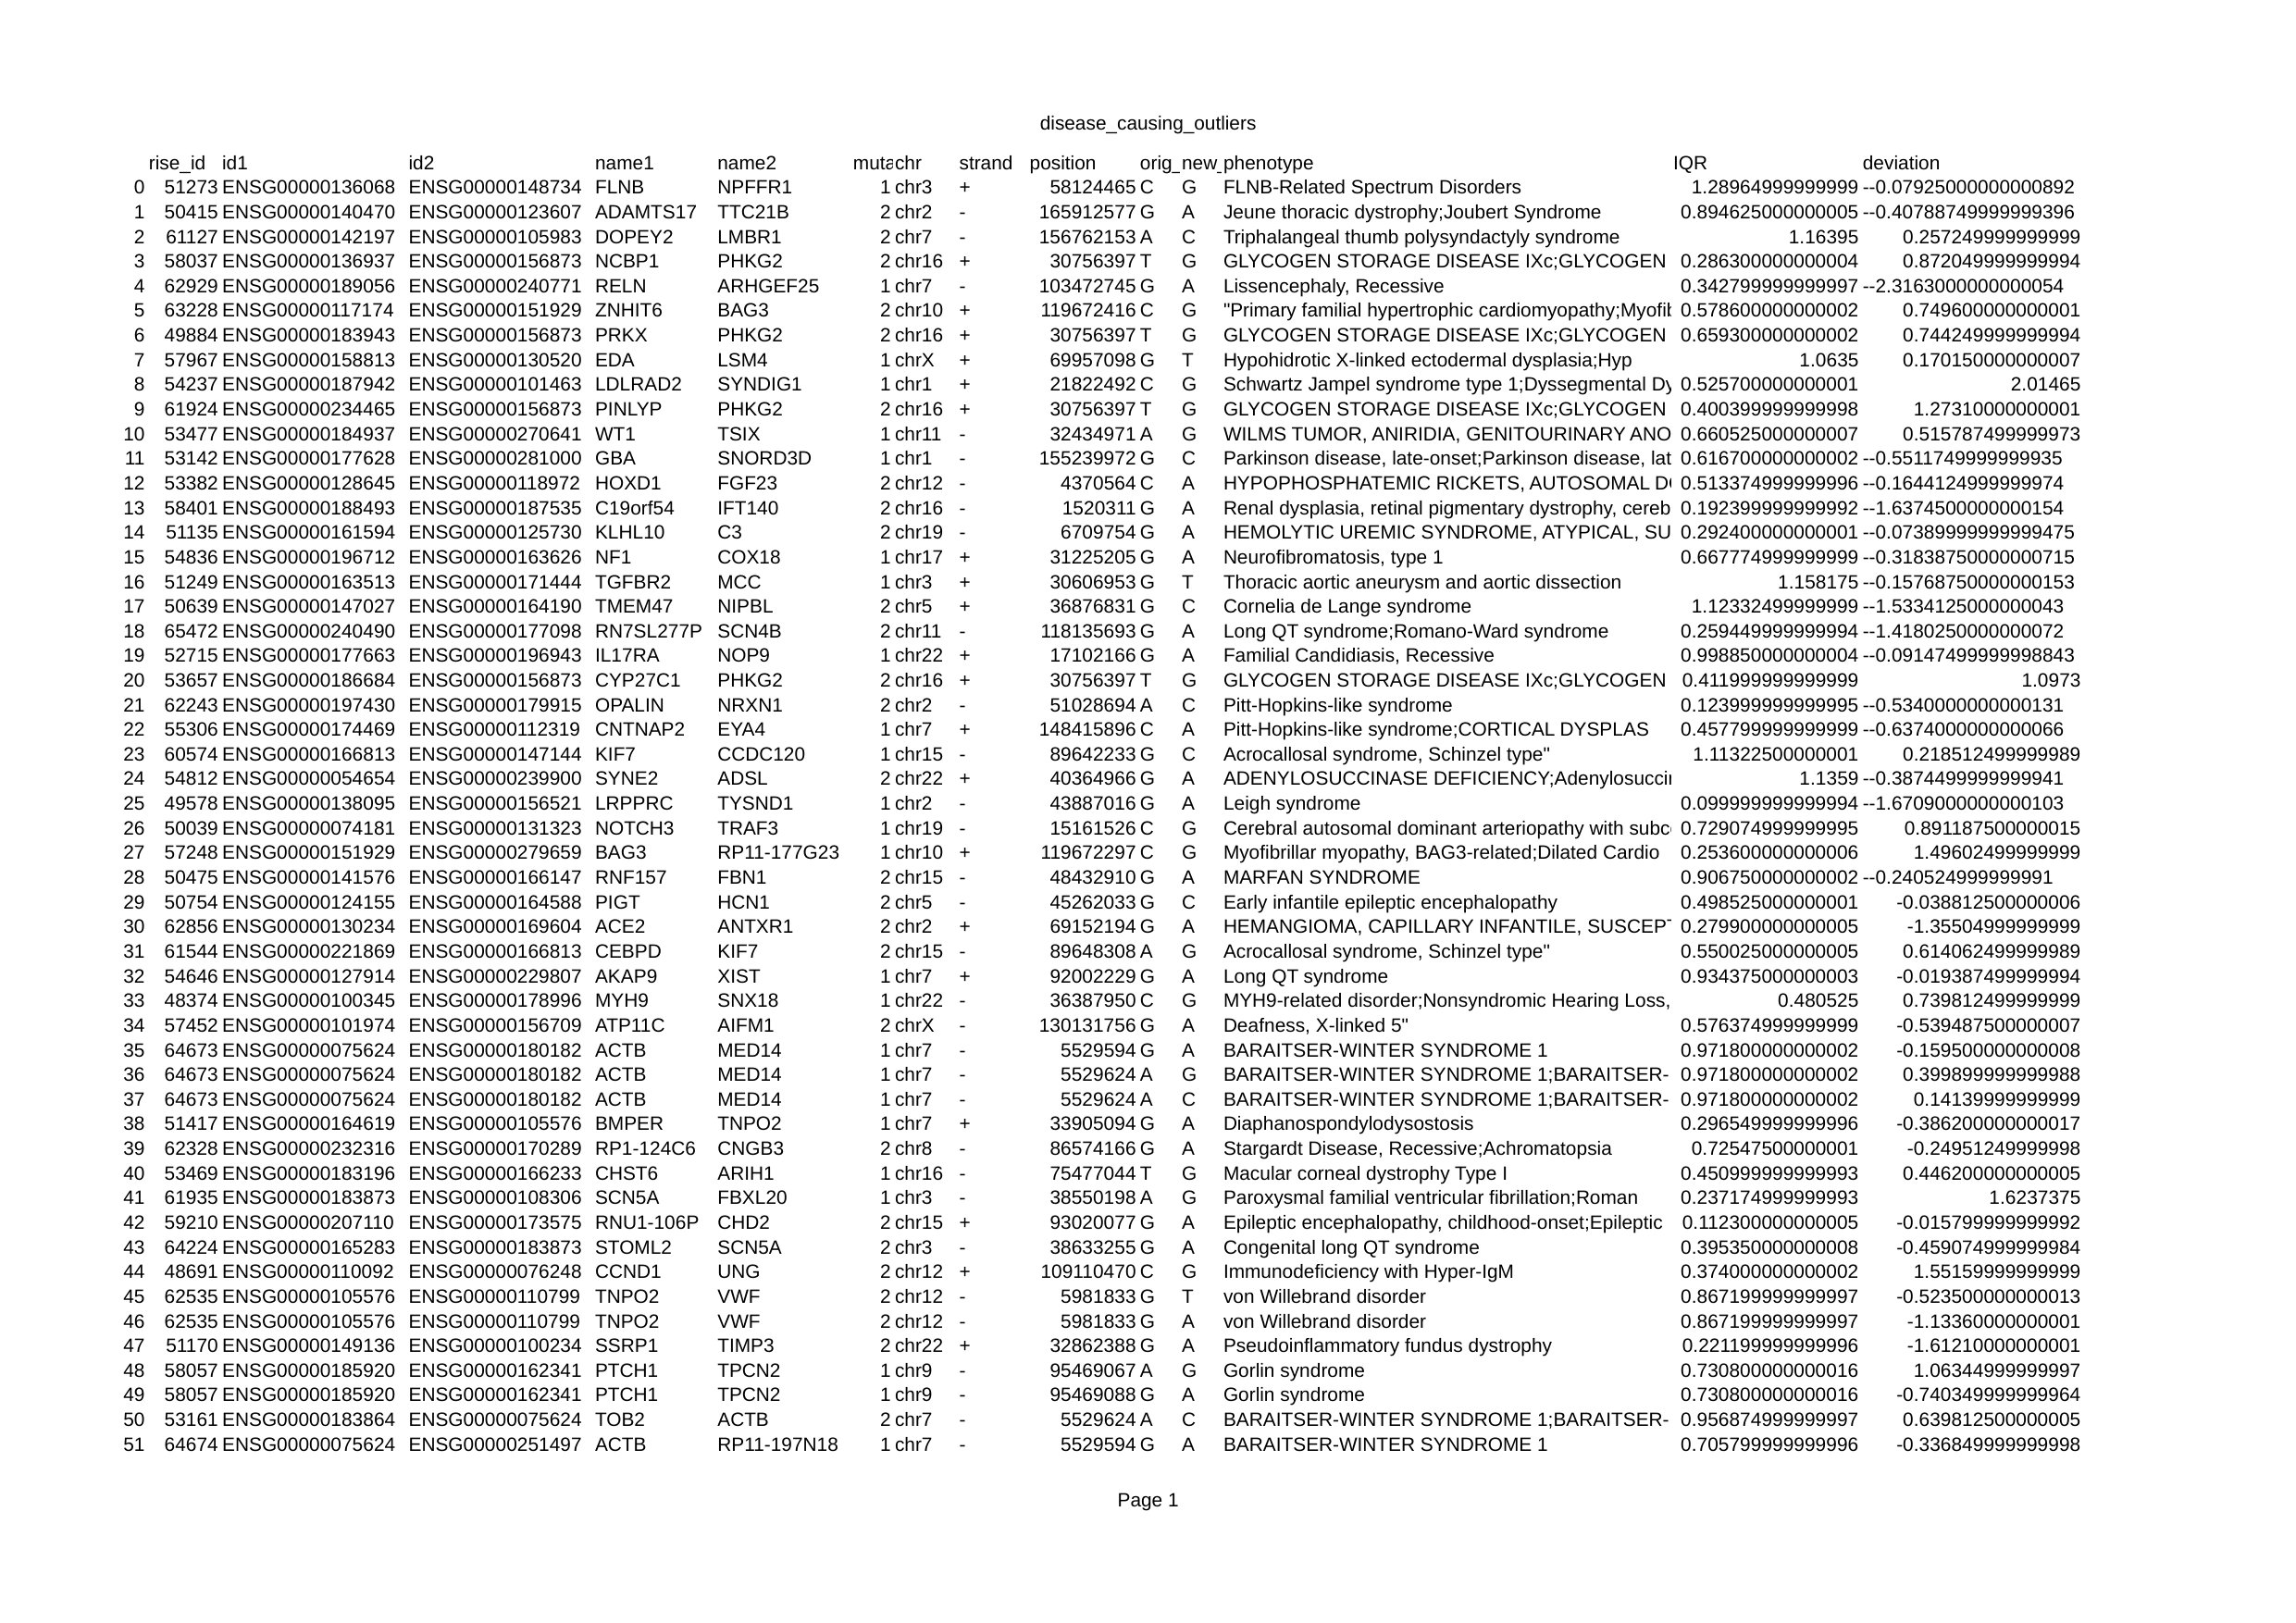 Figure 19
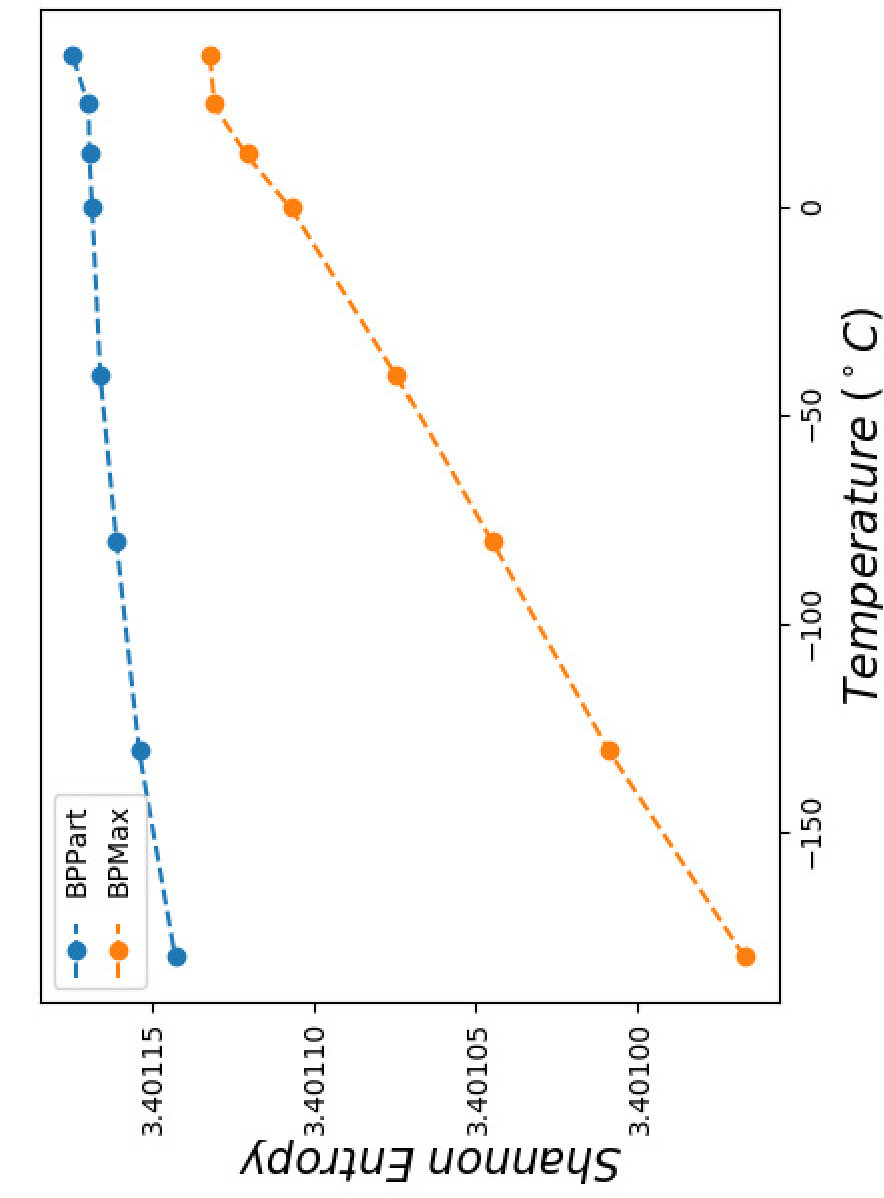 Figure 20
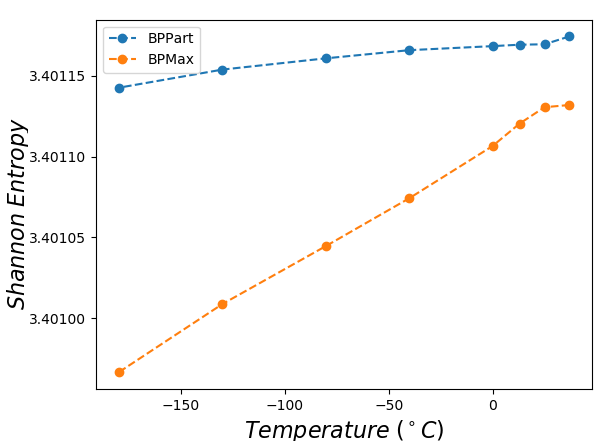 Figure 21
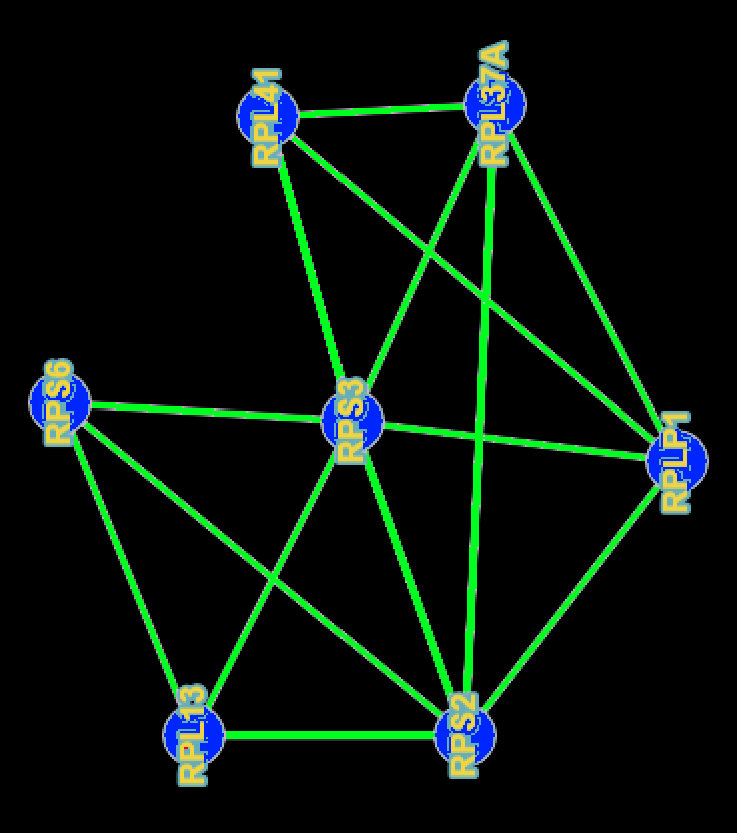 Figure 24
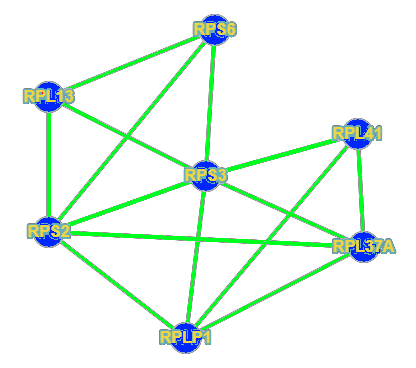 Figure 25
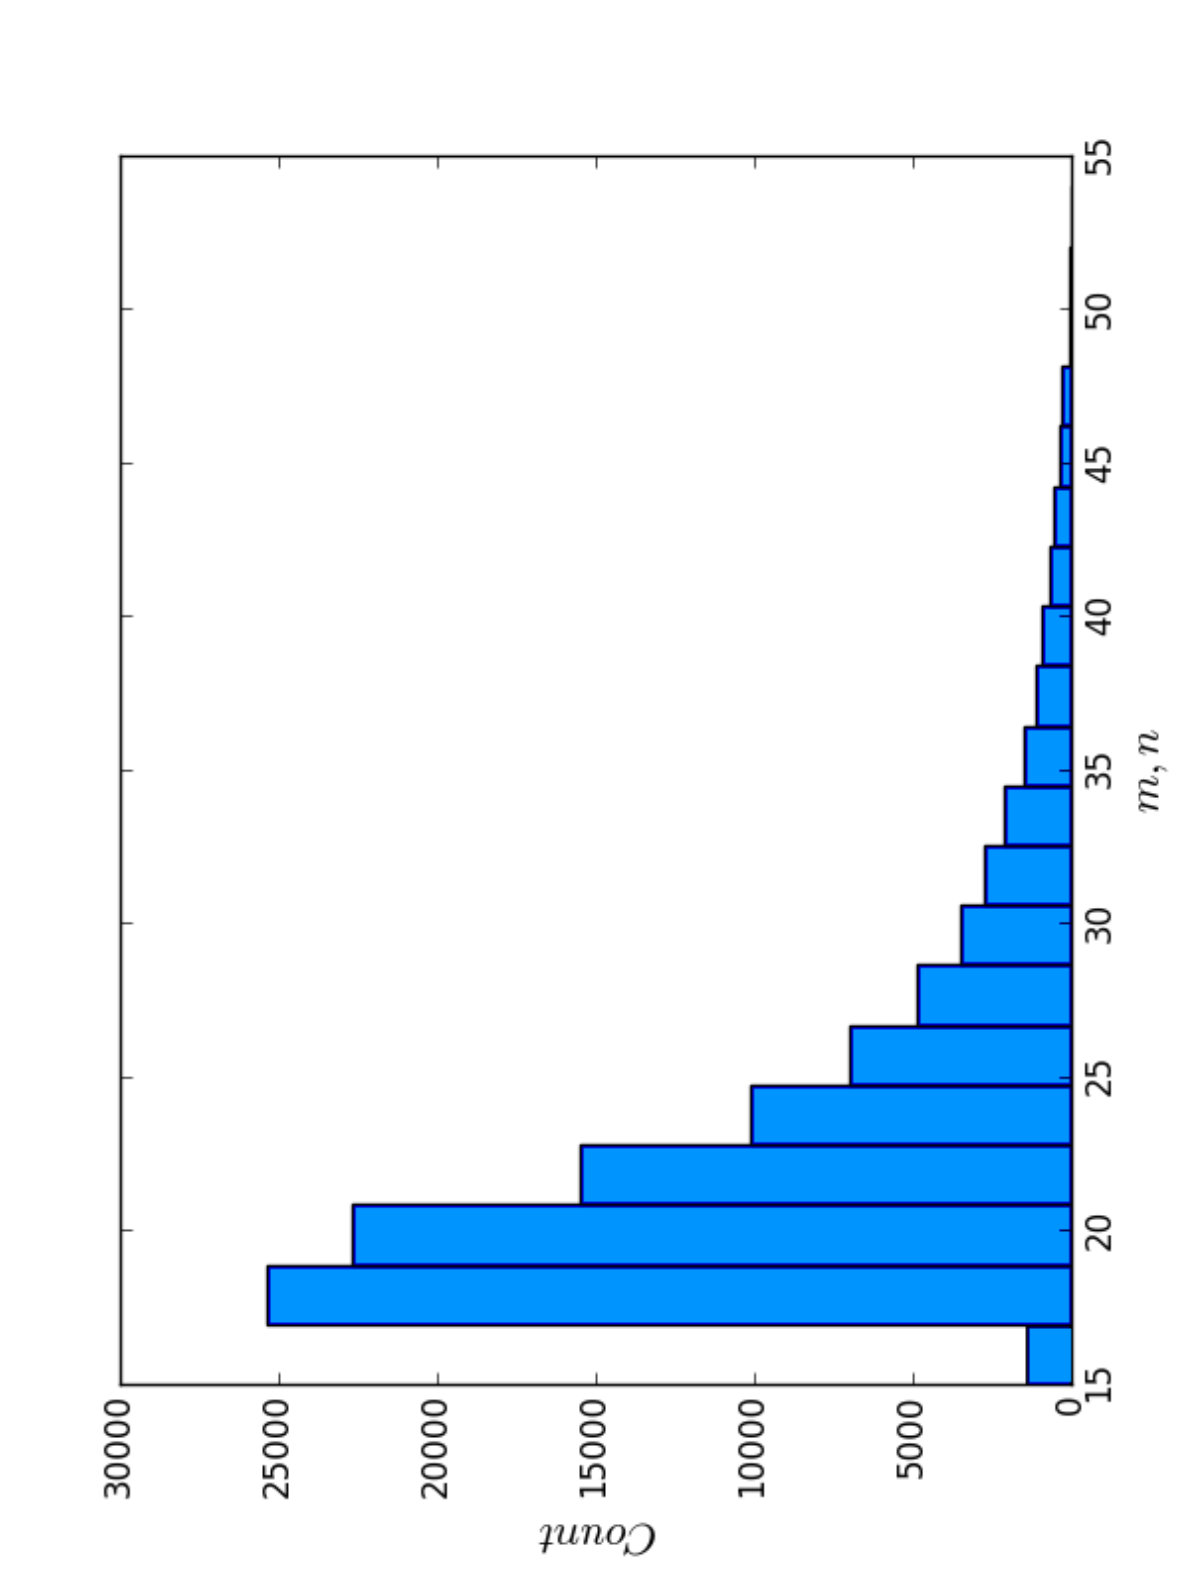 Figure 26
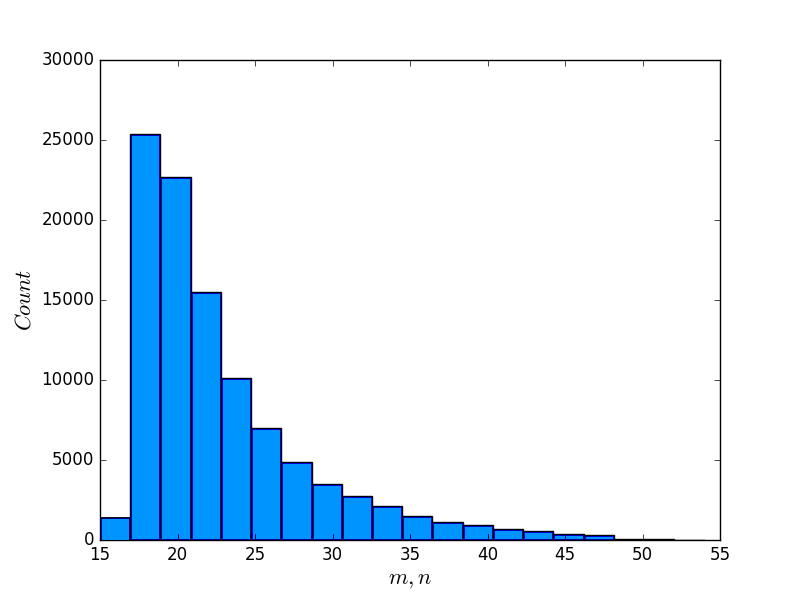 Figure 27
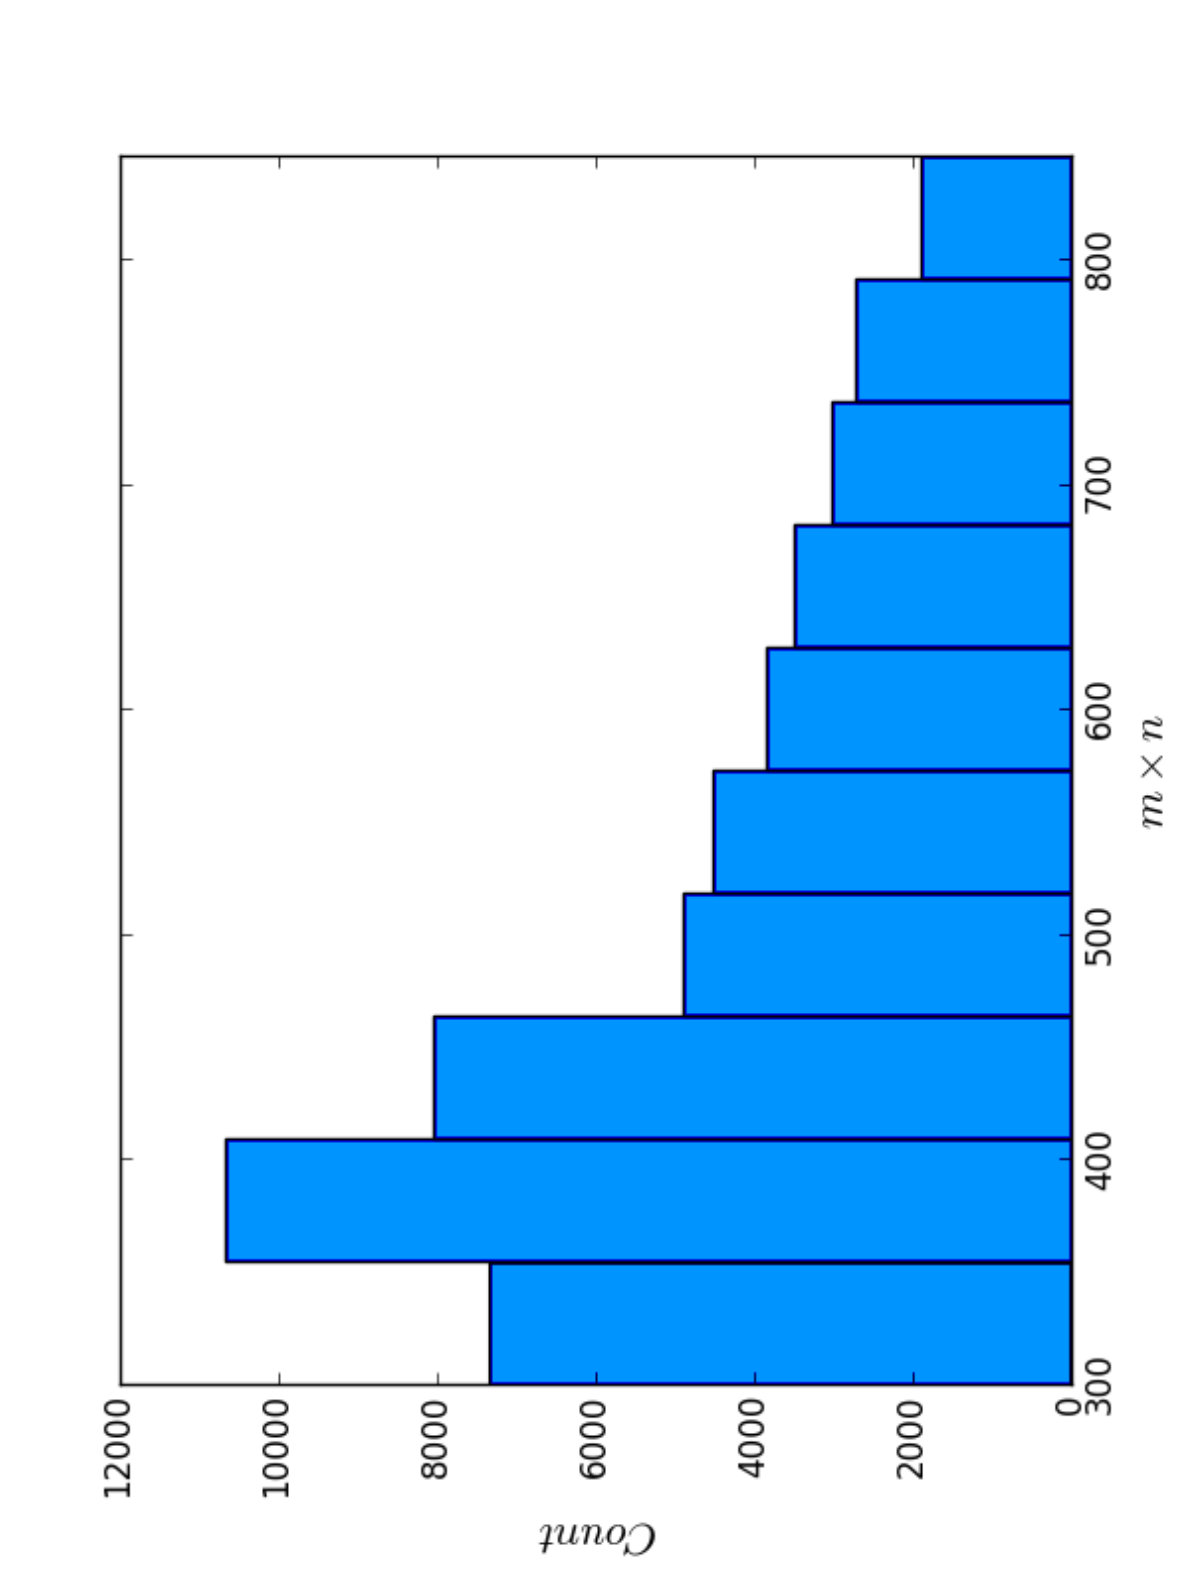 Figure 28
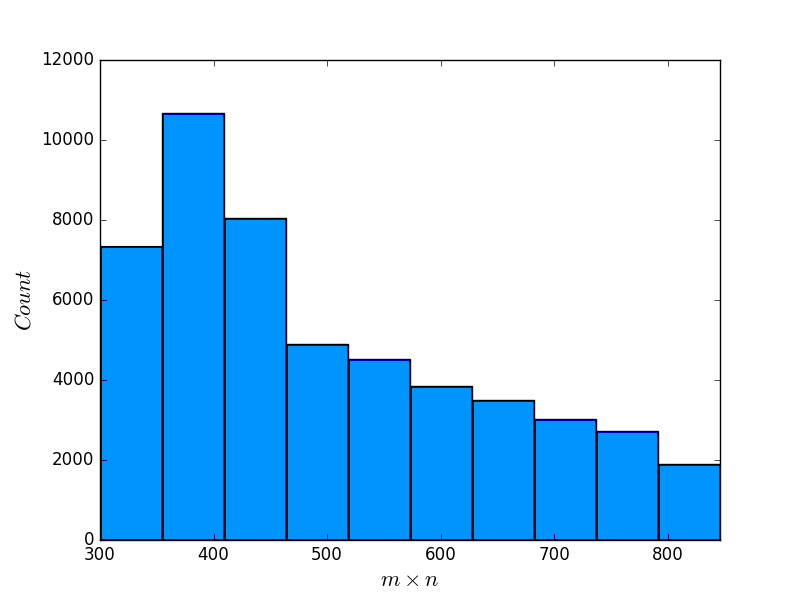 Figure 29
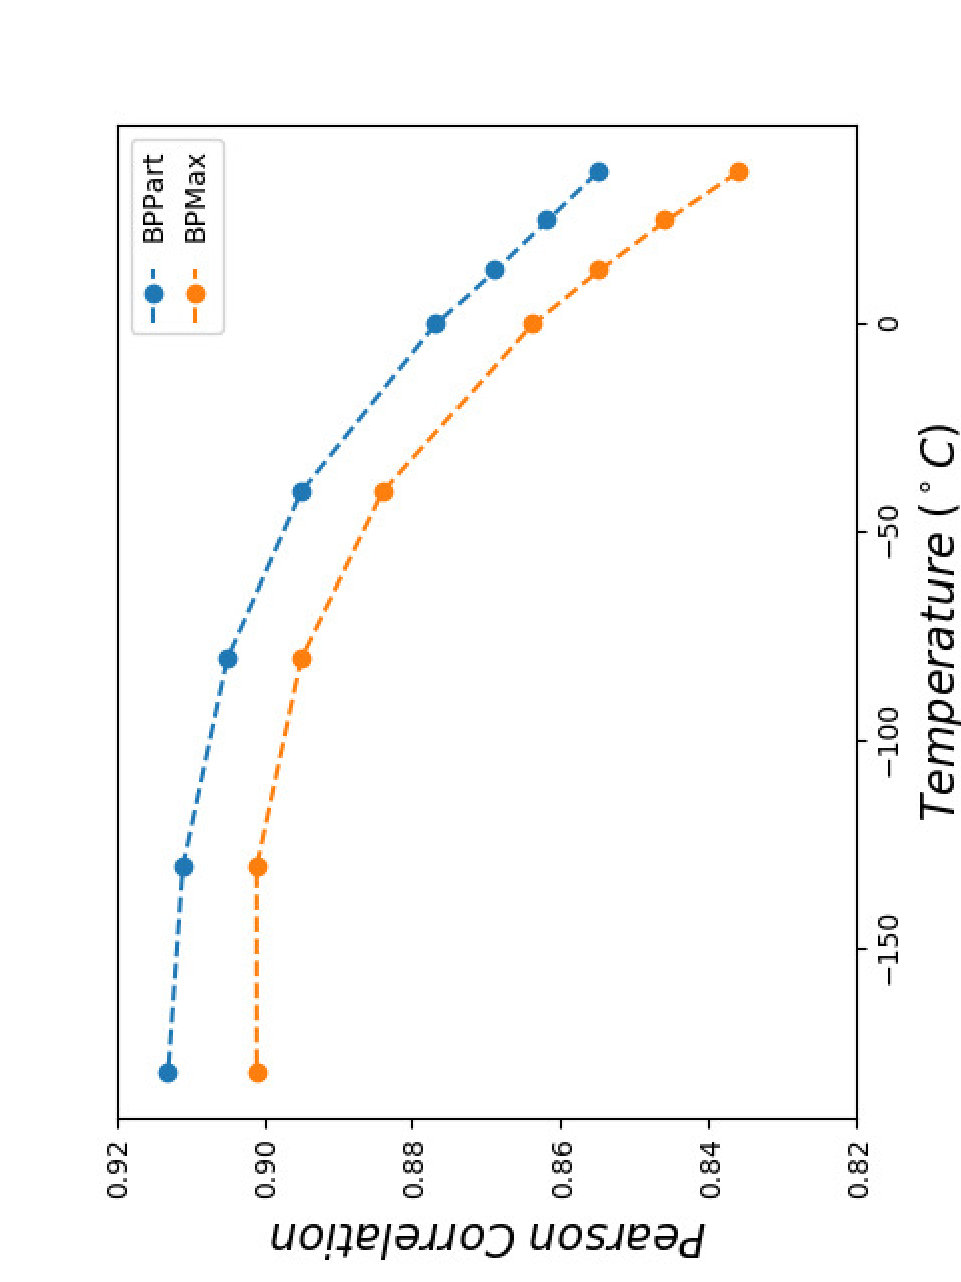 Figure 30
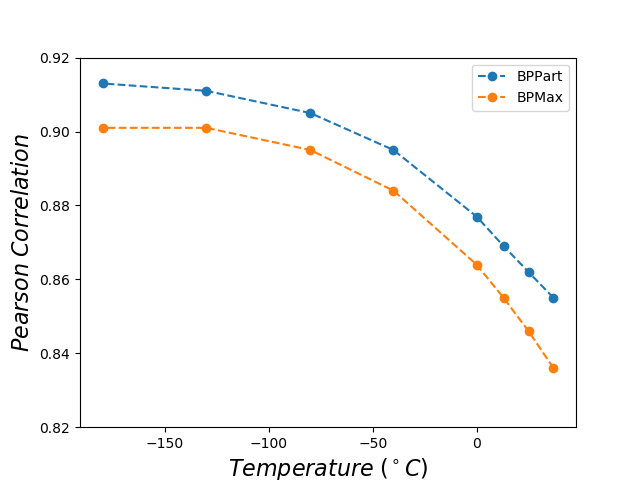 Figure 31
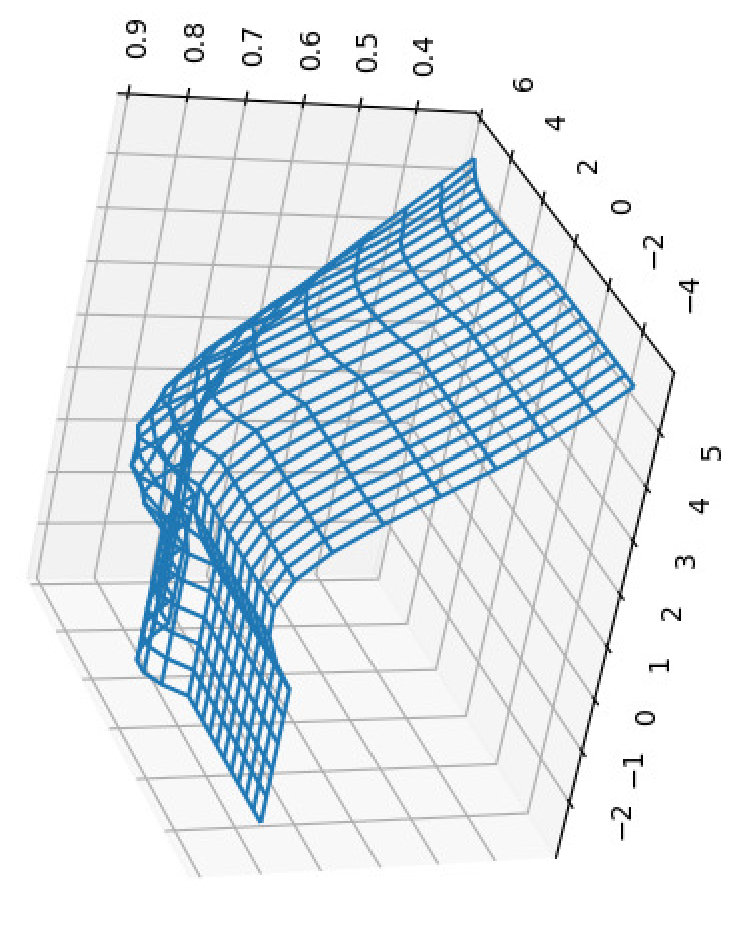 Figure 34
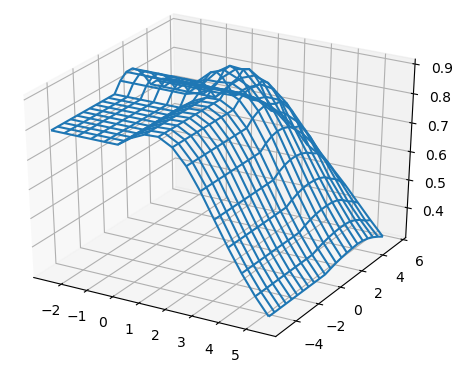 Figure 35
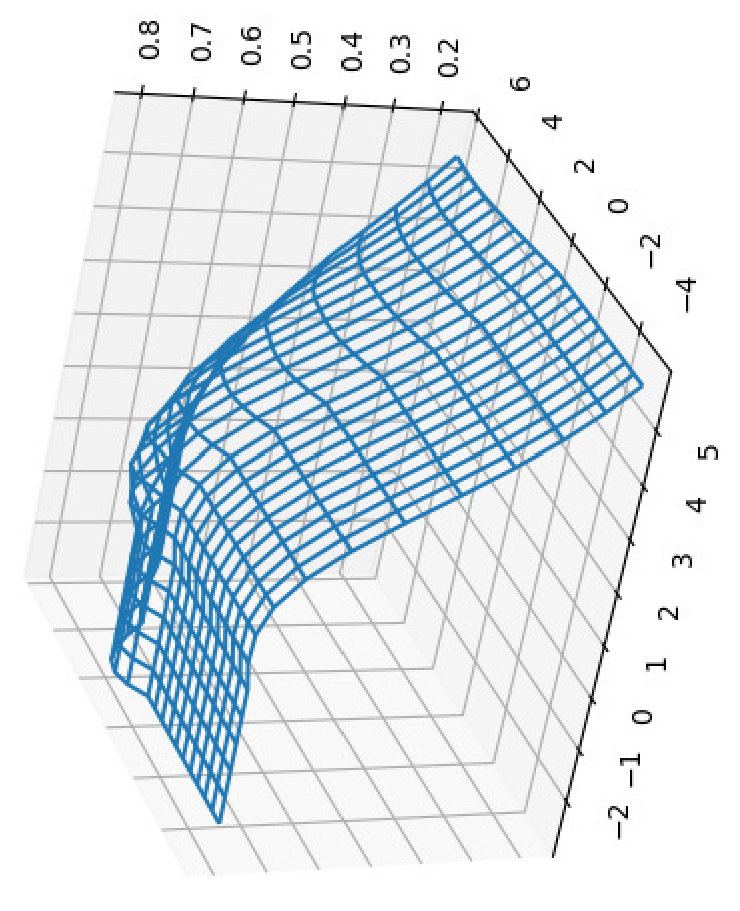 Figure 36
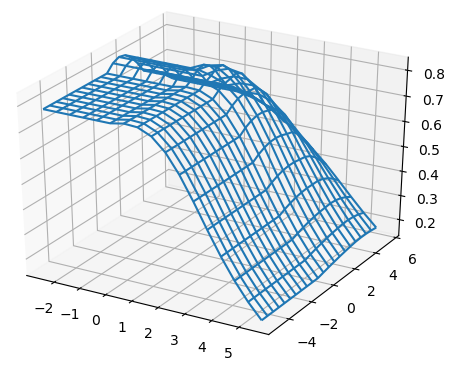 Figure 37
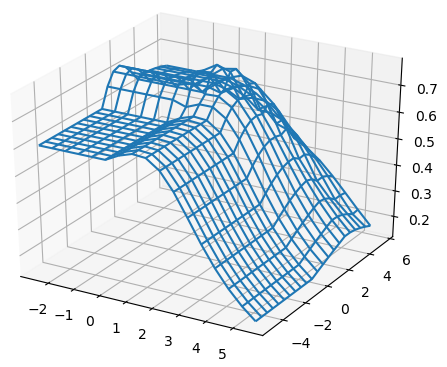 Figure 38
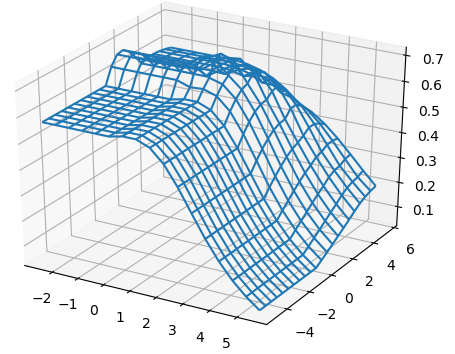 Figure 39
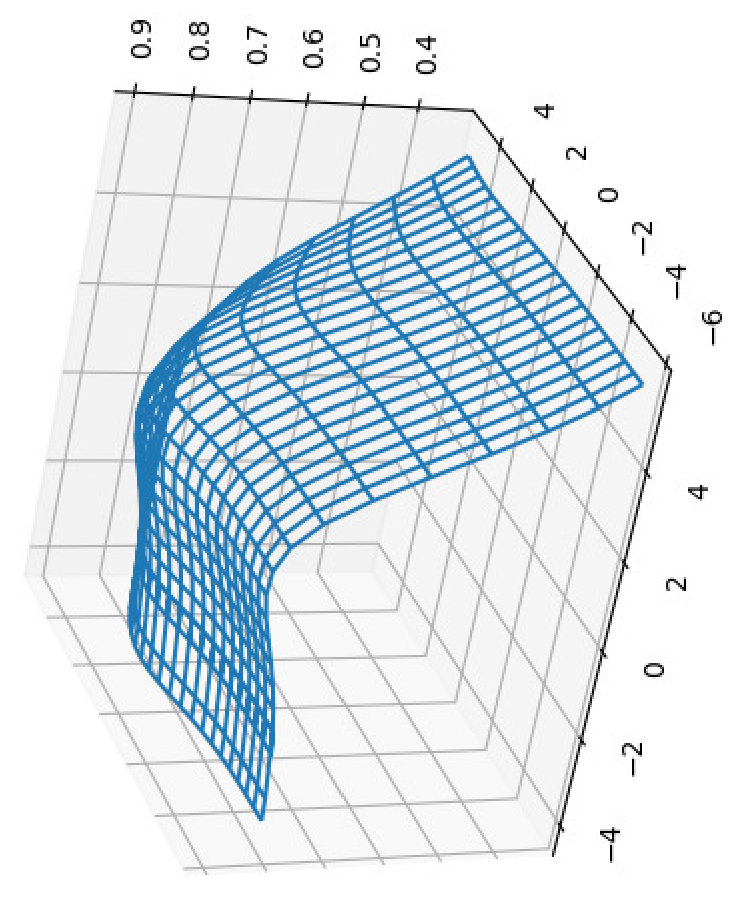 Figure 40
| Method \T | 37 | 25 | 13 | 0 | -40 | -80 | -130 | -180 |
|---|---|---|---|---|---|---|---|---|
| BPPart | 0.855 | 0.862 | 0.869 | 0.877 | 0.896 | 0.908 | 0.916 | 0.920 |
| BPMax | 0.836 | 0.846 | 0.855 | 0.864 | 0.884 | 0.895 | 0.901 | 0.904 |
| Method \T | 37 | 25 | 13 | 0 | -40 | -80 | -130 | -180 |
|---|---|---|---|---|---|---|---|---|
| BPPart | 0.864 | 0.867 | 0.871 | 0.876 | 0.889 | 0.896 | 0.901 | 0.901 |
| BPMax | 0.830 | 0.835 | 0.841 | 0.847 | 0.862 | 0.871 | 0.877 | 0.877 |
| Pearson | Spearman | |||
|---|---|---|---|---|
| Method \T | ||||
| BPPart | 0.761 | 0.825 | 0.753 | 0.801 |
| BPMax | 0.716 | 0.785 | 0.702 | 0.751 |
Peer Reviews
No public reviews on file for this paper yet. If you reviewed it on a platform where reviews are public (OpenReview, ICLR, NeurIPS, ICML), you can paste yours below so the community can read it here.
Code & Models
Videos
No videos yet. Explain this paper in a talk, walkthrough, or lecture? Add one.
BPPart and BPMax: RNA-RNA Interaction Partition Function and Structure
Prediction for the Base Pair Counting Model
Ali Ebrahimpour-Boroojeny, Sanjay Rajopadhye, and Hamidreza Chitsaz 111To whom correspondence should be addressed. Email: [email protected]
Department of Computer Science, Colorado State University
Abstract
A few elite classes of RNA-RNA interaction (RRI), with complex roles in cellular functions such as miRNA-target and lncRNAs in human health, have already been studied. Accordingly, RRI bioinformatics tools tailored for those elite classes have been proposed in the last decade. Interestingly, there are somewhat unnoticed mRNA-mRNA interactions in the literature with potentially drastic biological roles. Hence, there is a need for high-throughput generic RRI bioinformatics tools.
We revisit our RRI partition function algorithm, piRNA, which happens to be the most comprehensive and computationally-intensive thermodynamic model for RRI. We propose simpler models that are shown to retain the vast majority of the thermodynamic information that piRNA captures.
We simplify the energy model and instead consider only weighted base pair counting to obtain BPPart for Base-pair Partition function and BPMax for Base-pair Maximization which are and faster than piRNA, with a correlation of 0.855 and 0.836 with piRNA at on 50,500 experimentally characterized RRIs. This correlation increases to 0.920 and 0.904, respectively, at .
Finally, we apply our algorithm BPPart to discover two disease-related RNAs, SNORD3D and TRAF3, and hypothesize their potential roles in Parkinson’s disease and Cerebral Autosomal Dominant Arteriopathy with Subcortical Infarcts and Leukoencephalopathy (CADASIL).
1 Introduction
Since mid 1990s with the advent of RNA interference discovery, RNA-RNA interaction (RRI) has moved to the spotlight in modern, post-genome biology. RRI is ubiquitous and has increasingly complex roles in cellular functions. In human health studies, miRNA-target and lncRNAs are among an elite class of RRIs that have been extensively studied and shown to play significant roles in various diseases including cancer. Bacterial ncRNA-target and RNA interference are other classes of RRIs that have received significant attention. However, new evidence suggests that other classes of RRI, such as mRNA-mRNA interactions, are biologically important.
The RISE database [1] reports a number of biologically significant instances of mRNA-mRNA interactions. These representative mRNA-mRNA interactions suggest that general RRIs, including mRNA-mRNA interactions, play major roles in human biology. Hence, there is a need for high-throughput generic RNA-RNA interaction bioinformatic tools for all types of RNAs.
As an example of this necessity for all types of RNAs, we found 3 cliques of size 4 of interacting protein-coding RNAs in ribosome which conform to what we generally expect from the structure of the ribosome. These cliques are highly entangled together to form an interaction graph as Figure 1. RPS3 which seems to be one of the genes with the highest number of connections interacts with at least 14 other genes in ribosome pathway. Another interesting clique of size 4 that we could find consists of 4 genes in the pathway of regulation of actin cytoskeleton, ACTB, ACTG1, PFN1, and TMSB4X. These genes are involved in vital tasks of proliferation, migration, mobility, and differentiation of the cell. Being able to capture all the interactions that RNAs might have will help us better understand the post-transcriptional regulation of the genes.
In this paper, we revisit our RNA-RNA interaction partition function algorithm, piRNA, which happens to be the most comprehensive, albeit the most computationally intensive, thermodynamic model for RNA-RNA interaction [2]. piRNA is a dynamic programming algorithm that computes the partition function, base-pairing probabilities, and structure for the comprehensive Turner energy model in time and space. Due to intricacies of the energy model, including various (kissing) loops such as hairpin loop, bulge/internal loop, and multibranch loop, piRNA involves 96 different dynamic programming tables and needs multiple table look-ups for computing their values. An implementation of piRNA is currently available at http://chitsazlab.org/software/pirna.
In this paper, we introduce a strategic retreat from the slower comprehensive models such as piRNA by simplifying the energy model and instead considering only simple weighted base pair counting. We develop the BPPart algorithm for Base-pair Partition function and BPMax for Base-pair Maximization, both of which are faster by a significant, albeit constant factor. By the explosion of experimental data which makes us able to use machine learning methods, such as deep learning, for detection of RNA subsequences that interact, this retreat is necessary if one is willing to build physics-guided models by using the features that are derived by an energy model. BPPart involves nine 4-dimensional dynamic programming tables, and BPMax involves only one 4-dimensional table. Both BPPart and BPMax compared with piRNA are simpler dynamic programming algorithms which are more than and faster, respectively, on the 50,500 RRI samples we used for our experiments. The reason for this noticeable speed-up is reducing the number of tables and the number of table look-ups for computing the new values and also the fact that the 96 large tables of piRNA renders piRNA memory- rather than compute-bound in practice. Moreover, the significantly reduced memory footprint of BPPart and BPMax makes them feasible targets for optimization on different hardware platforms like GPU based accelerators, an avenue we plan to explore in the future.
The key question concerns the accuracy we lose by simplifying the scoring model from the comprehensive Turner model to simply weighted base-pair counting. We answer this by computing both the Pearson and Spearman’s rank correlations at different temperatures between the results of BPPart, BPMax, and piRNA on 50,500 experimentally characterized RRIs in the RISE database [1]. We find that the Pearson correlations between BPPart and piRNA is 0.920 and BPMax and piRNA is 0.904 at after optimizing the weights for base pairs. The effect of entropy, for which the simple base pair counting model does not account, increases with temperature. Completely in conformance with this theoretical expectation, we find that the Pearson correlations between BPPart and piRNA is 0.855 and BPMax and piRNA is 0.836 at . We conclude that BPPart and BPMax capture a significant portion of the thermodynamic information. They can possibly be complemented with machine learning techniques in the future for more accurate predictions.
1.1 Related work
During the last few decades, several computational methods emerged to study the secondary structure of single and interacting nucleic acid strands. Most use a thermodynamic model such as the well-known Nearest Neighbor Thermodynamic model [3, 4, 5, 2, 6, 7, 8, 9, 10, 11]. Some previous attempts to analyze the thermodynamics of multiple interacting strands concatenate input sequences in some order and consider them as a single strand [12, 13, 14]. Alternatively, several methods avoid internal base-pairing in either strand and compute the minimum free energy secondary structure for their hybridization under this constraint [15, 16, 17]. The most comprehensive solution is computing the joint structure between two interacting strands under energy models with a growing complexity [18, 19, 20, 21, 22, 2, 23].
Other methods predict the secondary structure of individual RNA independently, and predict the (most likely) hybridization between the unpaired regions of the two interacting molecules as a multistep process: 1) unfolding of the two molecules to expose bases needed for hybridization, 2) the hybridization at the binding site, and 3) restructuring of the complex to a new minimum free energy conformation [24, 25, 26, 27]. The success of such methods, including our biRNA algorithm [27], suggests that the thermodynamic information vested in subsequences and pairs of subsequences of the input RNAs can provide valuable information for predicting features of the entire interaction.
In addition to general RNA-RNA interaction tools, many tools have been developed to predict the secondary structure of interacting RNAs for a specific type of interest which has been shown to be more effective in some cases due to the utilization of certain properties belonging to that type. As mentioned earlier, miRNA-target prediction is one such class of high interest for which such specialized tools have been created to incorporate various properties specific to miRNAs; some of these tools use the seed region of a miRNA which is highly conserved [28, 29, 30, 31], some consider the free energy to compute accessibility to the binding site in UTR [32, 20, 29], some utilize the conservation level which is derived using the phylogenetic distance [33, 34, 35, 36, 28, 29], and some others consider other target sites as well, such as the UTR, Open Reading Frames (ORF), and the coding sequence (CDS) for mRNAs [37, 38, 39, 40].
There are also several other tools developed for other specific types of RNA; IntaRNA [41, 42] is one such tool that although is used for RNA-RNA interaction in general, it is primarily designed for predicting target sites of non-coding RNAs (ncRNAs) on mRNAs. There are many other examples, such as PLEXY [43] which is a tool designed for C/D snoRNAs, RNAsnoop [44] that is designed for H/ACA snoRNAs, TargetRNA [45] which is a tool aimed at predicting interaction of bacterial sRNAs [46].
2 Methods
Here we describe how our algorithm, BPPart, utilizes a dynamic programming approach to compute the partition function for RNA-RNA interaction when entropy is ignored and only a weighted score for pairing different nucleotides is considered. This algorithm is guaranteed to be mutually exclusive on the set of structures, i.e., it counts each structure exactly once. For BPMax which maximizes the (weighted scores) of base-pairs, such mutual exclusion is not necessary because the operator is idempotent (counting the same structure multiple times does not affect the value of the objective function) and we give a simpler recursion. Our codes are freely available under open source license.222See https://github.com/Ali-E/bipart
Preliminaries
In this paper, we mostly follow the notations and definitions used to develop our piRNA algorithm [2]. We denote the two nucleic acid strands by and . Strand is indexed from to , and is indexed from to both in to direction. Note that the two strands interact in opposite directions, e.g. in with in direction; however, we consider the reverse of in our figures for clearer illustration of the configurations. Each nucleotide is paired with at most one nucleotide in the same or the other strand. The subsequence from the nucleotide to the nucleotide, inclusive, in either strand is denoted by .
An intramolecular base pair between the nucleotides and (by convention, ) in a strand is called an arc and denoted by a bullet . We represent the score of such arc by . Essentially, is if is GU or UG, is if is AU or UA, and is if is CG or GC. An intermolecular base pair between the nucleotides and , where , is called a bond, denoted by a circle . We represent the score of such a bond by . Essentially, is if is GU or UG, is if is AU or UA, and is if is CG or GC.
An arc in R covers a bond if . We call an interaction arc in R if there is a bond covered by . The scope of an interaction arc is the interval . We call a base on either strand an event if it is either the end point of a bond or that of an interaction arc. In our explanation we may use arc and bond as verbs. Two bonds and are called crossing bonds (right case of Figure 2) if and , or vice versa. An interaction arc in a strand subsumes a subsequence in the other strand if none of the bases in has a bond with a base outside this arc. Mathematically, for all bonds where , lies within the scope of . Two interaction arcs are equivalent if they subsume one another. Two interaction arcs and are part of a zigzag, if neither subsumes nor subsumes (left case of Figure 2).
In this work, we assume there are no pseudoknots in individual secondary structures of and , and also there are no crossing bonds and no zigzags between and . These constraints allow a polynomial algorithm—the general case of considering all possible structures is NP-hard [19]. We denote the ensemble of unpseudoknotted structures of and by and respectively. The ensemble of unpseudoknotted, crossing-free, and zigzag-free joint interaction structures is denoted by .
For a given structure in either or , let denote the number of A-U base pairs in . Similarly, and denote the number of C-G and G-U base pairs in , respectively. We define bpcount as a weighted sum, for some constants,
[TABLE]
For a given joint interaction structure , let , , and denote the respective number of intramolecular base pairs in , and let , , and denote the number of corresponding intermolecular base pairs in . We define for some constants, , for any joint interaction structure ,
[TABLE]
and
[TABLE]
Rivas-Eddy Diagrams
For the sake of completeness, we describe the “Rivas-Eddy diagram” notation that we adopt in this paper. The main elements are:
A solid horizontal straight line represents a sequence; we have two sequences drawn as two parallel horizontal lines. 2. 2.
A solid curved line between two points in the same sequence is an arc; all arcs are either above the upper sequence, or below the lower one. 3. 3.
A dotted curved line with a cross in the middle, between two points in the same sequence means that those two points do not form an arc. 4. 4.
A dashed curved line between two points in the same sequence denotes either 2 or 3. 5. 5.
A solid line between two points in different sequences is a bond. 6. 6.
Similarly, a dotted line with a cross in the middle, between two points in different sequences means that those two points do not form a bond. 7. 7.
A dashed line between two points in different sequences denotes either 5 or 6. 8. 8.
A region is the space under an arc, or between bonds. When there are no additional choices of bonds/arcs in a given region, we fill it with a color (cyan); no arc or bond crosses a filled region. 9. 9.
A point in a sequence may be labeled with an index, and in general, the set of such indices are free variables used in the recursions; the index of unlabeled points before (after) labeled points is assumed to be the predecessor (successor) of the label. 10. 10.
A diagram may be labeled with the name(s) of the constituent substructures (which are eventually implemented as dynamic programming tables/variables). 11. 11.
A vanishing arc (i.e., one that starts at some index, and does not explicitly specify an end point) represents a structure whose start point is as specified, and the end point is to be determined.
The Rivas-Eddy diagram to compute a certain function is written like a formal (context free) grammar. The left hand side is labeled with the name of a table (structure), and the right hand side has a number of alternate substructures separated by vertical bars. Often, some of the boundary cases (e.g., singleton or empty subsequences) are omitted for brevity.
Problem Definition
In this paper, we solve two problems:
Base Pair Counting Partition Function: we give a dynamic programming algorithm BPPart to compute the partition function
[TABLE] 2. 2.
Base Pair Maximization: we give a dynamic programming algorithm BPMax to find the structure that has the maximum weighted base pair count, i.e.
[TABLE]
This problem was previously studied by Pervouchine [18] in an algorithm called IRIS. However, there is no publicly available correct implementation of IRIS. Moreover, we also define an additional interaction score to capture the structure with the highest intermolecular score, amongst those that maximize the total score. Mathematically,
[TABLE]
We compute by backtracing all possible total-score-optimal structures, and selecting the one that has the maximum intermolecular score.
BPMax Algorithm
We first explain the BPMax algorithm. It is simpler than BPPart, and allows us to describe the notation and conventions. When explaining some of the equations, helper functions, called , are used to ease the reading of the paper. To differentiate these helper functions, superscripts are used.
For a single strand of nucleotides, we define as the maximum weighted sum of base pair scores on all possible foldings of subsequence . We need to make such a table, for each of the and strands, and we use superscripts and , respectively, to distinguish between them. We also define as the maximum weighted sum of base pair scores (considering both intra- and inter-pairings) of subsequences from and from .
The computation of is based on the well known single RNA folding algorithm [47]. For short sequences (i.e., those whose length is strictly less than 5) the score is [math], otherwise, we use the recursion in the second case of Equation (7) shown below. It considers the case where we have an arc and recurs on , and also other cases in which the and bases are not paired and the is split into two smaller subsequences:
[TABLE]
We define the recurrences for similarly. When either sequence is empty, the value is simply the of the other sequence, and for two singleton sequences, it is the score of the single bond possible. Otherwise we have three cases: (i) arcs () in which case the residual structure is given by a recursion on , (ii) the symmetric case of and , or (iii) none of these arcs, and two recursive cases of and . They are illustrated in the Rivas-Eddy diagram of Figure 3, which lead to
[TABLE]
[TABLE]
Note that is equivalent to
[TABLE]
In Equation (8), we compute tables separately for each strand, according to Equation (7) with the corresponding sequence as the input, and we distinguish them by superscripts (1) and (2) above. We use the same superscript convention throughout this paper.
BPPart Algorithm
It is well known that the partition function can be computed by developing similar recursions, with two simple modifications. The first is that algebraically, we operate with the field of reals rather than the max-plus semi-ring. Here, the additive identity is 0, rather than INT_MIN and the multiplicative identity is 1, rather than 0. The second, as already mentioned earlier, is that because addition is not idempotent, we must carefully ensure that we enumerate substructures in a mutually exclusive manner.
First, we start with the recursions for computing the partition function on a single strand which is going to occur in many cases of the double-stranded version. Let represent the partition function of the subsequence . As shown in Figure 4, there are two mutually exclusive cases: either (the right case) there is no arc, or (the left case) there is a unique leftmost arc (the cyan fill ensures this) which starts at , and a substructure on with an arc starting at , for which we introduce a new table .
To define , let (read as “let arc ”) for some index . This results in two substructures, one on , and the other on . Therefore, the value of can be computed using Equation (12) which accounts for the assumption that no pairing is allowed between two bases that are less than bases apart:
[TABLE]
[TABLE]
For the partition function of a pair of RNA sequences, we consider a -dimensional table in which is the value of base pair counting partition function for the subsequences on and on . As Figure 6 shows, we can split the set of all possible structures of into three mutually exclusive subsets. The leftmost case shows the structures in which there exist no bonds (the first term of Equation (13). The other two cases occur when there is at least one bond, and hence, unique leftmost events on both and , at positions and , respectively. In the second (middle) case, these leftmost events are end points of a bond, ; hence, this case can be broken into: a bond-free section on the left of the bond itself, and a general case of on the right of the bond. The third case occurs when and are not end points of a bond. We call this structure , and explain it next.
[TABLE]
[TABLE]
For computing , (see Figure 7) we have to consider the property of this structure that the leftmost bases on both and have to be events, but they cannot both be the end points of a bond. Therefore, either one or both of them have to be end points of an interaction arc. There are two possibilities.
First, if both and are end points of some interaction arcs, and , these arcs must be equivalent (or else, we have a zigzag). As shown in the rightmost diagram in Figure 7, then splits into two exclusive substructures, namely one where the first and last bases on each strand are paired, and the two arcs are equivalent (we call it and derive its recursion later), followed by on the suffixes of these arcs.
Otherwise, exactly one of the leftmost events on and is an end point of a bond, and we have two symmetric cases ( and ), one where the interaction arc is in R, and the other where it is in S. In the first case (middle diagram in Figure 7), let be the event in R such that is an interaction arc, and is the longest subsequence in S that subsumes, and is an event. The suffix of this substructure recurs on . We derive later.
To derive , note that removing the arcs and yields the general case of for the inner-section with an additional constraint that there has be at least one bond in that region because the assumption is that the extracted arcs were interaction arcs. We can fulfill this constraint by excluding all cases where no bonds exist (i.e., considering only the two rightmost substructures of Figure 6).
To derive let be the leftmost event in the subsequence . Note that such a is guaranteed to exist because first, subsumes and we know that is an event, i.e., the end point of either a bond (subsumed by ) or of an interaction arc. Then (see Figure 8) we define a new substructure, , after removing and the prefix of R up to .
To derive , note that the context of its definition implies that and are all three events. Let, as shown in Figure 9, be the last event on . Now, if , then recur on . Otherwise, is an event that does not pair with . We define a new substructure, , where all four corners are events, and neither nor is allowed.
For computing , since there are four corners each of which can be the end point of either a bond or of an arc, there might be at most sixteen possibilities. Upon combining some of those sixteen possibilities, we have to consider four mutually exclusive cases (see Figure 10). The first one is the case where and and the remaining part will be . That case corresponds to all four corner events being the end points of bonds. Since we assume there are no crossing bonds, we must have and . In the second case, and are the end points of a bond, i.e., , but either or (or both) does not form a bond. That captures three out of the sixteen total possibilities. Since and are both events but do not form a bond, we define a term which is the sum of and the two symmetric ’s, since they preserve the constraints that arise in the first term in the definition of (see Figure 7). The prefix of this substructure is a general recursion on on the subsequences and . The third case is the symmetric case of the second case, i.e., there is no bond between and , but . The prefix of this bond is a recursion on . That captures three out of the sixteen total possibilities. Finally, the fourth case corresponds to either or (or both) does not form a bond and either or (or both) does not form a bond. That captures the remaining nine out of the sixteen total possibilities.
Putting all those together, we obtain
[TABLE]
[TABLE]
[TABLE]
[TABLE]
[TABLE]
[TABLE]
[TABLE]
[TABLE]
[TABLE]
[TABLE]
3 Results
To investigate the correlation between the scores of BPPart and BPMax, and those of piRNA, we used the RISE database [1] which combines information about interacting RNAs from multiple experiments. For the human dataset, we extracted all the interaction windows for those pairs that have this data in RISE. We eliminated the ones that contained a window with length less than because they are too short for an unbiased comparison. Then, we sorted the remaining pairs based on the product of the lengths of the interacting windows. Finally, the first 50,500 pairs of sequences were chosen as our primary dataset for different experiments and analysis. Figure 11 shows the distribution of the sequence lengths in this dataset, and also the product of the lengths of the RNA subsequences in each pair.
We first ran piRNA on our primary dataset at 8 different temperatures, , , , [math], , , , and degrees Celsius. We also ran BPPart and BPMax on the dataset with different weights, i.e., ’s and ’s. In general, we want to use the stack energies of the Turner model as a starting point for tuning the weights. Since the parameters form a projective space (invariant results with respect to scaling), we considered a fixed weight of for CG (and GC). Using the experimentally computed stack energies of the Turner model, minimum and maximum values for the weights of AU and GU were computed. That is, to compute the maximum weight of AU (and UA), we consider the maximum released energy when AU (or UA) is stacked with another pair; this happens when UA is stacked with CG and energy is released. Then, we considered the minimum value of released energy in an stack for CG or GC (for which we assumed a constant weight of ), which is . We derived the maximum weight of AU and UA as by multiplying by . Finally, we made sure that the range of values that we explore for the weight of AU and UA contains this maximum value (we chose as the upper-bound). For finding the minimum weight of AU and UA, we consider their minimum stack energy, which is . Given the maximum energy of CG, namely , the value of interest is computed as . However, for the sake of comprehensiveness and exploring the shape of the plots, we used much smaller lower-bounds— and —for BPPart and BPMax, respectively.
For all the combinations of weights of AU and GU, in steps of , we computed the Pearson and Spearman’s rank correlations with the scores from piRNA at different temperatures. When computing the correlations, to normalize the scores from all algorithms, we divide them by the sum of the lengths of corresponding sequences, . This normalization mitigates the effect of length bias on the computed correlations. This step is necessary because, generally, as the length of the pair of sequences increases the scores of all three algorithms increases, and if unnormalized scores are used, a biased higher correlation will be derived. Note that for partition functions, piRNA and BPPart, we used the of the scores; that is why we factor out the sum of the lengths for normalization. If the original values were to be used, we would have to take the th roots of the scores. Figures 12 and 13 show the Pearson correlations for different combinations of weights of AU and GU at and . Figure 14 shows the scatter plots of the scores of BPPart and piRNA at these temperatures. In these plots, the red line shows the regression line that is fitted to the points by minimizing the mean squared error (MSE).
The optimum values of correlation for each temperature are presented in Tables 1 and 2. There is a high correlation between piRNA and BPPart as well as between piRNA and BPMax, especially when the temperature decreases which is due to a decrease in the role of thermodynamic entropy at the lower temperatures. Also, we computed the Pearson and Spearman’s rank correlation between BPPart and BPMax with their optimum weights at , which yielded values of 0.971 and 0.968, respectively.
To make sure that the optimization results are not data dependent, we conducted the same experiments for randomly generated sequences. To factor out the effect of length, for each pair in our primary dataset, we generated a pair of random sequences with the same lengths as those of the pair in our primary dataset. The shape of the plots are very similar to those for the primary dataset, for both BPPart and BPMax (see Figures 15, 16). For BPPart, the optimum weights at are the same (, , and for AU, GU, and CG, respectively) and at the optimum weights we had earlier (, , and ) are ranked for the random dataset with only difference in the Pearson correlation from the optimum, achieved by weights of (, , and ) for the random dataset. Similarly, for BPMax, the optimum values for the two datasets are the same at (, , and ), and at , the optimum values of weights for the primary dataset (, , and ) are ranked for the random dataset with only difference in the Pearson correlation from the optimum, achieved by weights of (, , and ) for this dataset.
Although the shape of the plots and the peaks were almost the same for the primary dataset and the random dataset, the best correlations for the random one were considerably less than those of the primary one. Table 3 shows the Pearson and the Spearman’s rank correlation of BPPart and BPMax with piRNA at and for the random dataset.
Finally to better understand the behavior of the surface around the higher values in the correlation plots of Figures 12 and 13, we computed the Shannon entropy for the values above a threshold. Figure 17 shows these values for the top values of Pearson and Spearman’s rank correlation at each temperature.
Discussion
The Gibbs free energy
[TABLE]
is composed of a term called enthalpy that does not depend on temperature and a term called entropy that linearly depends on temperature . Intuitively, enthalpy is the chemical energy that is often released upon formation of chemical bonds such as base pairing. Entropy, on the other hand, captures the size of all possible spatial conformations for a fixed secondary structure. In other words, entropy captures the amount of 3D freedom of the molecule. A base pair brings enthalpy down, hence favorable from enthalpy point of view, and decreases freedom (entropy), hence unfavorable from entropy point of view. These two opposing objectives are combined linearly through the temperature coefficient.
In the full thermodynamic model, we consider both terms. In the base pair counting, we consider only a simplistic enthalpy term. Partition function for the full thermodynamic model is
[TABLE]
in which is the gas constant. Note that
[TABLE]
and as , and the contribution of is diminished to [math] since it is finite. Hence, at low temperatures, the effect of entropy becomes negligible, and we expect to see strong correlation between the base pair counting model and full thermodynamic model.
Figure 18 shows the Pearson correlations between BPPart and BPMax scores with piRNA scores for a fixated combination of weights that results in the highest correlation at . For BPPart the chosen weights are , , and for AU, GU, and CG, respectively, while the corresponding weights for BPMax are , , and .
Perfectly conforming with the theory, we see higher correlations at low temperatures. That somewhat validates our implementations as piRNA was written totally independently about 10 years ago. Moreover, as can be seen in Figures 12 and 13, the surface around the optimum value for higher temperatures becomes flatter. Figure 17, which shows the entropy of the top correlation values, confirms this observation. This means the correlation values are less sensitive to a change in the weights of the base pairs as the temperature increases; this conforms with the theory because at higher temperatures, the thermodynamic entropy increases and the total score of piRNA becomes less sensitive to the energy released by pairings. It is worth mentioning that having less Shannon entropy for the top values at higher temperatures decreases the possibility of having universal optimum values for the weights of the base pairs.
Another noticeable characteristic of the plots in Figures 12 and 13 is the region in which the scores of both AU and GU are non-positive. This region for BPMax is flat because when both of these pairs are penalized (or not rewarded when their score is zero), the algorithm simply avoids making such pairs because it is trying to maximize the score. Therefore, it only tries to maximize the number of CG pairs, which is independent of the scores (penalty in this case) of the other two types of base pairs. This also applies to the case where one of the base pairs has a non-positive score; in that case, BPMax works independently of the score of that base pair. So, as soon as any of the scores becomes non-positive, BPMax remains constant along the corresponding axis. For BPPart, however, the story is different because it simply counts all the possible pairings and even if the score of a base pair becomes negative, it does not ignore counting that.
Moreover, BPPart has a higher correlation than BPMax does, which comes with the price of a increase in empirical running time. Also, as Figure 17 shows, the Shannon entropy for the top values is less in BPMax and the gap between them grows as temperature decreases; this shows that BPPart has a flatter region around the optimum value and its optimum value is less sensitive to changes in the weights. Meanwhile, having a steeper surface in BPMax which has less entropy, increases the possibility of having more stable and universal optimum values for the weights. As mentioned earlier, the running time difference between the two is noticeable: BPMax is about faster than BPPart. Hence, we now have three choices in increasing order of computational cost: BPMax, BPPart, and piRNA. The computation time increases by about and , respectively, from one to the next.
Finally, based on the results of the experiments on both the primary dataset and the random one, we see that although the shapes of the optimization plots and the optimum weights are very similar, the correlation values are much less for the random dataset. This observation suggests that probably the interaction regions are more complementary than the random sequences of the same size because in these regions the effect of the energy released by pairing probably becomes more significant than the energy added by an increase in the entropy on the final score of piRNA. That could explain why we get a higher correlation in such regions with BPPart and BPMax, which mainly depend on the base pairs. This hypothesis has to be thoroughly investigated in the future.
Application of BPPart in Human Biology
One of the use-cases of BPPart and BPMax, among others, is making predictions about the consequences of a slight change in the RNA sequences. This information becomes helpful for various domains and tasks, such as synthetic biology and studying the mutations. Between BPMax and BPPart, the latter is much more sensitive to small changes in the sequence, because it considers all possible structures that the two interacting sequences might form. Therefore, even a missense mutation might make a tangible difference in the computed BPPart score.
To verify this hypothesis, we used BPPart to study the effects of known missense mutations, provided by Ensembl, in the interaction regions of some RISE pairs. Given a pair of interacting RNAs in RISE for which the information about the interacting regions is provided, we retrieved the data of all the reported missense mutations of those regions from Ensembl API. Also, we got the phenotypic consequences of each mutation from Ensembl. Finally, we computed the BPPart score for the original sequence of one of the interacting regions and each of the mutated versions of the other sequence. Among all the generated scores for a pair, we found the outliers using the interquartile range. These outliers, represent a mutation in one of the interacting RNAs, which falls within the interacting region, that causes a great difference in the interaction score. In the rest of this section, we almost-randomly pick and narrate two of such cases that we observed, among many discovered ones. In Appendix A, we report such pairs that have been discovered using this pipeline after analyzing more than one million pairs of sequences that have been generated after applying the known missense mutations to over pairs of interacting sequences reported in the RISE database. Further study of each of these pairs and more comprehensive study of effect of nonsense mutations on RRI would be a next step in the future.
Traces of TRAF3 in CADASIL
Cerebral Autosomal Dominant Arteriopathy with Subcortical Infarcts and Leukoencephalopathy (CADASIL) is an inherited condition in which the muscle cells of small blood vessels, especially the ones in the brain, gradually die and cause many impairements, such as stroke, cognitive impairement, and mood disorders in the elderly [48]. It has been shown that mutation in NOTCH3, which resides on the reverse strand of chromosome , is responsible for this condition in people with this genetic disorder [49]. NOTCH3 and TRAF3 are a pair of interacting RNAs that have been reported in RISE. One of the missense mutations in NOTCH3 that has been reported to be contributing to CADASIL [50] lies within the interacting region of this gene, from loci to (according to GRCh38 assembly of human genome), with TRAF3. Interestingly, this mutation, which replaces nucletide with at loci of chromosome , causes a dramatic increase in the score of BPPart such that it makes it an outlier when the aformentioned procedure is followed. TRAF3 is a gene that has been reported to play a role in angiogenesis [51, 52]. A noticeable increase in the score of BPPart increases the chance that these two RNAs interact and cause post-transcriptional conditions that affect the translation rate of TRAF3 which possibly contributes to the phenotypic consequences of CADASIL. Further evaluation and verification of this hypothesis requires further experimental analysis.
Traces of SNORD3D in Parkinson’s Disease
SNORD3D is a small nucleolar RNA which has been detected not long ago [53] with which no specific task or annotation is associated in the literature yet. According to the RISE database, one of the genes that interacts with this snoRNA is GBA which resides on the reverse strand of chromosome . Mutations in GBA has been reported to play a role in Parkinson’s disease which is a brain disorder that affects movement and often causes tremors. One of the GBA mutations that is reported to be linked with Parkinson’s disease lies within the interaction region of this gene, from loci to (according to GRCh38 assembly of human genome), with SNORD3D. This specific mutation of GBA, which changes the nucleotide to at loci of chromosome , is one of the cases that is detected as an outlier using our aforementioned analysis of BPPart scores. This mutation, when applied to GBA, decreases its score of interaction with SNORD3D, which might cause the interaction to occur much less than the normal case. This possibly leads to a change in the expression of GBA protein. According to KEGG, GBA is a member of Other glycan degradation, Sphingolipid metabolism, Metabolic pathways, and Lysosome pathways [54]. Therefore, we hypothesize the role of SNORD3D in some or all of those pathways, particularly, the ones that are closely related to Parkinson’s disease. Further evaluation of this hypothesis requires further experimental data and analysis.
4 Conclusion
We revisited the problems of partition function and structure prediction for interacting RNAs. We simplified the energy model and instead considered only simple weighted base pair counting to obtain BPPart for the partition function and BPMax for structure prediction. As a result, BPPart runs about and BPMax runs about faster than piRNA does. Hence, we gained significant speedup by potentially sacrificing accuracy.
To evaluate practical accuracy of both new algorithms, we computed the Pearson and rank correlations at different temperatures between the results of BPPart, BPMax, and piRNA on 50,500 experimentally characterized RRIs in the RISE database [1]. BPPart and BPMax results correlate well with those of piRNA at low temperatures. At the room and body temperatures, there is considerable correlation and therefore, significant information in the results of BPPart and BPMax.
We conclude that both BPPart and BPMax capture a significant portion of the thermodynamic information. Both tools can be used as filtering steps in more sophisticated RRI prediction pipelines. Also, the information captured by BPPart and BPMax can possibly be complemented with machine learning techniques in the future for more accurate predictions. We now have three choices for RRI thermodynamics in increasing computational cost: BPMax, BPPart, and piRNA. Depending on the application and the trade-off between time and accuracy, one can be chosen.
Finally, we show that BPPart might be useful to explain how some mutations lead to some specific phenotypic consequences. We presented two new hypotheses about the roles of TRAF3 in CADASIL and SNORD3D in lipid processing pathways and/or Parkinson’s disease.
4.1 Conflict of interest statement.
None declared.
The reference list from the paper itself. Each links out to its DOI / PubMed record.
- 1[1] J. Gong, D. Shao, K. Xu, Z. Lu, Z. J. Lu, Y. T. Yang, and Q. C. Zhang. RISE: a database of RNA interactome from sequencing experiments. Nucleic Acids Res. , Oct 2017.
- 2[2] Hamidreza Chitsaz, Raheleh Salari, S.Cenk Sahinalp, and Rolf Backofen. A partition function algorithm for interacting nucleic acid strands. Bioinformatics , 25(12):i 365–i 373, 2009. Also ISMB/ECCB proceedings.
- 3[3] D.H. Mathews, J. Sabina, M. Zuker, and D.H. Turner. Expanded sequence dependence of thermodynamic parameters improves prediction of RNA secondary structure. J. Mol. Biol. , 288:911–940, May 1999.
- 4[4] S. Cao and S.J. Chen. Predicting RNA pseudoknot folding thermodynamics. Nucleic Acids Res. , 34:2634–2652, 2006.
- 5[5] Robert M. Dirks and Niles A. Pierce. A partition function algorithm for nucleic acid secondary structure including pseudoknots. Journal of Computational Chemistry , 24(13):1664–1677, 2003.
- 6[6] R. Nussinov, G. Piecznik, J. R. Grigg, and D. J. Kleitman. Algorithms for loop matchings. SIAM Journal on Applied Mathematics , 35:68–82, 1978.
- 7[7] M. S. Waterman and T. F. Smith. RNA secondary structure: A complete mathematical analysis. Math. Biosc. , 42:257–266, 1978.
- 8[8] Michael Zuker and Patrick Stiegler. Optimal computer folding of large RNA sequences using thermodynamics and auxiliary information. Nucleic Acids Research , 9(1):133–148, 1981.
