Causes of ferroelectricity in HfO$_{2}$-based thin films: An $\textit{ab initio}$ perspective
Mehmet Dogan, Nanbo Gong, Tso-Ping Ma, Sohrab Ismail-Beigi

TL;DR
This study uses first principles calculations to understand how doping and confinement influence the formation of ferroelectric orthorhombic phases in hafnia-based thin films, explaining experimental doping ranges and interface effects.
Contribution
It provides a detailed ab initio analysis of phase transformations in doped hafnia, identifying optimal doping levels and the role of confinement in ferroelectricity.
Findings
4% Si doping optimizes phase transformation.
Half Zr content favors orthorhombic phase formation.
Interface effects significantly influence ferroelectric behavior.
Abstract
We present a comprehensive first principles study of doped hafnia in order to understand the formation of the ferroelectric orthorhombic [001] grains. Assuming that tetragonal grains are present during the early stages of growth, matching plane analysis shows that tetragonal [100] grains can transform into orthorhombic [001] during thermal annealing, when they are laterally confined by other grains. We show that among 0%, 2% and %4 Si doping, 4% doping provides the best conditions for the tetragonal [100] to orthorhombic [001] transformation. This also holds for Al doping. We also show that for HfZrO, where we have studied , the value provides the most favorable conditions for the desired transformation. In order for this transformation to be preferred over the tetragonal [100] to monoclinic [100] transformation, out-of-plane…
Click any figure to enlarge with its caption.
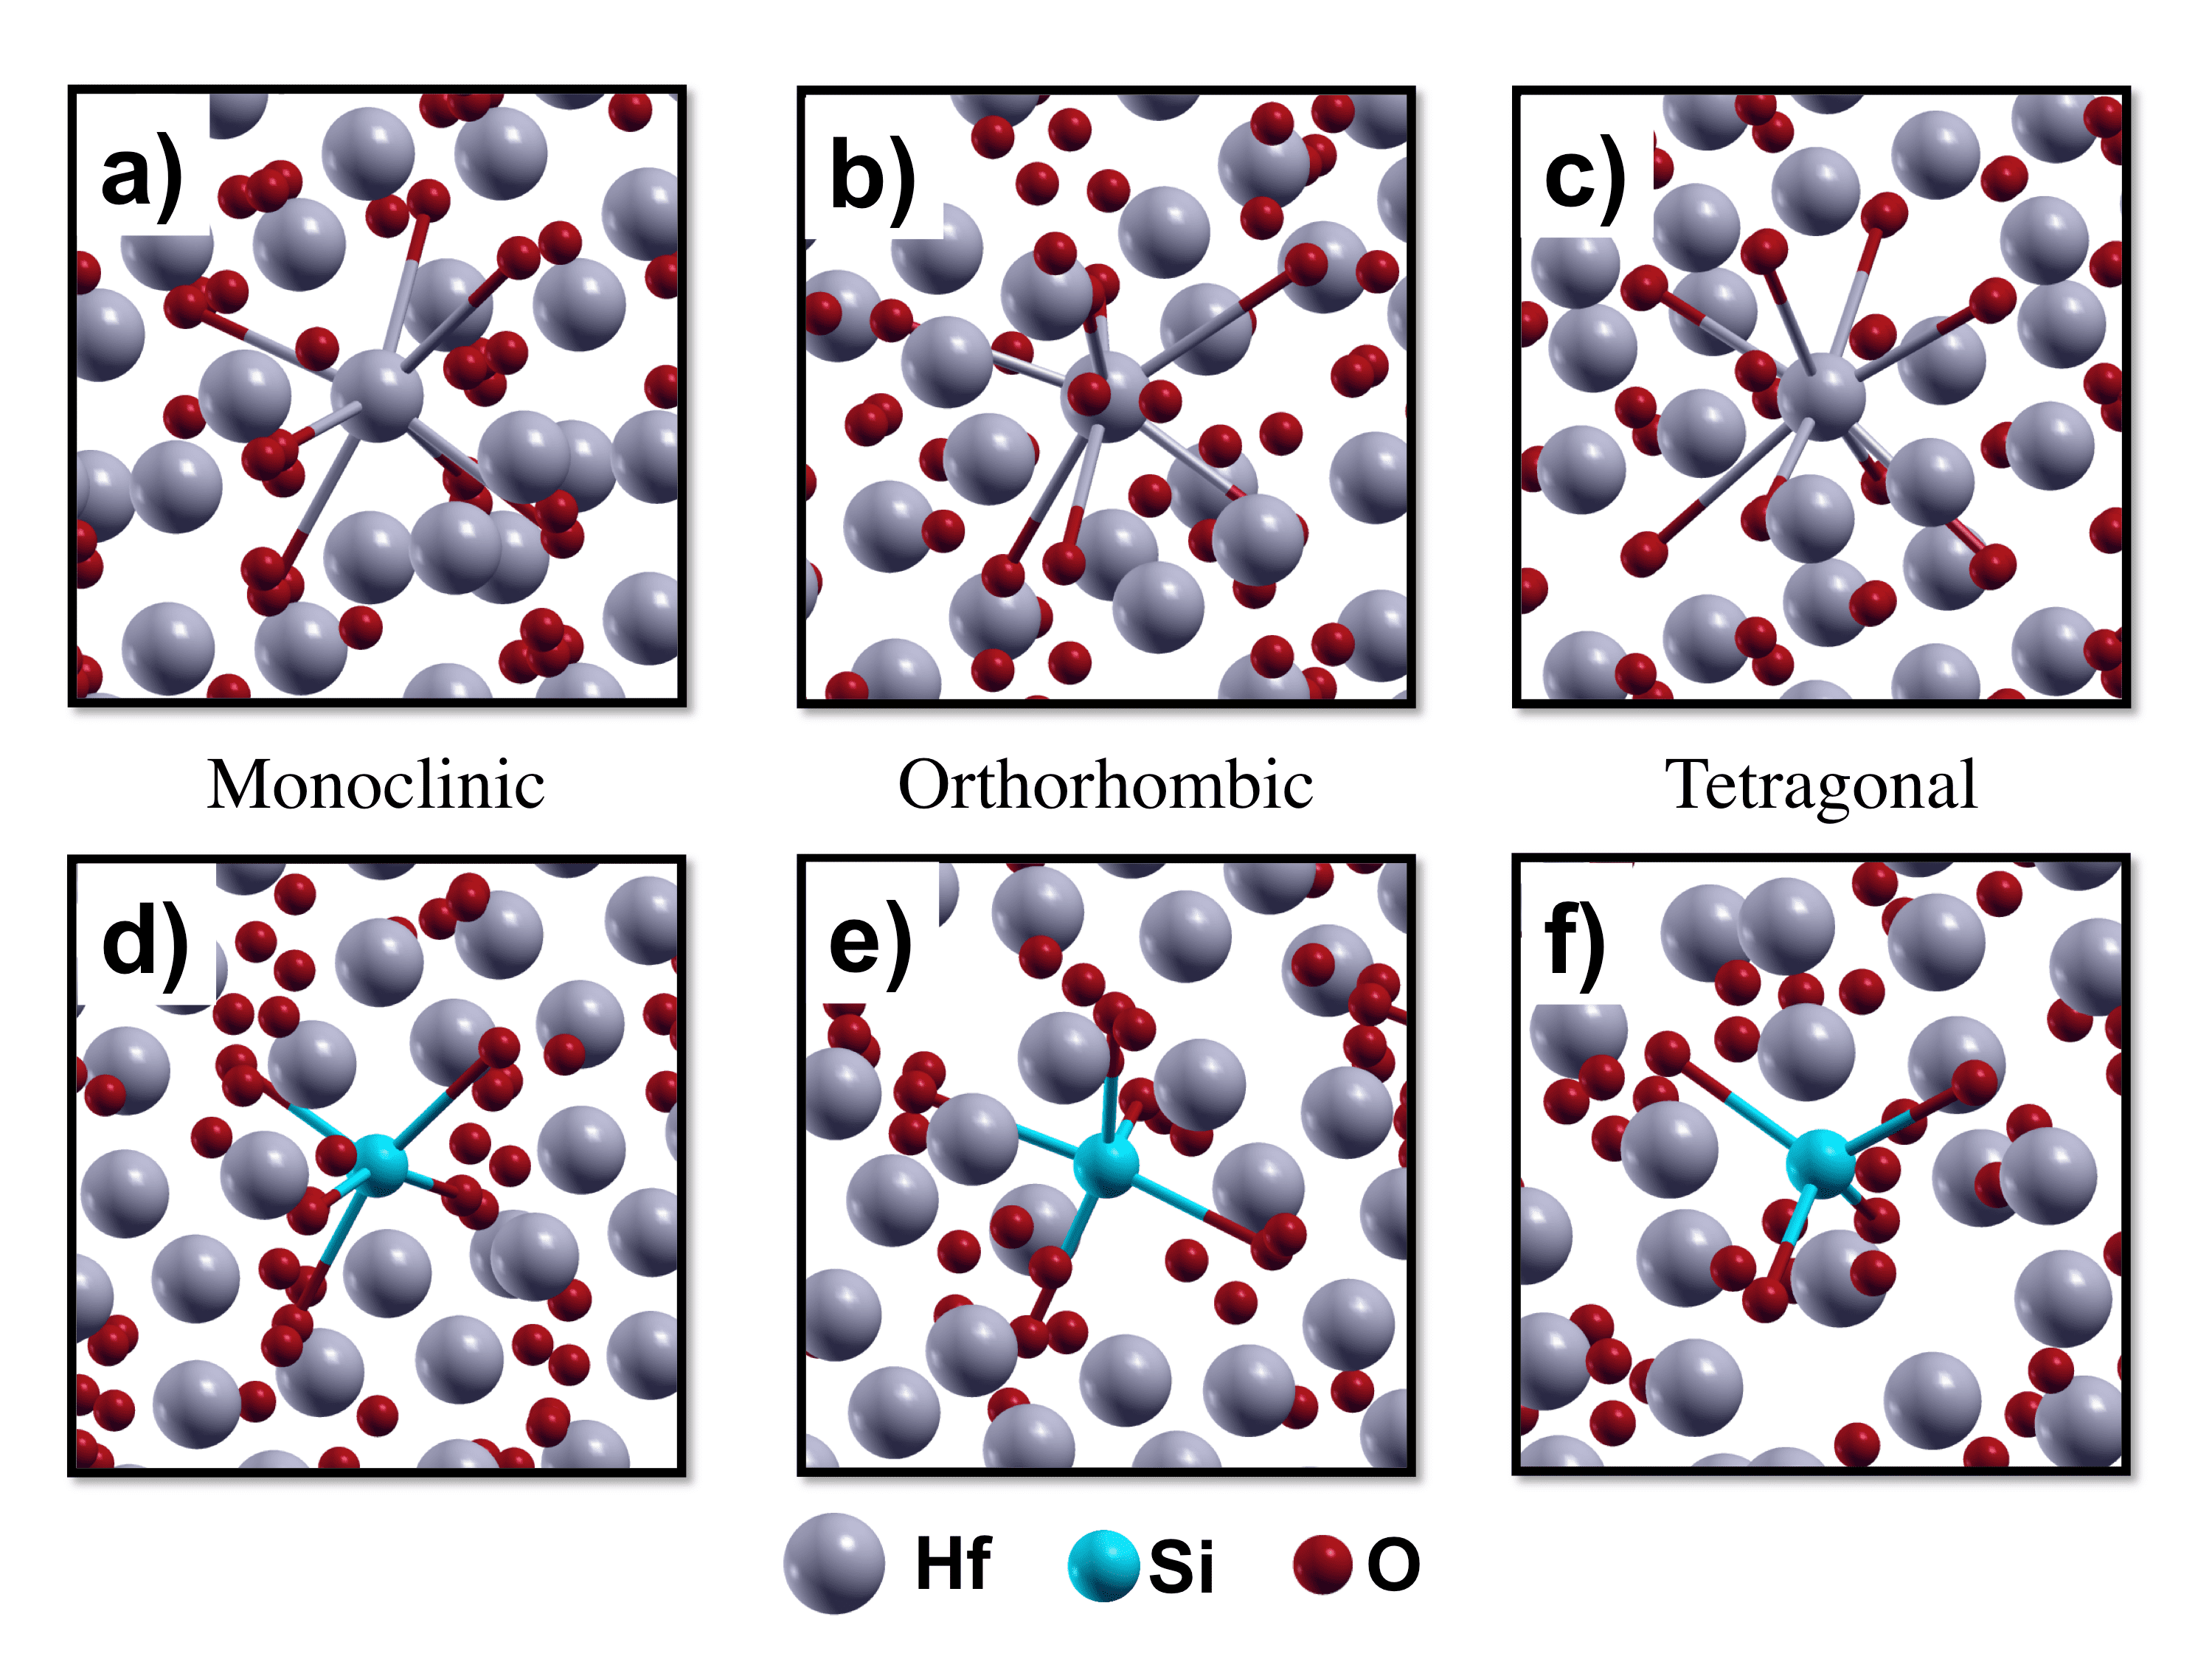 Figure 1
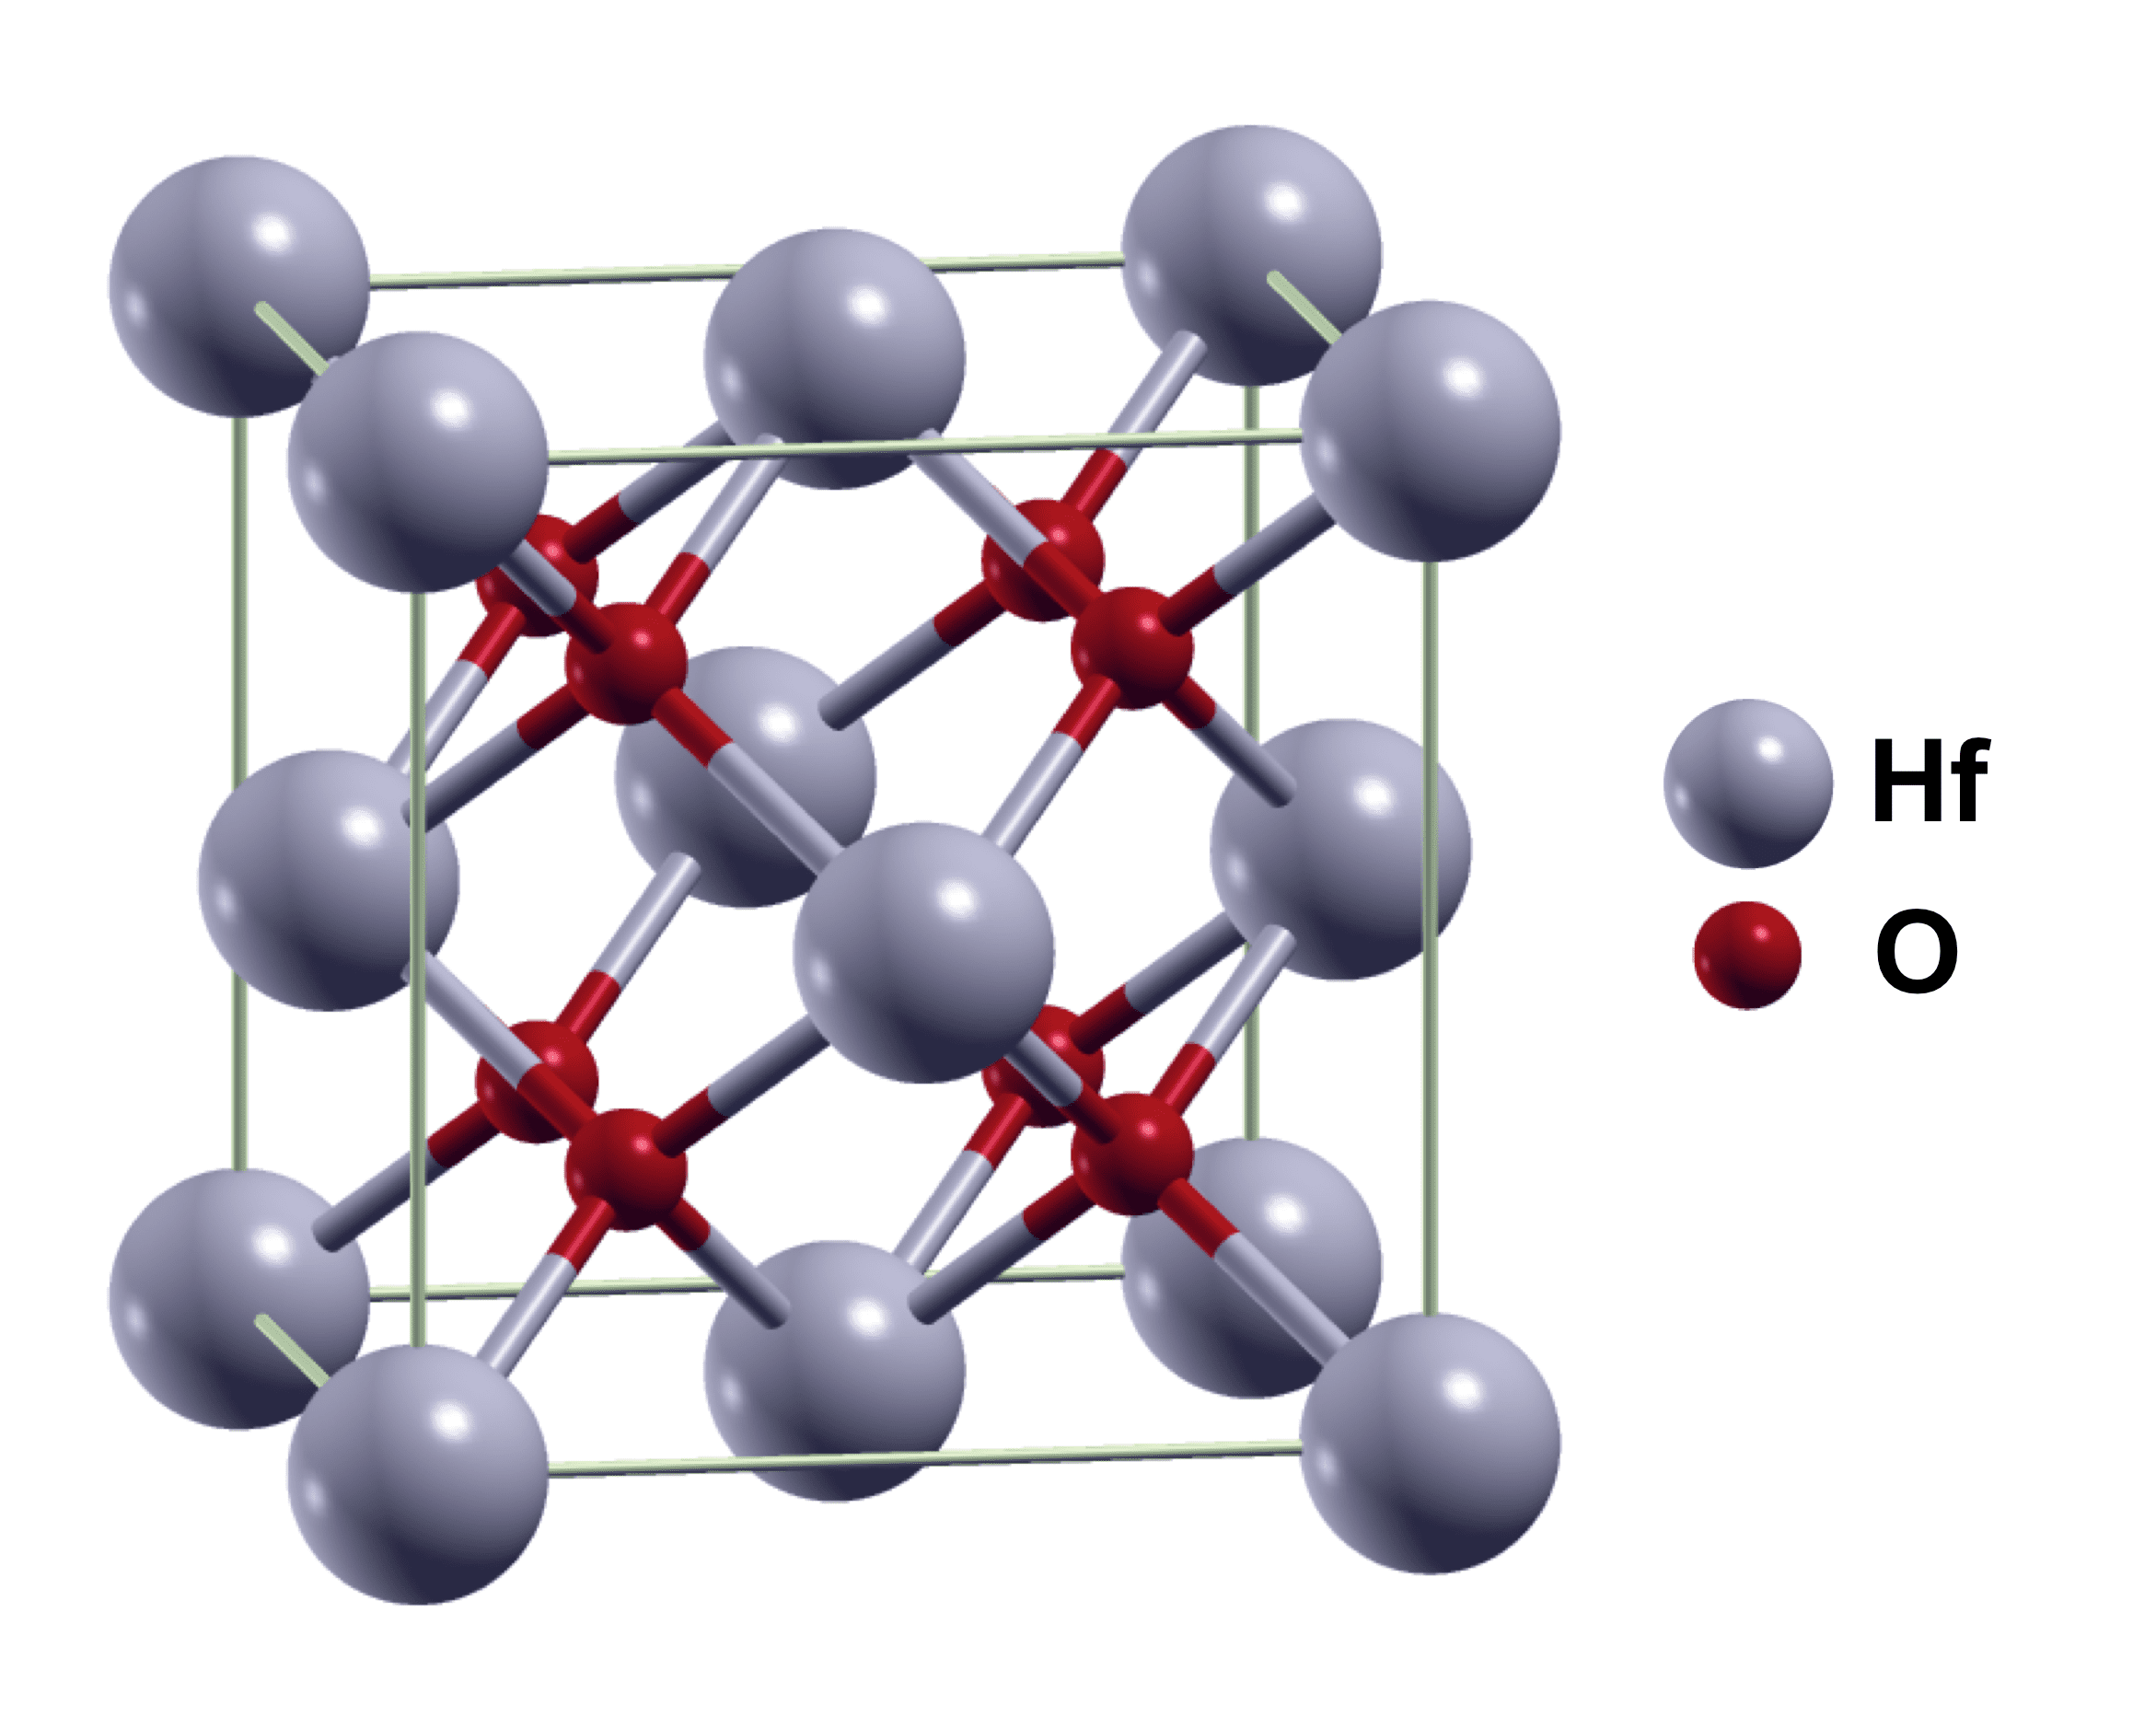 Figure 2
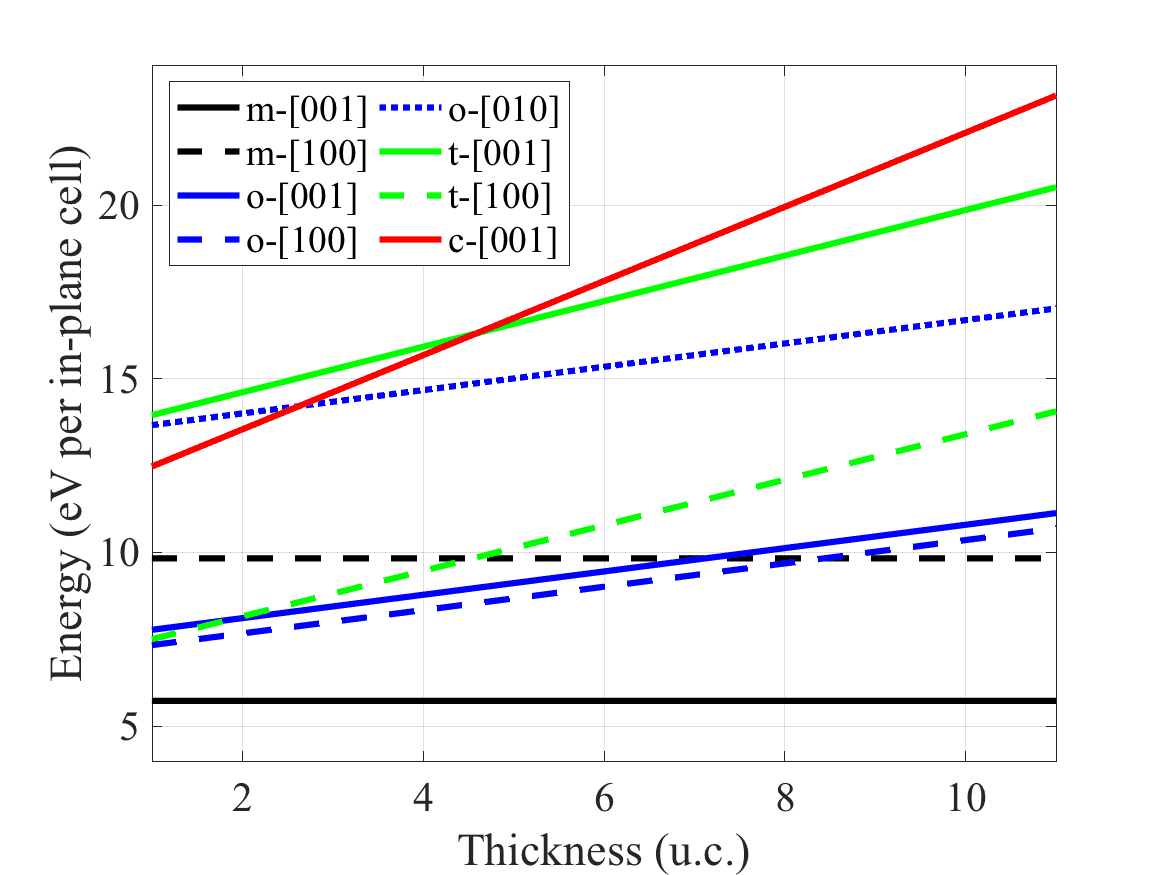 Figure 3
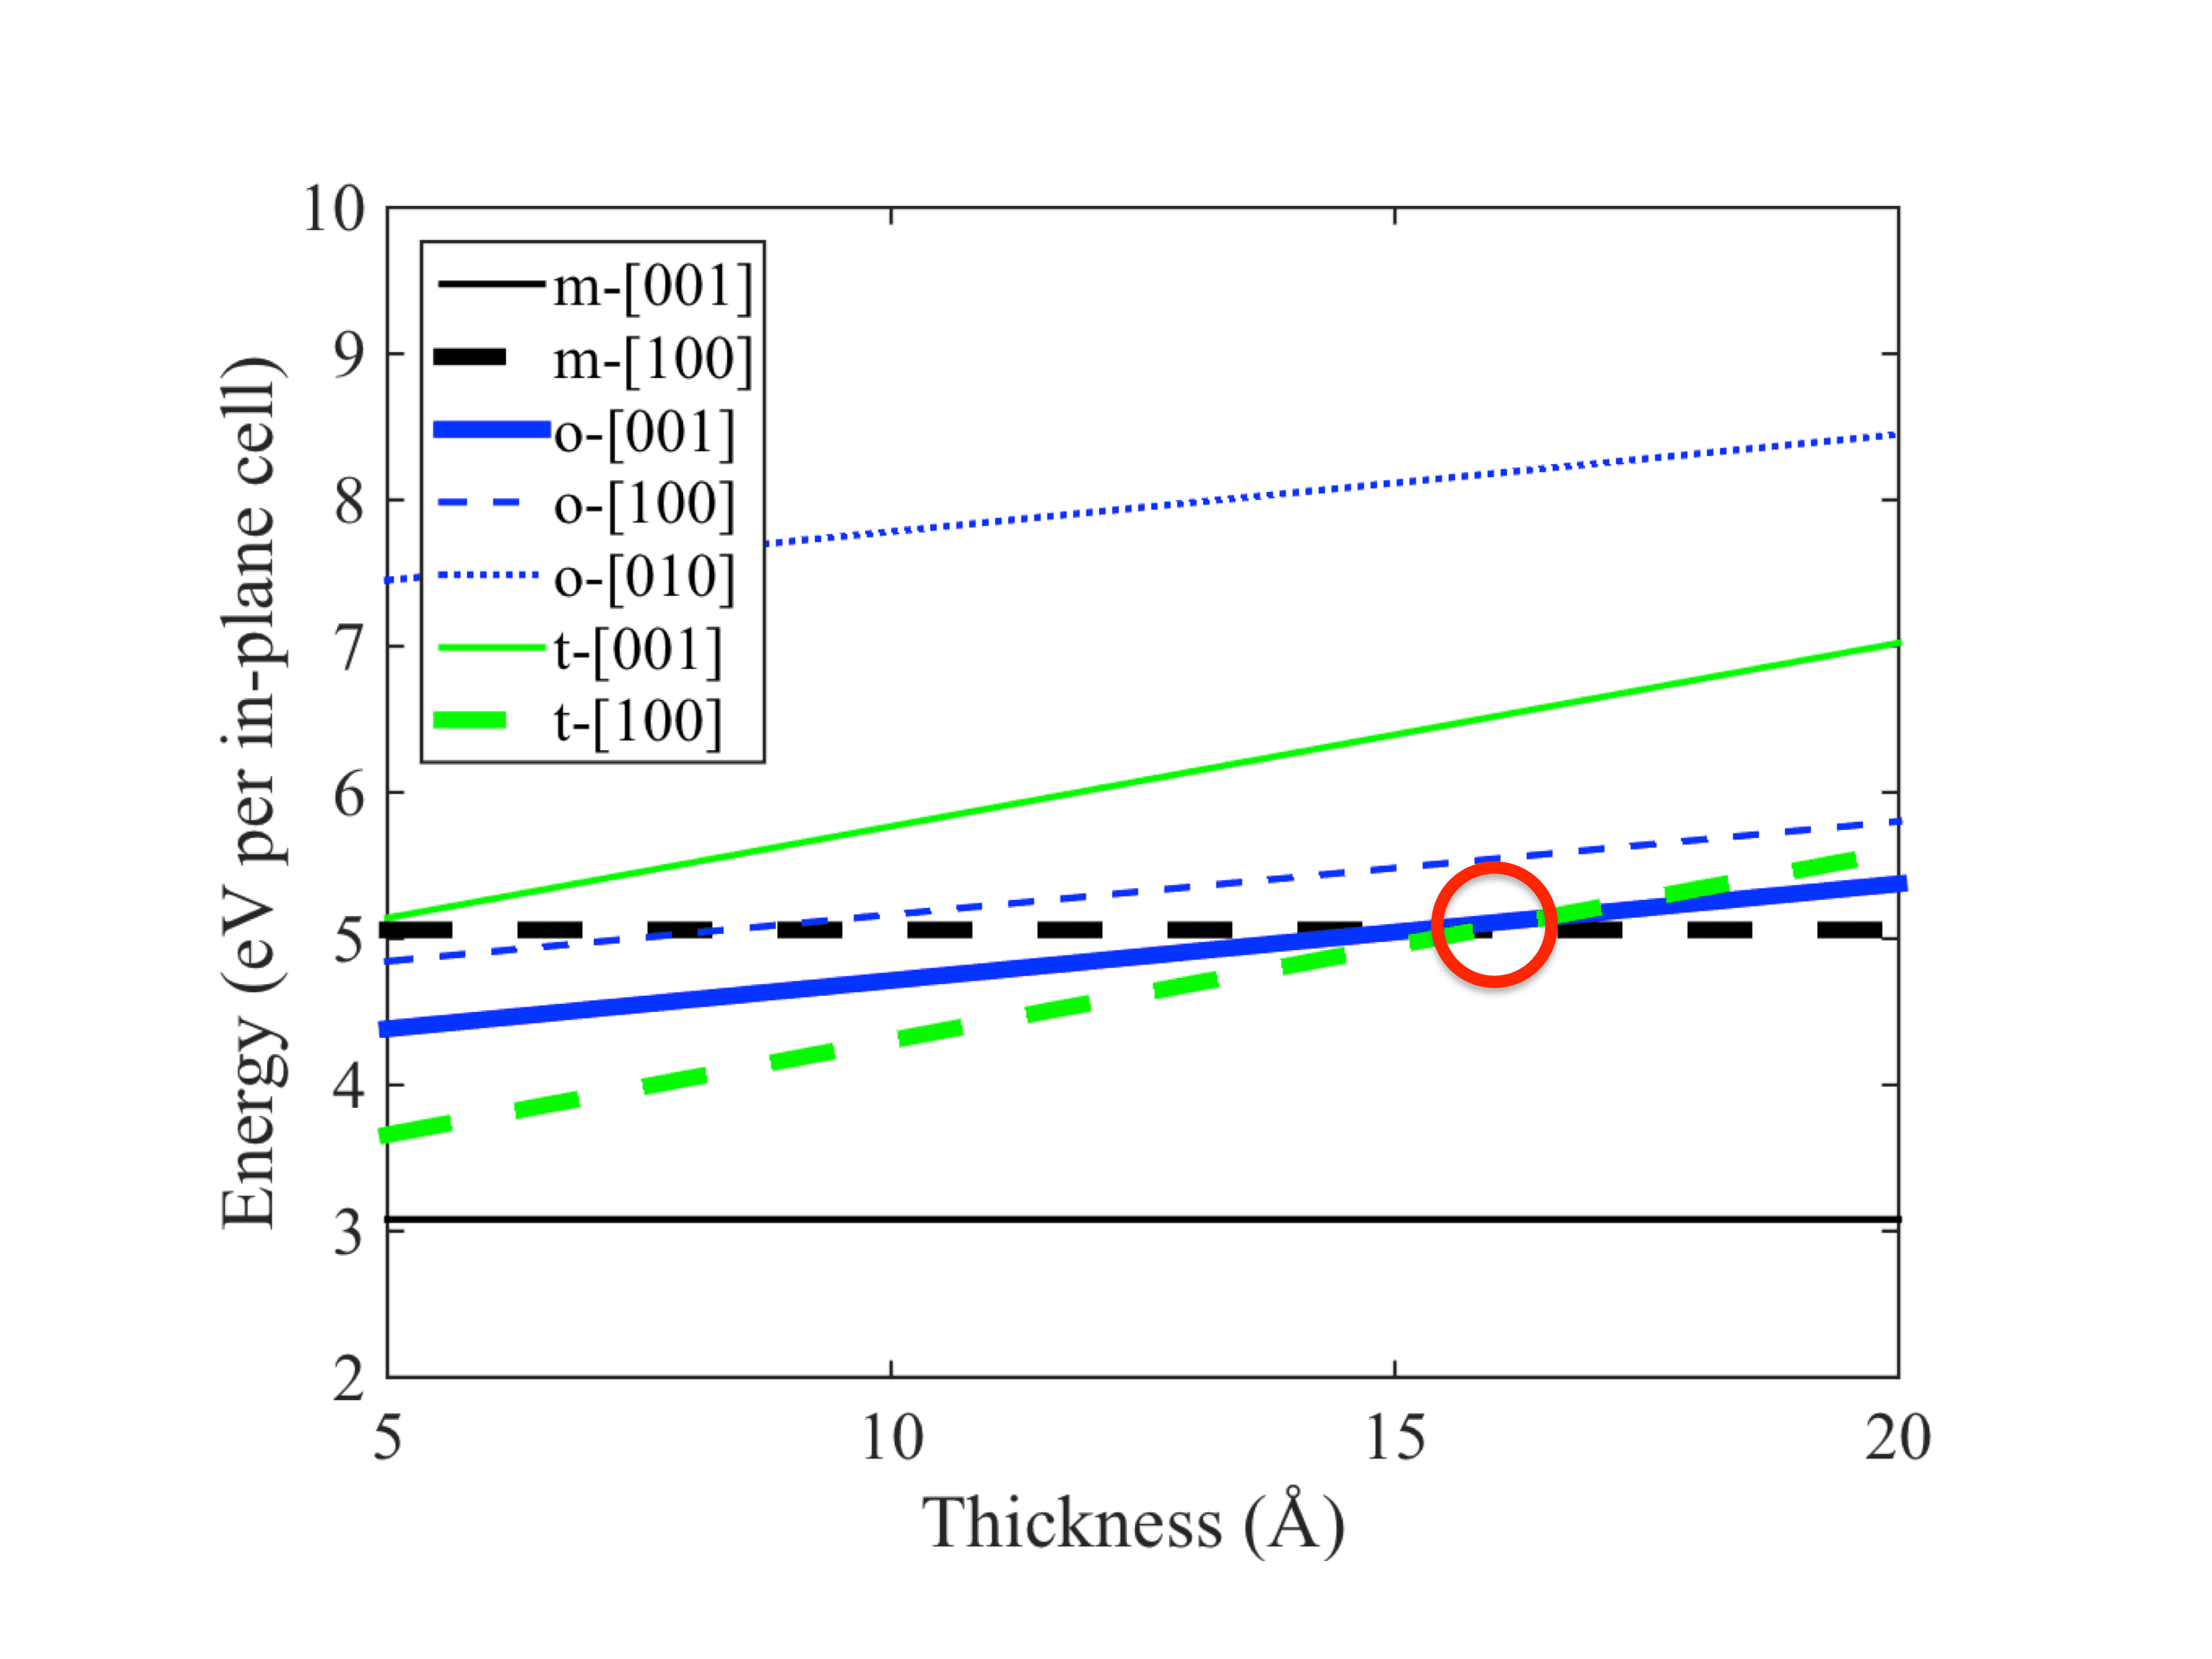 Figure 4
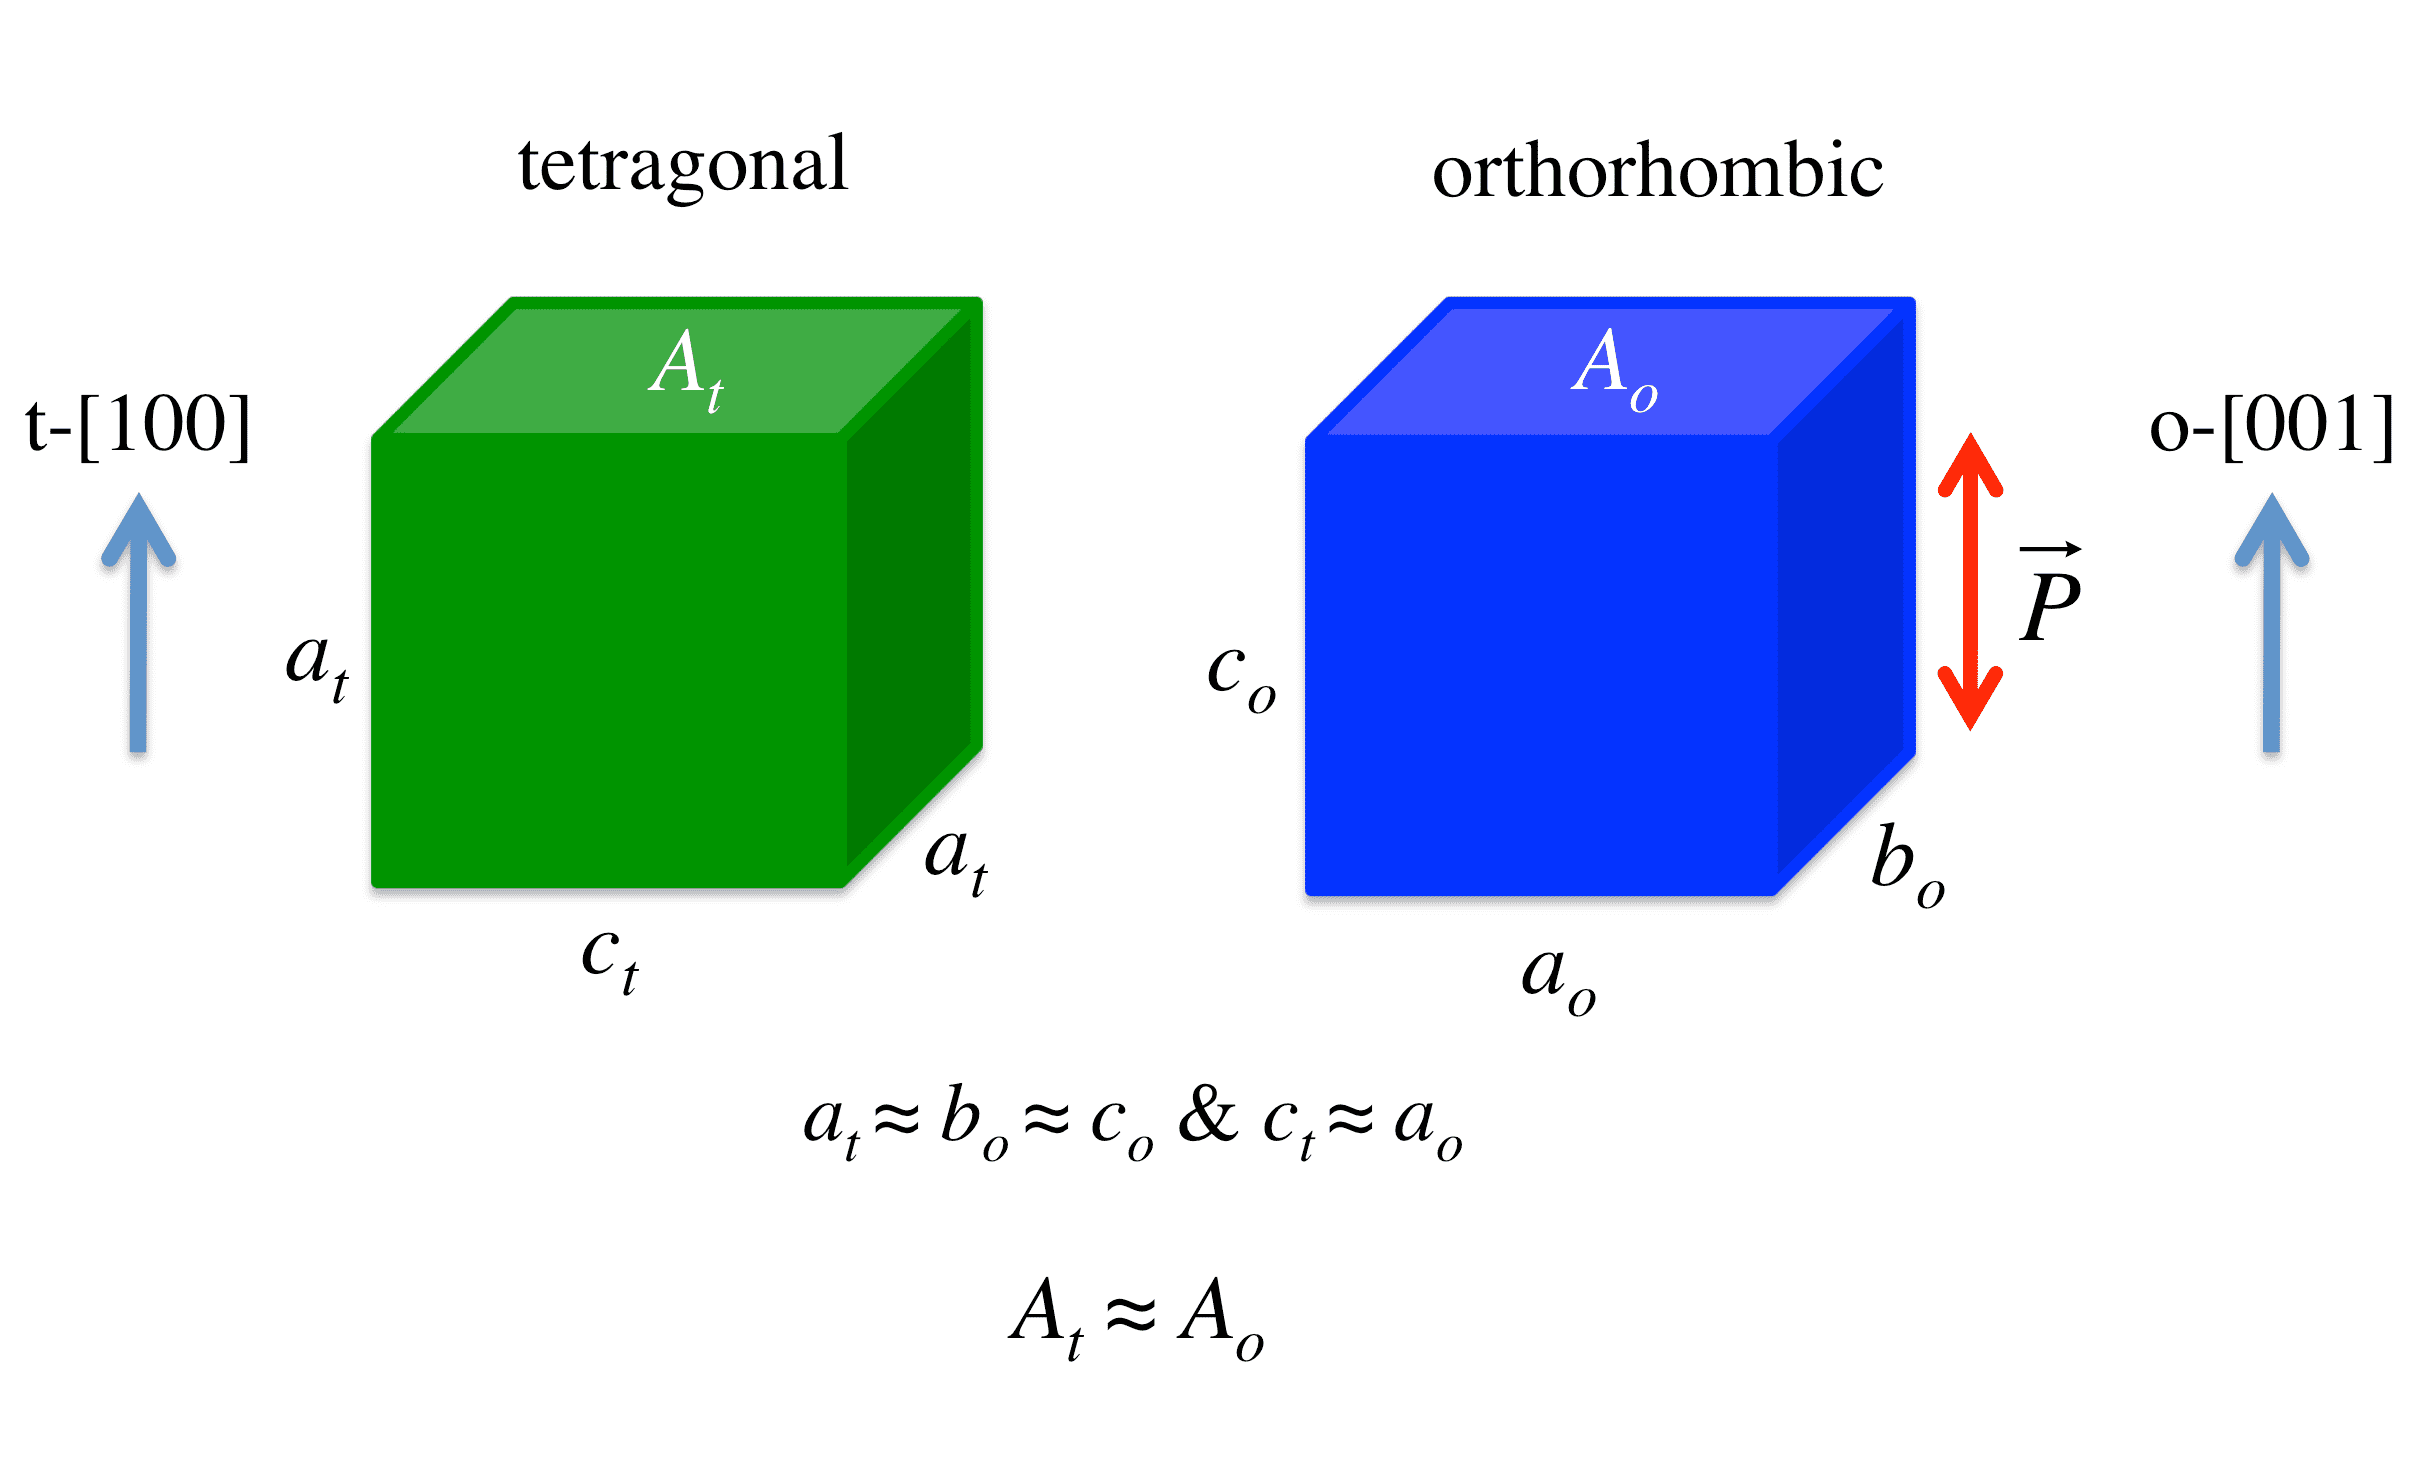 Figure 5
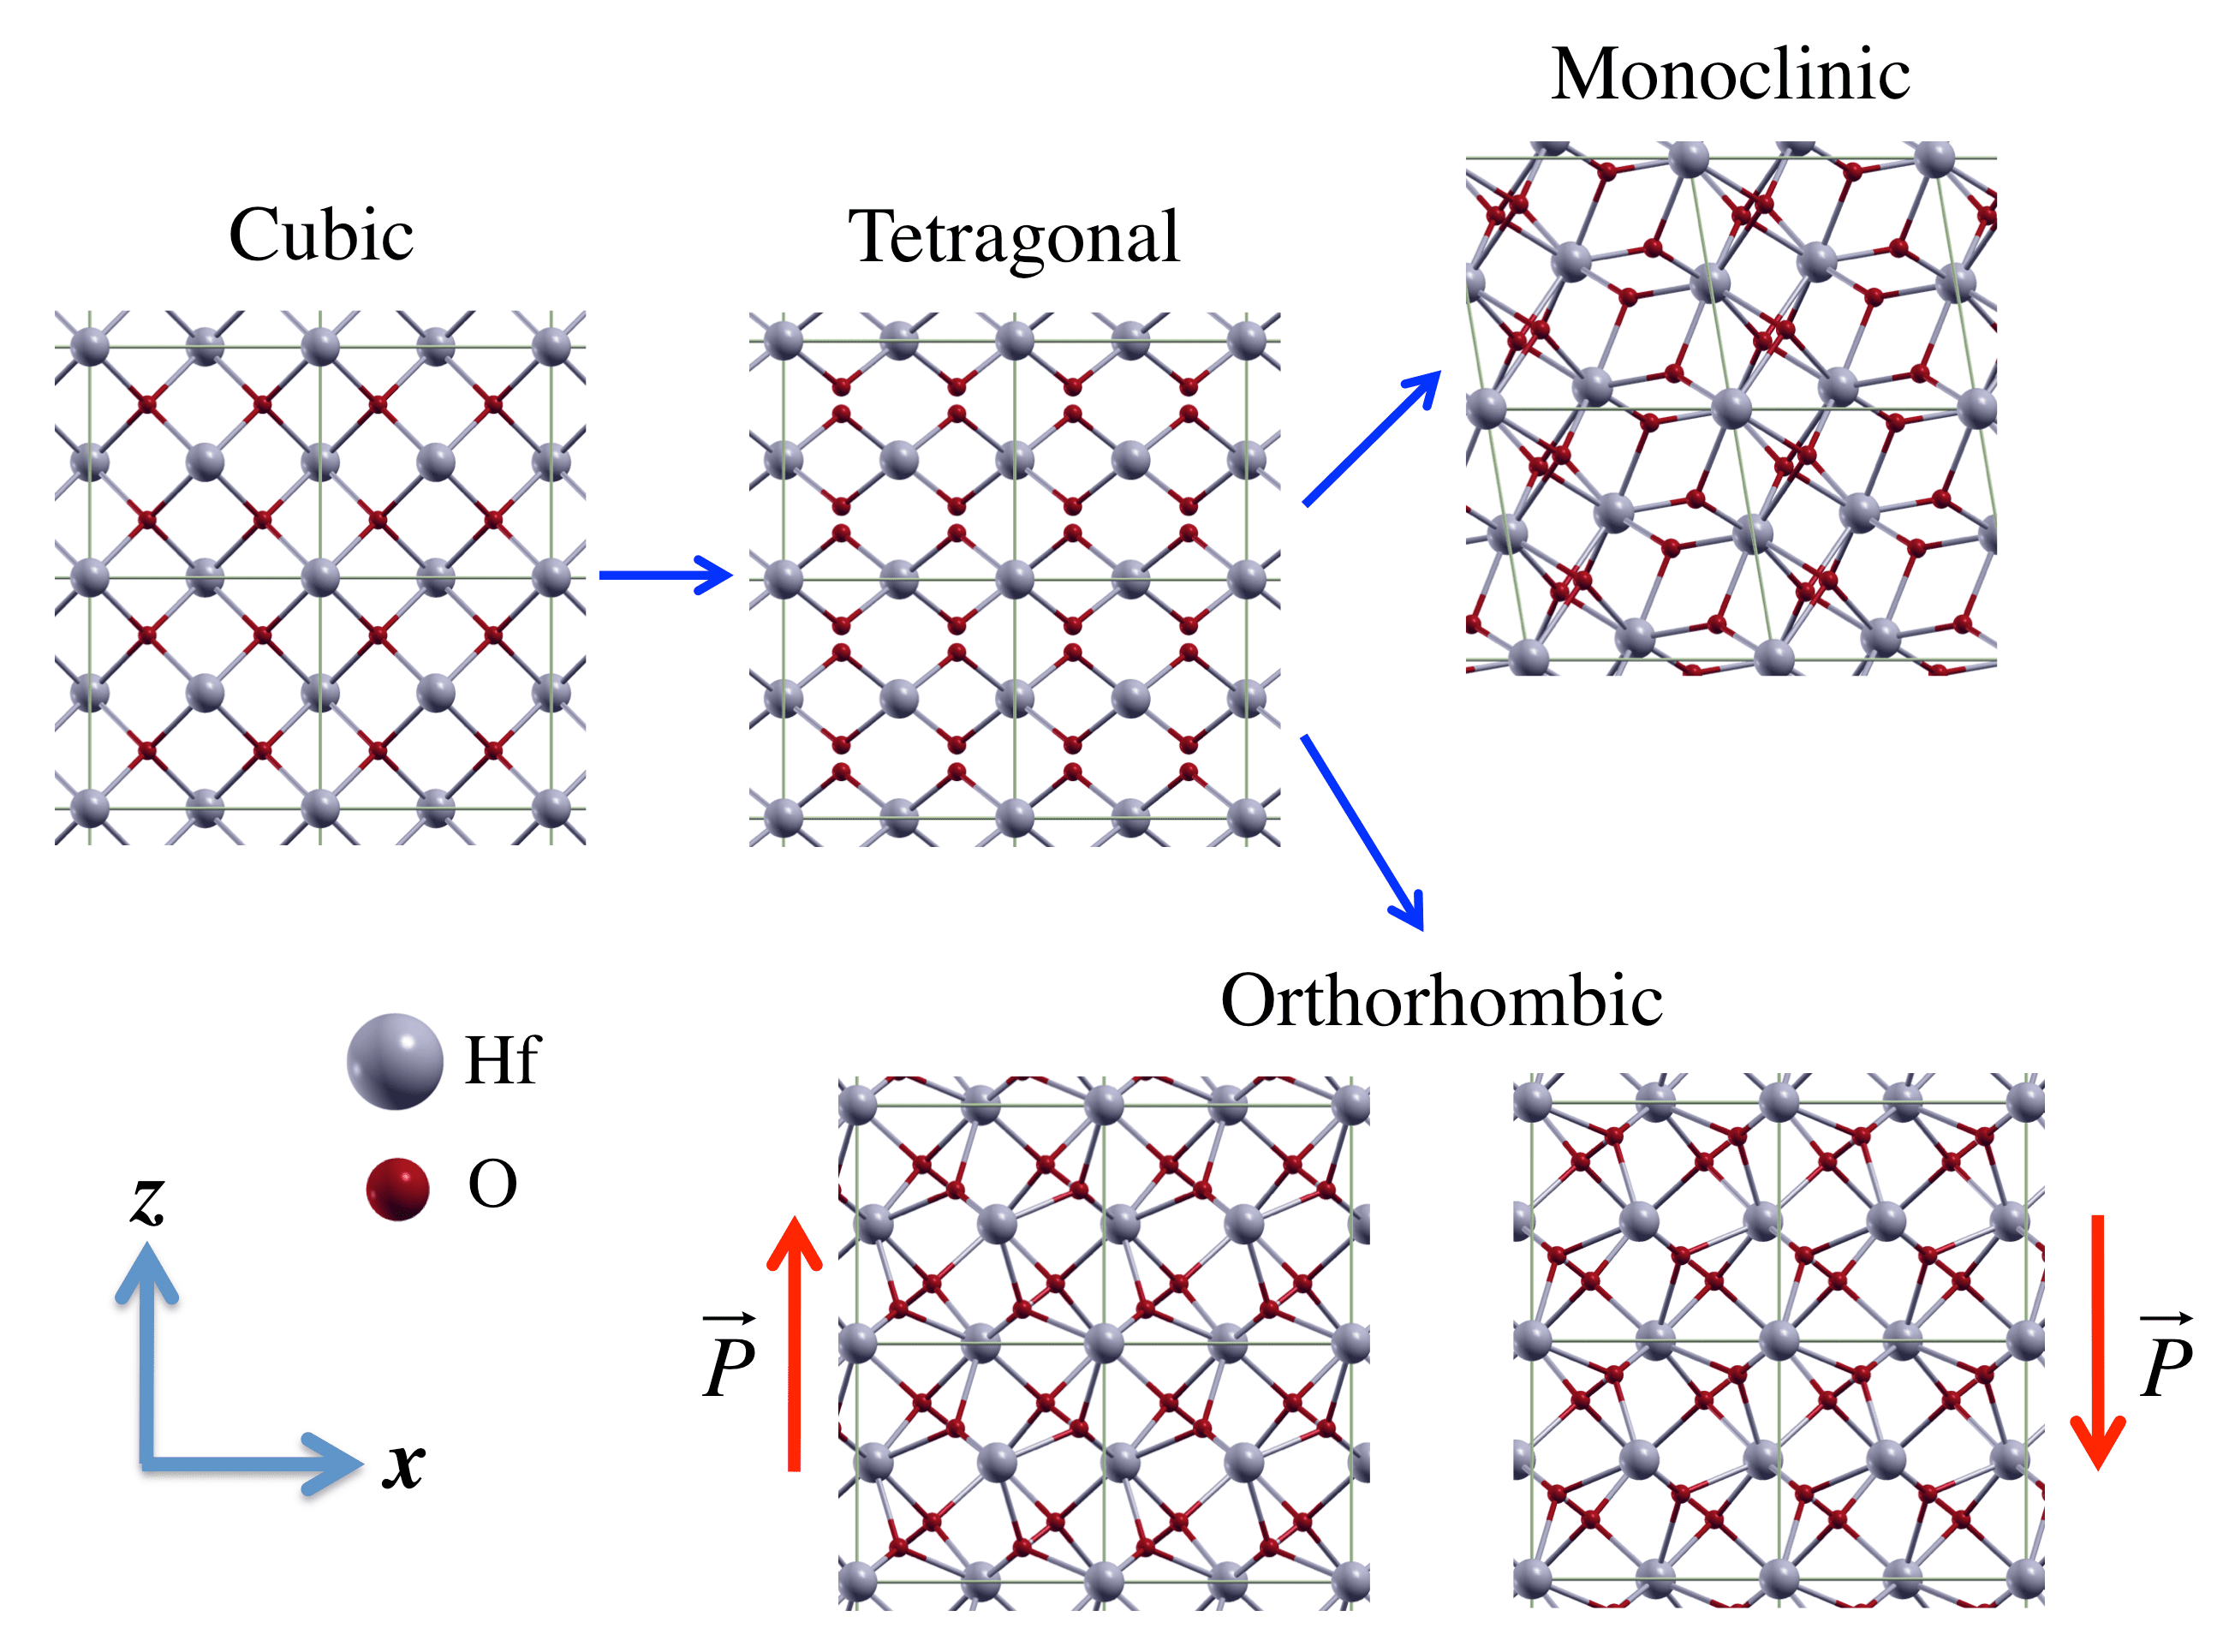 Figure 6
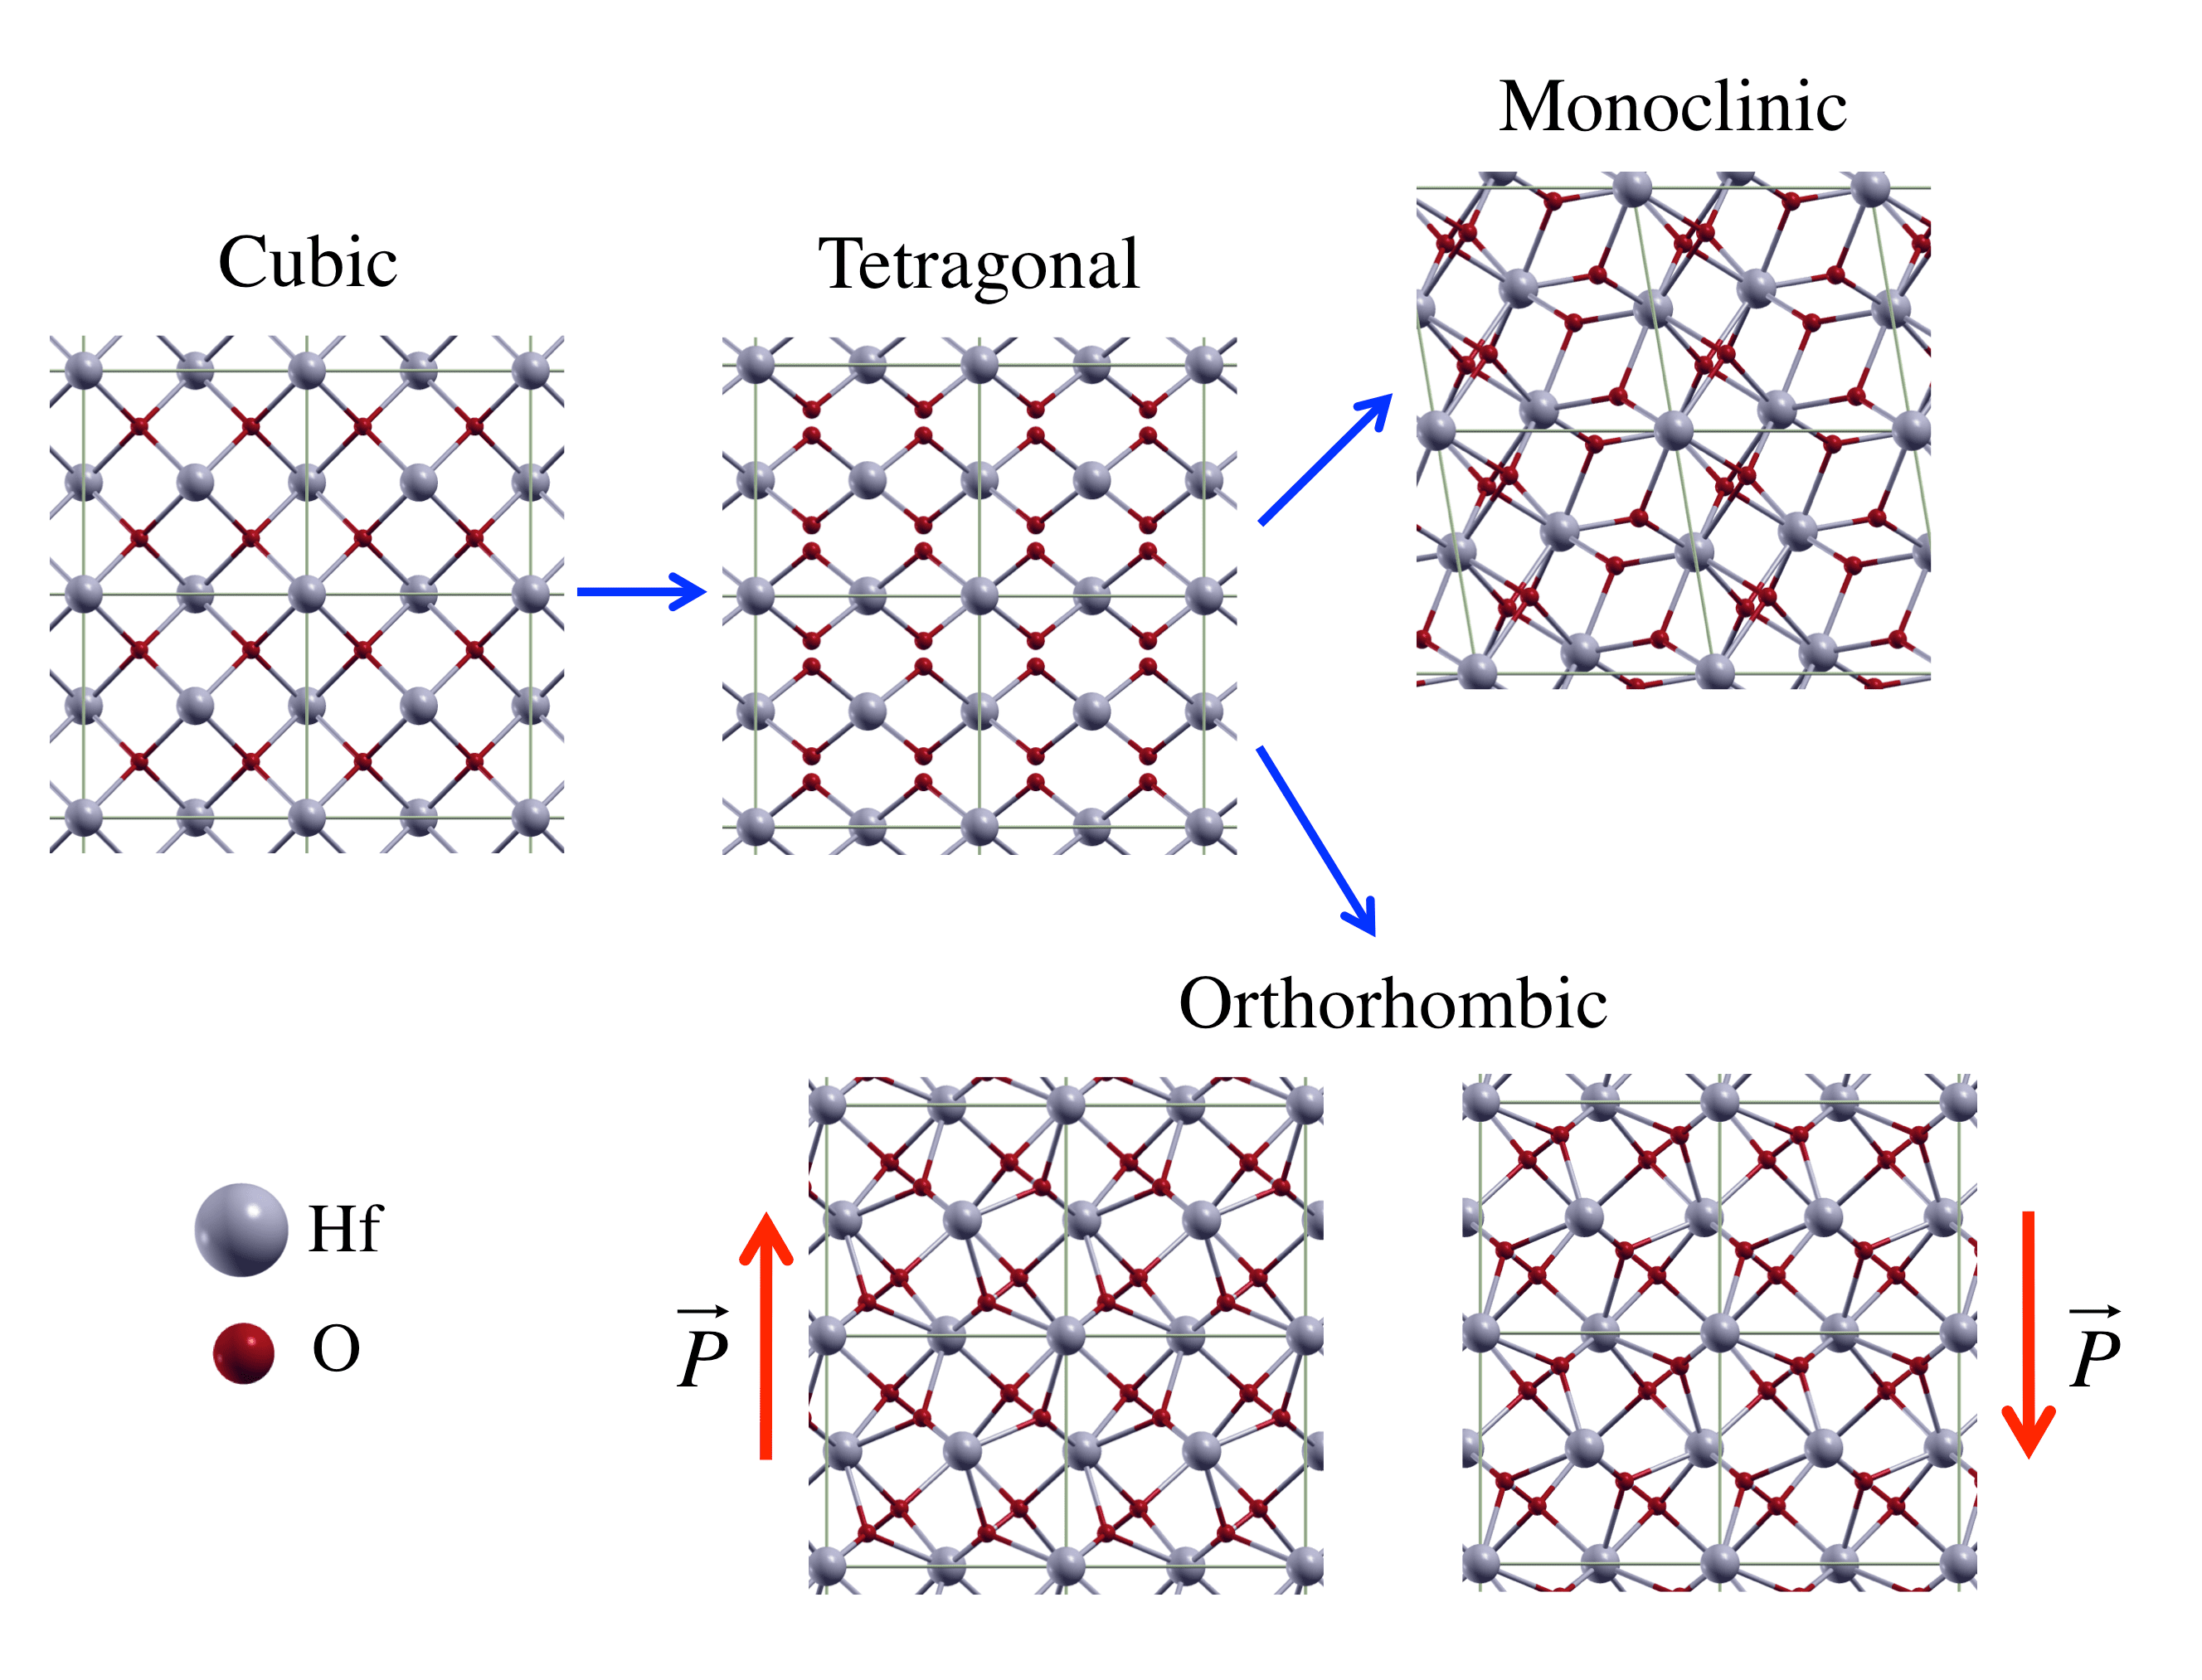 Figure 7
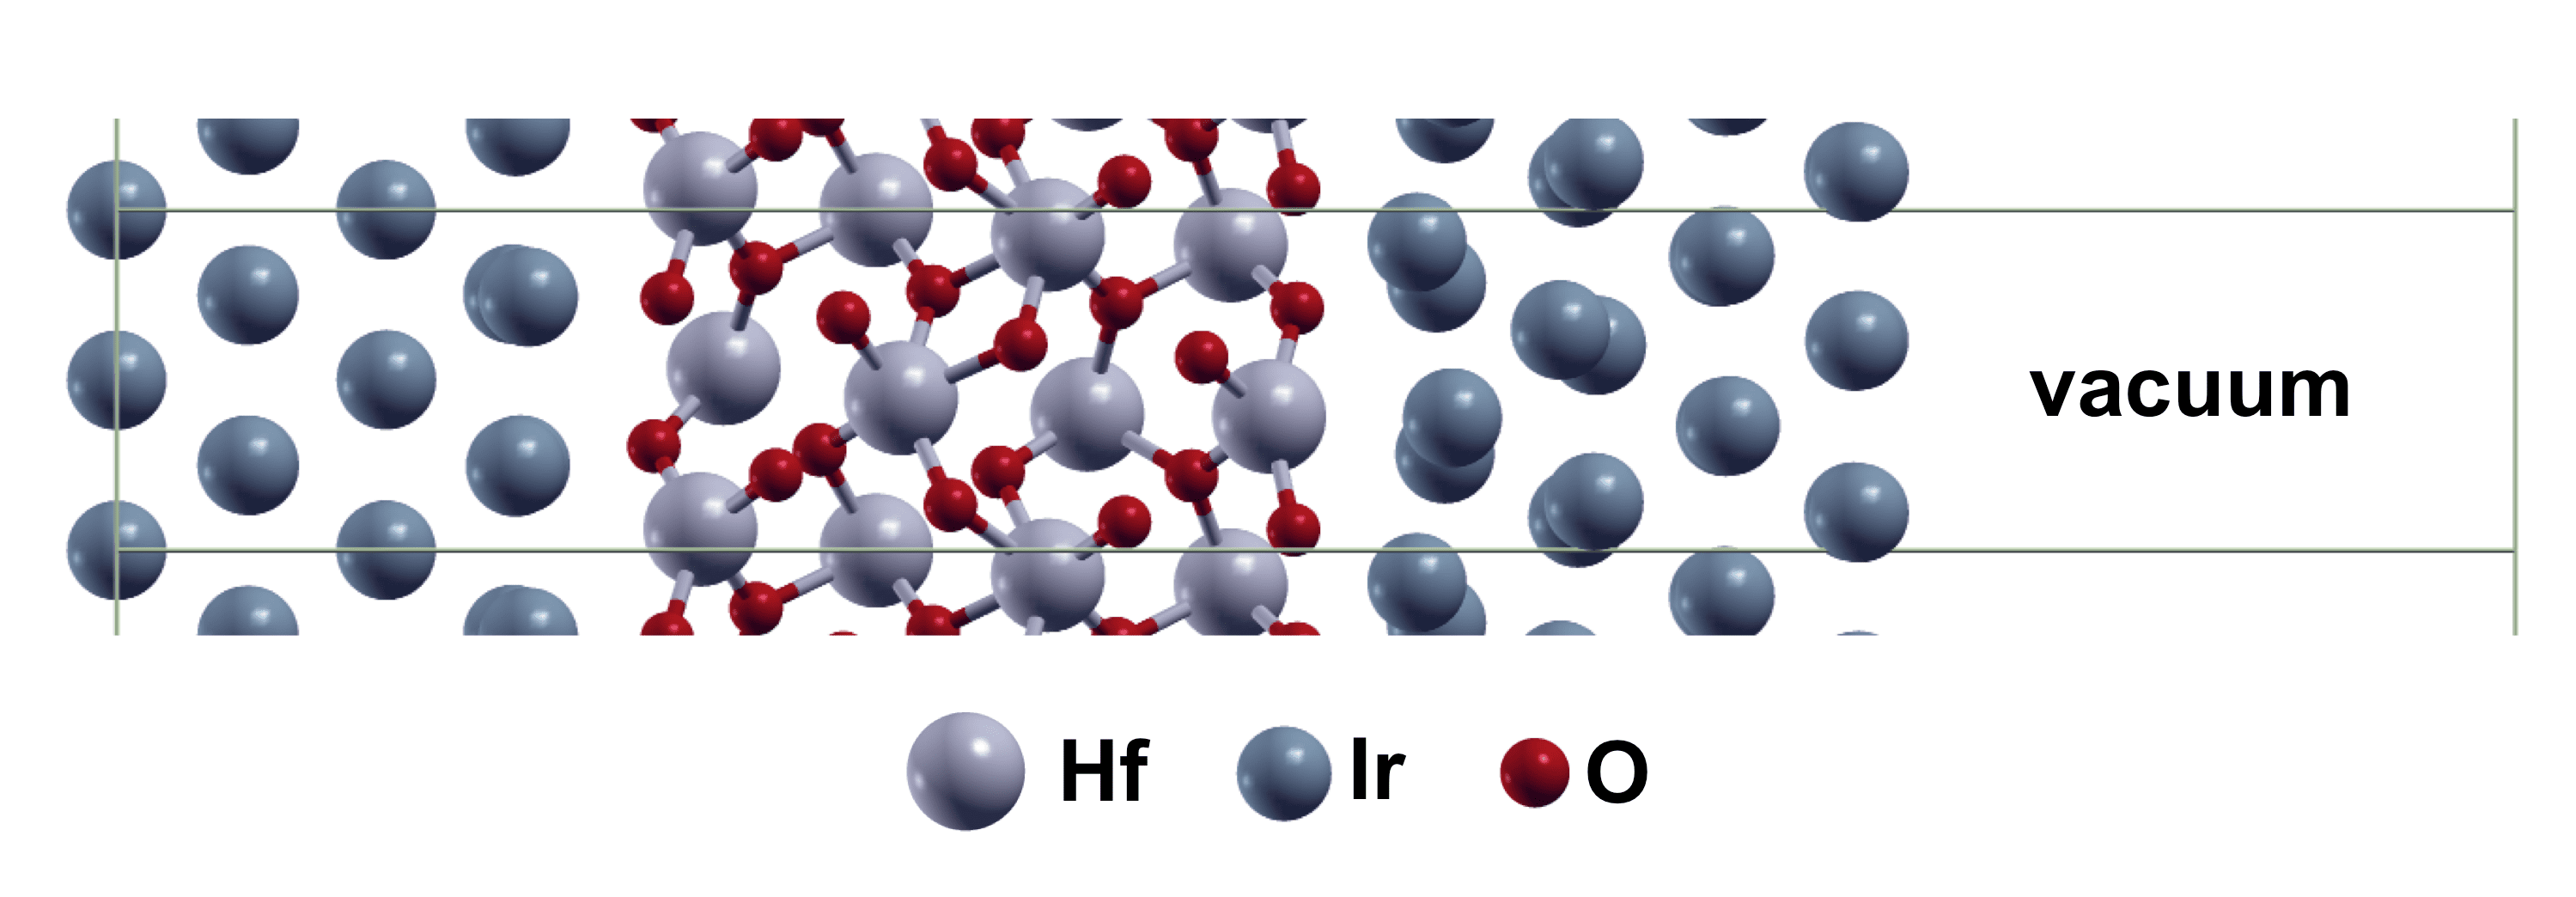 Figure 8
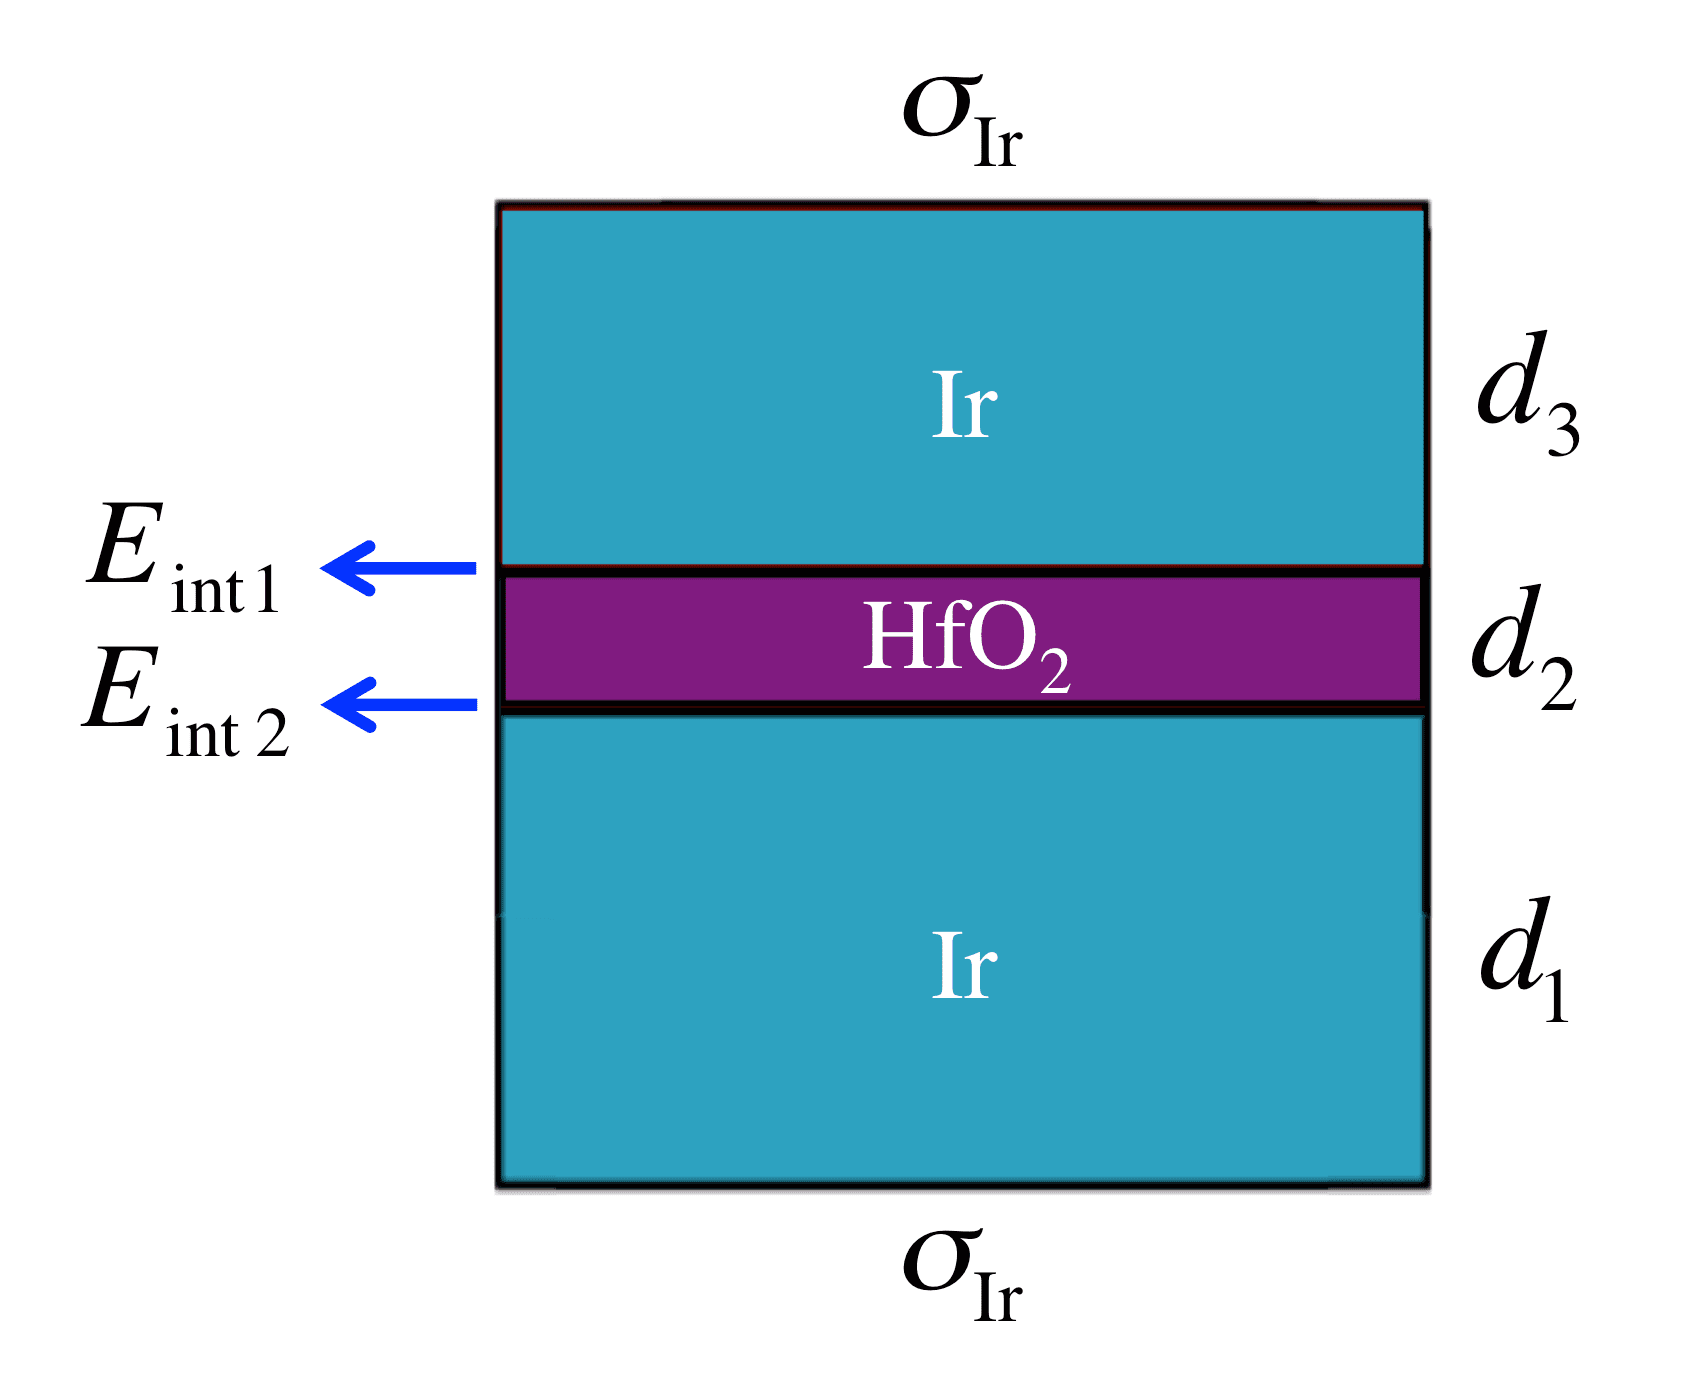 Figure 9
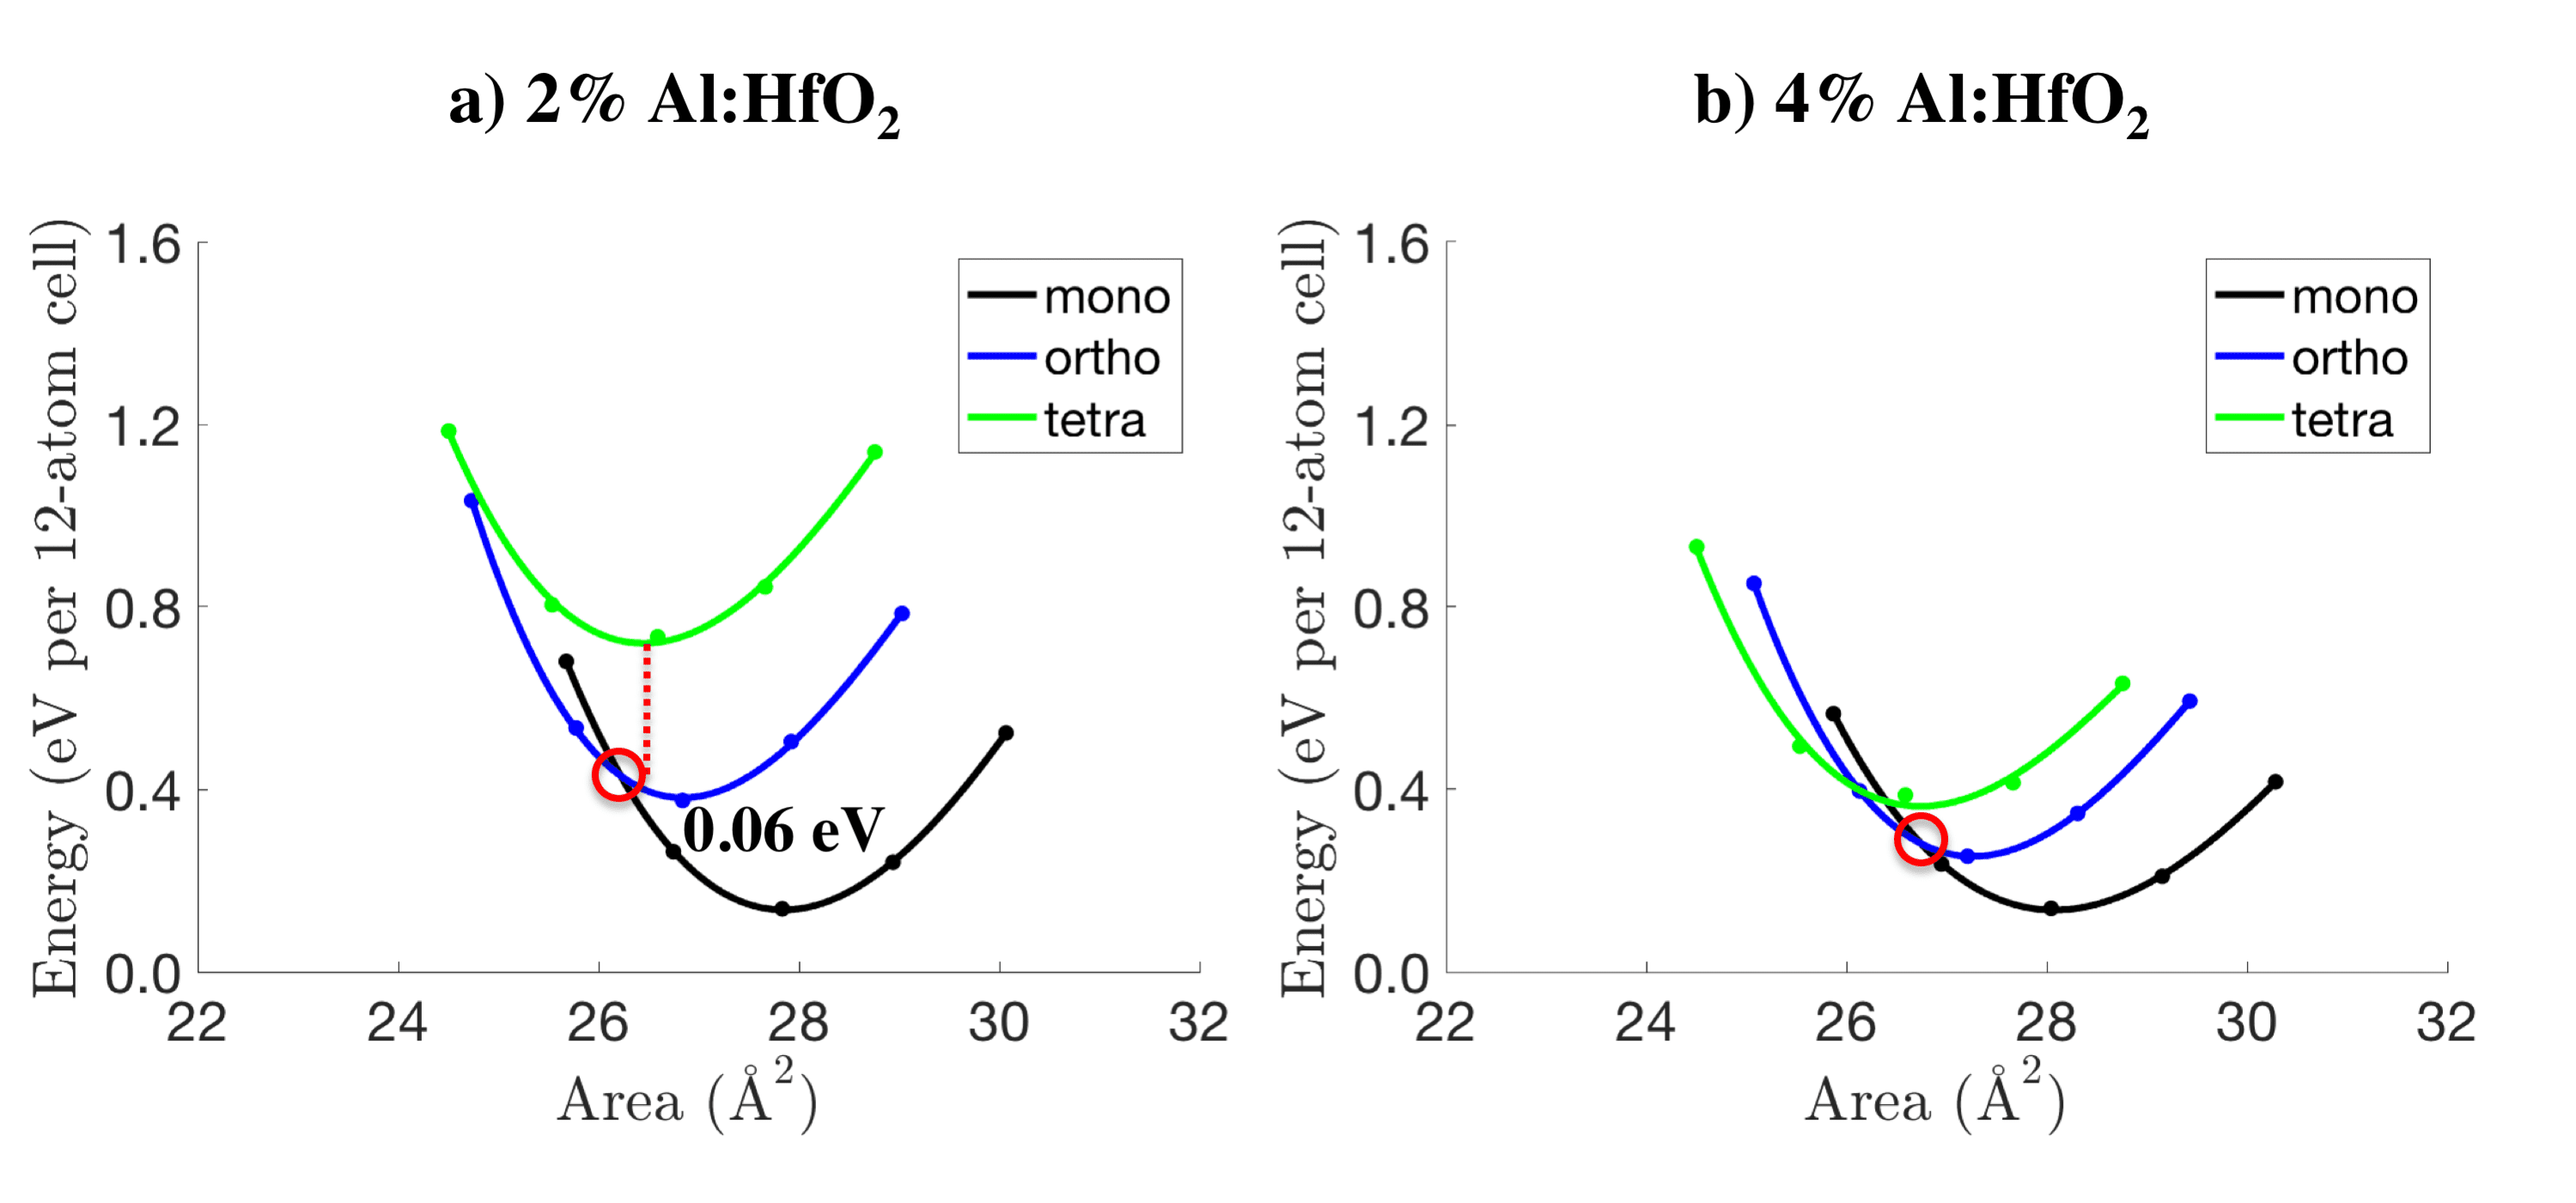 Figure 10
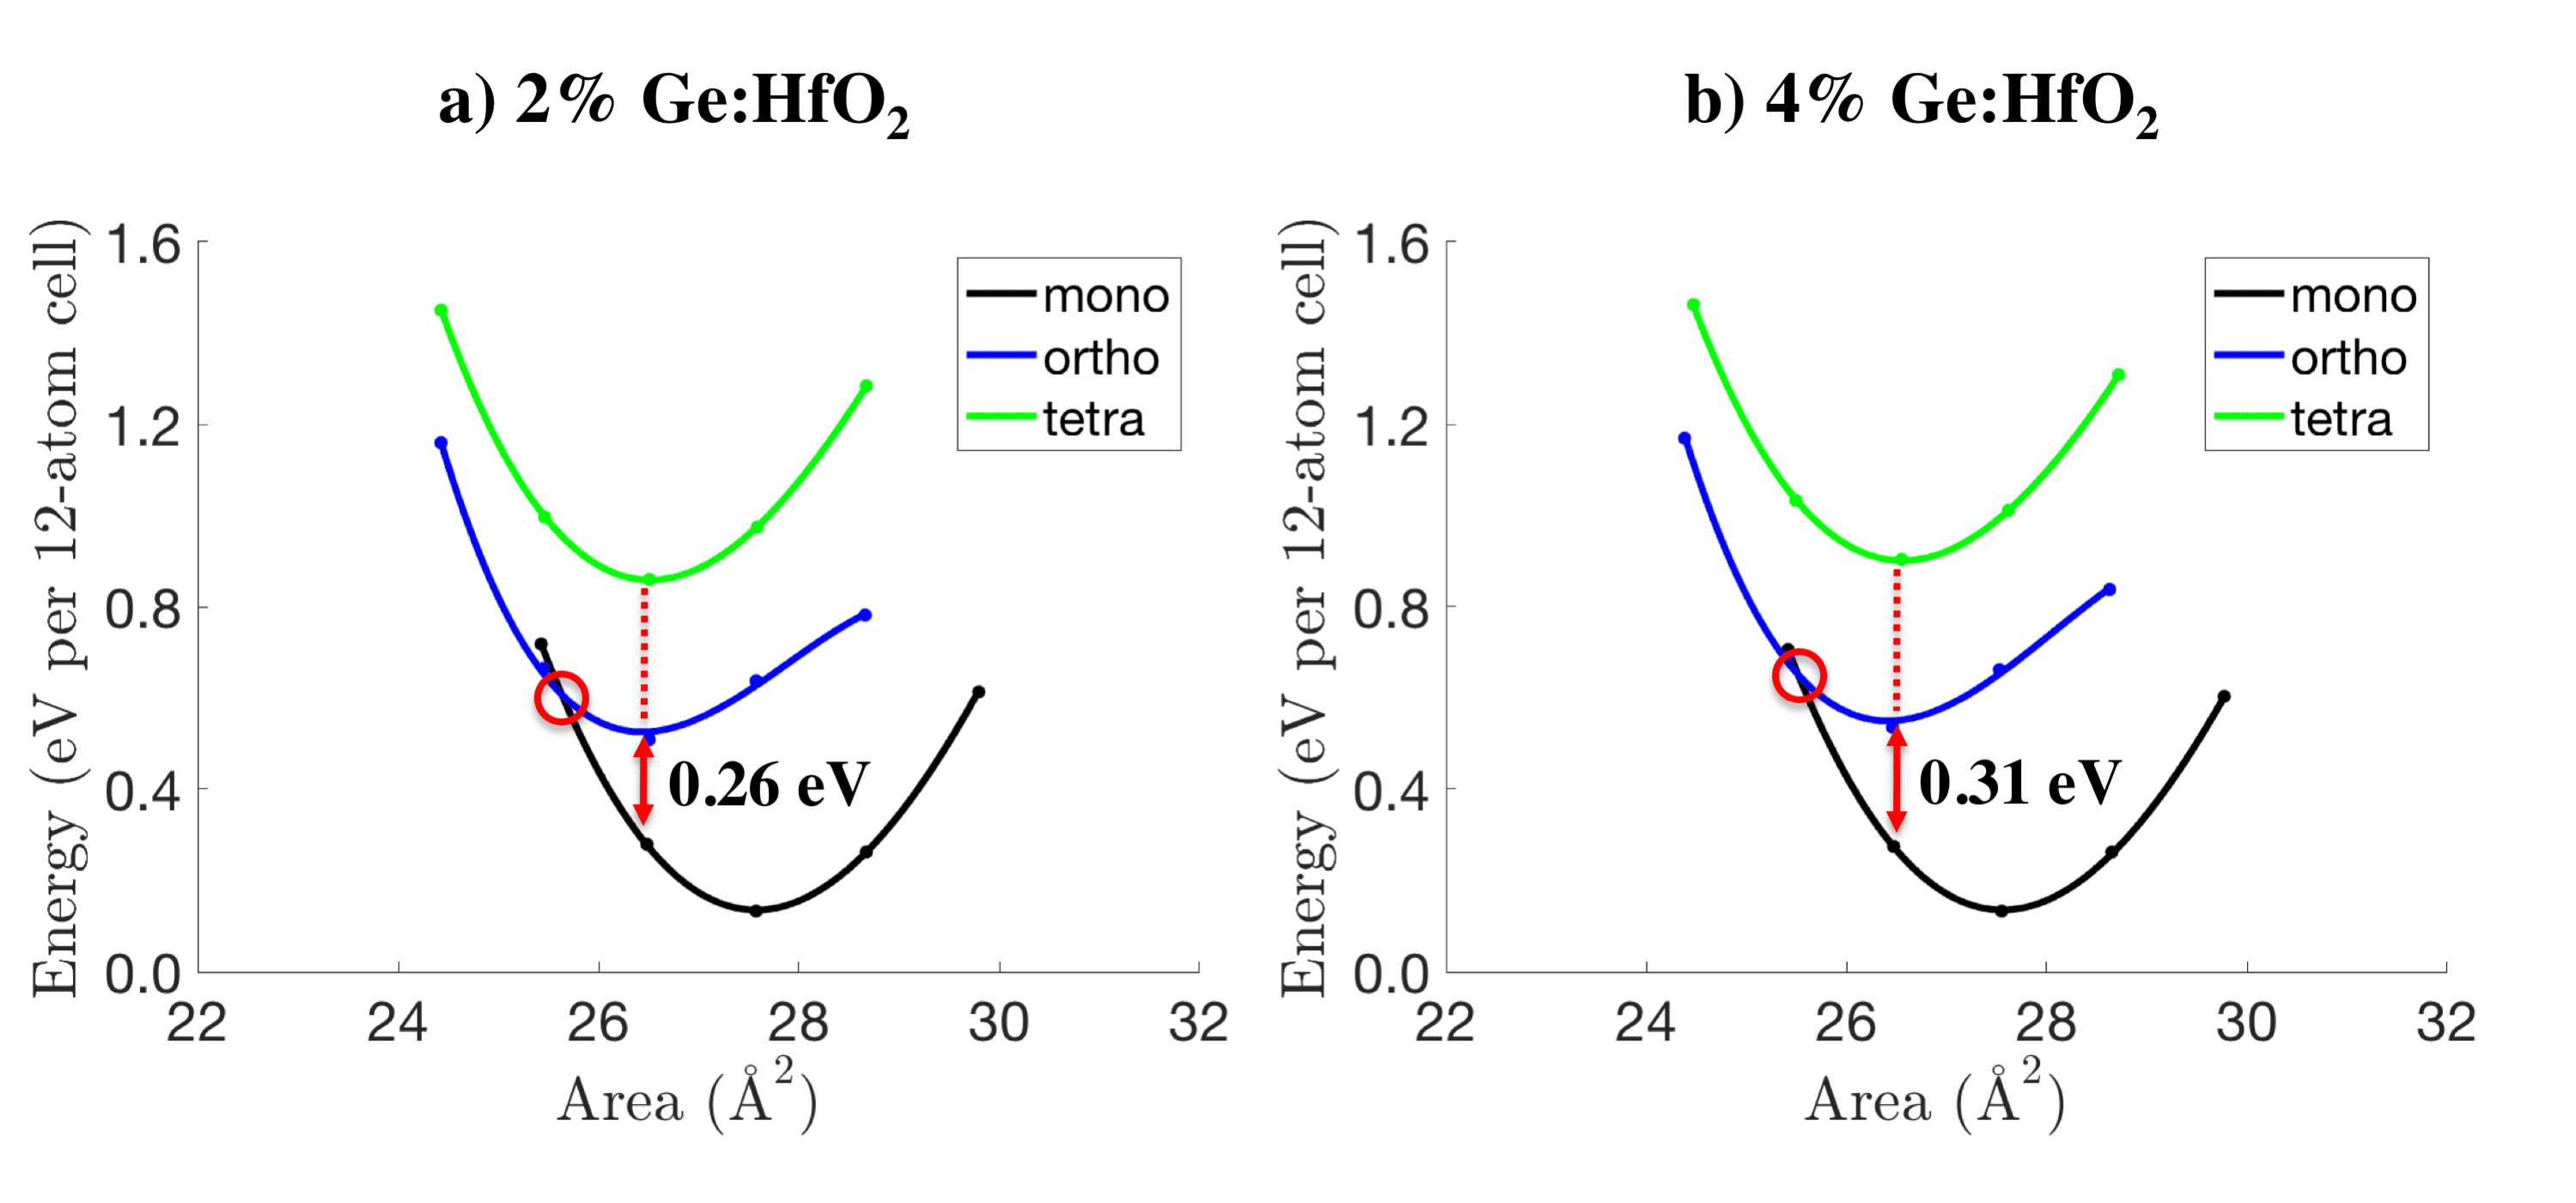 Figure 11
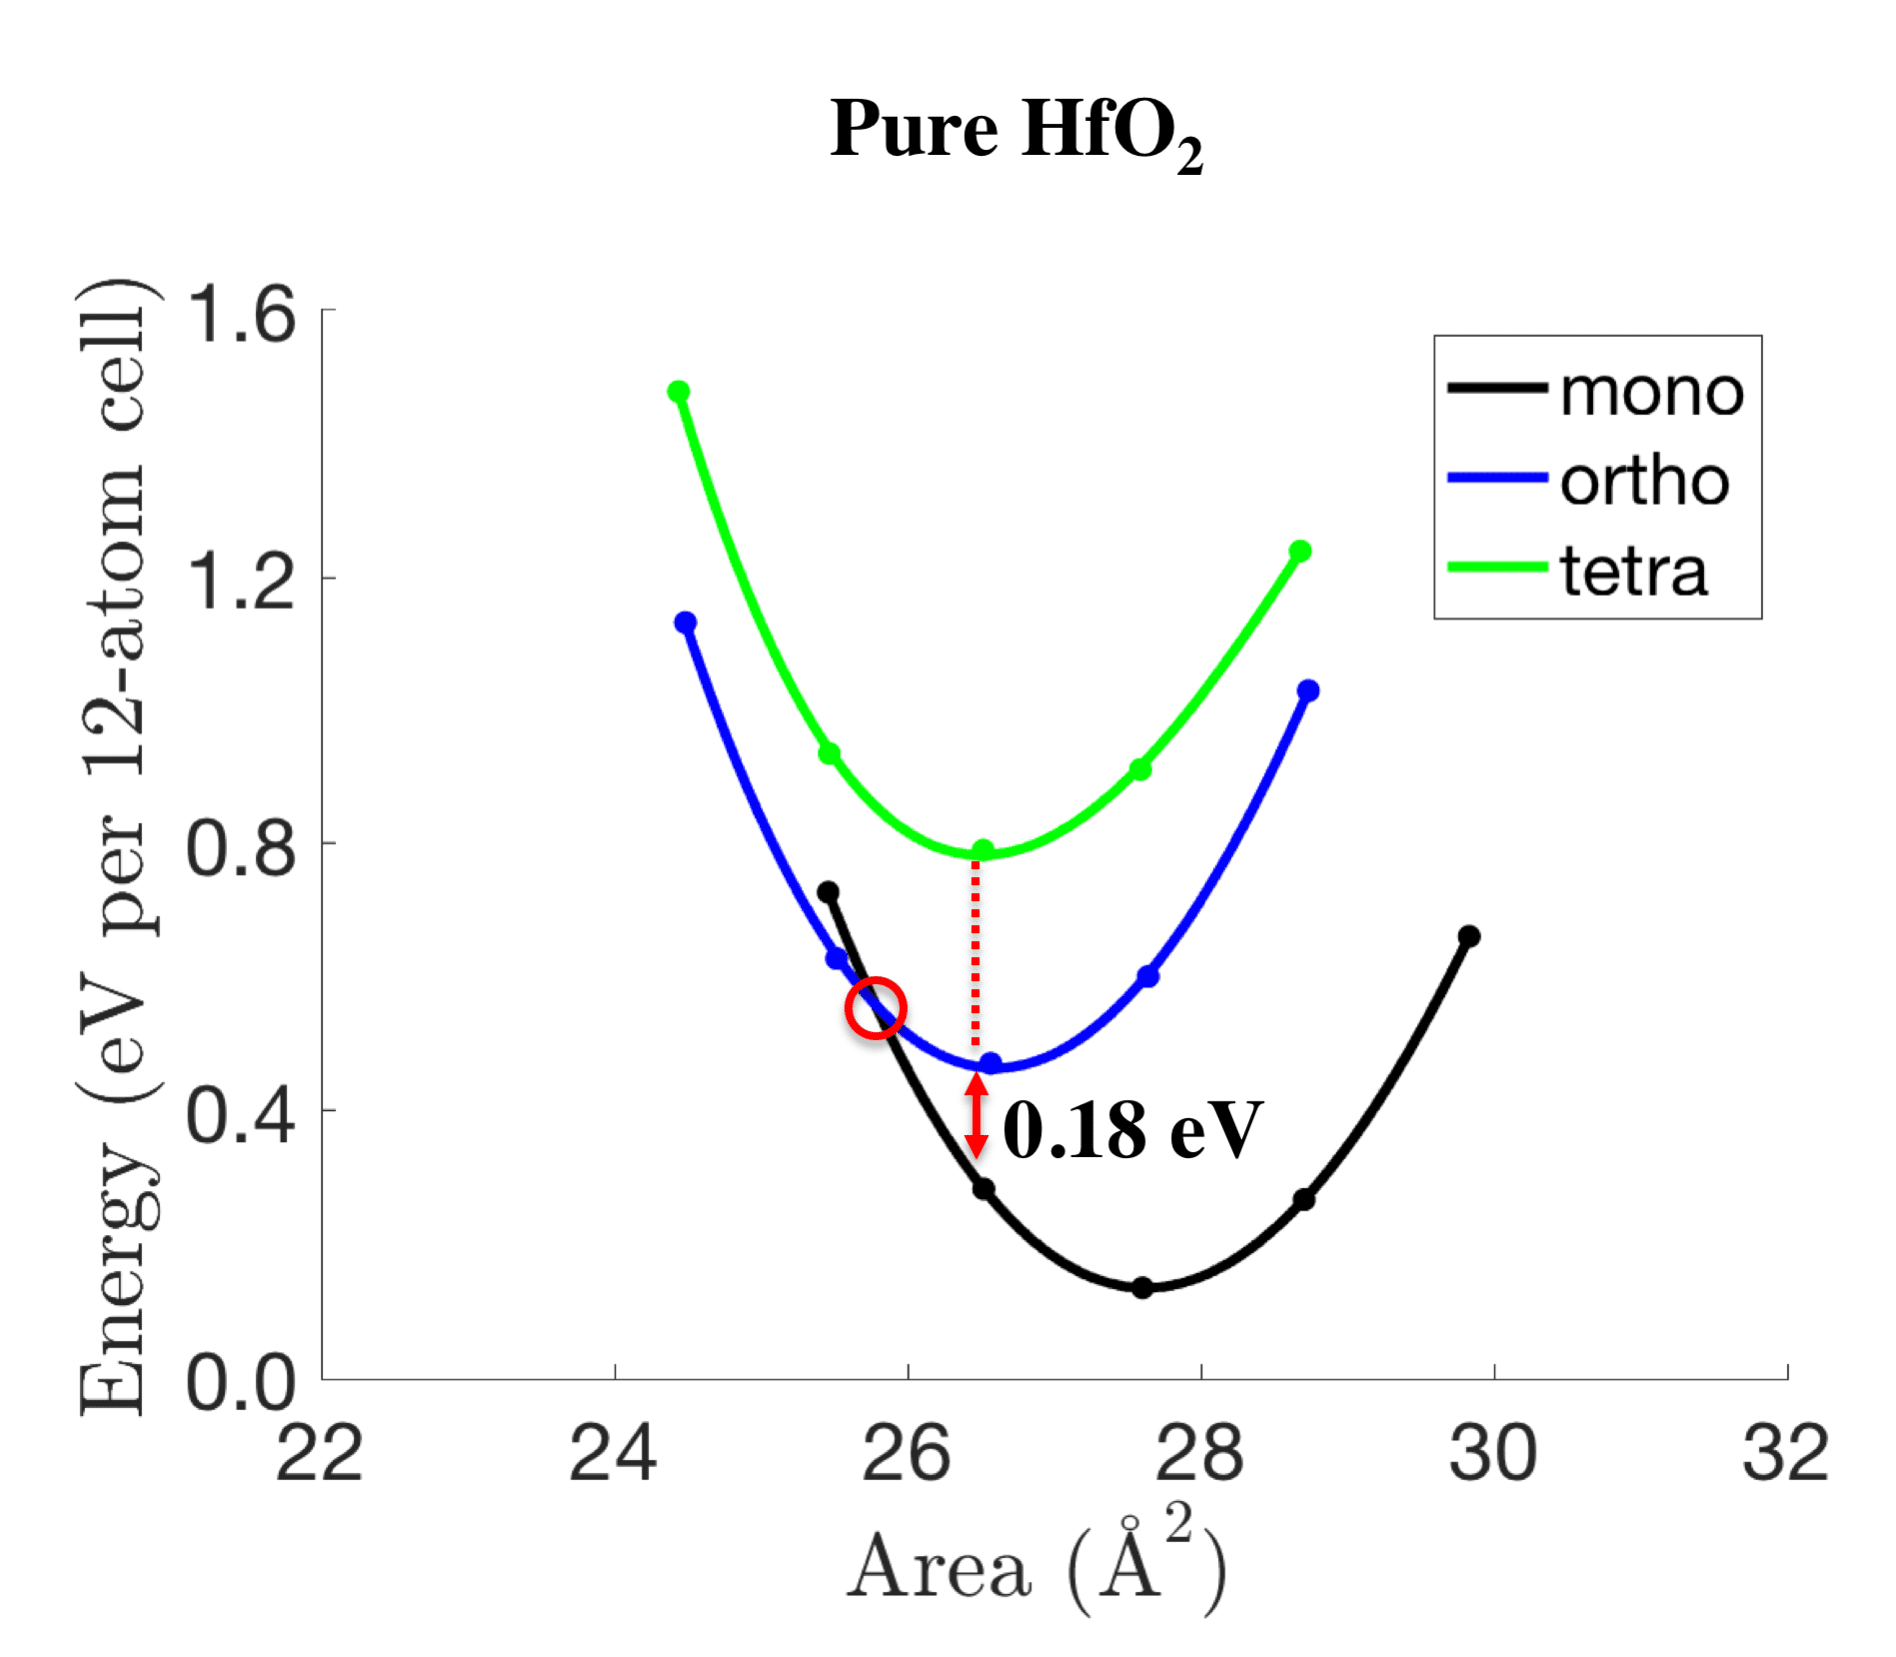 Figure 12
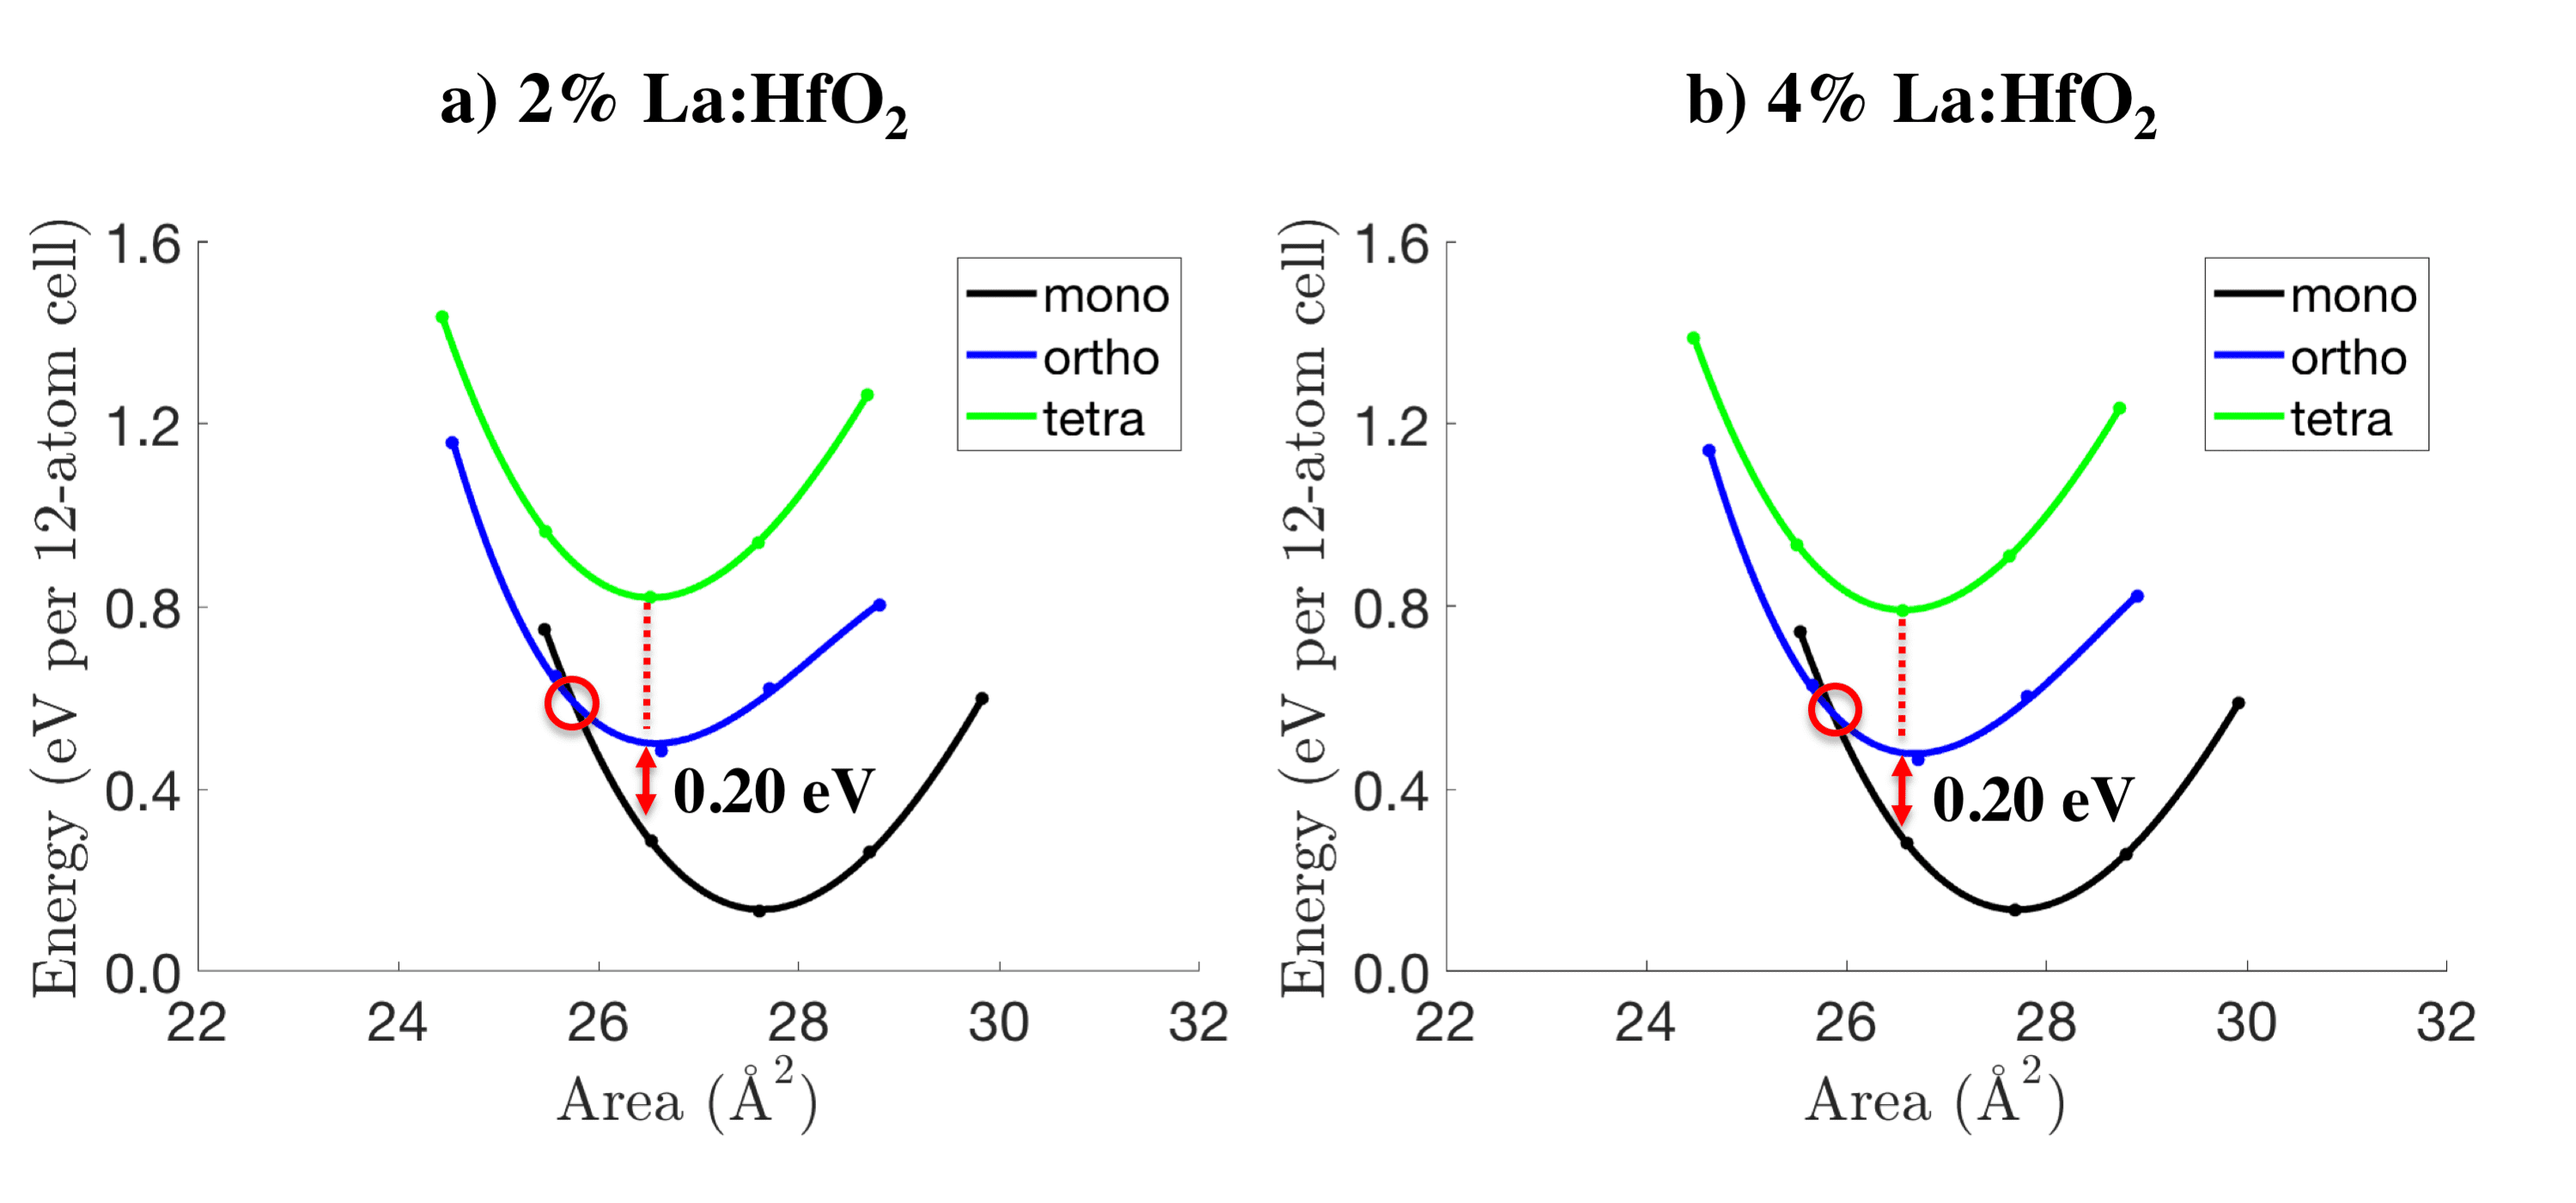 Figure 13
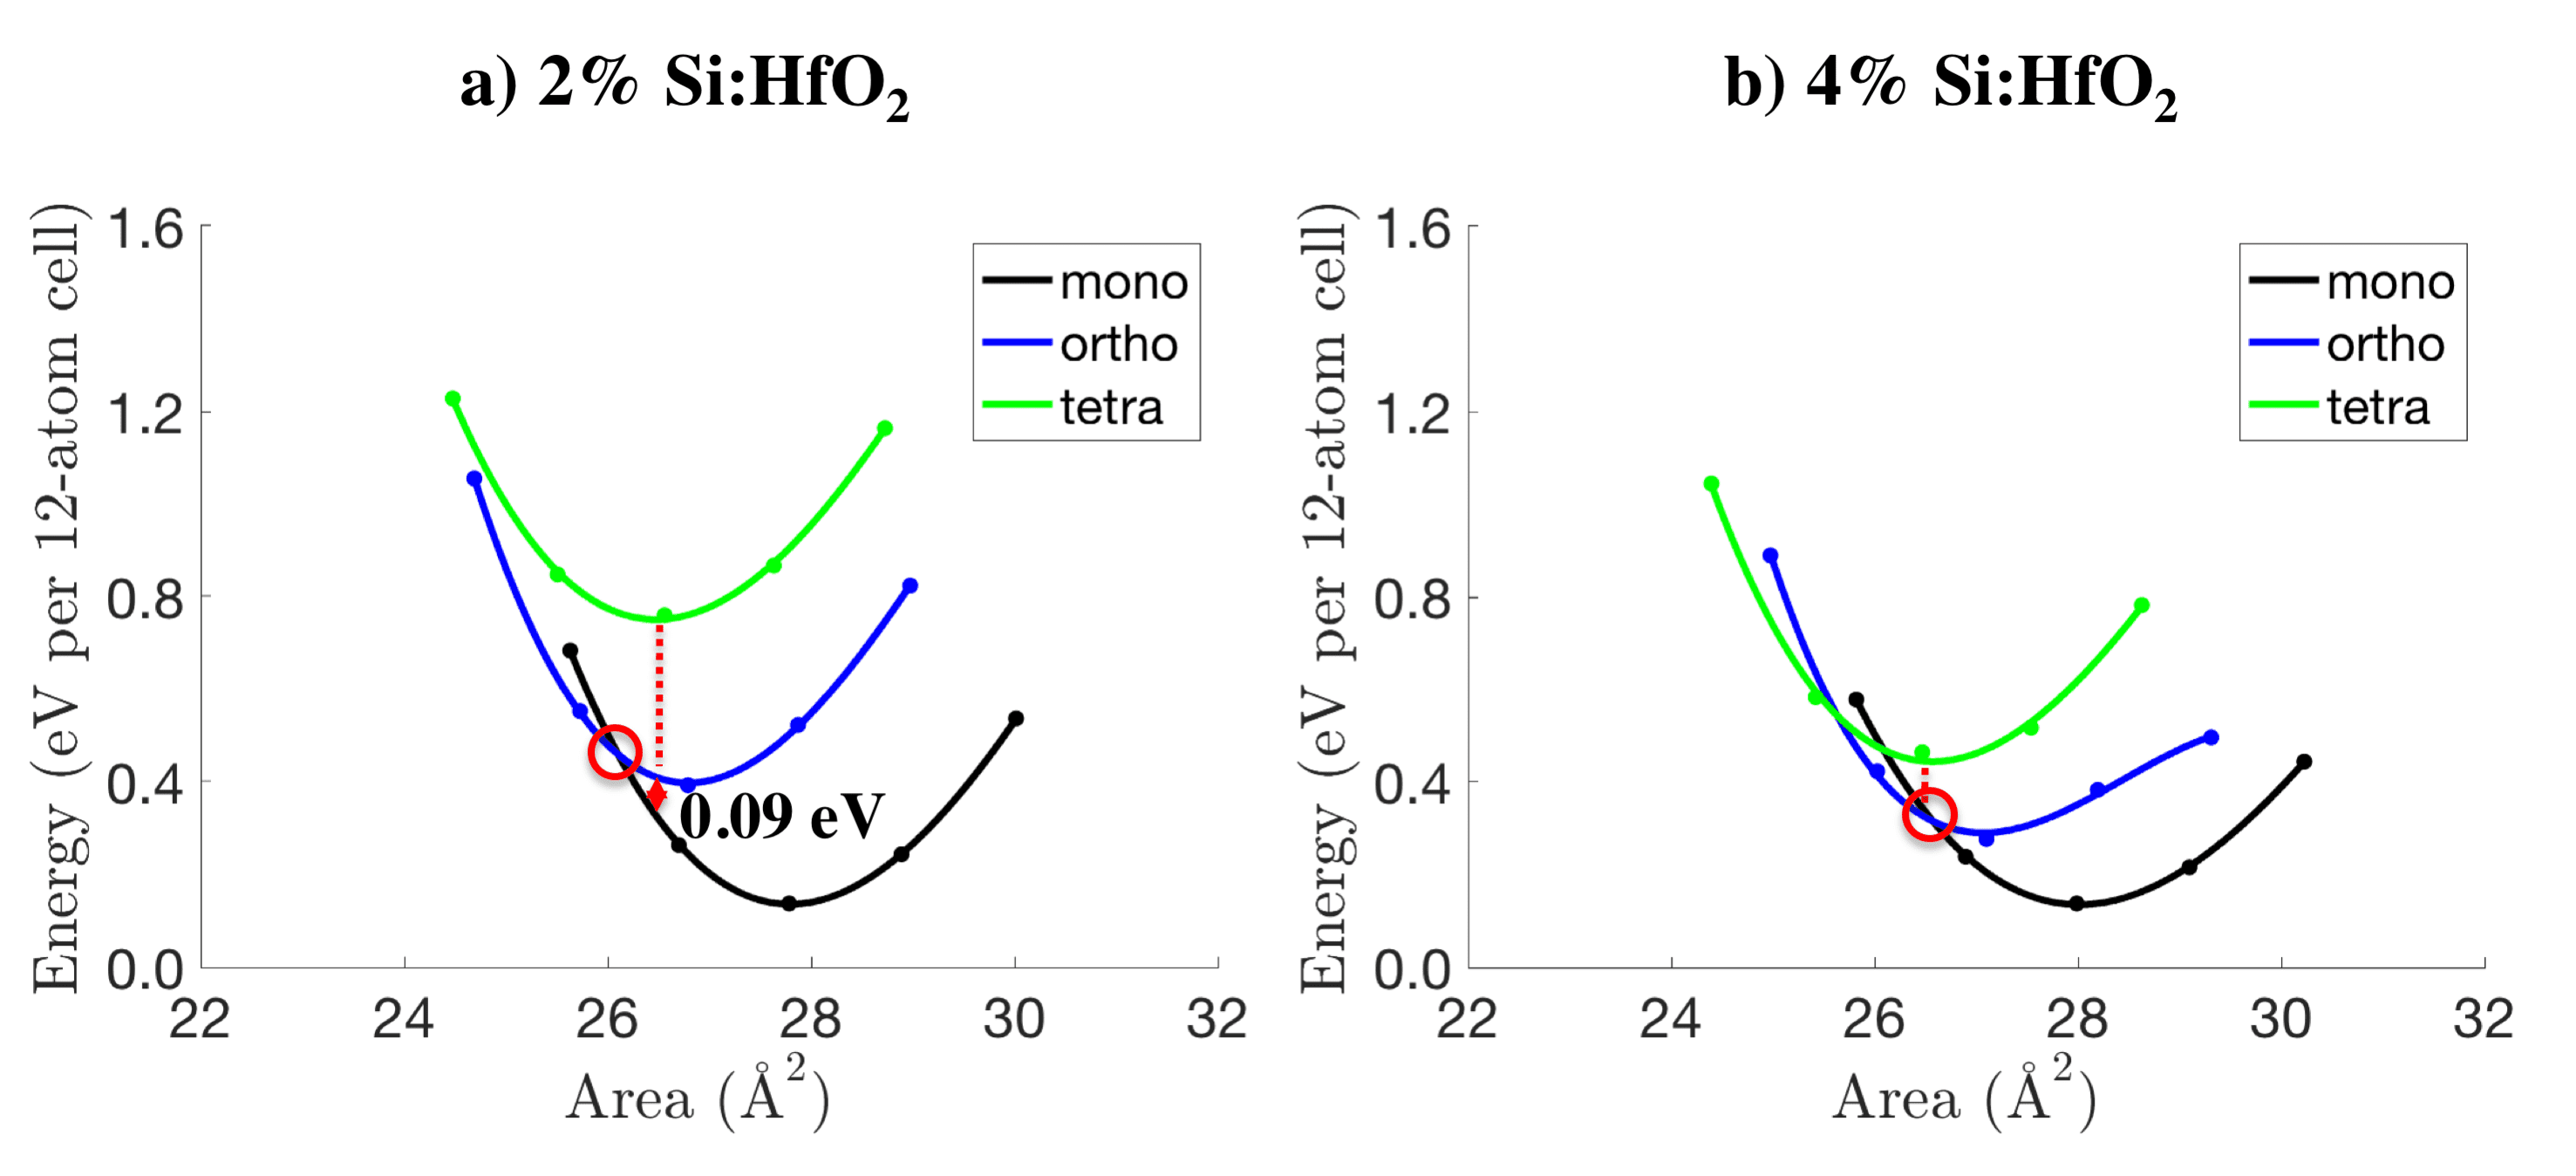 Figure 14
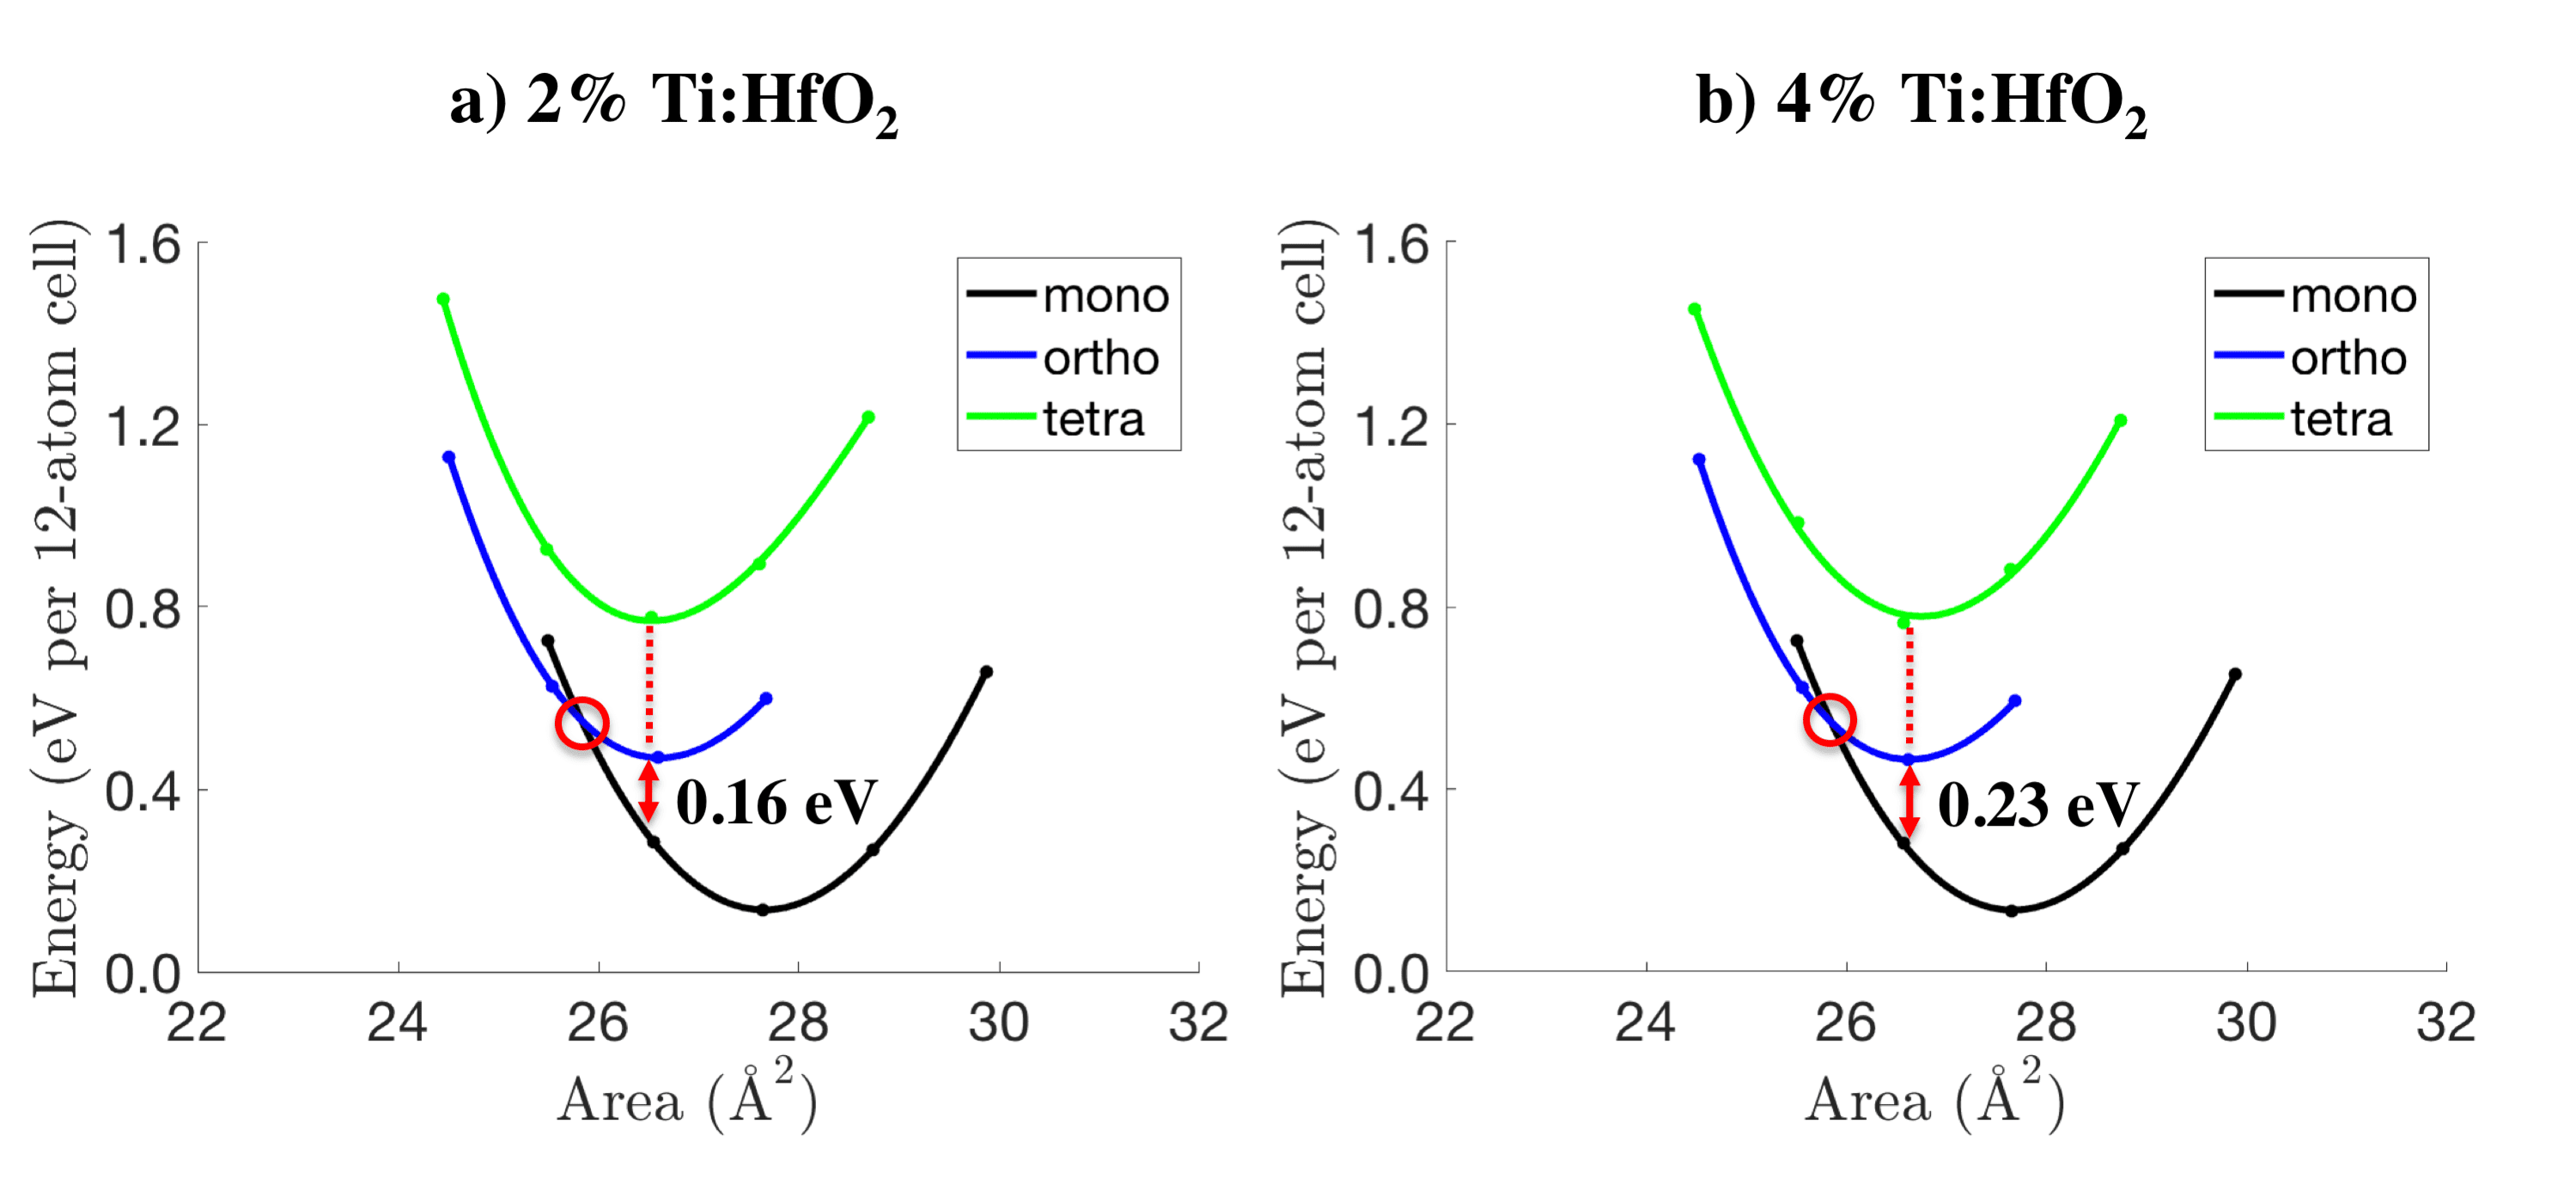 Figure 15
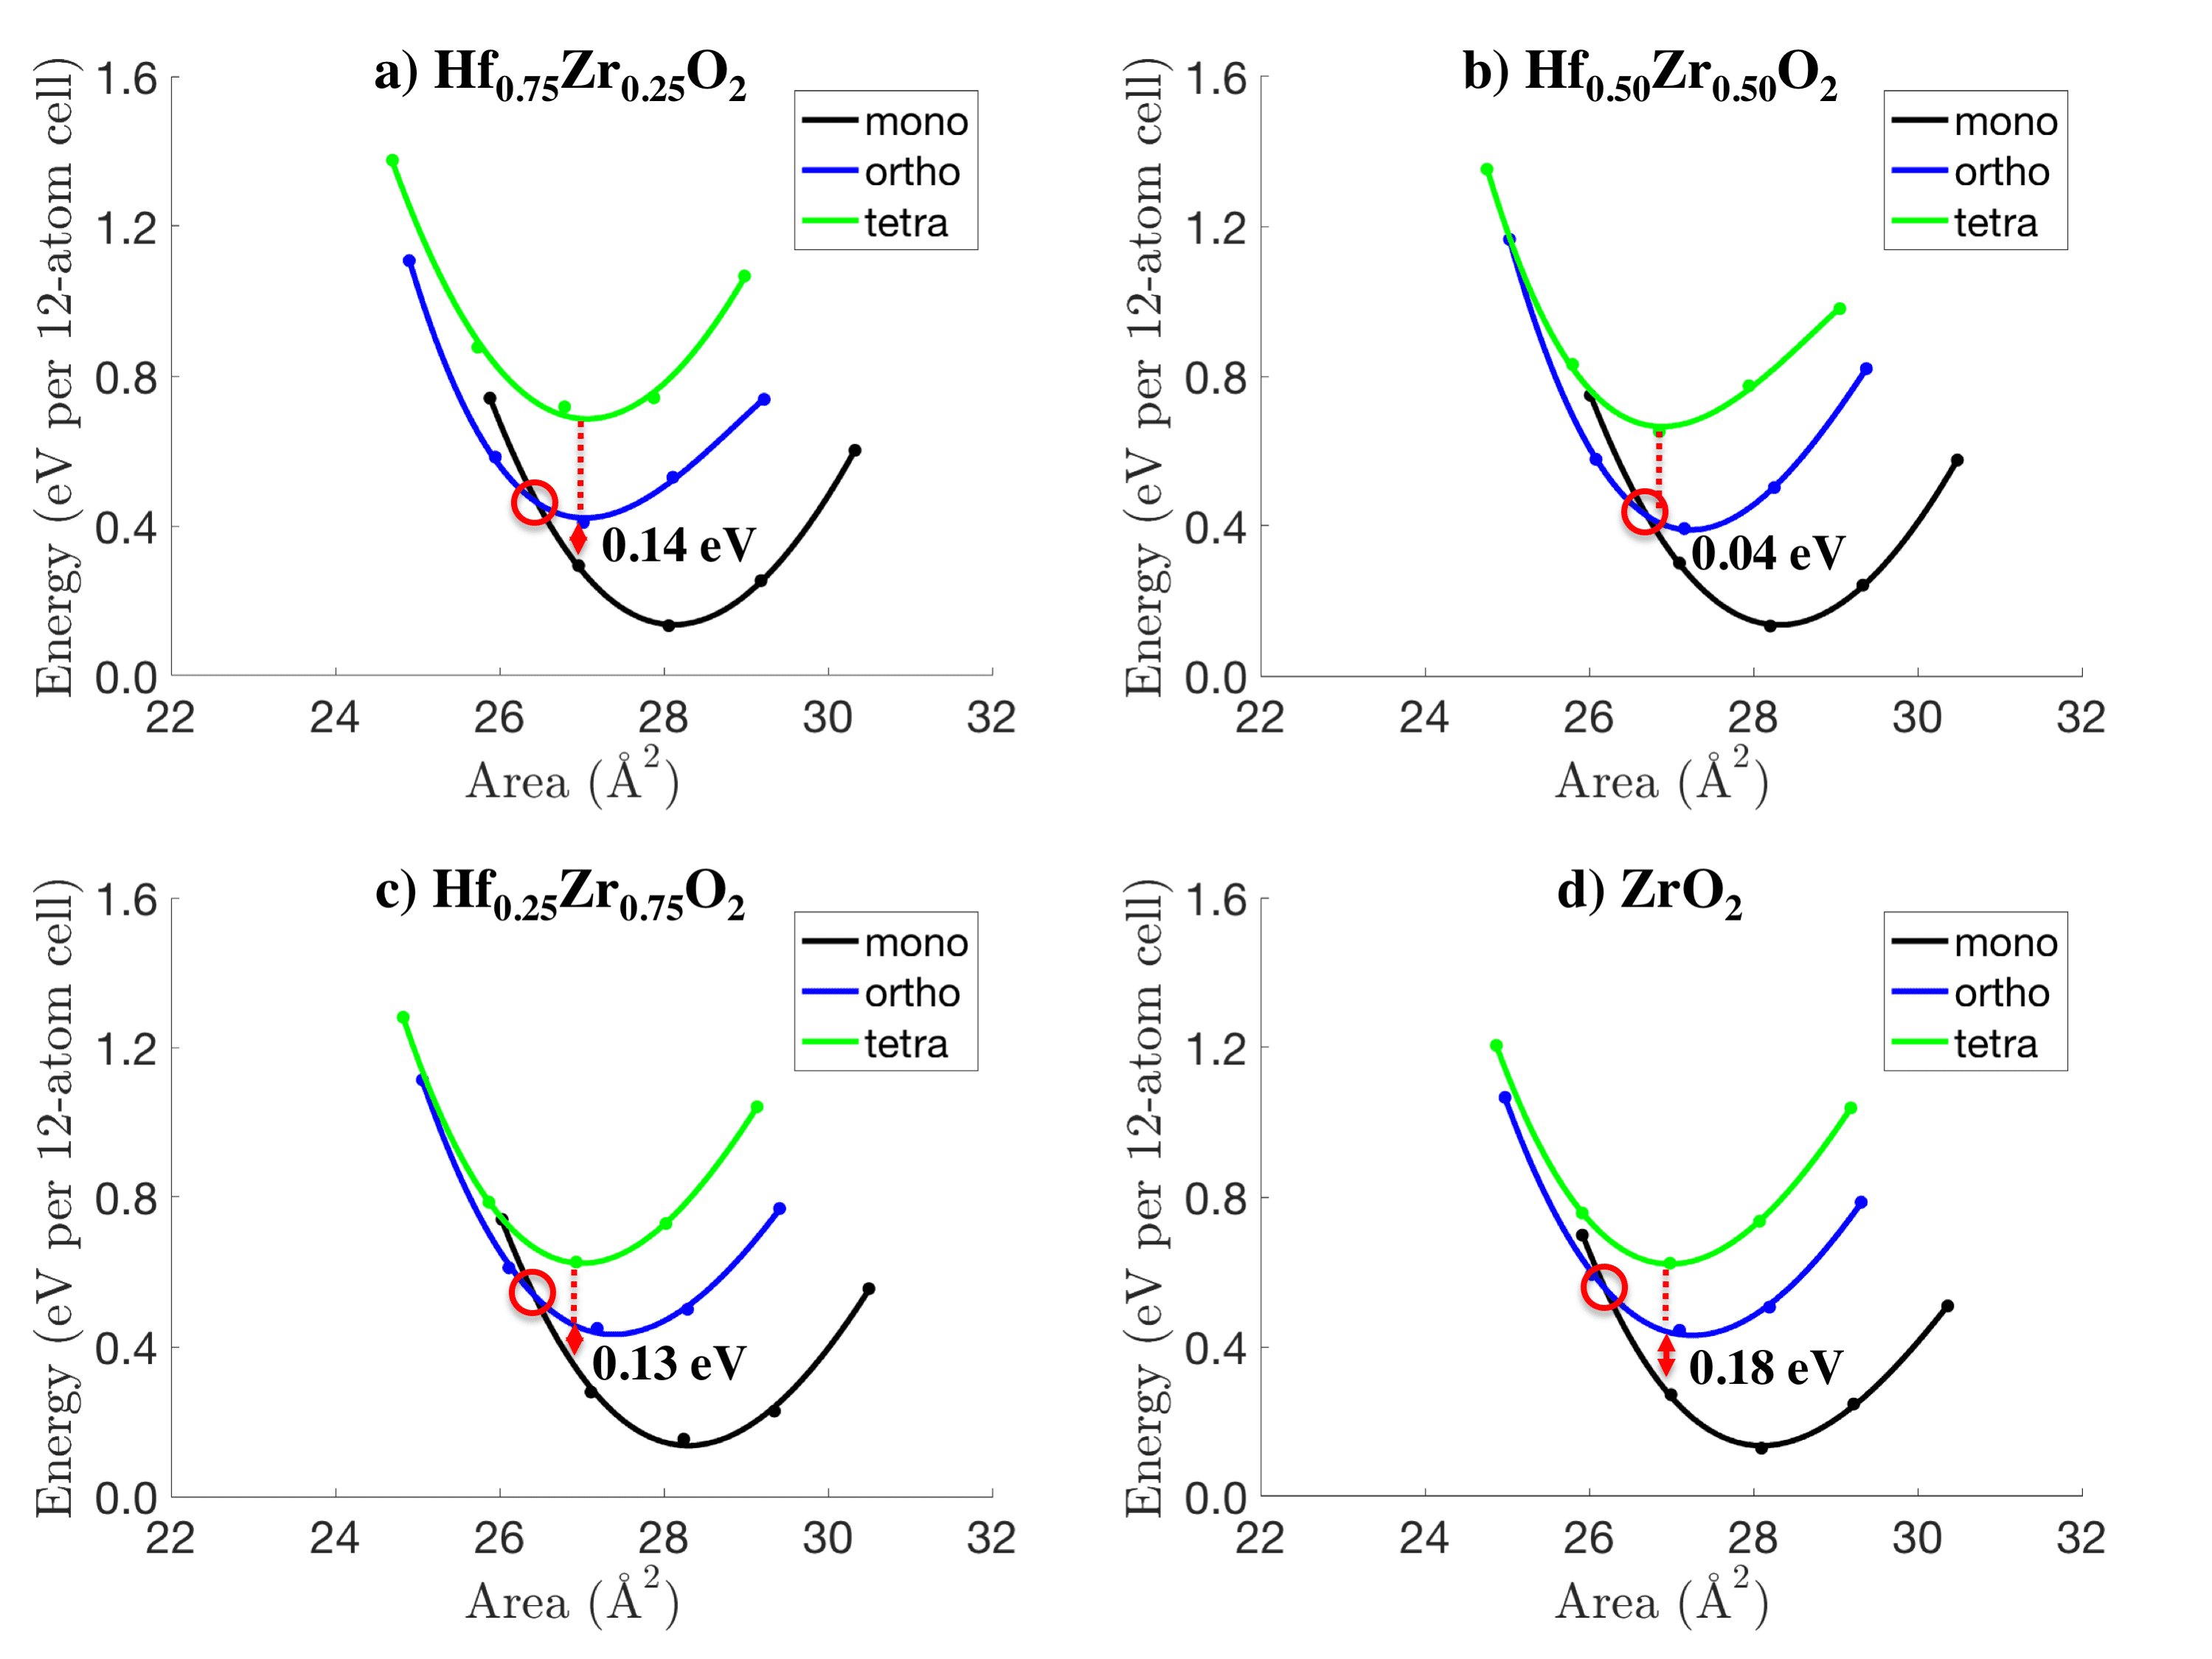 Figure 16
| Ref. | Dopant | TE/BE | (nm) | Observations |
|---|---|---|---|---|
| Böscke et al. (Boscke et al., 2011) | Si | TiN/TiN | 7-10 | FE at 2.6%-4.3% Si; AFE at 5.6% Si. |
| Müller et al. (Müller et al., 2011) | Y | TiN/TiN | 10 | FE at 2.3%-5.2% Y. |
| Mueller et al. (Mueller et al., 2012) | Al | TiN/TiN | 16 | FE at 4.8% Al; AFE at 8.5% Al. |
| Müller et al. (Müller et al., 2012) | Zr | TiN/TiN | 9 | PE at <30% Zr; FE at %30-%60 Zr; AFE at >70% Zr. |
| Yurchuk et al. (Yurchuk et al., 2013) | Si | TiN/TiN | 9, 27 | FE at 4.4% Si, 9 nm; PE at 27 nm. |
| Park et al. (Park et al., 2013) | 50% Zr | TiN/TiN | 5-25 | FE at 5-17 nm; PE at 25 nm. Pca21 phase confirmed. |
| Park et al. (Park et al., 2014a) | 50% Zr | TiN/TiN, TiN/Pt | 5-27 | FE at 8-19 nm for TiN; Less FE for Pt at 8 nm; PE for Pt at > 13 nm. |
| Lomenzo et al. (Lomenzo et al., 2014) | Si | TiN/Si, Ir/Si, Ir/Ir | 10 | FE similar for TiN/Si and Ir/Si. Smaller for Ir/Ir. |
| Schroeder et al. (Schroeder et al., 2014) | Si, Al, Y, Gd, La, Sr | TiN/TiN | 10 | FE at 4.4% Si; AFE at >5.6% Si. Similar for Al. No AFE for other dopants. |
| Park et al. (Park et al., 2014b) | 50% Zr | TiN/TiN, TiN/Ir | 9-24 | FE at 9-19 nm for TiN; FE at 12-15 nm for Ir. |
| Sang et al. (Sang et al., 2015) | Gd | TiN/TiN | 27 | FE; Pca21 phase confirmed. |
| Hoffmann et al. (Hoffmann et al., 2015) | Gd | TiN/TiN, TiN/TaN, TaN/TaN | 10-27 | FE similar for all stacks; TaN/TaN > TiN/TiN TiN/TaN in terms of . |
| Chernikova et al. (Chernikova et al., 2016) | 50% Zr | TiN/TiN | 2.5 | FE; Pca21 phase confirmed. |
| Park et al. (Park et al., 2017) | Al, Gd | TiN/TiN | 10 | FE at 5.7%-6.9% Al, 3.0%-3.9% Gd; PE at 8.8% Al. |
| Park et al. (Park et al., 2018) | Si | TiN/TiN | 10, 40 | FE at 3.8%-5.6% Si, 10 nm; PE at 4.5% Si, 40 nm; PE at 5.0%-6.3% Si, 40 nm. |
| Bulk phase | Parameters | This work (Å) | Ref. (Zeng et al., 2014) | Ref. (Huan et al., 2014) | Ref. (Materlik et al., 2015) |
|---|---|---|---|---|---|
| Monoclinic | 5.12, 5.18, 5.30, | 5.09, 5.16, 5.26, | 5.14, 5.20, 5.31, | 5.11, 5.18, 5.29, | |
| Orthorhombic | 5.25, 5.04, 5.07 | 5.11, 4.90, 4.92 | 5.29, 5.01, 5.08 | 5.23, 5.04, 5.06 | |
| Tetragonal | 5.07, 5.19 | 5.03, 5.15 | 5.06, 5.28 | 5.05, 5.14 | |
| Cubic | 5.06 | 5.03 | - | 5.04 |
| Bulk phase | ortho Pca | tetra P/nmc | cubic Fmm |
|---|---|---|---|
| No doping | 0.09 | 0.16 | 0.26 |
| C | 0.07 | 0.08 | 0.46 |
| N | 0.10 | 0.15 | 0.41 |
| N* (-1e) | 0.09 | 0.10 | 0.41 |
| Al | 0.09 | 0.16 | 0.28 |
| Al* (+1e) | 0.09 | 0.15 | 0.33 |
| Si | 0.07 | 0.11 | 0.33 |
| Ti | 0.09 | 0.15 | 0.27 |
| Ge | 0.09 | 0.12 | 0.30 |
| Sr | 0.08 | 0.16 | 0.23 |
| Sr* (+2e) | 0.10 | 0.18 | 0.34 |
| Y | 0.08 | 0.17 | 0.24 |
| Y* (+1e) | 0.09 | 0.17 | 0.29 |
| La | 0.08 | 0.16 | 0.24 |
| La* (+1e) | 0.08 | 0.16 | 0.29 |
| Phase | Nearest O neighbor distances () | C. N. | |||||||
| mono Hf | 2.05 | 2.14 | 2.14 | 2.16 | 2.18 | 2.28 | 2.30 | 7 | |
| ortho Hf | 2.04 | 2.12 | 2.13 | 2.14 | 2.14 | 2.24 | 2.27 | 7 | |
| tetra Hf | 2.07 | 2.07 | 2.07 | 2.07 | 2.39 | 2.39 | 2.39 | 2.39 | 8 |
| mono Si | 1.76 | 1.79 | 1.80 | 1.83 | 1.87 | 2.36 | 2.92 | 5 | |
| ortho Si | 1.75 | 1.77 | 1.81 | 1.81 | 1.92 | 2.27 | 3.07 | 5 | |
| tetra Si | 1.69 | 1.69 | 1.69 | 1.69 | 2.75 | 2.75 | 2.75 | 2.75 | 4 |
| Phase | HfO2 | 2% Si (VCA) | 3.125% Si (AS) | 3.125% Si (VCA) | 4% Si (VCA) |
|---|---|---|---|---|---|
| ortho | 0.08 | 0.07 | 0.07 | 0.05 | 0.03 |
| tetra | 0.16 | 0.15 | 0.11 | 0.11 | 0.08 |
| cubic | 0.26 | 0.17 | 0.33 | 0.12 | 0.08 |
| HfO2 | ZrO2 | ||||
|---|---|---|---|---|---|
| ortho (AS) | 0.08 | 0.08 | 0.08 | 0.07 | 0.08 |
| ortho (VCA) | 0.08 | 0.07 | 0.07 | 0.07 | 0.08 |
| tetra (AS) | 0.16 | 0.14 | 0.14 | 0.14 | 0.12 |
| tetra (VCA) | 0.16 | 0.14 | 0.13 | 0.12 | 0.12 |
| cubic (AS) | 0.26 | 0.25 | 0.23 | 0.22 | 0.21 |
| cubic (VCA) | 0.26 | 0.20 | 0.19 | 0.19 | 0.21 |
| HfO2 | 2% Si | 4% Si | |
|---|---|---|---|
| % strain where | -1.3% | -0.7% | 0.2% |
| (eV) | 0.32 | 0.34 | 0.12 |
| (eV) | 0.50 | 0.43 | 0.12 |
| HfO2 | ZrO2 | ||||
|---|---|---|---|---|---|
| % strain where | -1.3% | -1.0% | -0.4% | -1.0% | -1.5% |
| (eV) | 0.32 | 0.27 | 0.26 | 0.17 | 0.18 |
| (eV) | 0.50 | 0.43 | 0.30 | 0.30 | 0.36 |
| HfO2 | 2% Al | 4% Al | 2% Ge | 4% Ge | 2% Ti | 4% Ti | 2% La | 4% La | |
|---|---|---|---|---|---|---|---|---|---|
| % strain where | -1.3% | -0.4% | 0.3% | -1.6% | -2.0% | -1.3% | -1.6% | -1.5% | -1.4% |
| (eV) | 0.32 | 0.29 | 0.07 | 0.32 | 0.34 | 0.28 | 0.29 | 0.31 | 0.30 |
| (eV) | 0.50 | 0.35 | 0.07 | 0.58 | 0.65 | 0.44 | 0.52 | 0.51 | 0.50 |
| 2 (eV) | (eV) | |
|---|---|---|
| monoclinic- | 8.8 | 5.7 |
| monoclinic- | 9.5 | 9.8 |
| orthorhombic- | 8.6 | 7.4 |
| orthorhombic- | 7.7 | 7.0 |
| orthorhombic- | 8.8 | 13.4 |
| tetragonal- | 7.8 | 13.3 |
| tetragonal- | 8.6 | 6.9 |
| cubic- | 7.8 | 11.4 |
Peer Reviews
No public reviews on file for this paper yet. If you reviewed it on a platform where reviews are public (OpenReview, ICLR, NeurIPS, ICML), you can paste yours below so the community can read it here.
Videos
No videos yet. Explain this paper in a talk, walkthrough, or lecture? Add one.
\RS@ifundefined
subsecref \newrefsubsecname = \RSsectxt
\RS@ifundefinedthmref \newrefthmname = theorem
\RS@ifundefinedlemref \newreflemname = lemma
Causes of ferroelectricity in HfO2-based thin films: An *ab
initio* perspective
Mehmet Dogan**1,2,3,4*, Nanbo Gong1,5, Tso-Ping Ma1,5 and Sohrab Ismail-Beigi1,2,6,7
1Center for Research on Interface Structures and Phenomena, Yale University, New Haven, Connecticut 06520, USA 2Department of Physics, Yale University, New Haven, Connecticut 06520, USA 3Department of Physics, University of California, Berkeley, California 94720, USA 4Materials Science Division, Lawrence Berkeley National Laboratory, Berkeley, California 94720, USA 5Department of Electrical Engineering, Yale University, New Haven, Connecticut 06520, USA 6Department of Applied Physics, Yale University, New Haven, Connecticut 06520, USA 7Department of Mechanical Engineering and Materials Science, Yale University, New Haven, Connecticut 06520, USA *Corresponding author: [email protected]
(April 1, 2019)
Abstract
We present a comprehensive first principles study of doped hafnia in order to understand the formation of the ferroelectric grains. Assuming that tetragonal grains are present during the early stages of growth, matching plane analysis shows that grains can transform into during thermal annealing, when they are laterally confined by other grains. We show that among 0%, 2% and %4 Si doping, 4% doping provides the best conditions for the transformation. This also holds for Al doping. We also show that for HfxZr1-xO2, where we have studied the value provides the most favorable conditions for the desired transformation. In order for this transformation to be preferred over the transformation, out-of-plane confinement also needs to be present, as supplied by a top electrode. Our findings illuminate the mechanism that causes ferroelectricity in hafnia-based films and provide an explanation for common experimental observations for the optimal ranges of doping in Si:HfO2, Al:HfO2 and HfxZr1-xO2. We also present model thin film heterostructure computations of Ir/HfO2/Ir stacks in order to isolate the interface effects, which we show to be significant.
I Introduction
Achieving ferroelectricity in thin films has been a decades-long research endeavor because of potential technological applications, e.g., the ferroelectric field effect transistors (FEFET) and ferroelectric random-access memory (FERAM) (McKee et al., 2001; Hoffman et al., 2010; Kumah et al., 2016; Dogan et al., 2018). The ferroelectric-based technology provides tremendous advantages over the dominant non-volatile memory technology, such as low power consumption, controllability over variability, and fast switching speed. However, this promising technology has not been widely implemented due to the lack of ferroelectric materials that fulfill the all of the requirements for a viable memory technology: scalability, CMOS compatibility, and memory retention (Ma and Han, 2002; Dünkel et al., 2017). HfO2 is one of the most widely used dielectric gate oxides in today’s field effect transistor devices (Gong and Ma, 2016). Most importantly, it is thermodynamically stable on silicon up to high temperatures, allowing abrupt HfO2/Si interfaces to be grown without formation of silica in the interfacial region (Chiou et al., 2007). In addition, with a large band gap of 5.3 - 5.7 eV and a dielectric constant of in its bulk form under ordinary conditions (Park et al., 2015), HfO2 is a widely used gate insulator and a replacement material for SiO2 (Wilk et al., 2001). The recent discovery of ferroelectricity in HfO2-based thin films has further multiplied the research interest in this material (Boscke et al., 2011; Müller et al., 2012). It has been shown in various experimental studies that ferroelectricity in HfO2-based films arises from the creation of the polar orthorhombic phase (space group: Pca) of HfO2 during a rapid annealing process in conjunction with the presence of a capping electrode (typically TiN). It has also been demonstrated that the ferroelectric properties of these films strongly depend on factors such as the doping species, doping concentration, annealing temperature and film thickness (Park et al., 2015; Gong et al., 2018). Even though HfO2-based ferroelectric memory have been experimentally demonstrated using various conditions, a systematic microscopic understanding of the effects of the aforementioned factors is presently lacking. This is, in part, due to the polycrystalline and complex nature of the HfO2 films that have been grown to date, and in part, due to the relatively new interest in this field.
To the best of our knowledge, the ferroelectric hafnia-based thin films are polycrystalline and contain differently oriented grains of monoclinic (space group: P/s), tetragonal (P/nmc) and orthorhombic (Pca) phases in various ratios. The monoclinic and the tetragonal phases are non-polar, and they are the observed bulk phases of HfO2 at room temperature and at high temperature, respectively (Wang et al., 1992; Zhao and Vanderbilt, 2002). Experiments demonstrate that the orthorhombic phase arises during the rapid annealing with a capping electrode. In addition, the concentration of dopants is crucial in determining the ferroelectric properties. Because the volume fraction of the orthorhombic phase compared to the other non-polar phases is what ultimately decides the robustness of ferroelectricity in the HfO2 films, a structural understanding of the favorable conditions for this phase is crucial in order to optimize the growth procedure.
To this end, in our ab initio studies we investigate the energetics of different phases of HfO2 with varying amounts of Si and Zr doping and subject to a range of epitaxial strain states. In \SecrefExperiment6 we summarize our knowledge of the experimental findings on ferroelectric thin films of hafnia to date. After describing our methods in III, we move on to our computational study of doping and strain on hafnia with a particular focus on Si:HfO2 and HfxZr1-xO2 in \SecrefResults6. We have found that at certain doping levels the transformation of the high temperature tetragonal phase to the out-of-plane polarized orthorhombic phase is favored. These results, together with additional analysis, help explain the common experimental observations as well as some of the underlying causes from a microscopic viewpoint. We also describe, in \SecrefResults6, results on simulated HfO2 thin films including the interface with electrodes in order to obtain some insight on the energetics of interfacial and surface effects in thin films.
II Summary of experiments to date
Since their discovery in 2011, ferroelectric hafnia thin films have garnered tremendous experimental attention. In \TabrefExperimental we list some of the studies that have investigated factors such as doping species, doping concentration, thickness of the film, and top and bottom electrodes (TE/BE).
These studies have generally found that, when the HfO2 films are doped with a few percent of a wide range of dopants or with 50% Zr, grown to be nm thick between two metal electrodes, and annealed at °C, they can display ferroelectricity. Some of the studies (Müller et al., 2011; Boscke et al., 2011; Mueller et al., 2012; Lomenzo et al., 2014) have shown that for TiN/HfO2/TiN stacks, if the film is annealed before the deposition of the top electrode, then the ferroelectric behavior is significantly suppressed, which indicates that the confinement provided by the top electrode during annealing is crucial for ferroelectricity.
In terms of the atomic structure of the films, many of these studies have performed XRD analyses to show that ferroelectricity is intimately related to the presence of the orthorhombic Pca21 phase of HfO2. The path to the stabilization of this phase is believed to be via the creation of grains of the tetragonal P/nmc phase which are present when the film is first deposited (Müller et al., 2012). The tetragonal phase is known to be stabilized by surface effects (Garvie, 1978), and recent studies have shown doping to be a stabilizer for this phase as well (Tomida et al., 2006; Böscke et al., 2009). Hence, it appears that for ferroelectric hafnia-based films, the orthorhombic phase is obtained from the tetragonal grains during rapid thermal annealing under the confinement of a top electrode. Crystallization without a top electrode leads to the formation of the monoclinic P/s phase, which is the non-polar ground state at relevant temperatures. The causes for the favorability of the tetragonal orthorhombic transition over the tetragonal monoclinic transition under these doping/thickness/temperature/confinement conditions are not well understood.
III Computational methods
We compute minimum energy structures using density functional theory (DFT) in the Perdew-Burke-Ernzerhof Generalized Gradient Approximation (PBE GGA) (Perdew et al., 1996) with ultrasoft pseudopotentials (Vanderbilt, 1990). We use the QUANTUM ESPRESSO software package (Giannozzi et al., 2009). Plane wave energy cutoffs of Ry and Ry are used for bulk and thin film simulations, respectively. We sample the Brillouin zone with an Monkhorst-Pack -point mesh (per 12 atom unit cells) and a Ry Marzari-Vanderbilt smearing (Marzari et al., 1999) for bulk samples; slab (thin film) systems are sampled with a mesh. For thin film simulations, periodic copies of the slab are separated by of vacuum in the direction (see \FigrefSimcell for a representative unit cell), and the in-plane lattice constants of the slab are fixed to the computed bulk lattice constants of HfO2 for the plane under consideration. In general, a slab may have an overall dipole moment that can artificially interact with its periodic copies through the vacuum gap. We eliminate this effect by introducing a fictitious dipole in the vacuum region of the cell which cancels out the electric field in vacuum (Bengtsson, 1999). All atoms are relaxed until the forces on the atoms are less than in magnitude along all axial directions. We use both direct substitution of atoms as well as the virtual crystal approximation (VCA) to model doping (Bellaiche and Vanderbilt, 2000). In the VCA, to approximate the mixing of two elements and with ratios and , a virtual element is created by linearly interpolating the pseudopotentials of and such that the resulting pseudopotential is . The VCA is known to be a good approximation when alloying chemically similar elements with the same valence state. A detailed comparison of these two approaches is reported in \SubsecrefEffects-of-doping.
IV Results
IV.1 Bulk phases of HfO2
HfO2 can be observed in three phases in its bulk form. The monoclinic phase (space group: P/c) is stable all the way up to 2000 K. Between 2000 K and 2900 K, the tetragonal phase (space group: P/nmc) is observed. The highest symmetry cubic phase (space group: Fmm) is observed between 2900 K and the melting temperature of 3100 K (Wang et al., 1992; Zhao and Vanderbilt, 2002). The cubic phase of HfO2 is depicted in \FigrefCubic-phase. It is a face centered cubic structure with one formula unit per lattice point. The tetragonal and the monoclinic phases are obtained from the cubic phase through consecutive symmetry breaking operations.
These three bulk phases are all centrosymmetric, causing the bulk oxide to be paraelectric. However, as described in \SecrefExperiment6, the recent discovery of ferroelectricity in HfO2 thin films indicates that a non-centrosymmetric orthorhombic phase (space group: Pca) is stabilized under certain growth conditions that gives rise to a switchable polarization. The four phases of HfO2 that are the focus of this study are shown in \FigrefBulk_phases. The orthorhombic and monoclinic phases are obtained from the tetragonal phase by symmetry breaking operations, indicated by a blue arrow in the figure.
In \TabrefRelative-energies we compare our computed energies of each phase (relative to the monoclinic phase) with the results from previous computational studies. We find that our results agree well with Ref. (Zeng et al., 2014) which uses the GGA to approximate the exchange-correlation functional; and Refs. (Reyes-Lillo et al., 2014) and (Materlik et al., 2015) which use the Local Density Approximation (LDA) agree with each other.
In \TabrefLat_para we compare lattice parameters with the results of previous studies. We find that our results generally lie within the range of agreement among the previous works where there is a range of <5% for a given lattice parameter.
IV.2 Effects of doping on bulk HfO2
Due to its importance in the ferroelectric properties of hafnia thin films, we have investigated the role of doping in stabilizing the various phases of HfO2 with respect to each other. We list the energies of bulk phases with respect to the monoclinic phase for various dopants in \TabrefDoped-energies. These simulations are done with simulation cells with 96 atoms, where one Hf per cell (i.e., 1 in 32) is replaced by the dopant. All atomic positions and cell parameters are then relaxed. This leads to a doping ratio of 3.125% where the dopants are equally spaced in the three lattice directions. For elements with a different number of valence electrons than Hf, such as N, Al, Sr, Y and La, we have additionally computed relaxed energies with compensating electrons or holes and compared these with the neutral relaxations.
We find that doping does not change the energy difference between the orthorhombic and the monoclinic phases significantly. In some cases (C, N*, Si and Ge), it reduces the energy of the tetragonal phase, while in some cases (C, N, N*, Al*, Si, Ge and Sr*) it increases the energy of the cubic phase. We also find that changing the number of electrons in the cell does not significantly modify the energies of the orthorhombic and the tetragonal phases (with the exception of N), but increases the energy of the cubic phase (again with the exception of N). Our results are in close agreement with the available first-principles study of doped HfO2 that included Ge, Sr, Y and La (Batra et al., 2017a).
The most significant observation of this survey of dopants is that, for non-metal dopants (C, N*, Si and Ge), the tetragonal phase experiences a significant stabilization. If we focus on the monoclinic, orthorhombic and tetragonal phases, which are the phases that participate in the thin film processes, we conclude that, apart from the cases of C, N*, Si and Ge, no significant change occurs in terms of pure phase energetics. With these four special dopants, the reduction of energy in the tetragonal phase relative to the monoclinic phase may favor the formation of the tetragonal phase in thin films, and subsequently the formation of the ferroelectric orthorhombic phase during thermal annealing, as we will explain in \SubsecrefEffects-of-strain. To the best of our knowledge, C and N have not been used as dopants in HfO2; thus it is not possible to refer to relevant experiments. Note that C and N have atomic radii much smaller than Hf, and hence are likely challenging to be incorporated as dopants. Ge and Ti have been reported as dopants in HfO2 (Li et al., 2005; Wang et al., 2012); however these reports were prior to the discovery of ferroelectricity in hafnia-based films. The other elements we have included in our survey (Al, Sr, Y and La) have all been experimentally shown to promote ferroelectricity in hafnia (Schroeder et al., 2014; Starschich and Boettger, 2017; Park et al., 2017). Therefore, reduction of the energy of the tetragonal phase with respect to the monoclinic phase, by itself, does not predict the promotion of ferroelectricity in these films, and, it needs to be considered in conjunction with other factors such as strain and thin film effects.
IV.2.1 Doping by Si
In order to gain a comprehensive understanding of the effects of doping by one of the elements, we focus on Si which is one of the most widely used dopants in hafnia-based thin films (along with Zr). In \FigrefSi_doping, we present the environment of a hafnium atom by showing its bonds with the neighboring oxygen atoms for the (a) monoclinic, (b) orthorhombic, and (c) tetragonal phases of HfO2. We also present the environment of a silicon atom that replaces a hafnium atom after a full relaxation, for the the (d) monoclinic, (e) orthorhombic, and (f) tetragonal phases.
As seen by the number of Hf-O bonds drawn in \FigrefSi_doping, a hafnium atom is seven-fold coordinated by oxygen atoms in the monoclinic and orthorhombic phases and eight-fold coordinated in the tetragonal phase. A silicon dopant becomes five-fold coordinated in the monoclinic and orthorhombic phases and four-fold coordinated in the tetragonal phase. We list the (Hf,Si)-O distances in \TabrefCN_oxygen. We assume that if the distance between the two atoms is not much larger than the sum of their atomic radii, the two atoms are coordinated. For Hf-O coordination, this sum is , and for Si-O coordination, it is , yielding the coordination numbers in \TabrefCN_oxygen.
We find that the monoclinic and the orthorhombic phases have the same coordination configuration in HfO2, and the coordination of Si dopant is approximately the same for these two phases. Hence the energy difference between the orthorhombic and the monoclinic phases does not significantly change upon doping. However, in the tetragonal phase, the hafnium atom is coordinated by 8 oxygens. A closer inspection reveals that Hf is surrounded by two concentric oxygen tetrahedra with Hf-O distances of 2.07 and 2.39 . After replacement of this hafnium with a silicon atom, the closer tetrahedron is pulled in and the farther tetrahedron is pushed out so that the distances become 1.69 and 2.75 . This oxygen environment for silicon is almost identical to its environment in the ground state of bulk SiO2. In the P3121 (-quartz) phase of SiO2, silicon atoms lie in the centers of oxygen tetrahedra with a Si-O distance of 1.63 (our calculated value). We note that among the low-energy polymorphs of SiO2, five out of six lowest energy structures feature tetrahedral cages (Zeng et al., 2014). Therefore, we conclude that the favorable tetrahedral environment of Si dopant in the tetragonal phase causes its significant stabilization with respect to the orthorhombic and the monoclinic phases. In the Supplementary Material, we list the dopant-O bond lengths for all the other dopants (C, N, N*, Al, Al*, Ti, Ge, Sr, Sr*, Y, Y*, La and La*).
We conclude the discussion on Si doping by comparing results obtained by atomic substitution (AS) to the virtual crystal approximation (VCA). In \TabrefSi_doping, we list the energies of the orthorhombic, tetragonal and cubic phases with respect to the monoclinic phase, for 2% and 4% Si-doped cases computed by VCA, and the 3.125% Si-doped case computed by AS and VCA. We find that VCA is in agreement with AS for the tetragonal phase, and gives an acceptable result for the orthorhombic phase. We have investigated the disagreement in the cubic phase by first inspecting the environment of the Si dopant in the case of AS. The eightfold coordination of hafnium persists for the silicon dopant. We have then relaxed the structure again after slightly displacing one of the neighboring oxygens, which has resulted in the transformation of the cell into a tetragonal cell, indicating that the cubic phase is unstable toward silicon doping. Hence, for the remainder of our study, we do not discuss the behavior of the cubic phase, which is also not observed in hafnia-based thin films.
IV.2.2 Hf/Zr mixing
Moving to the other most widely used dopant in hafnia thin films, we turn to Zr. In \TabrefZr_doping we list the energies of the orthorhombic, tetragonal and cubic phases with respect to the monoclinic phase for bulk HfxZr1-xO2, where . For each case we compare the AS and the VCA results. For AS computations, we have used 4-unit-formula (12-atom) cells, and replaced 0 - 4 Hf atoms in the cell with Zr. For the 50% mixing case, where 2 Hf atoms per cell are substituted by Zr, we compute the energies for all possible 2-atom substitutions in the cell. These differently chosen pairs of atoms lead to relaxed energies within 0.02 eV of each other per unit formula, and the lowest such energy is reported for each phase.
We find that AS and VCA are in very good agreement for the orthorhombic and tetragonal phases, as in the Si-doped case. We could not determine the cause of the differences between these two methods for the cubic case, but since the cubic phase does not appear to participate in ferroelectricity of hafnia thin films, we have decided to leave this question for future research.
IV.3 Effects of strain on doped HfO2
IV.3.1 Matching planes for bulk phases
It has been observed that ferroelectric hafnia thin films have large numbers of tetragonal grains in the early stages of growth (Tomida et al., 2006; Böscke et al., 2009; Boscke et al., 2011; Müller et al., 2012). This is understood to be caused by a reduction of the relative energy of the tetragonal phase through its low surface energy (Garvie, 1978; Batra et al., 2016) and enhanced by doping. We have shown that for 3 - 4% Si doping, the tetragonal phase is significantly stabilized which agrees with previous computational studies (Fischer and Kersch, 2008; Lee et al., 2008). We have also shown that for Zr mixing above 25%, the tetragonal phase is also stabilized, again in agreement with prior works (Lee et al., 2008; Materlik et al., 2015). In \SubsecrefThin-film, we will confirm that the interface energy of the tetragonal phase with a common metal electrode is indeed competitive with the other phases. Hence it is reasonable to think that a significant fraction of the initial grains during film growth are tetragonal. Our hypothesis is that, after the deposition of the top electrode and during thermal annealing, some portion of these tetragonal grains transform into orthorhombic grains. We now investigate this scenario in more detail and show that it is plausible for certain doping ranges. Our main physical assumption will be that during the potential transformation of a tetragonal grain into other phases, the grain is geometrically* confined* within the film by the surrounding grains: that it cannot change its in-plane area significantly during the transformation.
In order for an out-of-plane polarized ( oriented) orthorhombic grain to form without a large change in the in-plane lattice parameters, the parent tetragonal grain needs to have the orientation or (which are physically equivalent). We demonstrate these matchings pictorially in \FigrefMatchings. The short sides of the tetragonal phase () and the orthorhombic phase () are similar in length; and the long sides of these two phases ( and ) are also similar in length (see \TabrefLat_para for computed values). Therefore the tetragonal cell can transform into the orthorhombic cell by slightly elongating and slightly contracting one of the .
Repeating the same analysis for the monoclinic phase, we eliminate the transformation because of the mismatch in lengths, and the transformation because of the mismatch in the angles between the in-plane lattice vectors. Therefore the constrained-area transformations that can lead to a oriented orthorhombic phase are:
[TABLE]
IV.3.2 Effects of strain on undoped grains
To investigate the likelihood of the and the transformations, we have simulated epitaxially strained phases of hafnia via computational relaxations of bulk hafnia strained to pre-specified lattice parameters. For each of the three phases, we have applied -4%, -2%, 0%, 2% and 4% biaxial strain to each of the in-plane lattice parameters with respect to their unstrained values, and relaxed the third lattice parameter as well as all the atomic positions. In \FigrefStrain_HfO2, we plot the energies of the three phases of HfO2 versus the area of the matching plane. For each phase, we fit a third degree polynomial to the five data points we have obtained to generate a smooth curve.
A grain with energy-optimal in-plane area may transform into the orthorhombic and the monoclinic phases without changing its area, which would be represented in \FigrefStrain_HfO2 as a downward jump from the bottom of the green curve to a point on either the blue or the black curve. Because at the optimized area of the grain the monoclinic phase is 0.18 eV lower than the orthorhombic phase, the likelihood of the transformation should be much higher than the likelihood of the transformation. We also circle in \FigrefStrain_HfO2 the point at which the curves that correspond to the monoclinic and the orthorhombic phases cross. That point corresponds to a compressive biaxial strain with respect to the grain. Therefore, in the absence of a mechanism that generates such a compressive strain, the grain is expected to transform into a grain during annealing.
To promote the transformation to the instead, Batra et al. introduced an electric field (Batra et al., 2017b) and showed that the orthogonal phase can be made favorable with the application of fields that are experimentally feasible. Below, we explore the effects of a different physical factor, the dopant kind and density, on the energy versus area curves in \FigrefStrain_HfO2.
IV.3.3 Effects of strain on Si:HfO2
We repeat the same set of simulations for the 2% and the 4% Si doped HfO2 as modeled by the VCA. We present the results in \FigrefStrain_Si.
We observe in \FigrefStrain_Si (a) that for the 2% Si doped HfO2, the energy difference between the orthorhombic and the monoclinic phases at the optimized area of grains is 0.09 eV, which is lower than the undoped value of 0.18 eV. The mono/ortho crossing occurs at 1% compressive strain as opposed to 3% in the undoped case. Hence the formation of the grains through the grains is favored by Si doping. In the case of 4% Si doping shown in \FigrefStrain_Si (b), the mono/ortho crossing occurs at zero strain relative to the optimal tetragonal in-plane area. Thus from a purely energetic point of view, an optimized grain has equal chance of transforming into an grain or an grain.
In \TabrefStrain_Si we summarize our findings on the epitaxially strained Si-doped HfO2. As the doping concentration increases, the energy difference between the orthorhombic and the monoclinic phases at the optimized in-plane area of grains decreases. At 4% doping, the energies of the and grains coincide for the in-plane area that is optimized for grains. However, the transformation that keeps the area fixed increases the volume of the cell by 5%, whereas the transformation that keeps the area fixed decreases the volume by 1%. Therefore, in the presence of a top electrode that provides additional out-of-plane confinement, the transformation may have a further advantage compared to the transformation. Our findings offer an explanation for the experimental observation that 3-4% Si doped films that are subjected to high temperature annealing with a top electrode have ferroelectric properties; i.e.,
2% doping (in the case of silicon) and pre-annealing deposition of the top electrode are necessary conditions for ferroelectricity (see \SecrefExperiment6).
IV.3.4 Effects of strain on HfxZr1-xO2
As one of the most common hafnia derivatives that has successfully been used as a ferroelectric thin film, we repeat the above analysis of strain effects for HfxZr1-xO2. We present our results in \FigrefStrain_Zr. We find that the energy difference between the orthorhombic and the monoclinic phases at the optimized area of grains is (a) 0.14 eV for , (b) 0.04 eV for , (c) 0.13 eV for and (d) 0.18 eV for pure ZrO2 (per 12-atom cell). Hence HfZrO4 () presents the most suitable situation for the transformation.
In \TabrefStrain_Zr we report our relevant results for HfxZr1-xO2. The energy difference between the orthorhombic and the monoclinic phases at the optimized in-plane area of grains is minimized at . For this case, the energies of the and grains coincide for the in-plane area that is 1% compressively strained with respect to the optimized area for grains. Without the strain, the transformation is preferred to the transformation by 0.04 eV per 12-atom cell. However, the former increases the volume by 3%, whereas the latter increases the volume by 1%. Therefore the confinement effects provided by the top electrode may favor the transformation over the transformation. As in the case of Si doping, our findings explain the experimental observation that 30 - 60% Zr doped films that are annealed with a capping electrode present ferroelectric properties (see \SecrefExperiment6).
In addition, we observe that for Hf0.25Zr0.75O2 and ZrO2, the energy versus strain curves that represent the tetragonal and the orthorhombic phases lie closer to each other (see \FigrefStrain_Zr). In \TabrefStrain_Zr, we notice that the energy difference between the optimized grains and the grains with the same area is lowest for high Zr:Hf ratios. Because the orthorhombic Pca21 space group is a subgroup of the tetragonal P42/nmc space group, the proximity in their energies promotes antiferroelectricity (Reyes-Lillo et al., 2014). This supports the experimental observation of antiferroelectric behavior in thin films with higher Zr content (see \SecrefExperiment6).
IV.3.5 Effects of strain on (Al, Ge, Ti, La):HfO2
To conclude this section, we repeat the strain analysis for four additional dopants: Al, Ge, Ti and La. Our results are summarized in \TabrefStrain_other, and the energy versus in-plane matching area plots are in the Supplementary Material.
We observe that the effect of strain on the Al-doped bulk HfO2 is very similar to that on the Si-doped bulk HfO2. The strain values at which the energies of the orthorhombic and the monoclinic phases coincide for these two dopants at 4% doping are close to zero (0.2% for Si and 0.3% for Al); therefore, the transformation from the tetragonal phase to the orthorhombic phase during annealing is expected to be robust for both dopants. This is in agreement with experiments which have found that the ferroelectric properties of Si- and Al-doped HfO2 are similar (Schroeder et al., 2014; Park et al., 2017).
We also observe that the 2% and 4% doping percentages for Ge, Ti and La do not improve on the required strain values for the crossing of energies of the orthorhombic and the monoclinic phases compared to undoped HfO2. Therefore, we predict that Ge and Ti may not perform as well as Si and Al as dopants in HfO2 in terms of promoting ferroelectricity at low doping concentrations even though their atomic radii are very close to those of Si and Al. Our similar prediction regarding La is at odds with experiments to date in which La:HfO2 has yielded high values (Schroeder et al., 2014; Starschich and Boettger, 2017). However, in these experiments, the doping concentration was greater than , which is beyond the reliable range of our VCA method for non-isovalent elements. We leave a detailed analysis of the case of La for future research.
Our analysis in this section supports our hypothesis that some of the initially formed tetragonal grains transform into out-of-plane polarized orthorhombic grains during thermal annealing. This requires these grains to be confined in-plane by the surrounding grains, and out-of-plane by the bottom and top electrodes. The ideal doping range for this transformation is for Si and Al, and for Zr.
IV.4 Thin film simulations
In addition to the combined effects of doping and strain, we have performed investigations on interface effects. In hafnia-based thin films, ferroelectricity occurs when the film is 8-24 nm thick, and the grains are generally a few nm in size. This makes finite-size effects potentially important. Surfaces of ZrO2 and HfO2 have been studied experimentally (Pitcher et al., 2005; Chevalier et al., 2009) and theoretically (Garvie, 1978; Mukhopadhyay et al., 2006; Luo et al., 2008, 2009) prior to the discovery of ferroelectricity in these films, with a focus on the monoclinic and tetragonal phases. A recent study has included the polar orthorhombic Pca21 phase into a first principles investigation of surfaces of hafnia (Batra et al., 2016).
Our goal is to compute the energies of the interfaces between relevant phases of hafnia and typical electrodes such as TiN and Ir. In \FigrefStack, we schematically depict an Ir/HfO2/Ir stack. In order to isolate thin film effects from strain effects, we fix the in-plane lattice parameters to the lattice parameters of the HfO2 phase in the orientation that we choose to study. We have found that the lattice parameters of HfO2 are in the range of 5.04-5.30 Å (see \TabrefLat_para). On the other hand, typical electrodes used with hafnia thin films, e.g. TiN and Ir, have lattice constants of 4.24 Å and 3.90 Å, respectively. To faithfully use these electrode lattice constants, we would need to simulate very large supercells to create heterostructures where no significant strain occurs on either the metal or the oxide. However, we believe that such a calculation is not needed as a first pass, since epitaxial growth is not actually observed in the experimental systems. Therefore, we study the interfaces using much more reasonably sized cells of Ir ( Å) with HfO2, where the Ir is strained to match various phases and orientations of HfO2. A similar TiN cell would have a lattice constant of Å and thus require a huge compressive strain, so we drop TiN from this initial study and focus on Ir. Lastly, we emphasize that these are model calculations: the theoretical simulation has periodic boundary conditions and thus is always epitaxial while the experimental interfacial structure is much more complex, non-epitaxial, and unknown with any precision at present. Moreover, in our calculations, the Ir layers are significantly strained, and thus they represent only an idealized model representation of a metal electrode rather than the actual material used in the experiment. Our aim is to use a first-principles approach to the interfacial energetics to gauge their approximate size and possible importance under the assumption that the interaction of HfO2 with this theoretical model electrode is a good proxy to the actual interfacial interaction. Although Ir is employed less frequently than TiN in the experiments, it fits better into our approach because it undergoes small relaxations when interfaced with HfO2. In contrast, our trial simulations of TiN/HfO2 interfaces exhibited large distortions and formed cross-interface chemical bonds between Ti and O atoms.
In order to compute the interfacial energies in a stack as shown in \FigrefStack, we first define the surface energy of the free-standing Ir thin film as
[TABLE]
where is the computed energy of the free-standing strained Ir film, is the energy per u.c. of the bulk strained Ir, and is the thickness of the Ir film in units of unit cells. An accurate way to extract is to compute as a function of and fit a straight line, treating and as fitting parameters (Fiorentini and Methfessel, 1996). For this task, we have used (each unit cell of Ir consists of two atomic layers). The resulting surface energies are listed in \TabrefInt_energies.
Once we have found for a given phase and orientation of HfO2, we calculate the interfacial energies as
[TABLE]
where is the computed energy of the final materials stack, is the energy per u.c. of the bulk strained Ir, is the energy per u.c. of bulk HfO2, and the thicknesses , and are shown in \FigrefStack and are in unit cells. We note that we can only compute the sum of the two interfacial energies using this approach; if the interfaces are physically identical, then a single interface energy becomes available.
The relaxed configuration of the Ir/HfO2/Ir stack with where HfO2 is in the monoclinic- configuration is shown in \FigrefSimcell. To find the lowest energy interfaces for a given phase and orientation, we have first simulated possible surface terminations of HfO2. In order to include an integer number of unit cells in the thin film (i.e., stoichiometric hafnia), we have restricted the terminations to be Hf on one end and O on the other (Hf--OO) or O terminated on both ends (O--O). Prior work on zirconia has shown that the energy of an O--O terminated slab is lower in energy than a Zr--OO terminated slab by 13.0 eV per in-plane cell for films of free-standing ZrO2 (Eichler and Kresse, 2004). Analogous results have been reported for hafnia as well (Batra et al., 2016). We have found a very similar (and huge) value of 13.4 eV for free-standing HfO2 by simulating 2 u.c. thick films. To check that the Hf--OO termination remains high-energy for oxide/metal interfaces, we have simulated HfO2/Ir stacks with the cubic phase for (Ir)-Hf--OO-(Ir), (Ir)-OO--Hf-(Ir) and (Ir)-O--O-(Ir) terminations. We have found that the (Ir)-Hf--OO-(Ir) and (Ir)-OO--Hf-(Ir) stacks are 6.3 and 7.8 eV per in-plane cell higher in energy than the (Ir)-O--O-(Ir) stack, respectively. Therefore, we have decided to restrict our studies to the O--O terminated HfO2 films for all phases of hafnia. In order to find the lowest energy interface for each HfO2 phase and orientation, we have run relaxations for the top and bottom interfaces separately, using a lateral grid of initial HfO2 positions relative to Ir for each case. After finding the optimal coordinates for the top and bottom interfaces separately, we have joined them to make the Ir/HfO2/Ir stacks, and then fully relaxed the atomic positions (except for the surface u.c. of Ir).
We have studied the interfaces of Ir and pure HfO2 in the monoclinic, tetragonal, orthorhombic and cubic phases, in all possible inequivalent principle orientations. The only exception is the orientation, which is excluded because of the non-orthogonal in-plane lattice vectors. To extract accurately from 2, we have computed with and , fitting a linear equation with , and as the fitting parameters. After extracting , we have used the values found earlier to compute for each case. We have found that all phases and orientations are mechanically stable in thin film form, with modest relaxations at both Ir/HfO2 interfaces. We list the interface energies we have found in \TabrefInt_energies. Our results are in the range of 5-13 eV, which is comparable to the 4-12 eV range found for (twice) the surface energies of HfO2 (Batra et al., 2016).
With the interface energies we have obtained via 2 and listed in \TabrefInt_energies, we build an energetic model for variable-thickness films based on our interfacial energies and bulk hafnia energies using the formula:
[TABLE]
where is the energy of the thin film of HfO2 in a given phase and orientation “ph-or”, is the thickness of the hafnia in u.c., and is the energy of one unit cell of HfO2 in phase “ph”.
We summarize the results of this model in \FigrefFilmE as a plot of energy vs. thickness for each of the phase-orientation pairs we have studied. We define to be zero, so the lines that correspond to the monoclinic phase are horizontal. We observe that, because of variations in the interface energies that are of the order of a few eV per in-plane cell, several crossings occur. Even though the grains remain as the lowest energy configuration for all thicknesses, we find that for ultra-thin films, , and grains are also competitive (see also \TabrefInt_energies for the interface energy values). If some grains are formed initially, they may become kinetically trapped as the film grows further. The energy of the film crosses the energies of the films approximately at a thickness of 2 unit cells. For thicker films, grains are more favorable than grains, but less favorable than . Hence, this simple model predicts that grains may initially form during growth and then transform into , , or grains during annealing. The matching plane arguments from \SubsecrefEffects-of-strain disfavor the transformation into , ; hence we would expect and transformations to dominate. Our thin film results thus agree with the \text{t}\left[100\right]\rightarrow\left(\text{\text{\text{m}\left[100\right]\left[001\right]}}\right) picture above; however, the doping-induced modifications in the energy vs. strain curves, presented in \SubsecrefEffects-of-strain, as well as volumetric confinement, are necessary to favor the transformation over the transformation. In summary, our interfacial model indicates that interface effects (1) are significant and can dominate in the early stages of growth, and (2) do not explain the observed properties of the films unless they are considered in conjunction with doping and strain effects. We expect these overall conclusions to be true for all electrodes employed in the experiments including TiN.
Our model has a number of limitations. Two that can be addressed relatively easily in future studies are: (1) The simulation for every phase and orientation is done at the unstrained lattice parameters of that phase and orientation. The electrode is assumed to be unaffected by strain in any significant way. This assumption can be tested by applying small strain to each phase and orientation and re-computing the interface energies to check that they do not change in irregular ways. (2) The films are assumed to stay exactly stoichiometric, i.e. an exact monolayer (ML) of oxygen (and then a ML of hafnium) at both interfaces. Further simulations can be run with 0, 0.5, 1.5 and 2 ML of oxygen at the interfaces, yielding differing energy vs. thickness lines in \FigrefFilmE.
V Conclusion
We have conducted a first-principles study of doped hafnia with the goal of understanding some of the experimental observations concerning ferroelectricity from a structural point of view. We have described the effects of various dopants on the energetics of bulk phases of HfO2. We have discussed in detail the structural changes that are caused by Si doping. We have compared two computational methods for modeling doping: atomic substitution (AS) and the virtual crystal approximation (VCA). We have found that VCA compares well with AS and used VCA to simulate the effects of epitaxial strain on doped HfO2. We have found that among 0%, 2% and %4 Si doping, 4% doping provides the best conditions for initial grains to transform into grains. We have also found that for HfxZr1-xO2, provides the most favorable conditions for the tetragonal orthorhombic transformation. However, for this transformation to be preferred over the tetragonal monoclinic transformation, some confinement needs to be present. In experiments, this confinement is provided by a top electrode (typically TiN). Our findings provide an explanation for common experimental observations for the optimal ranges of doping in Si:HfO2 and HfxZr1-xO2. Repeating the same analysis for Al, Ti, Ge and La, we have found that Al:HfO2 behaves similarly to Si:HfO2; whereas Ti, Ge or La doping only slightly modifies the strain response of pure HfO2. Finally, we have described a model to estimate the interface effects for thin films of hafnia, based on ab initio simulations of Ir/HfO2/Ir stacks. Our results offer interesting clues for how the interface effects may be in play for the stabilization of the ferroelectric phase in these films.
VI Acknowledgements
This work was supported by the National Science Foundation under Award 1609162 and by the grant MRSEC DMR-1119826. We thank the Yale Center for Research Computing for guidance and use of the research computing infrastructure, with special thanks to Stephen Weston and Andrew Sherman. Additional computational support was provided by NSF XSEDE resources via Grant TG-MCA08X007.
The reference list from the paper itself. Each links out to its DOI / PubMed record.
- 1Mc Kee et al. (2001) R. A. Mc Kee, F. J. Walker, and M. F. Chisholm, Science 293 , 468 (2001), ISSN 0036-8075, 1095-9203, URL http://www.sciencemag.org/content/293/5529/468 .
- 2Hoffman et al. (2010) J. Hoffman, X. Pan, J. W. Reiner, F. J. Walker, J. P. Han, C. H. Ahn, and T. P. Ma, Advanced Materials 22 , 2957 (2010), ISSN 1521-4095, URL http://onlinelibrary.wiley.com/doi/10.1002/adma.200904327/abstract .
- 3Kumah et al. (2016) D. P. Kumah, M. Dogan, J. H. Ngai, D. Qiu, Z. Zhang, D. Su, E. D. Specht, S. Ismail-Beigi, C. H. Ahn, and F. J. Walker, Physical Review Letters 116 , 106101 (2016), URL http://link.aps.org/doi/10.1103/Phys Rev Lett.116.106101 .
- 4Dogan et al. (2018) M. Dogan, S. Fernandez-Peña, L. Kornblum, Y. Jia, D. P. Kumah, J. W. Reiner, Z. Krivokapic, A. M. Kolpak, S. Ismail-Beigi, C. H. Ahn, et al., Nano Letters 18 , 241 (2018), ISSN 1530-6984, URL http://dx.doi.org/10.1021/acs.nanolett.7b 03988 . · doi ↗
- 5Ma and Han (2002) T. P. Ma and J.-P. Han, IEEE Electron Device Letters 23 , 386 (2002), ISSN 0741-3106.
- 6Dünkel et al. (2017) S. Dünkel, M. Trentzsch, R. Richter, P. Moll, C. Fuchs, O. Gehring, M. Majer, S. Wittek, B. Müller, T. Melde, et al., in 2017 IEEE International Electron Devices Meeting (IEDM) (2017), pp. 19.7.1–19.7.4.
- 7Gong and Ma (2016) N. Gong and T. Ma, IEEE Electron Device Letters 37 , 1123 (2016), ISSN 0741-3106.
- 8Chiou et al. (2007) Y.-K. Chiou, C.-H. Chang, and T.-B. Wu, Journal of Materials Research 22 , 1899 (2007), ISSN 2044-5326, 0884-2914, URL https://doi.org/10.1557/jmr.2007.0242 . · doi ↗