Electric and magnetic dipole modes in high-resolution inelastic proton scattering at $0^\circ$
Peter von Neumann-Cosel (1), Atsushi Tamii (2) ((1) Institut f\"ur, Kernphysik, Technische Universit\"at Darmstadt, Germany, (2) Research Center, for Nuclear Physics, Osaka University, Japan)
TL;DR
This paper demonstrates the use of high-resolution inelastic proton scattering at 0° to study nuclear dipole modes, revealing detailed structures, damping mechanisms, and level densities, with implications for nuclear physics and astrophysics.
Contribution
It introduces a novel experimental approach combining high energy resolution with dispersion matching to analyze dipole strength distributions and nuclear response functions.
Findings
High energy resolution (ΔE/E ≤ 10^{-4}) achieved in experiments.
Observation of fine structure in the IVGDR energy region.
Extraction of level densities and testing of the Brink-Axel hypothesis.
Abstract
Inelastic proton scattering under extreme forward angles including and at energies of a few hundred MeV has been established as a new spectroscopic tool for the study of complete dipole strength distributions in nuclei. Such data allow an extraction of the electric dipole polarizability which provides important constraints parameters of the symmetry energy, which determine the neutron skin thickness and the equation of state (EOS) of neutron-rich matter. Also new insight into the much-debated nature of the pygmy dipole resonance (PDR) is obtained. Additionally, the isovector spin-M1 resonance can be studied in heavy nuclei, where only limited experimental information exists so far. Together with much improved results on the isoscalar spin-M1 strength distributions in nuclei, these data shed new light on the phenomenon of quenching of the nuclear spin response. Using…
Click any figure to enlarge with its caption.
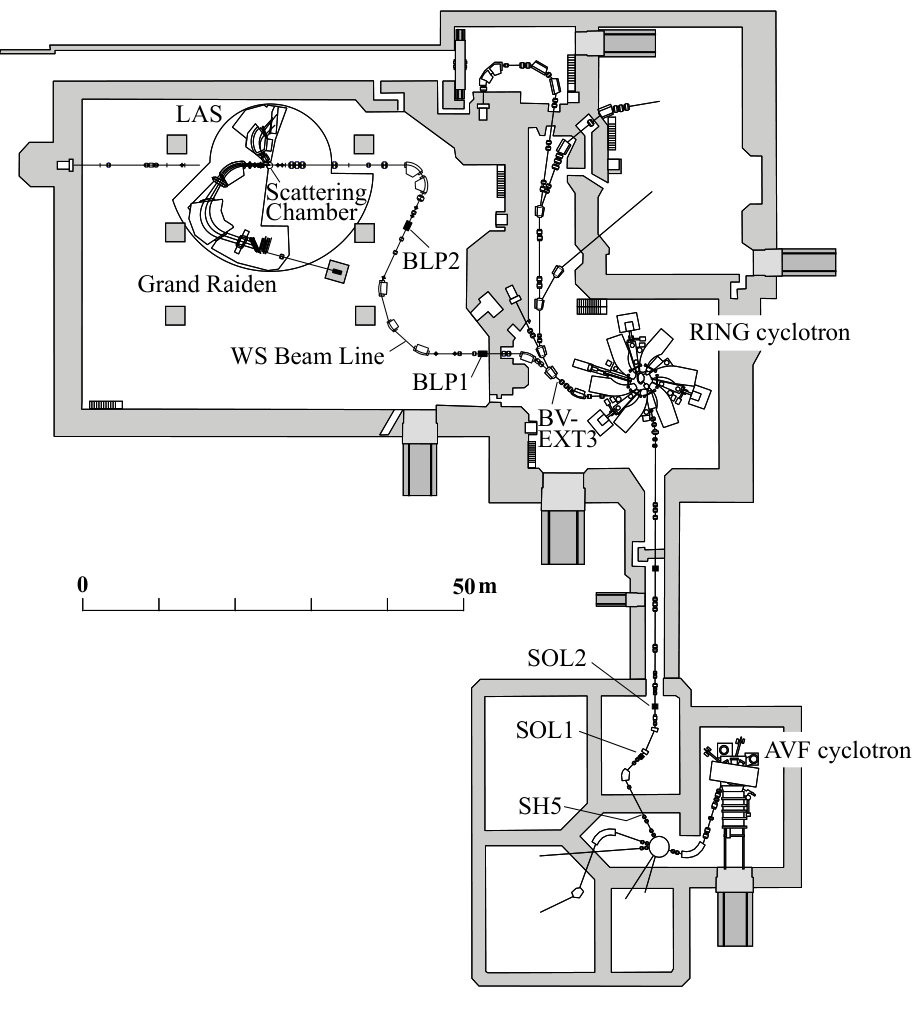 Figure 221
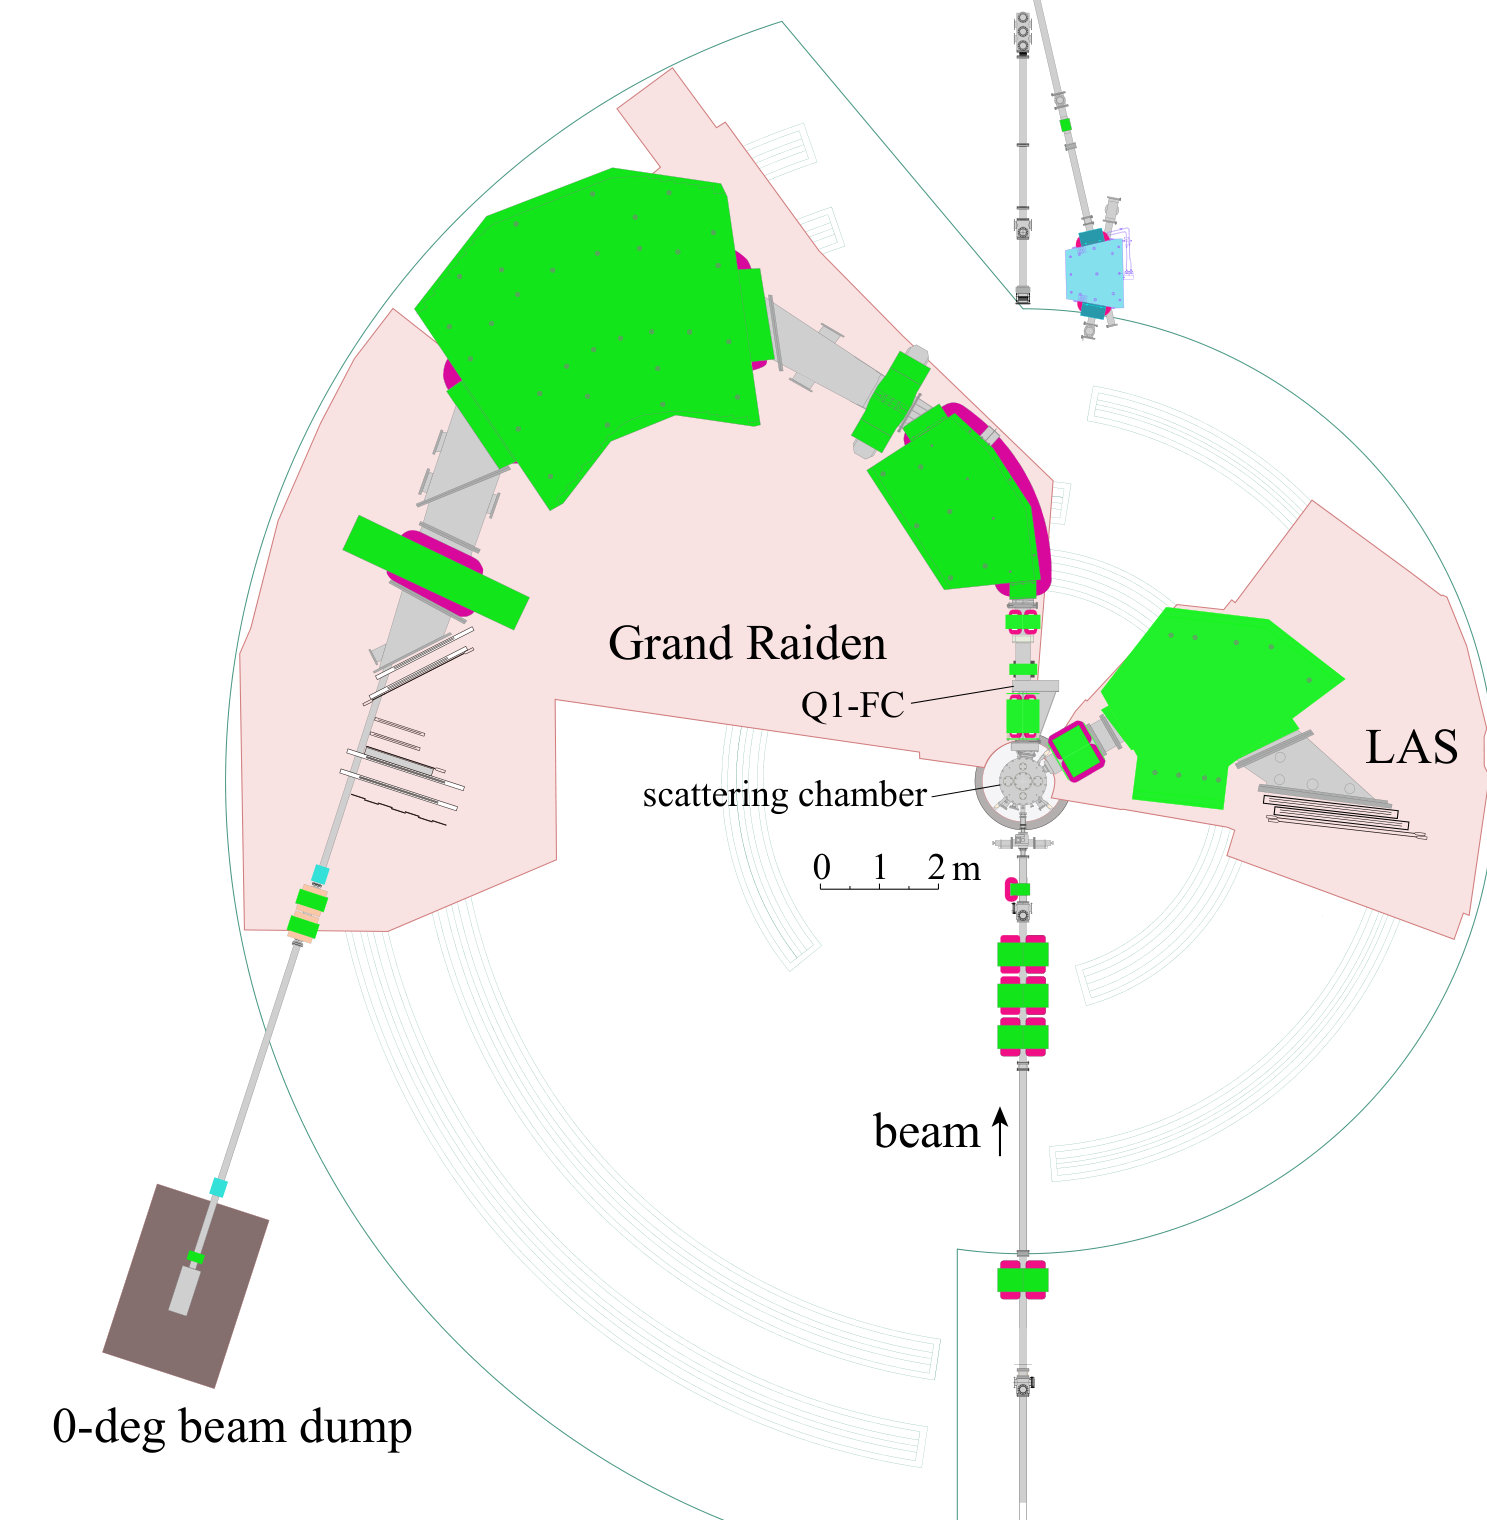 Figure 222
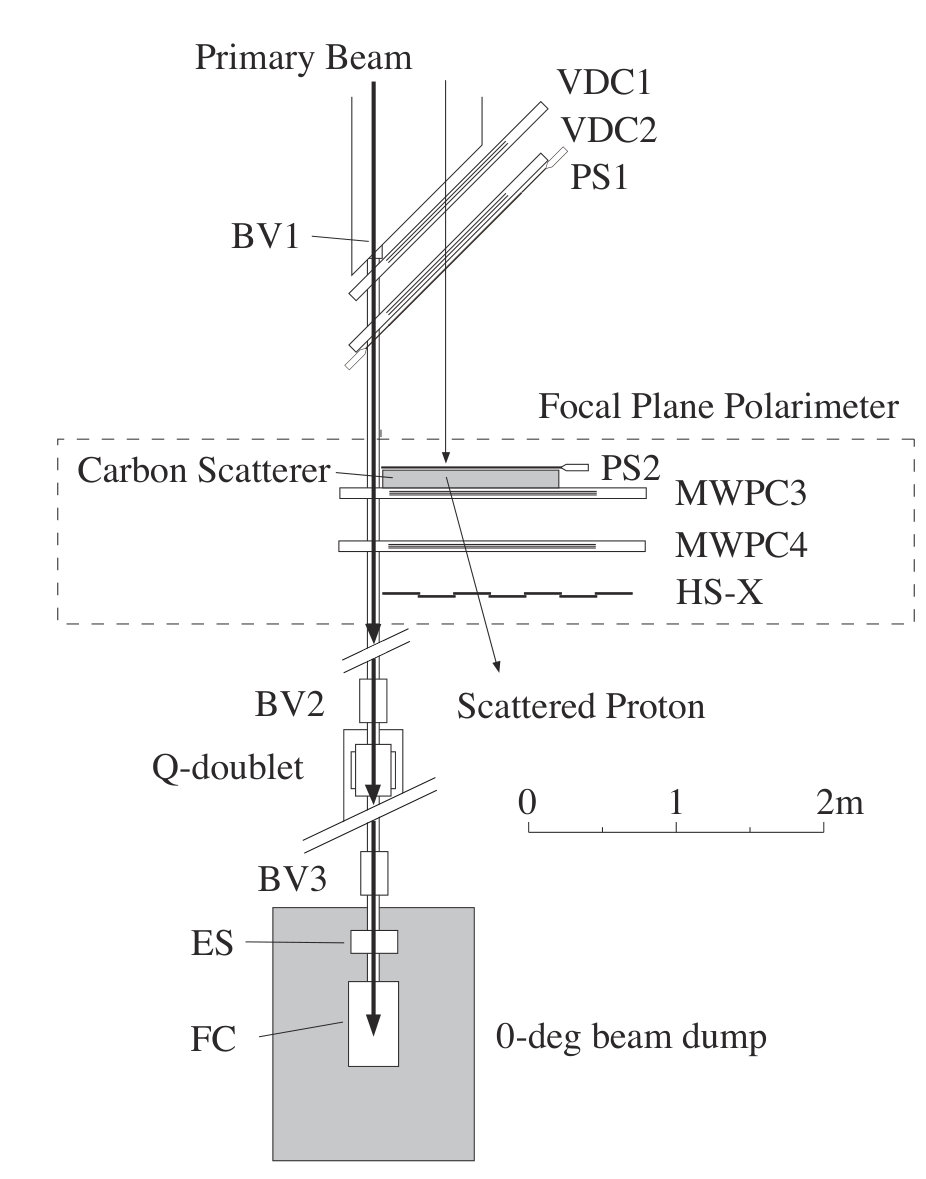 Figure 223
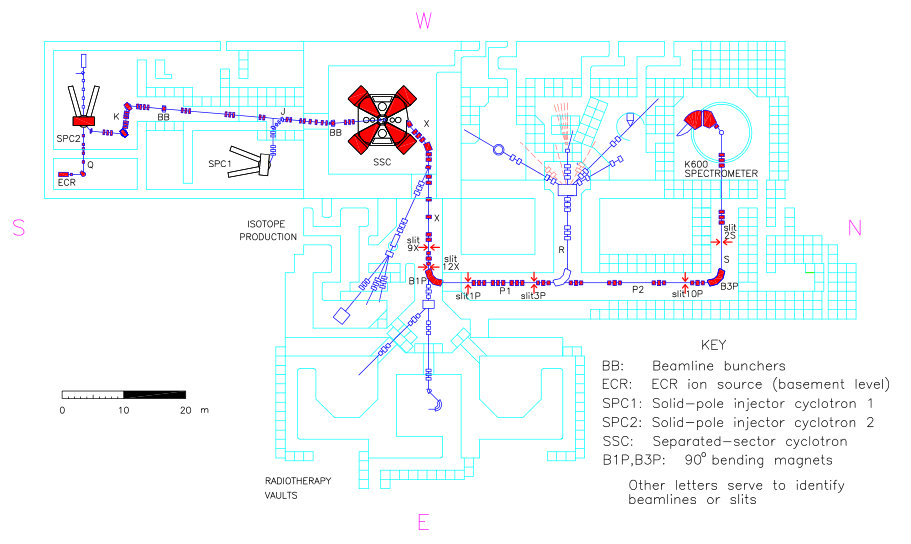 Figure 231
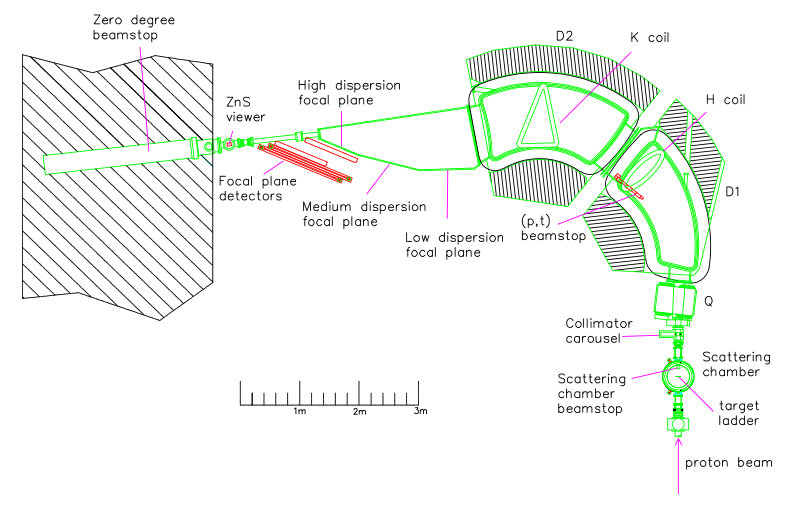 Figure 232
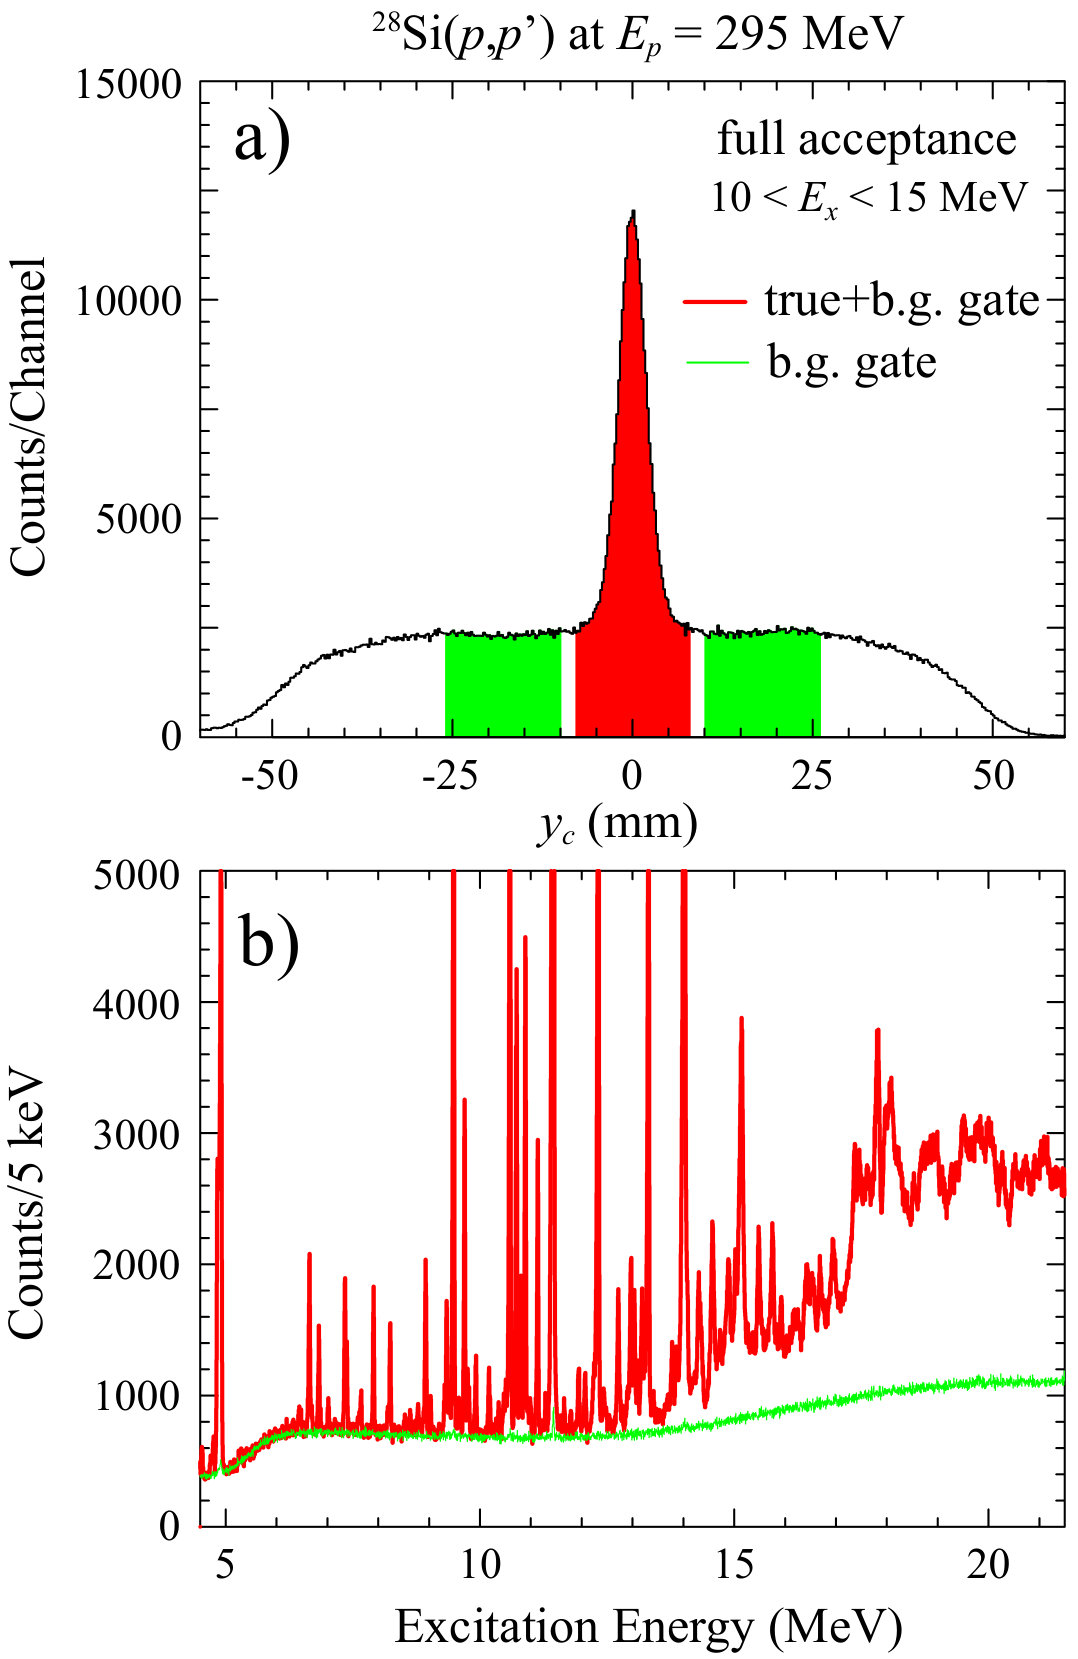 Figure 241
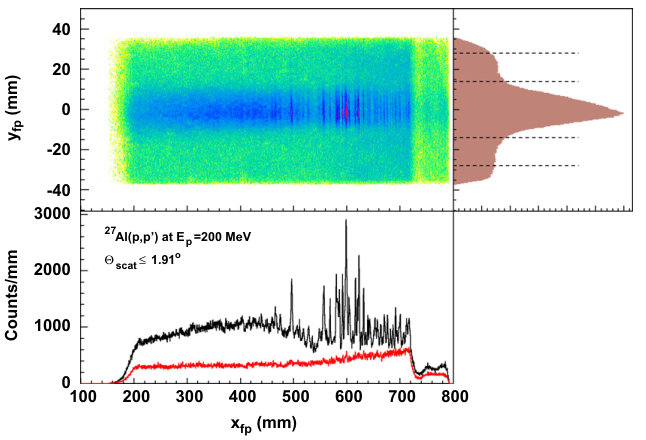 Figure 242
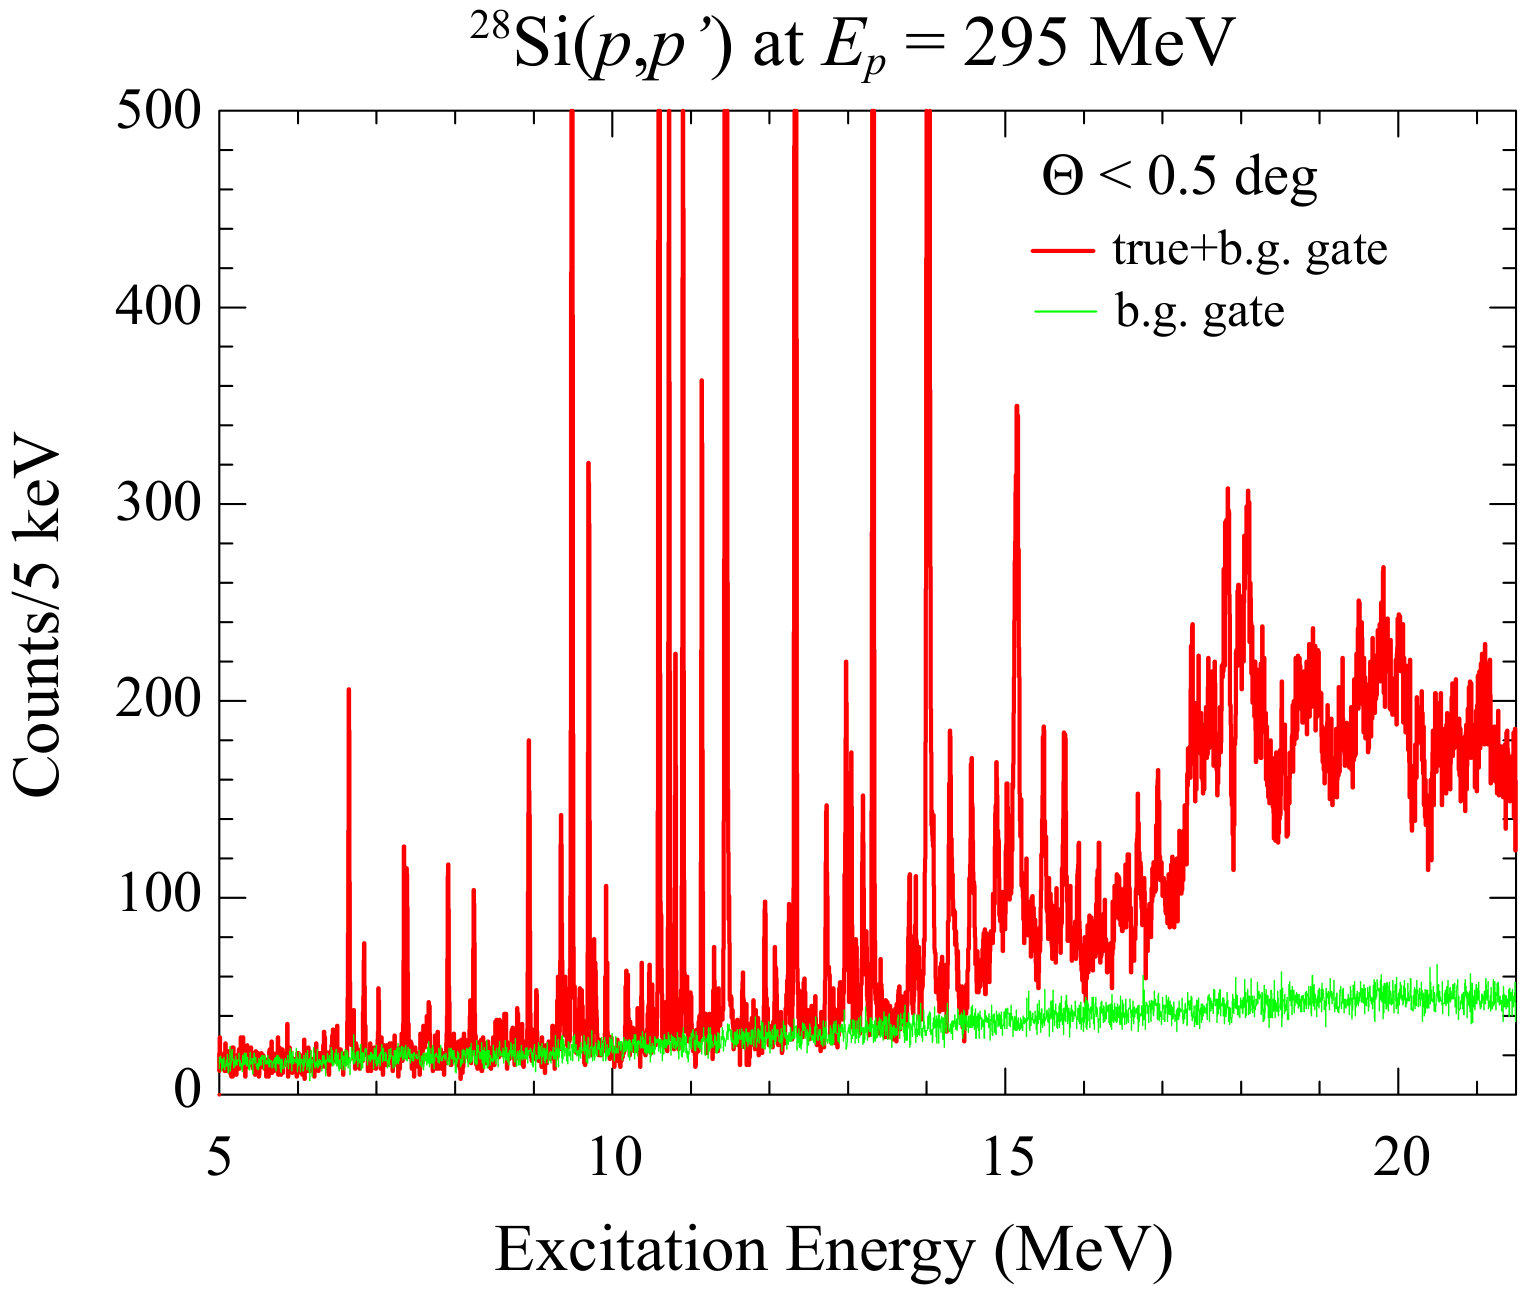 Figure 243
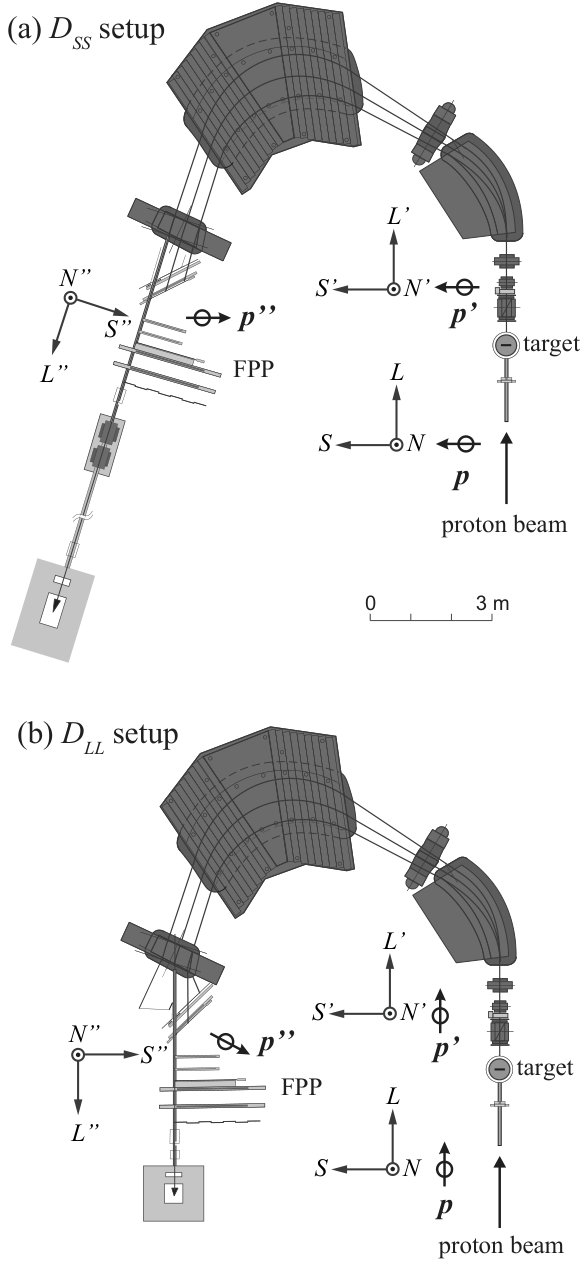 Figure 251
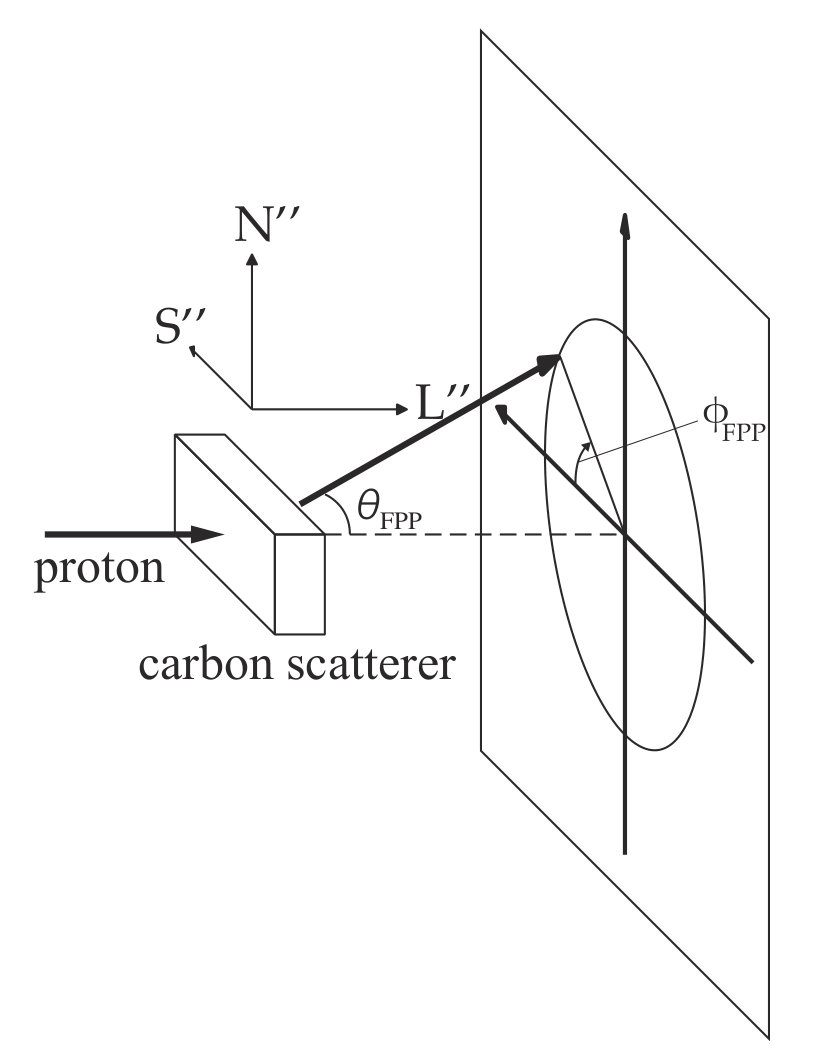 Figure 252
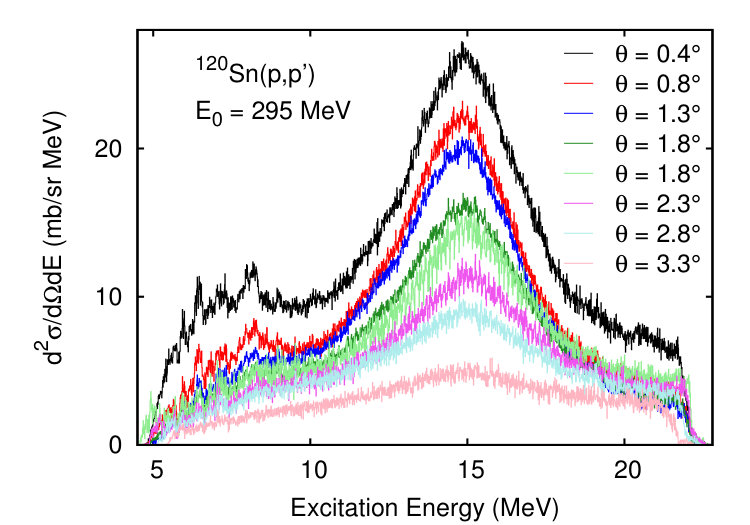 Figure 261
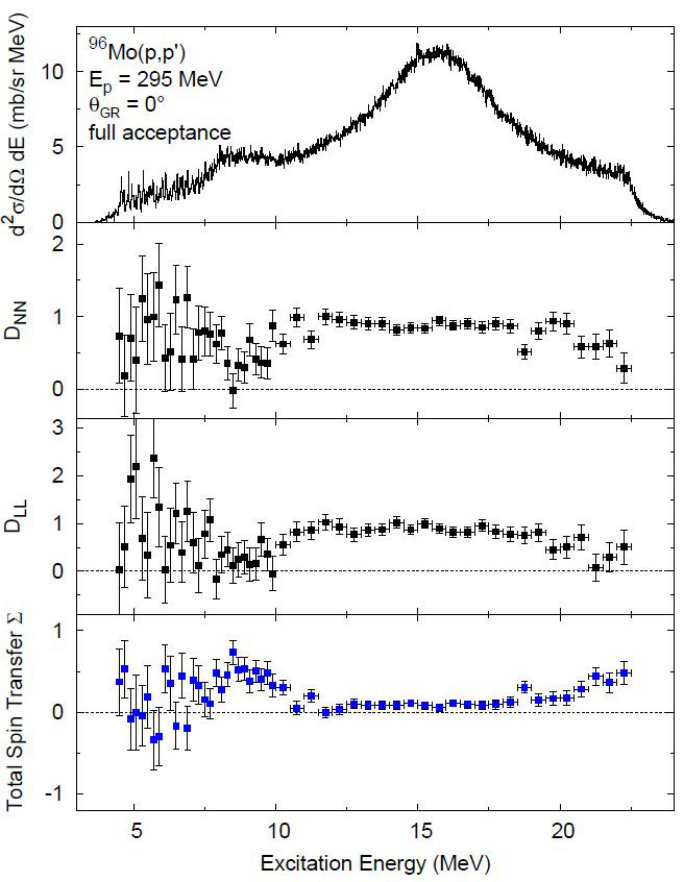 Figure 262
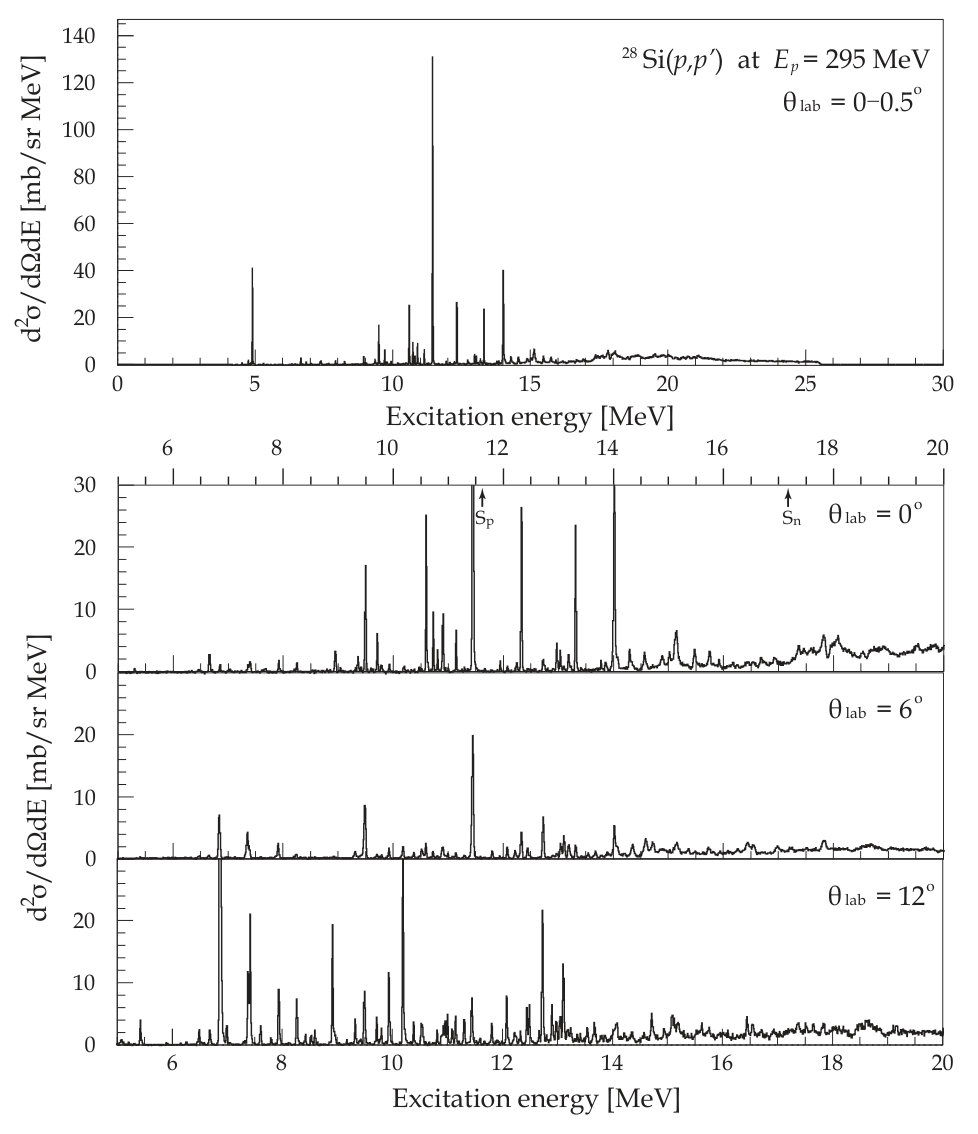 Figure 263
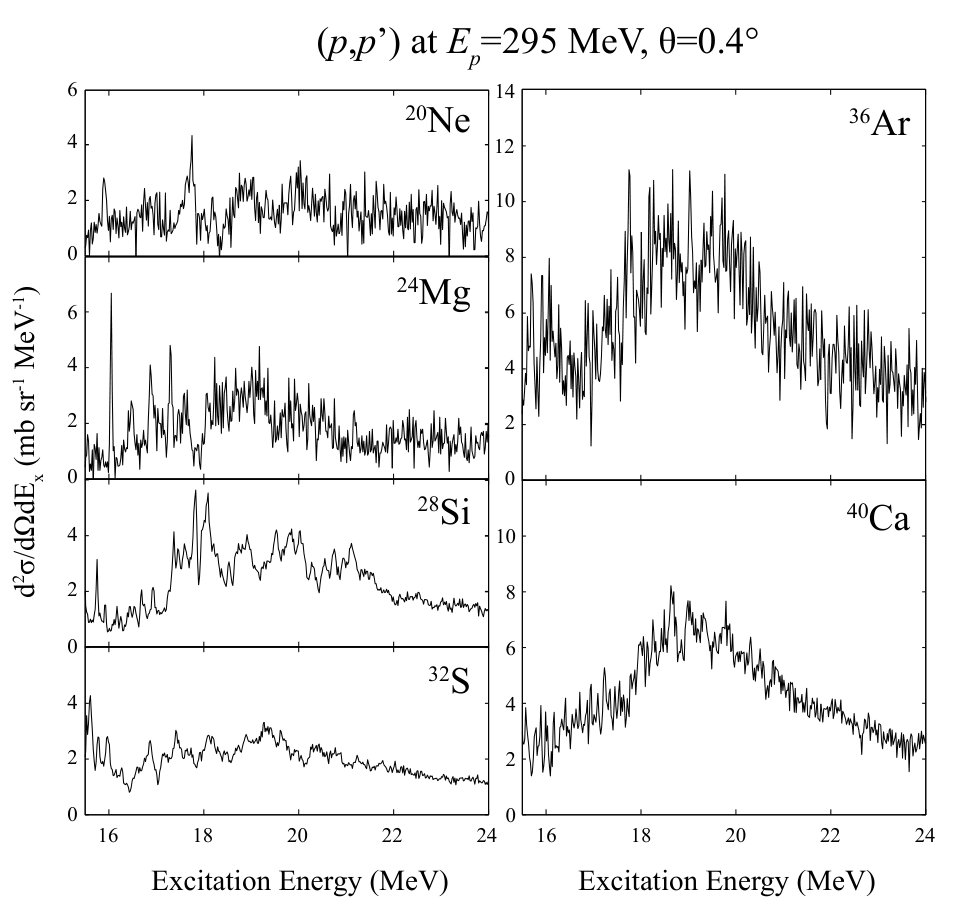 Figure 264
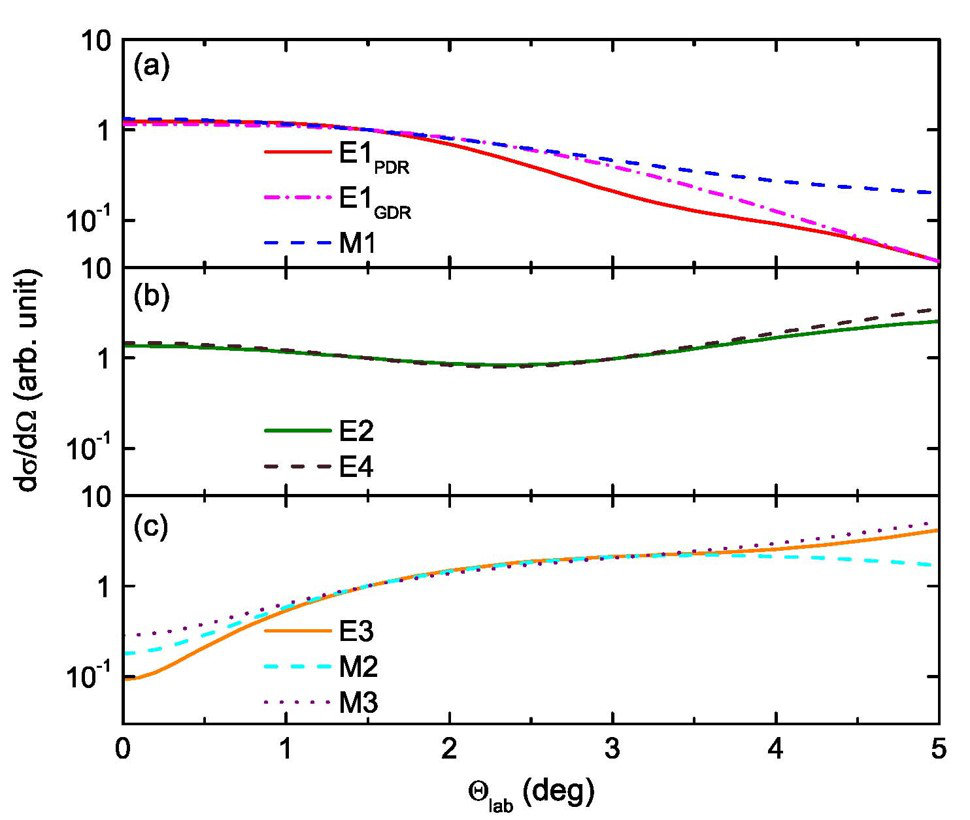 Figure 311
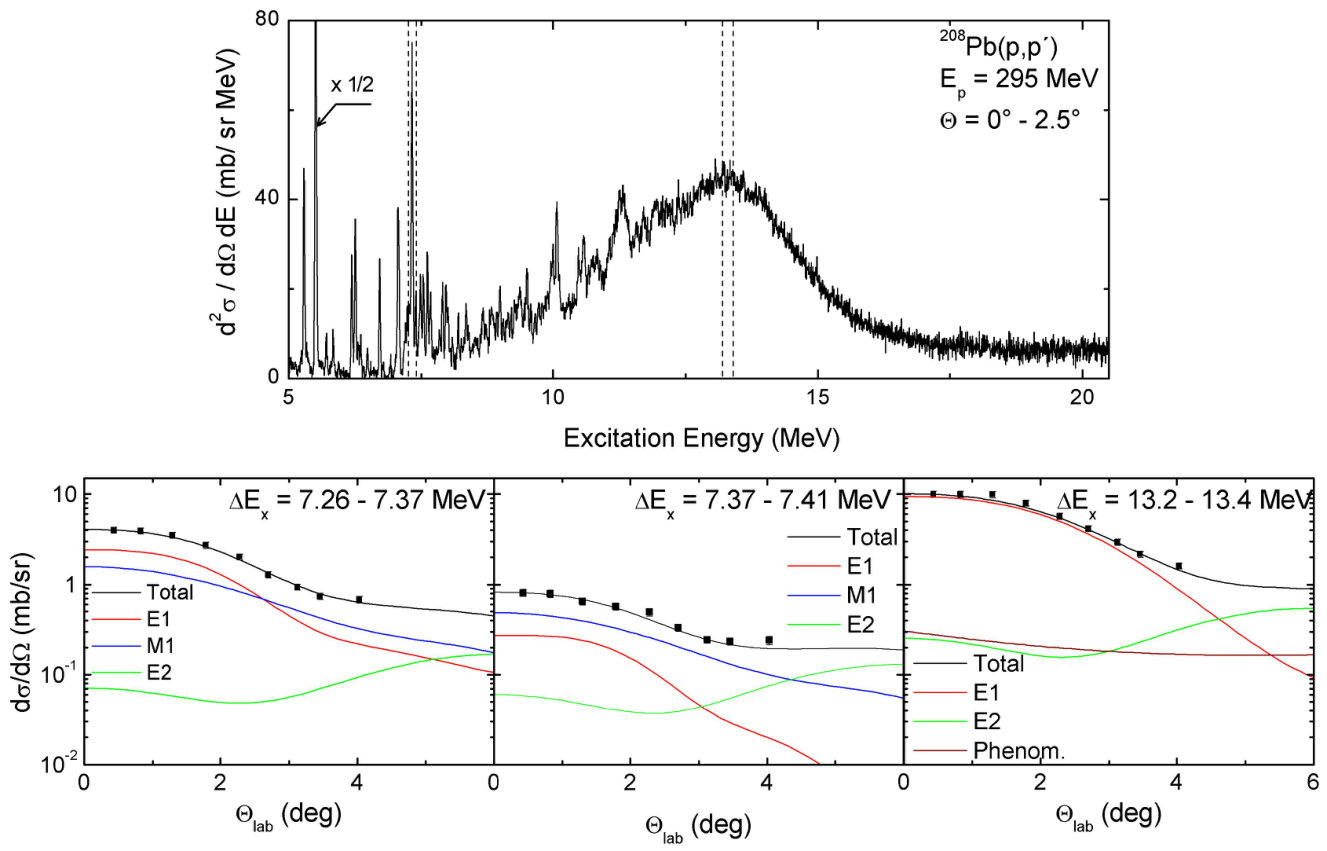 Figure 312
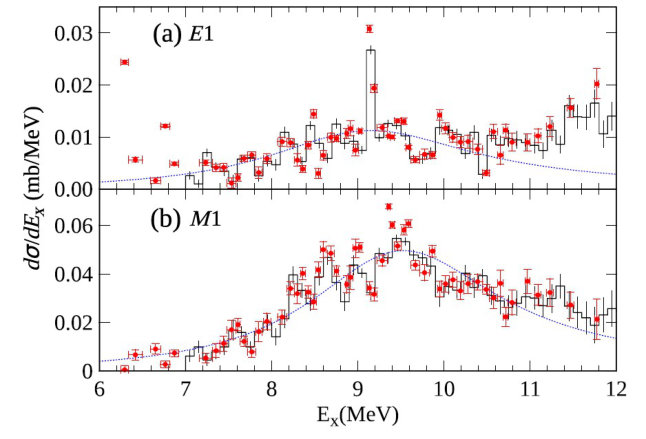 Figure 313
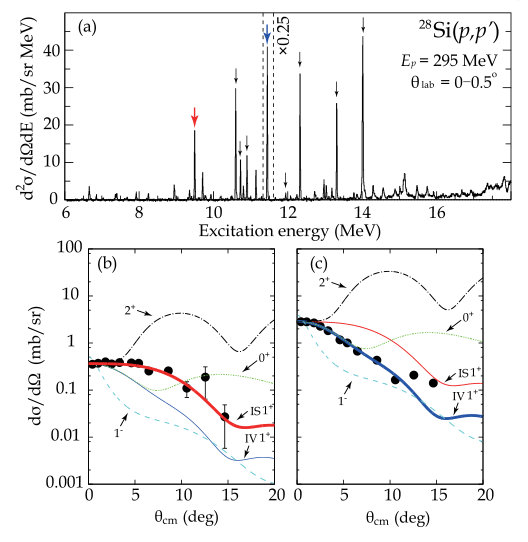 Figure 314
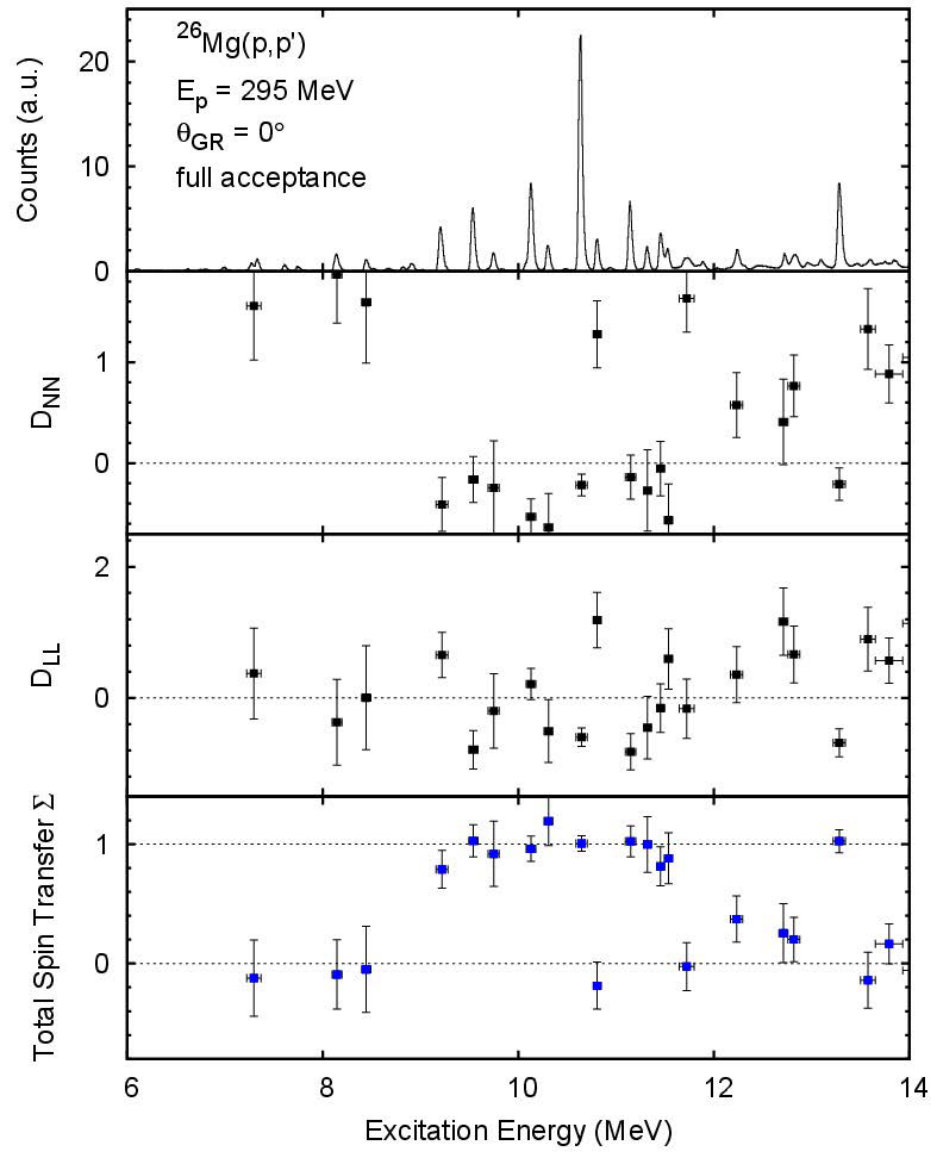 Figure 321
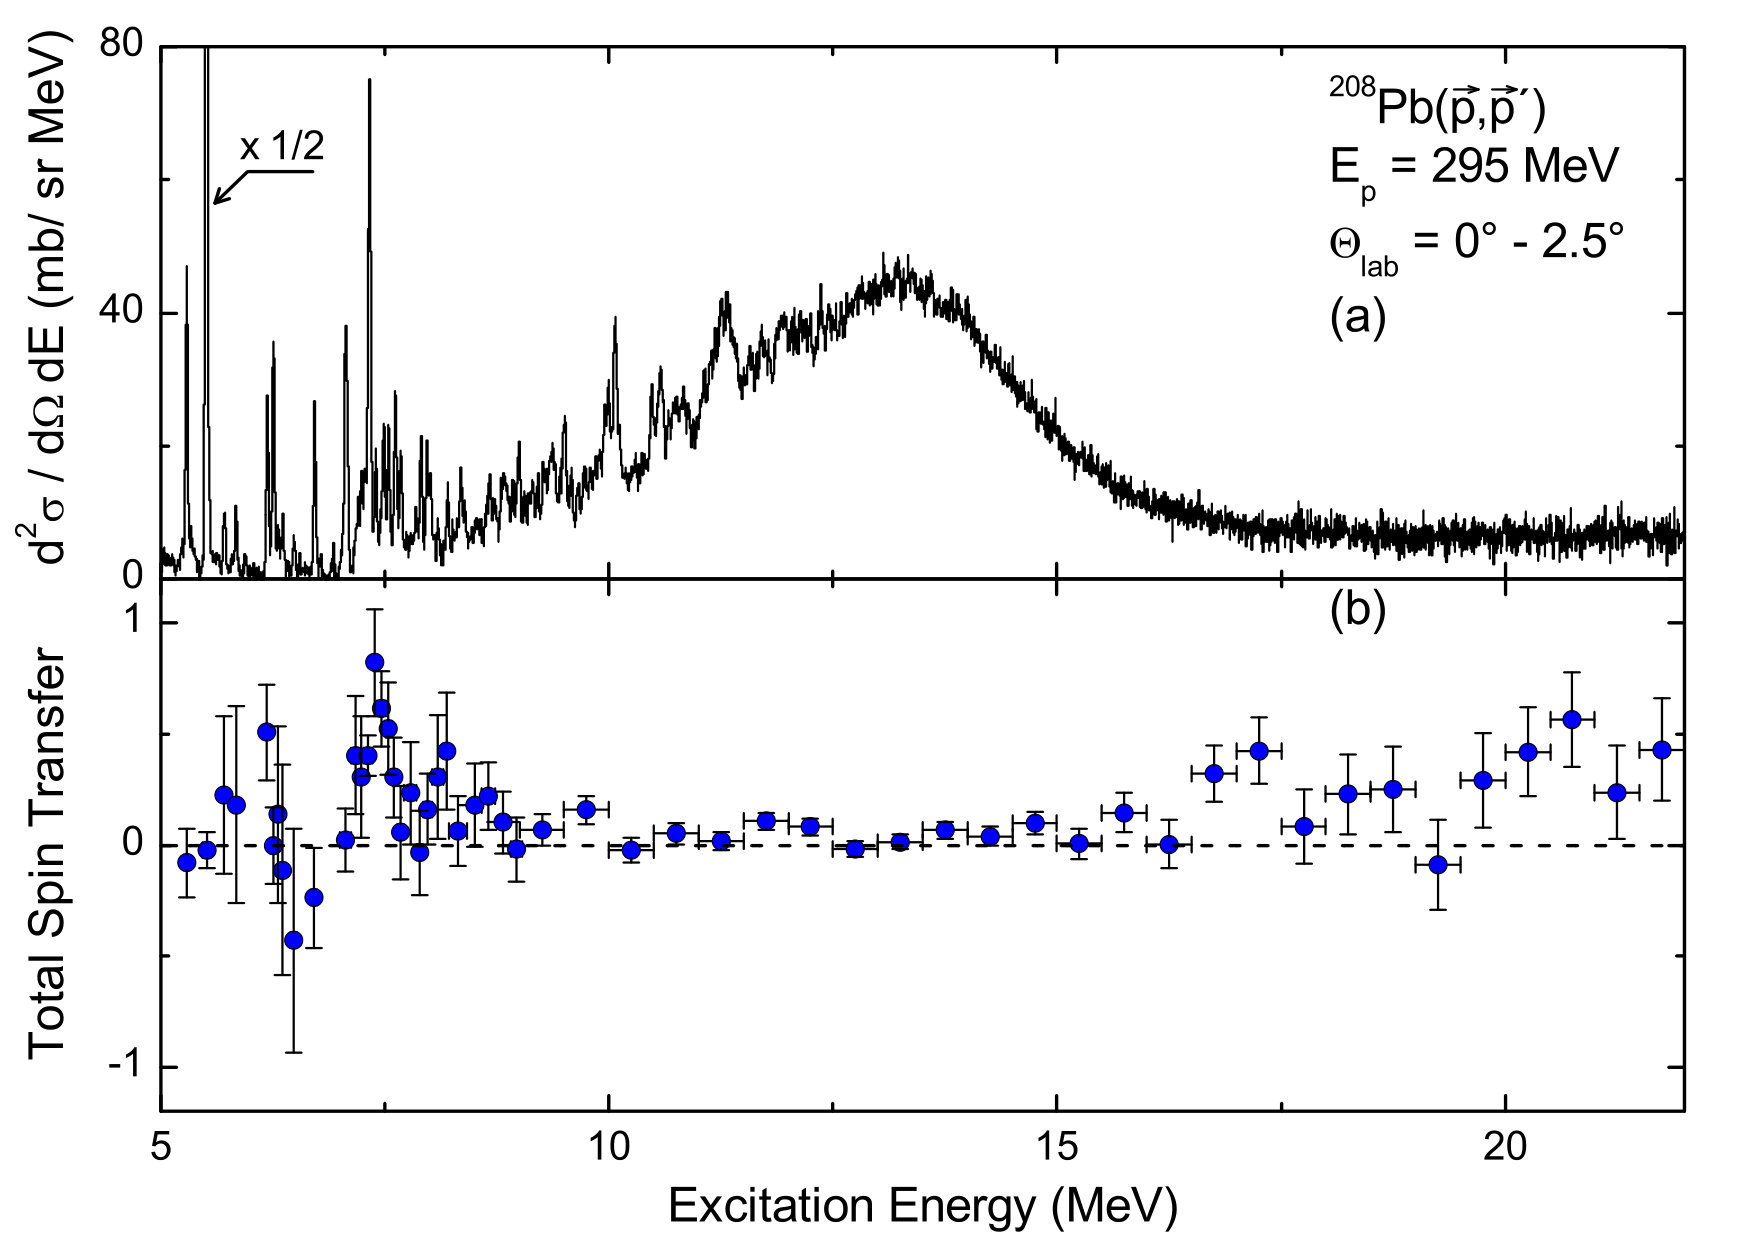 Figure 322
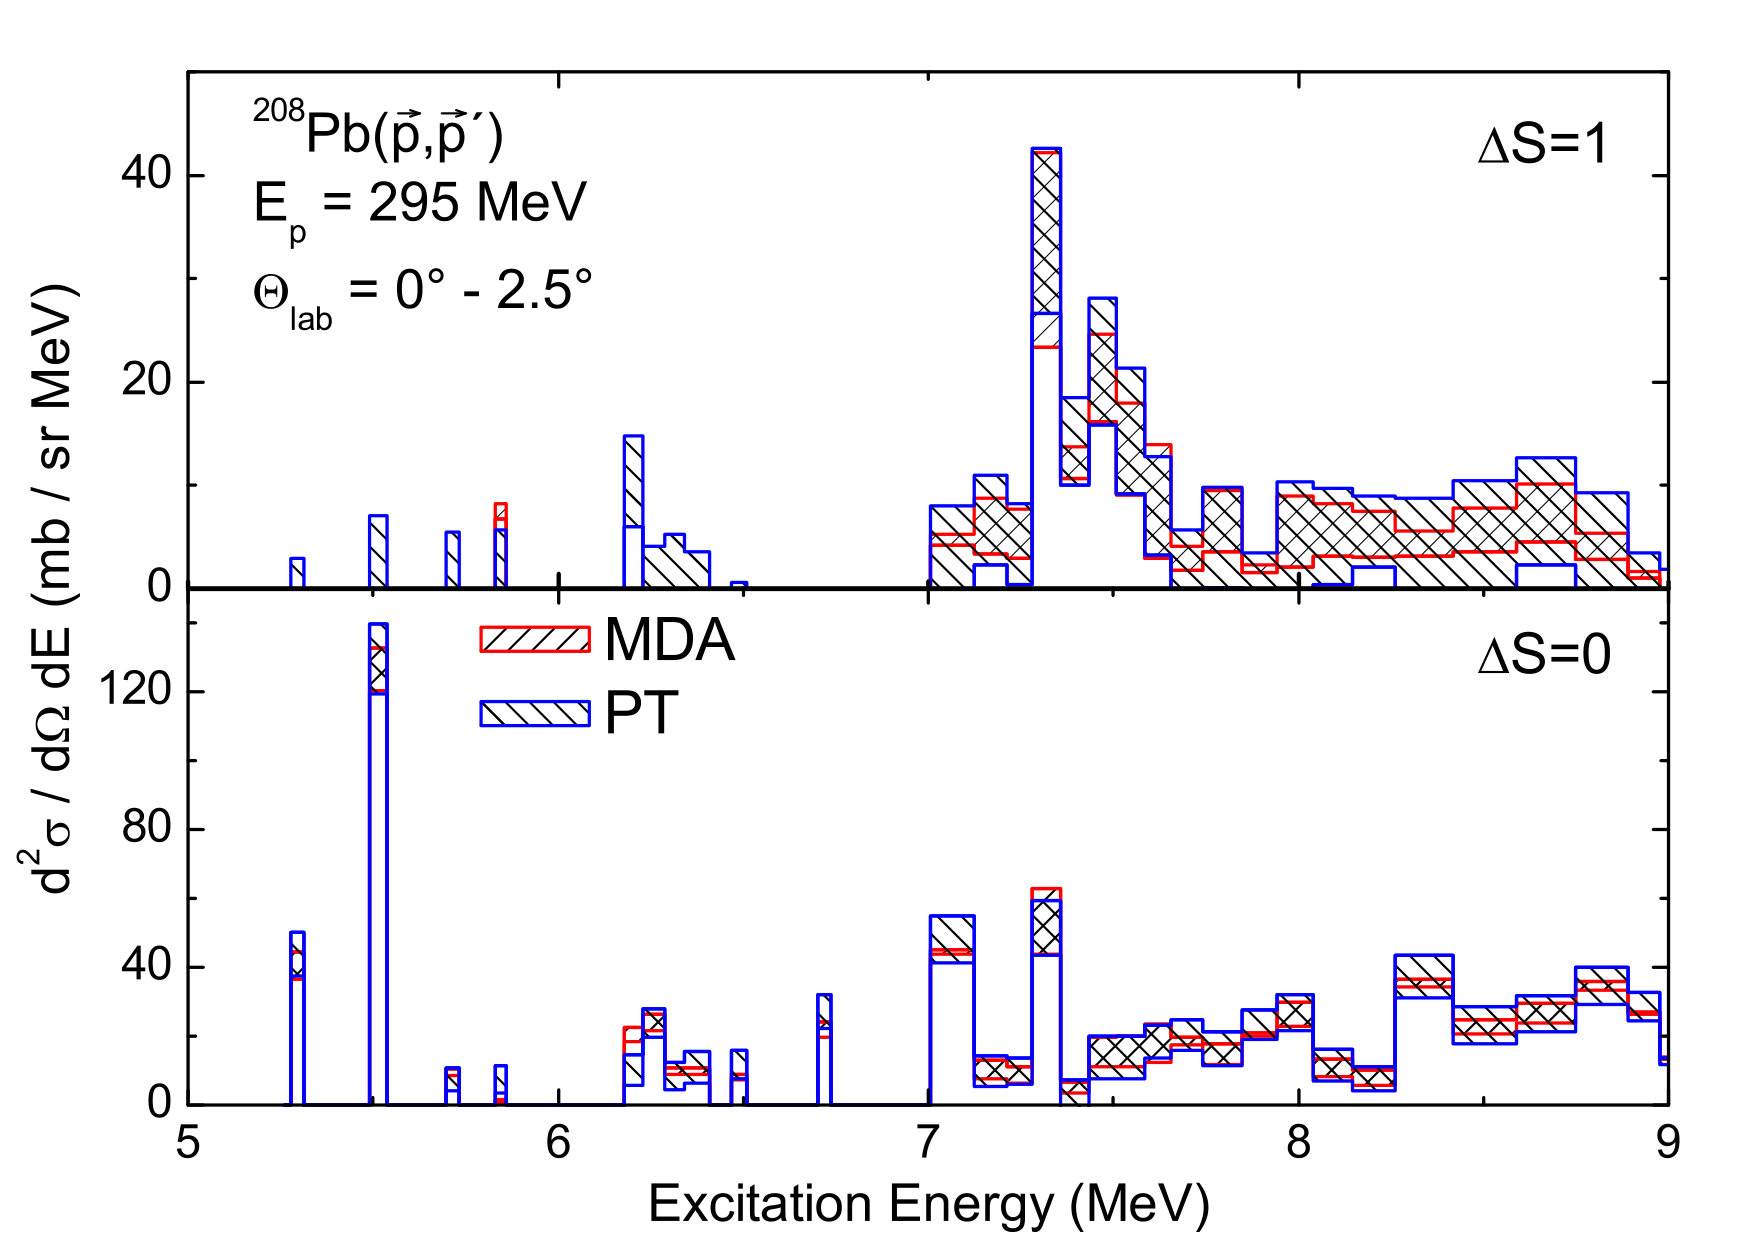 Figure 323
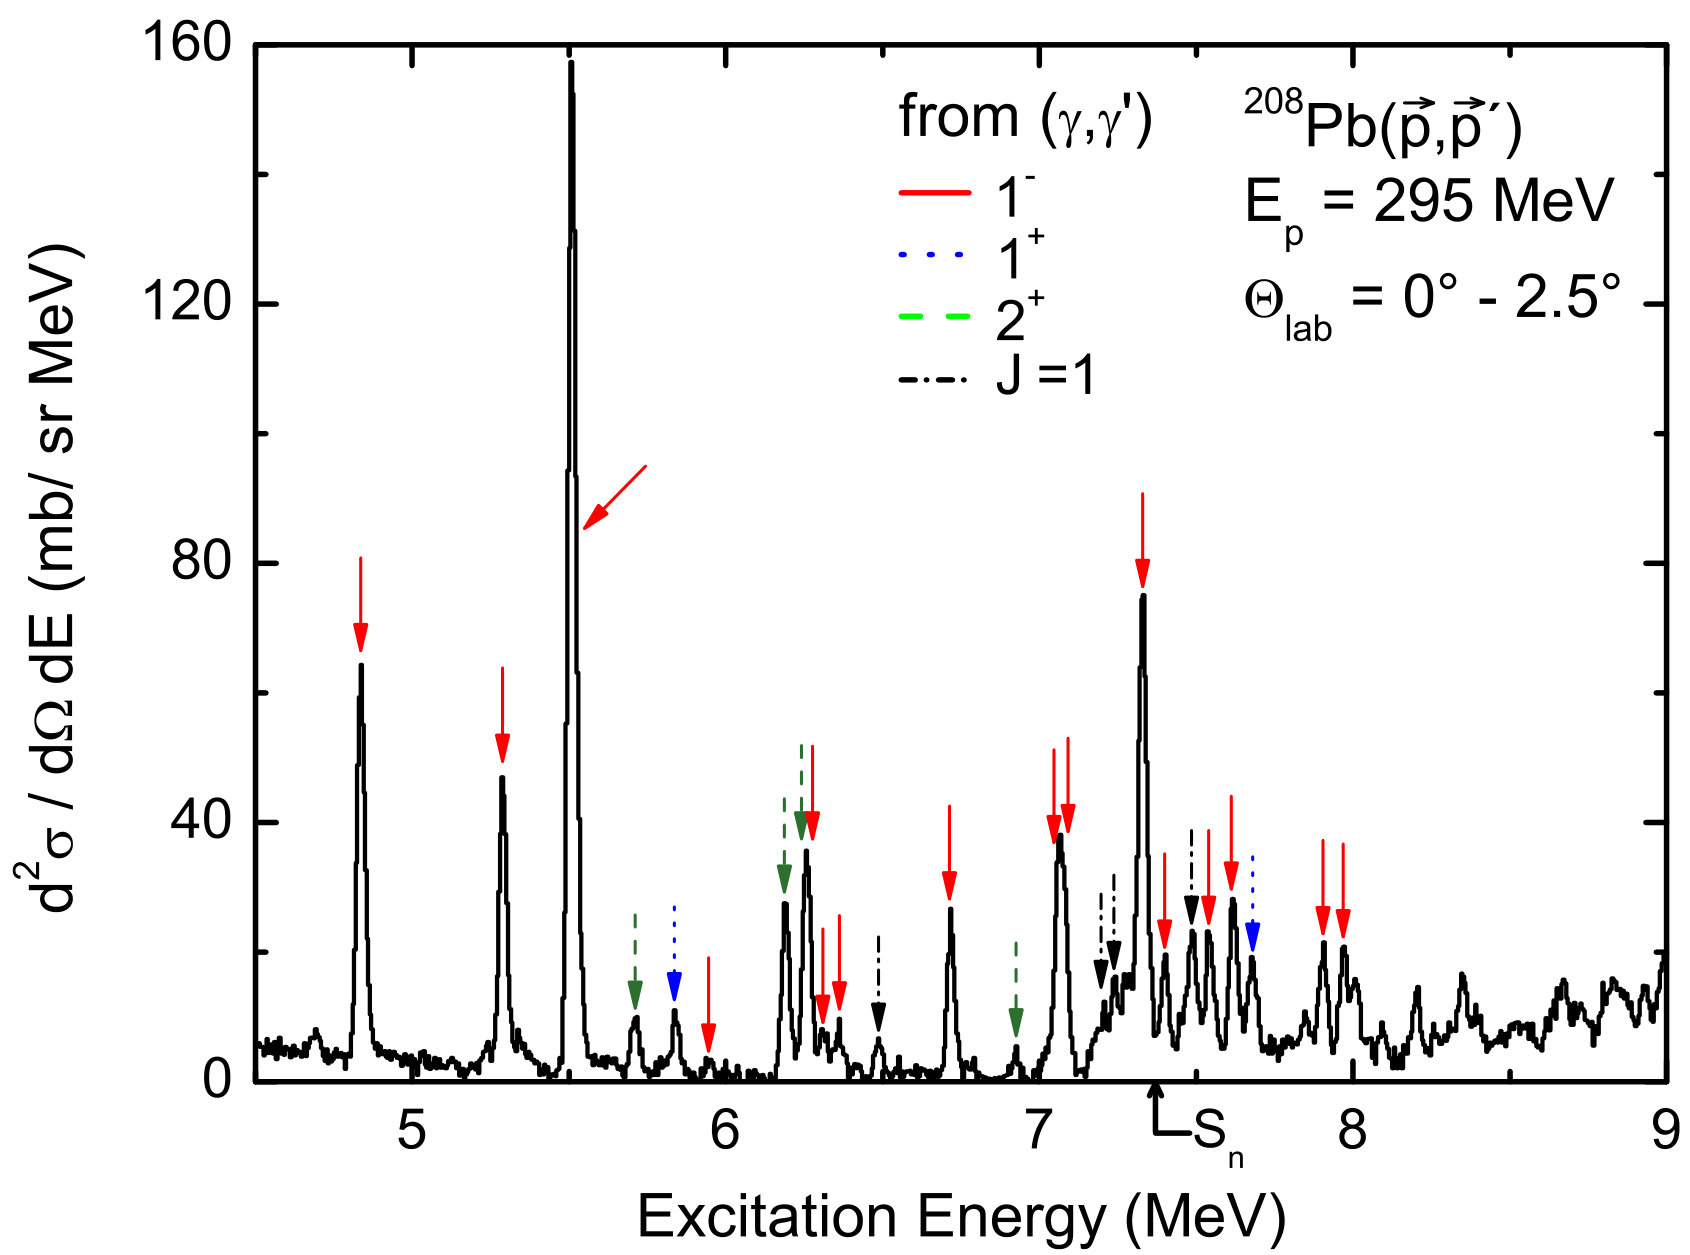 Figure 331
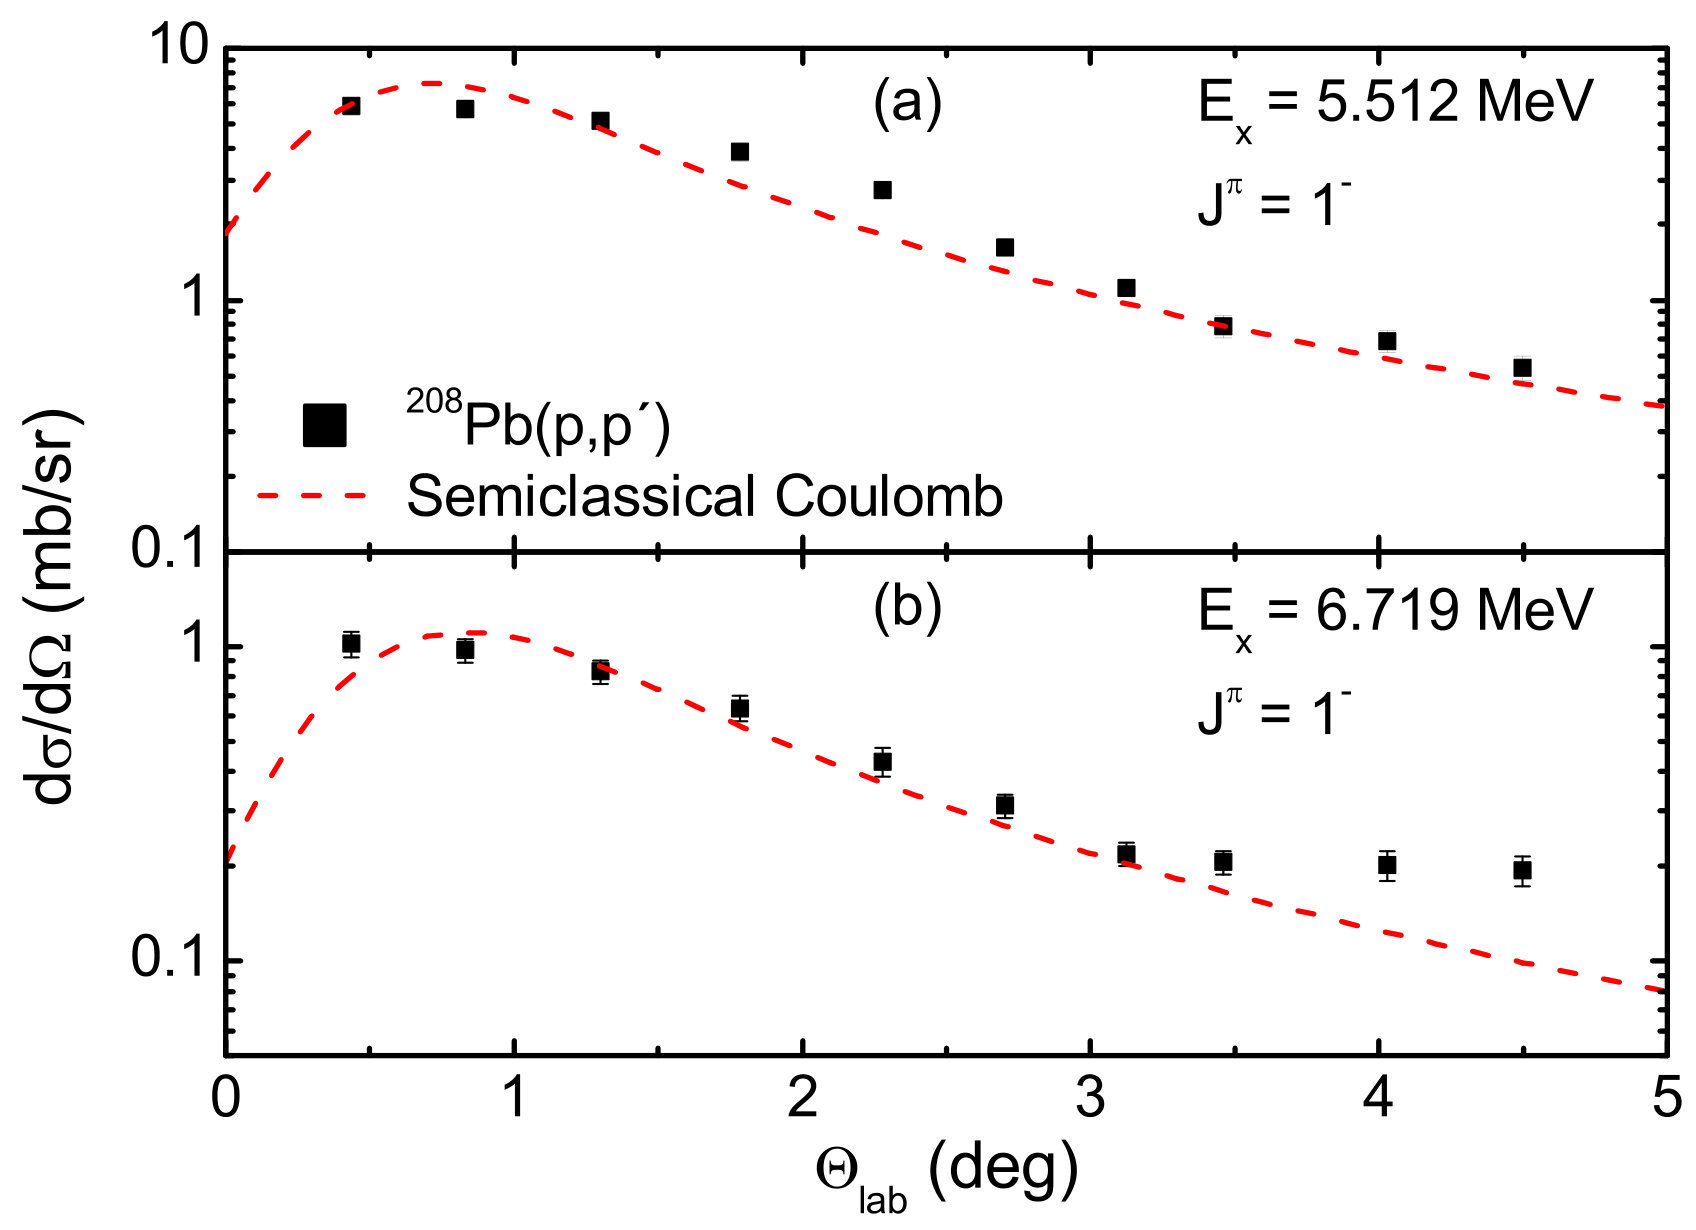 Figure 332
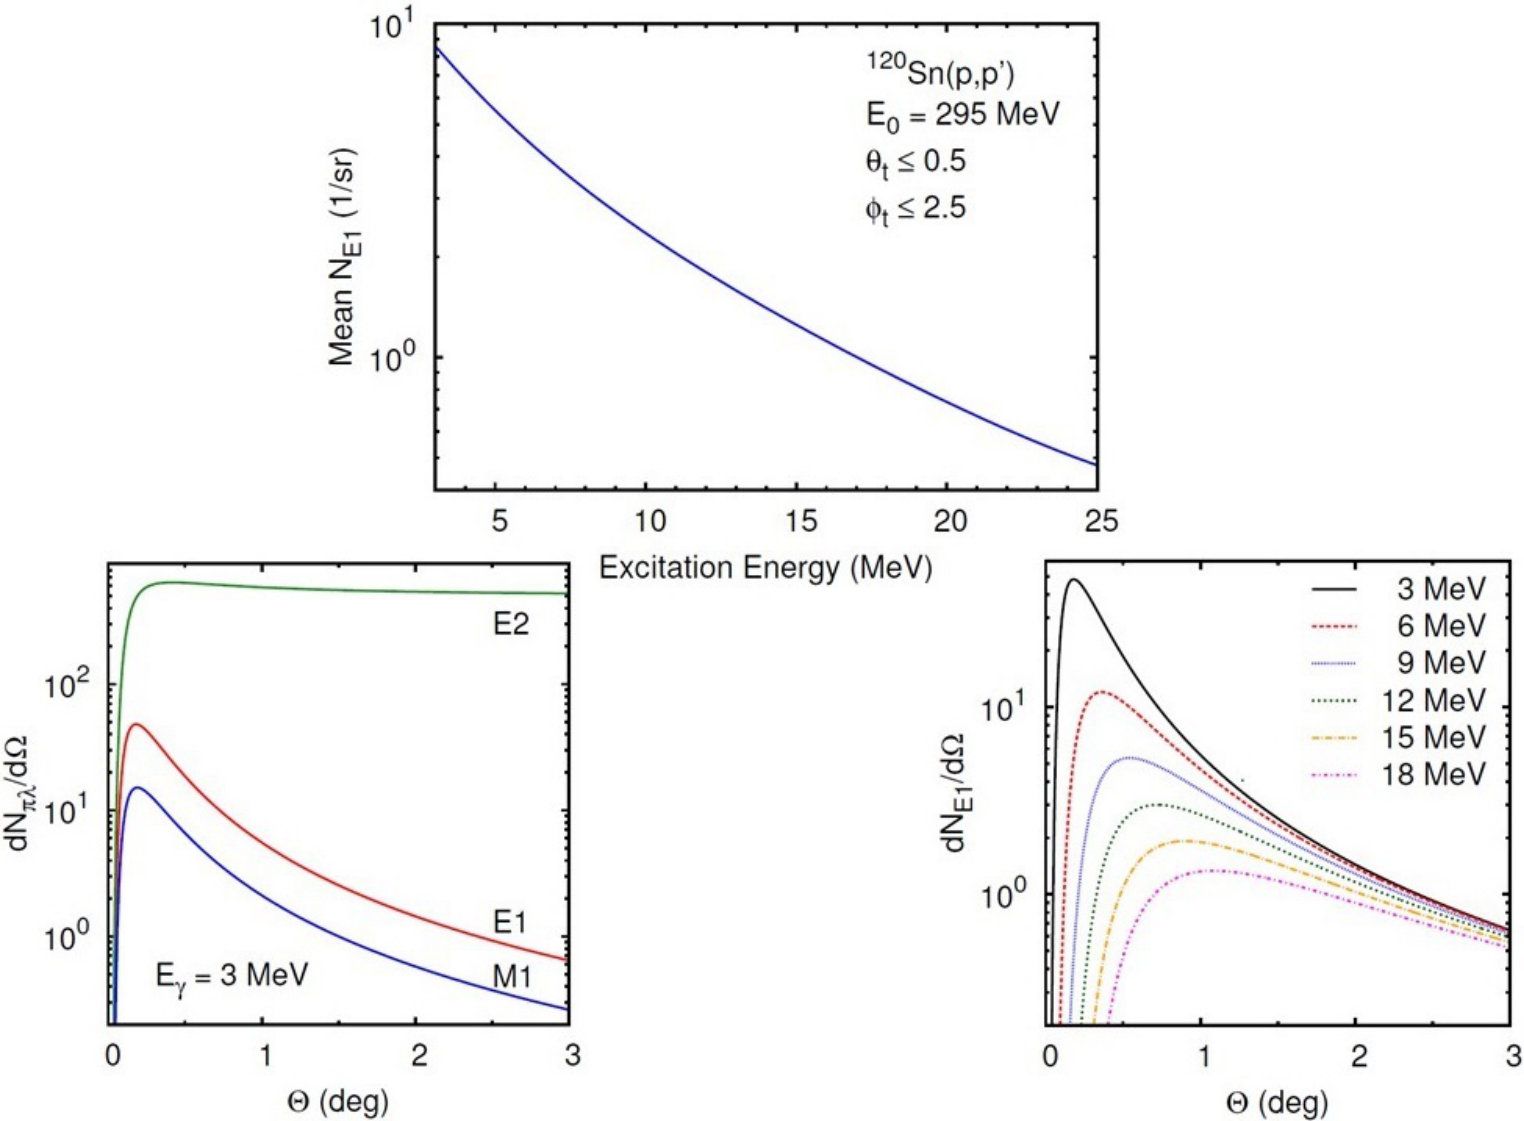 Figure 333
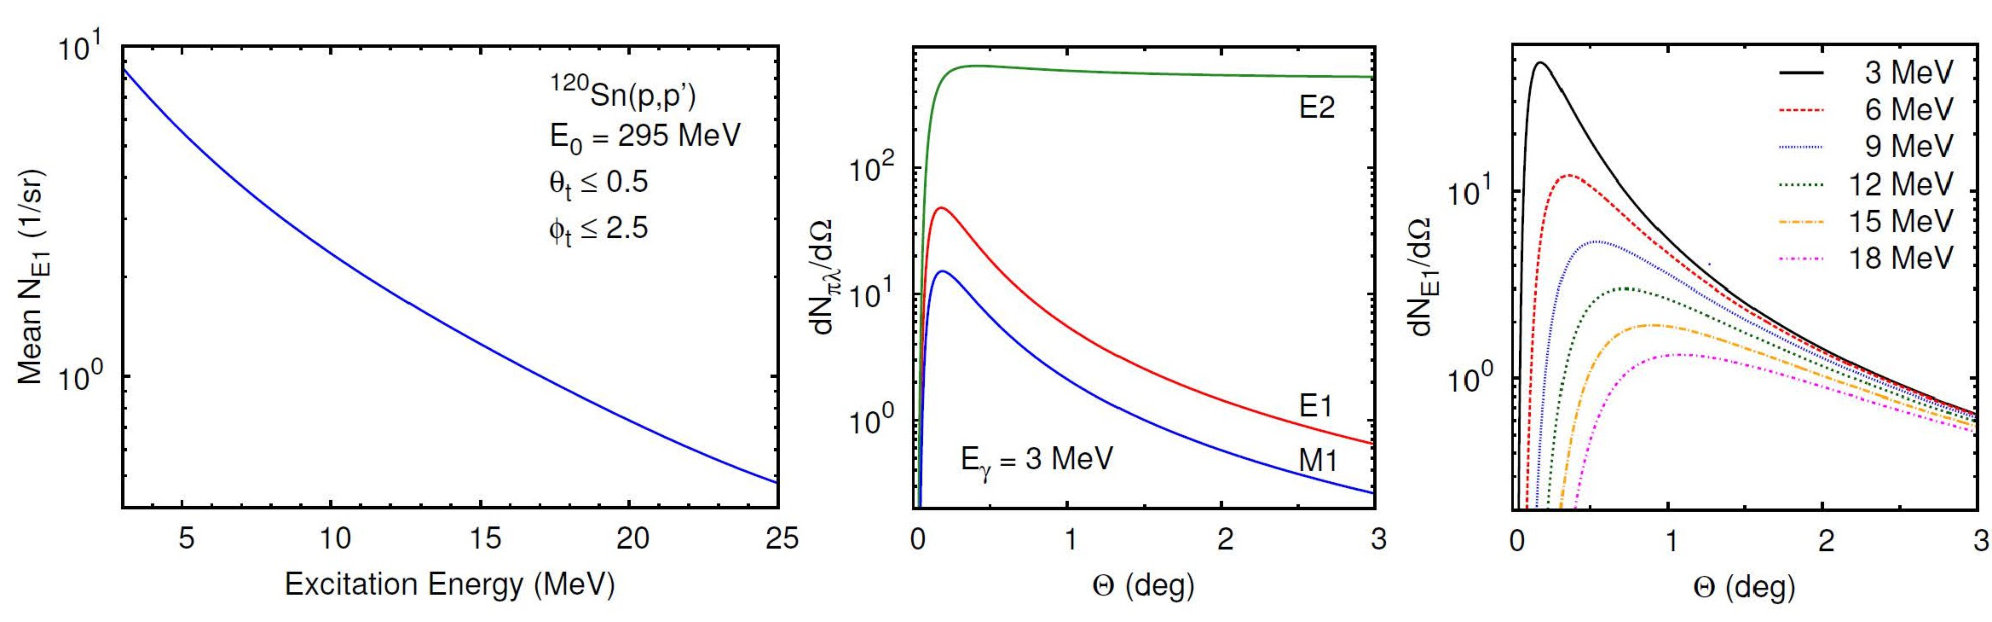 Figure 333
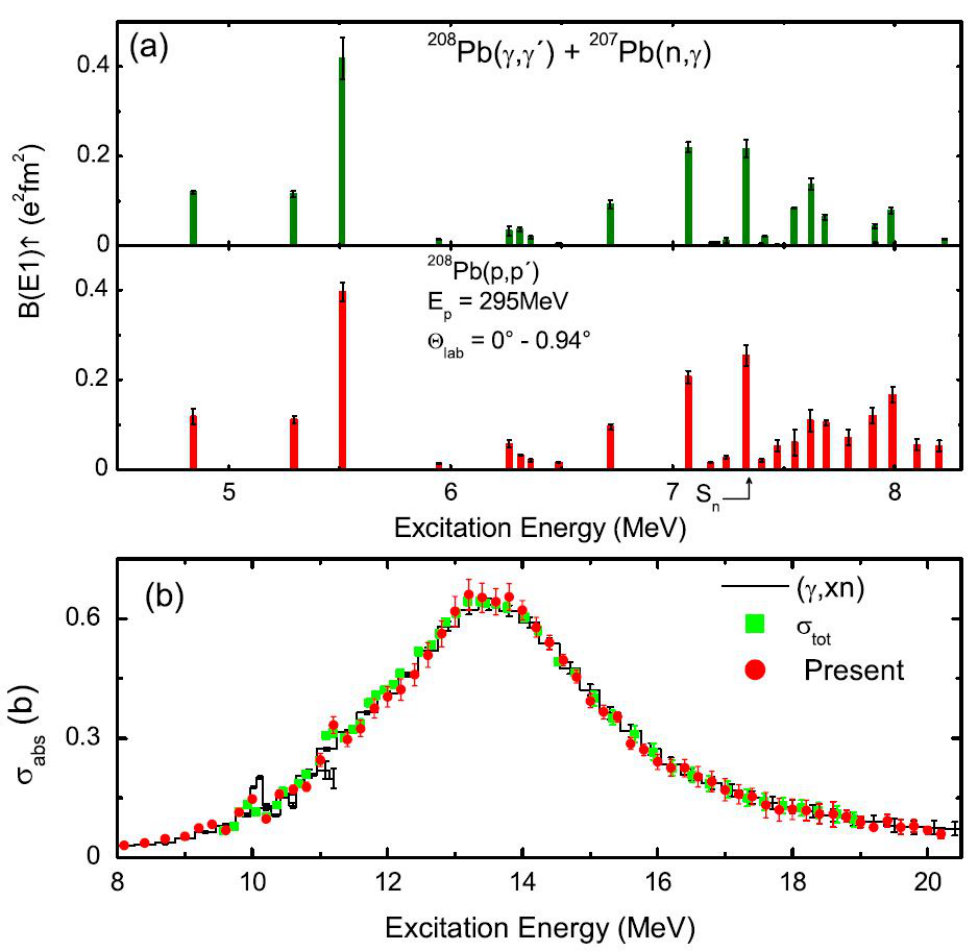 Figure 334
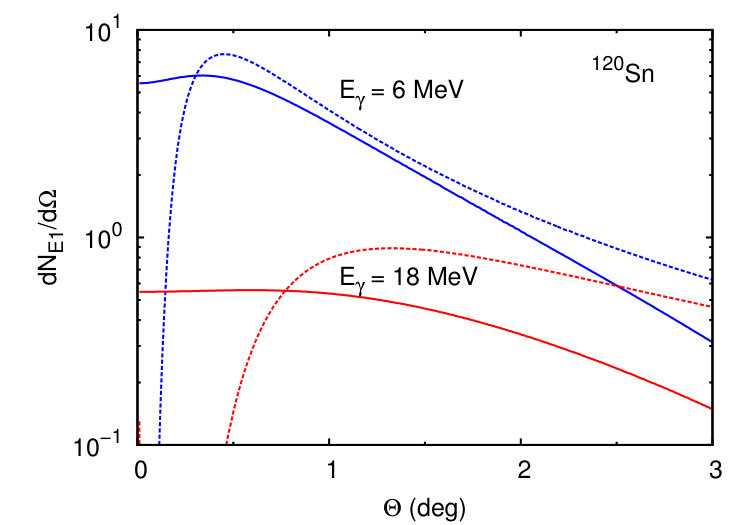 Figure 335
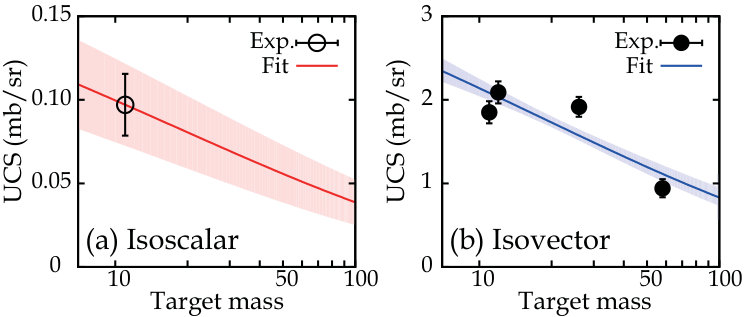 Figure 341
 Figure 342
 Figure 411
 Figure 412
 Figure 413
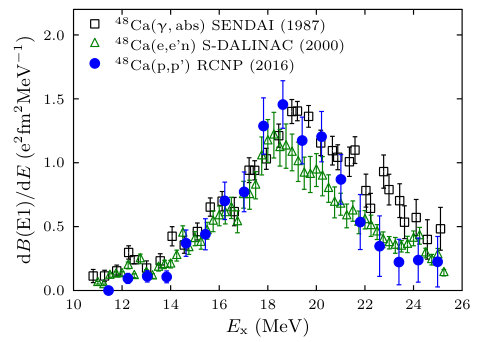 Figure 414
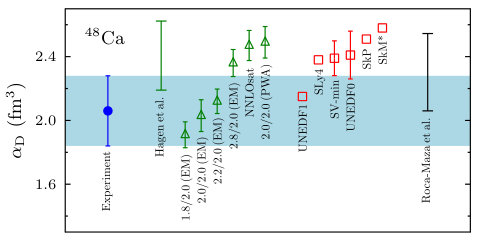 Figure 415
 Figure 421
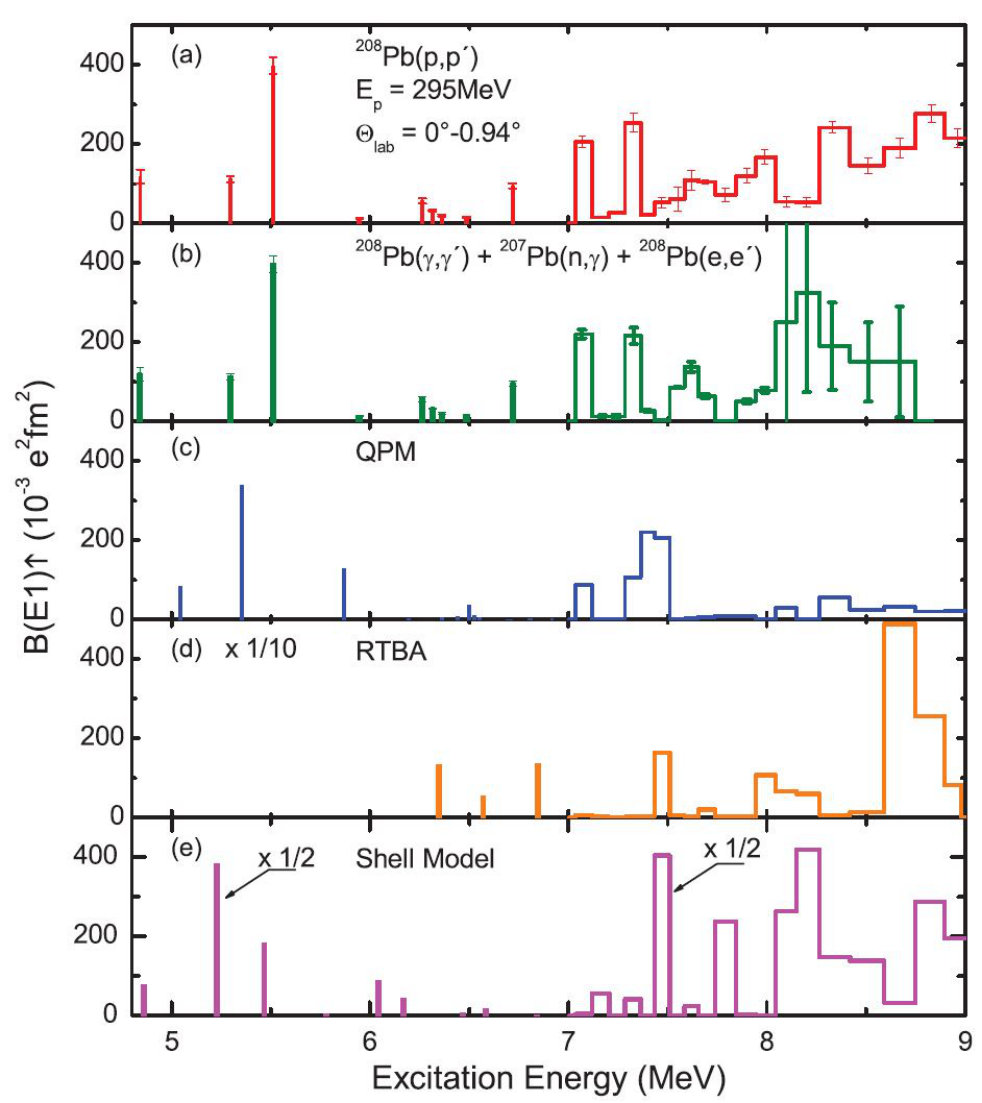 Figure 422
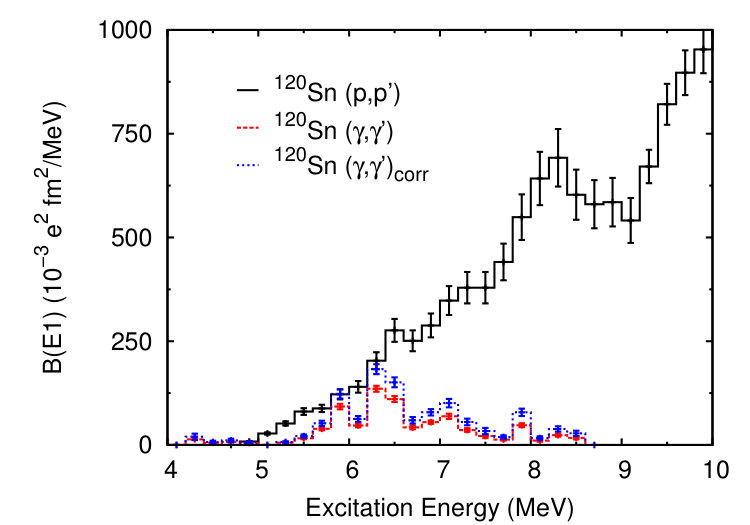 Figure 423
 Figure 431
 Figure 432
 Figure 511
Peer Reviews
No public reviews on file for this paper yet. If you reviewed it on a platform where reviews are public (OpenReview, ICLR, NeurIPS, ICML), you can paste yours below so the community can read it here.
Videos
No videos yet. Explain this paper in a talk, walkthrough, or lecture? Add one.
11institutetext: Institut für Kernphysik, Technische Universität Darmstadt, D-64289 Darmstadt, Germany 22institutetext: Research Center for Nuclear Physics, Osaka University, 10-1 Mihogaoka, Ibaraki 567-0047, Japan
Electric and magnetic dipole modes in high-resolution inelastic proton scattering at
Peter von Neumann-Cosel and Atsushi Tamii 1122
(Received: date / Revised version: date)
Abstract
Inelastic proton scattering under extreme forward angles including and at energies of a few hundred MeV has been established as a new spectroscopic tool for the study of complete dipole strength distributions in nuclei. Such data allow an extraction of the electric dipole polarizability which provides important constraints for parameters of the symmetry energy, which determine the neutron-skin thickness and the equation of state (EOS) of neutron-rich matter. Also, new insight into the much-debated nature of the pygmy dipole resonance (PDR) is obtained. Additionally, the isovector spin-M1 resonance can be studied in heavy nuclei, where only limited experimental information exists so far. Together with much improved results on the isoscalar spin-M1 strength distributions in nuclei, these data shed new light on the phenomenon of quenching of the nuclear spin response. Using dispersion matching techniques, high energy resolution ( full width at half maximum, FWHM) can be achieved in the experiments. In spherical-vibrational nuclei considerable fine structure is observed in the energy region of the isovector giant dipole resonance (IVGDR). A quantitative analysis of the fine structure with wavelet methods provides information on the role of different damping mechanisms contributing to the width of the IVGDR. Furthermore, level densities can be extracted from a fluctuation analysis at excitation energies well above neutron threshold, a region hardly accessible by other means. The combination of the gamma strength function (GSF) extracted from the E1 and M1 strength distributions with the independently derived level density permits novel tests of the Brink-Axel hypothesis underlying all calculations of statistical model reaction cross sections in astrophysical applications in the energy region of the PDR.
pacs:
25.40.EpInelastic proton scattering and 21.10.ReCollective levels and 24.30.CzGiant resonances and 21.60.JzNuclear Density Functional Theory and extensions and 21.60.CsShell model and 21.10.MaLevel density
Contents
-
3.3 Conversion of Coulomb excitation to photoabsorption cross sections
-
4.1 Polarizability, neutron skin and parameters of the symmetry energy
-
6.2 Characteristic scales and giant resonance decay mechanisms
-
7.2 Validity of the Brink-Axel hypothesis in the PDR energy region
1 Introduction
Experimental studies of nuclear reactions with the highest possible energy resolution and selectivity are a driving force of our understanding of nuclear structure. A famous example are nuclear resonance fluorescence experiments, also called reactions, where the energy resolution is achieved by the use of germanium detectors and the selectivity by the dominance of dipole electromagnetic transition matrix elements kne06 . For inelastic scattering or other direct reactions with charged particles (electrons, hadrons), high energy resolution can be achieved using magnetic spectrometers combined with a dispersion matching of the beam. At sufficiently high velocities (corresponding to energies 100 MeV/nucleon for ions), the measured inelastic scattering cross sections are approximately proportional to the transition matrix elements. Selectivity to the transferred angular momentum can be achieved by varying the scattering angle (i.e., the momentum transfer). For a target with ground state (g.s.) spin and parity this determines the spin and often also the parity of the excited states.
In general, (p,p′) scattering is not a very selective reaction because natural and unnatural-parity states are excited with comparable probability. However, when going to very small angles (i.e., low momentum transfers), a strong selectivity towards dipole excitations is observed. One the one hand,due to the strong spin-isospin part of the effective proton-nucleus interactions at small momentum transfers lov81 transitions with angular momentum transfer and spin transfer are favored populating states in targets with a ground state. The excited states form the spin-flip M1 resonance representing the isospin analog of the Gamow-Teller (GT) resonances fuj11 . On the other hand, Coulomb-excitation cross sections become very large at relativistic particle velocities and actually dominate the (p,p′) response for scattering angles near , making it an excellent probe to study the E1 strength distribution in nuclei. The present review discusses recent progress in using the reaction as a spectroscopic tool for electric and magnetic dipole strength in nuclei by realizing experiments with energy resolutions at extreme forward angles including .
Such experiments present a challenge due to the very small magnetic rigidity difference between the incident and scattered particles. Consequently, they are known to be extremely sensitive to beam halo and background from atomic small-angle scattering in the target since the primary beam exits the spectrometer very close to the position of the focal-plane detectors. Historically, the technical development of (p,p′) measurements under 0∘ at energies of MeV was performed in the 1980s at the Los Alamos National Laboratory mcc84 ; mcc85 and at the Indiana University Cyclotron (IUCF) IUCF , but the background still limited applications to light and medium-mass nuclei. However, at the Research Center for Nuclear Physics (RCNP) tam09 and later at the iThemba Laboratory for Accelerator Based Sciences (iThemba LABS) near Cape Town, South Africa nev11 , the method has been developed to a level allowing for essentially background-free measurements up to the heaviest stable nuclei. While the research programs at these facilities are ongoing and also involve other topics like the study of isoscalar giant resonances with scattering gar18 , investigation of the GT strength with charge-exchange reactions fuj11 ; fre18 , astrophysically relevant transitions lon18 ; ads17 or giant pairing vibrations mou11 , we focus here on the (p,p′) experiments providing novel information on the E1 and spin-M1 resonances, thereby contributing to a variety of nuclear structure problems of current interest.
Low-energy electric dipole strength in neutron-rich nuclei, commonly termed PDR, is currently a topic of great interest sav13 . It occurs at energies well below the isovector giant dipole resonance (IVGDR) and exhausts a considerable fraction (up to about 10%) of the total E1 strength in nuclei with a large neutron-to-proton ratio adr05 ; kli07 ; wie09 ; ros13 . The properties of the mode are claimed to provide insight into the formation of a neutron skin kli07 ; pie06 ; tso08 ; pie11 ; ina11 and the density dependence of the symmetry energy kli07 ; car10 ; fat12 ; tsa12 , although this is questioned rei10 ; rei13 ; rei14 . Furthermore, dipole strength in the vicinity of the neutron threshold may lead to significant changes of neutron-capture rates in the astrophysical -process gor04 ; lit09 ; dao12 .
A successful description of collective phenomena in nuclei can be achieved by the mean-field approach. The respective models can be understood as an approximate realization of a nuclear energy density functional (EDF) ben03 . Many of the models favor an explanation of the PDR as an oscillation of a neutron skin - emerging with an increasing ratio - against an approximately isospin-saturated core. This conclusion is based on the analysis of theoretical transition densities which differ significantly from those in the IVGDR region paa07 . However, at least for stable nuclei with a moderate neutron excess this question is far from being settled, see, e.g., ref. pap14 . Quantitative predictions of the centroid energy and strength of the PDR as well as the corresponding collectivity as a function of neutron excess differ considerably. This is due partly to the properties of the underlying mean-field description (e.g., non-relativistic Skyrme, Gogny or relativistic interactions) but also partly results from the difficulty to separate experimentally strength belonging either to the PDR or the IVGDR. E1 strength distributions at low excitation energies are also strongly modified when complex configurations beyond the 1 particle - 1 hole (1p1h) level are included in the models (see, e.g., refs. rye02 ; ton10 ; lit10 ).
Because of their neutron character one expects excitation of the states forming the PDR when using both isoscalar (IS) and isovector (IV) probes. The IS response has been investigated with sav13 ; pol92 ; sav06 ; end10 and heavy-ion bra15 scattering. Most data on the IV response stem from experiments (see, e.g., refs. sav13 ; bra19 and references therein) selective towards ground-state (g.s.) transitions. Possible branching ratios to excited states, which usually cannot be measured because of the large background, are often neglected, but statistical model calculations of the branching ratios suggest potentially large corrections of the deduced E1 strength rus08 . Recent work using self-absorption techniques rom15 and coincidence experiments loe16 ; isa19 suggest that the decay of the PDR is non-statistical but the corrections for decay to excited states are sizable. Here, the (p,p′) experiments provide an important benchmark because the experimental cross sections measure the total absorption independent of the branching ratios.
The nuclear EOS describing the energy of nuclear matter as function of its density has wide impact on nuclear physics and astrophysics lat12 ; heb15 as well as physics beyond the standard model wen09 ; pol99 . The EOS of symmetric nuclear matter with equal proton and neutron densities is well constrained from the ground state properties of finite nuclei, especially in the region of saturation density fm*-3* dan02 . However, the description of astrophysical systems as, e.g., neutron stars requires knowledge of the EOS for asymmetric matter Sto06 ; lat04 ; lat14 ; heb10 which is related to the leading isovector parameters of nuclear matter, viz. the symmetry energy (called ) and its derivative with respect to density (called or ) mol95ra . For recent overviews of experimental and theoretical studies of the symmetry energy see, e.g., refs. roc18 ; epj50 . The observation of gravitational waves from merging neutron stars abb17 provided a wealth of new experimental constraints on the EOS of neutron-rich matter at high density fat18 ; mos18 , which calls for an improved description at low densities from nuclear properties. However, in spite of steady extension of knowledge on exotic nuclei, these isovector properties are poorly determined by fits to experimental ground-state data because the valley of nuclear stability is still extremely narrow along isotopic chains klu09 ; erl13 ; naz14 . Thus, one needs observables in finite nuclei specifically sensitive to isovector properties to better confine and . There are two such observables, the neutron skin thickness in nuclei with large neutron excess and the (static) dipole polarizability .
The dipole polarizability is related to the second inverse moment of the photoabsorption cross section boh81 . Thus, its determination requires knowledge of the complete E1 strength distribution. Although the low-energy strength (the PDR) exhausts a small fraction of the E1 strength only, it becomes important for because of the inverse energy weighting. Most experimental information stems from the reaction below neutron threshold and from (,xn) studies ber75 above neutron threshold. In the light of the above discussed problems to extract the full E1 strength from NRF data, results from the (p,p′) reaction provide an important alternative method where the E1 strength in the resonance region is consistently extracted below and above threshold.
The isovector spin-flip M1 (IVSM1) resonance is a fundamental excitation mode of nuclei hey10 . Its properties impact on diverse fields like the description of neutral-current neutrino interactions in supernovae lan04 ; lan08 , strength functions utilized for physics of reactor design cha11 or for modeling of reaction cross sections in large-scale nucleosynthesis network calculations loe12 , and the evolution of single-particle properties leading to new shell closures in neutron-rich nuclei ots05 ; ots10 . It also contributes to the long-standing problem of quenching of the spin-isospin response in nuclei ost92 , whose understanding is, e.g., a prerequisite for reliable calculations of nuclear matrix elements needed to determine absolute neutrino masses from a positive neutrinoless double- decay experiment ver12 . GT and IV spin-M1 resonances involve transitions between spin-orbit partners and the properties of single-particle states near the Fermi surface confine the strength to a certain energy region. Quenching is then defined as the observation of a reduction of the experimental strength with respect to microscopic model predictions. A systematic reduction of the GT strengths by a factor of two is observed for medium-mass and heavy nuclei ich06 .
The strength distributions of the IVSM1 resonance in light and medium-mass (-shell) nuclei have been studied extensively using (p,p′) scattering and electromagnetic probes like electron scattering and NRF. Systematic comparison in self-conjugate -shell nuclei showed clear differences of GT and IVSM1 quenching factors with respect to shell-model calculations attributed to the different role of meson-exchange currents ric90 ; lue96 ; vnc97 ; hof02 . In medium-mass nuclei at the shell closure, a quenching of the IVSM1 resonance by a factor of two comparable to the GT strength in decay mar96 was found vnc98 . However, information on the IVSM1 in heavy nuclei is limited to a few magic nuclei studied with photon scattering ton10 ; las86 ; las87 ; las88 ; ala89 ; rus13 , and it is questionable whether the full strength has been observed, since the method is limited to the energy region below neutron threshold.
Pioneering forward-angle (p,p′) experiments observed bumps identified as IVSM1 resonance in heavy nuclei dja82 ; fre90 . However, the classical method of extraction of the matrix elements depends on model wave functions of the initial and final states and on the description of the projectile-target interaction, leading to large systematic uncertainties. The new (p,p′) results from the facilities put the extraction of the M1 cross sections on a safer ground. Furthermore, a new method to extract the transition strengths with the so-called ‘unit cross section’ method in analogy to charge-exchange reactions tad87 ; zeg07 was developed bir16 , which provides improved results with important consequences for the quenching problem.
The results discussed here also contribute to the problem of a possible quenching of the isoscalar spin-M1 strength, which is theoretically predicted to be of comparable size bro87 ; tow87 ; ari87 . Because of the dominance of the IV over the IS spin part of the effective proton-nucleus interaction lov81 , the latter contribution is hard to extract from (p,p′) cross sections. The only clean cases are self-conjugate nuclei with g.s. isospin , where the isospin selection rules demand either or for the final states corresponding to pure IS and IV transitions, respectively. Studies of nuclei in the -shell reported conflicting results ana84 ; cra89 . The new experiments allow for a much improved identification of IS M1 transitions and a systematic study of all nuclei in the shell provides new and unexpected insight into the quenching of spin strength.
The information on the E1 and spin-M1 strength distributions from the (p,p′) data also allows to extract the gamma strength function (GSF) bar72 . The GSF describes the average decay behavior of a nucleus. Its knowledge is required for applications of statistical nuclear theory in astrophysics arn07 , reactor design cha11 , and waste transmutation sal11 . The impact of the GSF near threshold on astrophysical reaction rates and the resulting abundances in the process have been discussed, e.g., in refs. gor04 ; lit09 ; dao12 . Although all electromagnetic multipoles contribute, the GSF is dominated by the E1 radiation with smaller contributions from M1 strength. Above particle threshold it is governed by the IVGDR but at lower excitation energies the situation is complex. In nuclei with neutron excess one observes the PDR sav13 sitting on the low-energy tail of the IVGDR. Furthermore, the spinflip M1 resonance overlaps with the energy region of the PDR hey10
Most applications imply an environment of finite temperature, notably in stellar scenarios wie12 , and thus reactions on initially excited states become relevant. Their contributions to the reaction rates are usually estimated applying the generalized Brink-Axel (BA) hypothesis bri55 ; axe62 , which states that the GSF is independent of the properties of the initial and final states and thus should be the same in emission and absorption experiments. Although historically formulated for the IVGDR, where it seems to hold approximately for not too high temperatures bbb98 , this is nowadays a commonly used assumption to calculate the low-energy E1 and M1 strength functions at finite temperature. Recent theoretical studies joh15 ; hun17 put that into question demonstrating that the strength functions of collective modes built on excited states do show an energy dependence. However, the majority of data used to construct the GSF below particle thresholds stem from NRF experiments with the aforementioned problems to extract the full E1 strength. The (p,p′) results discussed in this review simultaneously provide information on the E1 and M1 strengths and thus the full GSF can be constructed bas16 . Comparison with GSF data extracted from the compound nucleus decay in the same nuclides with the so-called Oslo method (see, e.g., ref. lar17 and references therein) allows novel tests of the BA hypothesis mar17 .
Finally, the excellent energy resolution of keV (FWHM) achieved in these experiments unveils the phenomenon of fine structure of the IVGDR. Indeed, fine structure of giant resonances has been shown to appear globally for electric and magnetic resonances across the nuclear chart vnc19a . There are two types of information which can be extracted from the fine structure. Firstly, several methods have been developed aiming at a quantification of characteristic features of the fine structure aib99 ; aib11 ; lac99 ; lac00 ; she08 ; hei10 , of which wavelet analysis was shown to be particularly promising she08 . By comparison with EDF calculations one is able to single out the relative importance of competing mechanisms bbb98 contributing to the total width of a giant resonance. The present high-resolution data on the IVGDR offer the possibility of a systematic comparison with previous studies of the isoscalar giant quadrupole resonance (ISGQR) she04 ; she09 ; usm11 . Secondly, the magnitude of the observed cross section fluctuations depends on the level density (LD) and it is possible to extract them with a fluctuation analysis han90 in cases where a single type of excitation dominates the spectra. The LDs extracted with this technique are quite unique in several ways: (i) In even-even nuclei they possess a given spin and parity ( in the case of the IVGDR). (ii) They are extracted directly from the data and do not depend on the indirect comparison of measured cross sections with statistical model calculations. (iii) The excitation-energy region is typically well above the neutron threshold, where hardly any LD data exist. Such data contribute to a variety of open questions like a systematic description of the spin distribution alh15 or a possible parity dependence kal07 in certain shell regions. Combined with the GSF results they also provide an independent test of basic assumptions underlying the Oslo method, where only the product of GSF and LD can be determined and additional assumptions are needed for a decomposition sch00 .
The paper is organized as follows. Section 2 provides information on the experimental techniques including a description of setups at RCNP (2.2) and iThemba LABS (2.3) and the data extraction. Representative examples of the experimental observables are discussed in sec. 2.6. Section 3 summarizes the methods used to extract E1 and M1 cross sections and their conversion to strength distributions. The contributions of the present work to our current understanding of the E1 response in nuclei are presented in sec. 4. These include measurements of the dipole polarizability as a measure of the neutron-skin thickness and symmetry-energy parameters (4.1), new information on the PDR (4.2) and new data on the evolution of the IVGDR with deformation (4.3). New results on the spin-M1 resonance and the quenching of the spin response in nuclei are discussed in sec. 5. The fine structure analysis with wavelet techniques is presented in sec. 6.1 and the relation of the resulting characteristic scales to different decay mechanisms of the IVGDR in sec. 6.2. Section 6.3 describes the level density analysis. Finally, the GSFs deduced from the data and their relevance for tests of the Brink-Axel hypothesis are discussed in sec. 7. A summary and an outlook on future work is given in the concluding sec. 8.
2 Experimental techniques
After a brief history of the technical development on the proton scattering measurement at zero degrees, we focus on the general features of the two representative facilities, RCNP and iThemba LABS, and the differences between them. Further detailed technical information can be found in ref. tam09 for the RCNP and in ref. nev11 for the iThemba LABS setup. We also describe the polarization-transfer analysis at RCNP not discussed in ref. tam09 .
2.1 A brief history of proton scattering experiments
Realization of measurement at zero degrees and very forward angles is essential for the study of the and spin- excitations in nuclei with the (p,p′) reaction, since they have the maximum cross section at due to the dominance of Coulomb excitation for transitions and the angular momentum transfer of nuclear excitation of spin- transitions. Technical developments to realize proton inelastic scattering measurement at zero degrees was attempted at Los Alamos National Laboratory mcc84 ; mcc85 and at IUCF, Indiana University IUCF ; berg93 ; mer94 . Physics results were reported from RCNP for differential cross sections sak95 , and for extension to polarization-transfer data tam99 ; kaw02 , followed by the measurement applying dispersion matching for higher energy resolution at IUCF fuj07 . Further developments were achieved at RCNP on dispersion matching, better angular resolution, background subtraction, and polarization-transfer analysis tam09 . A technical development along the same line has been realized at iThemba LABS nev11 . Gamma-coincidence measurements at represent the most recent progress at both RCNP ree19 ; cagra ; scylla and iThemba LABS bagel ; alba .
2.2 Experimental setup at RCNP
2.2.1 Accelerators and beam line
An overview of the cyclotron facility at RCNP is shown in Fig. 1. So far, experimental programs using the zero-degree setup have been performed at proton energies of 295 MeV and 392 MeV. A polarized or unpolarized proton beam at 54 (64) MeV from the injector Azimuthally Varying Field (AVF) cyclotron is accelerated to 295 (392) MeV by the RING cyclotron. The beam is transported through the West South (WS) beam line wak02 to the scattering chamber of the high-resolution spectrometer Grand Raiden fuj99 .
Acceleration of a stable, low-emittance and halo-free beam by the cyclotrons is essential for the realization of the zero-degree proton scattering measurement. Single-turn extraction of the beam from the AVF cyclotron is not fully applicable tam09 . A horizontal slit (SH5) at a dispersive focus point in the beam line after the AVF cyclotron is used to improve the selection of a single turn and to define further the beam energy spread. Other slits in the beam line between the two cyclotrons are used to cut the remaining beam halos depending on the beam profile. Single-turn extraction of the RING cyclotron is fully established. The transmission efficiency of the beam in the RING cyclotron is %. No collimator is used after the acceleration by the RING cyclotron to prevent the production of beam halo by slit-edge scattering. The beam axis is carefully adjusted to the center of the beam line without any beam loss. The beam energy spread at 295 MeV is typically 60 keV.
The beam spot size at BV-EXT3 – the object point of the WS beam line – is minimized to less than 1 mm (typically mm) for achieving the best resolution by applying dispersion matching fuj97 between the WS beam line and Grand Raiden. A faint beam method fuj02 is applied to optimize the matching condition. The typical resolution after the dispersion matching is keV (FWHM) at 295 MeV.
When a polarized proton beam is accelerated, the polarization axis is fully controlled by the two superconducting solenoids, SOL1 and SOL2 placed in between the two cyclotrons. It is aligned in vertical direction for injection into the RING cyclotron. The absolute polarization and the polarization axis after the acceleration by the RING cyclotron are monitored by two beam-line polarimeters, BLP1 and BLP2, located in the WS beam line. The BLPs measure proton scattering from a thin polyethylene (CH2) foil by detecting two protons in coincidence using four pairs of plastic scintillators. The BLPs are also used to monitor the beam current.
2.2.2 Spectrometer
The spectrometer Grand Raiden in the configuration for the zero-degree transmission mode is shown in Fig. 2. A proton beam bombards the target foil placed in the scattering chamber. Since the spectrometer is placed at to cover the inelastically scattered particles in this direction, the primary beam also enters the spectrometer. Separation of the scattered protons from the unscattered beam is only possible after the bending magnets.
The scattered protons are measured by the focal-plane detectors and the focal-plane polarimeter (FPP, see Fig. 3). The focal plane detectors consist of two multi-wire drift chambers of vertical drift type (VDC1 and VDC2) for tracking of the scattered protons, and a plastic scintillator (PS1) with a thickness of 3 mm. The wire chambers are horizontally displaced from the standard central position to allow for a beam duct to be placed through the holes of the wire chambers. The distance between the beam center and the sensitive area of the wire chambers is fixed to 200 mm. Accordingly, the excitation energy acceptance of GR at is fixed to MeV and MeV at proton beam energies of 295 and 392 MeV, respectively. The FPP consists of a plastic scintillator (PS2) with a thickness of 3 mm, two multiwire proportional chambers (MWPC3 and 4), and a plastic scintillator hodoscope (HS-X). The trigger for the data acquisition is produced by a coincidence of the PS1 and PS2 signals. MWPC3 and 4 also have holes for the beam duct. In the case of an unpolarized beam, PS1 is replaced by two plastic scintillators with a thickness of 10 mm to measure the energy loss and to produce trigger signals by their coincidence.
The beam is focused by a quadrupole doublet after passing through the FPP and is stopped in a Faraday cup (FC) mounted in the beam dump. A small steering magnet, electron sweeper (ES), is placed before the FC to remove upstream electrons. The FC is equipped with permanent magnets to avoid the loss of electrons produced by the beam hit. The FC is placed 12 m downstream of the focal plane and is shielded by 1 m thick concrete on the sides and 40 cm thick iron blocks on the top. The shielding reduces the radiation from the beam stopper to a level which allows the coincidence measurement of gamma-rays from the target, as discussed in sec. 8. The charge collection of the FC is 97% at maximum. The number decreases depending on the target and the beam conditions. Thus, the total beam charge is more accurately monitored by measuring the event rate of the BLPs, which is proportional to the beam current. The proportionality coefficient is calibrated for each experiment by using a beam stopper in the scattering chamber. The BLP targets are inserted into the beam line periodically, typically 10 out of every 100 seconds. During beam transportation, the beam profiles are monitored by using three luminescence viewers, BV1, 2 and 3.
Typical beam intensities at are nA, the average beam polarization amounts to 70%, and typical target thicknesses are mg/cm2. The Grand Raiden acceptance is and for the horizontal (dispersive) and vertical (non-dispersive) directions, respectively. Measurements at finite angles are performed by placing the spectrometer, e.g., at or stopping the beam at the Q1-FC (cf. fig. 2). A part of the beam duct between the final quadrupole doublet and the zero-degree beam dump needs to be removed for changing the spectrometer angle. The Q1-FC is horizontally movable for optimizing the position to stop the beam deflected from the central orbit of the spectrometer by the first quadrupole. For spectrometer angles larger than , the beam is stopped in a Faraday cup placed in the scattering chamber. With these settings, angular distributions of the (p,p cross sections can be measured continuously from to a maximum angle of .
The large acceptance spectrometer (LAS) also shown in fig. 2 is used to monitor the vertical position of the beam spot by measuring protons from the target produced by quasi-free scattering. This monitoring is important for the operation of a mild off-focus mode of the spectrometer for the realization of sufficient vertical scattering angle resolution.
2.2.3 Data-acquisition system
The data-acquisition system was developed at RCNP tam96 and has been gradually updated. The charge and the timing of the signals from each photomultiplier of the trigger plastic scintillators and HS-X are digitized by using the LeCroy FERA system. The digitized data are transferred to LeCroy 1190 dual port memory modules in a VME crate. The signals from the VDCs are pre-amplified and discriminated by REPIC RPA 220 cards. Their timing information is digitized by CAEN V1190A multi-hit TDCs placed in another VME crate and recorded in their memory buffer. The hit-pattern of the MWPCs is encoded by LeCroy PCOS-III system and recorded in the LeCroy 1190 memory modules placed in the former VME crate.
The data from the two VME crates as well as the data of the LAS spectrometer are transferred in parallel to the server computer via ethernet and stored on hard disks. On-line event building and data analysis are performed on the server computer. The data acquisition is operated in a multi-event buffering mode without dead time of the software. Typical dead times of the hardware are 30 sec for each event.
2.3 Experimental setup at iThemba LABS
2.3.1 Accelerators and beam line
An overview of the cyclotron facility at iThemba LABS is shown in Fig. 4. A proton beam is accelerated by the Solid Pole injector Cyclotron (SPC2) and by the Separated-Sector Cyclotron (SSC) up to 200 MeV. In this review we only discuss the case of a proton beam at 200 MeV. Single-turn extraction from the two cyclotrons is fully realized. The transmission efficiency of the SSC is 50-60%. This relatively low transmission efficiency may cause a larger beam emittance and a beam halo. Thus, the beam is shaped by a collimator system after the acceleration by the SSC. This is one of the main differences from the operation at RCNP. The horizontal (vertical) slits 9X define the size of the beam at the object point to 1 (2) mm. A 1 mm lip is added to the 63 mm thick slits for minimizing the background caused by slit-edge scattering. The beam divergence is reduced to less than 1.7 mrad by the horizontal and vertical slits 12X. The energy spread of the beam is limited to 80 keV by slit 1P. Further slits, 3P, 10P and 2S, in the beam line are positioned close to the double-focus points and are used to clean up the halo part of the beam. As a result, 8% of the beam from the SSC reaches the target.
2.3.2 Spectrometer
The K600 spectrometer in the zero-degree setup is shown in Fig. 5. Out of the three available focal planes (high, medium, low dispersion), the high dispersive focal-plane is used for the zero-degree mode ta achieve a good separation of the beam and the scattered protons at the focal plane as well as for a good energy resolution. A high dispersion mode with a dispersion of 10.9 m was developed for this purpose. The beam is stopped in the FC embedded in the concrete wall of the experimental area. A luminescence viewer in front of the beam stop is used for optimizing the beam transportation through the beam line.
Two VDCs are placed at the focal plane for tracking the scattered protons. The distance from the beam to the sensing region of the VDCs is 10 cm. The covered excitation energy range for a 200 MeV proton beam is MeV. The position resolution of the VDCs in the dispersive direction is 0.35 mm (FWHM). Two plastic scintillators with thicknesses of 12.7 and 6.35 mm, respectively, are placed behind the VDCs for generating trigger signals and measuring the energy loss for particle identification. The time-of-flight information is effective to remove the background particles originating from the beam-halo produced upstream of the target.
The shape of the collimator at the entrance of the spectrometer is optimized to achieve the lowest instrumental background condition. In contrast to the situation at RCNP, the background increases when no collimator is installed. The collimator has 49 mm diameter with an 11 mm thick brass lip, tapered to the angular acceptance. The corresponding vertical and horizontal angular acceptance is compared to the full acceptance of .
Typical target thicknesses are 1-2 mg/cm2. The low-momentum side of the target frame is removed for minimizing background from particle scattering from the frame. The dispersion-matching condition between the beam line and the spectrometer is optimized by applying the faint beam method fuj02 .
2.3.3 Data-acquisition system
The signals from the photomultiplier tubes attached at both ends of the two plastic scintillators are digitized by a 12 bit current integrating QDC, CAEN model V792NC. The signals from the sense wires of the VDCs are pre-amplified and discriminated by 16-channel electronic cards, Technoland model P-TM 005, and digitized by multi-hit TDCs, CAEN model V1190A. The digitized data are recorded by the MIDAS data-acquisition system MIDAS developed originally at PSI and TRIUMF.
2.4 Background subtraction
Instrumental background protons are unavoidable even with the best beam from the cyclotrons. The background protons originate from multiple Coulomb scattering in the target and from secondary scattering in the aperture of the spectrometer. Thus, the amount of the background increases as the target atomic number and the target thickness increase. One of the key points of the successful zero-degree measurement was the development of the background subtraction technique tam99 . A basic assumption in this method is that the physical events focus at the vertical focus point after the spectrometer while the background particles are spread nearly uniformly in the vertical direction.
The basic background subtraction procedure for the Grand Raiden spectrometer at RCNP is shown in Fig. 6 and for the K600 spectrometer at iThemba LABS in Fig.7. In both cases, the central part of the position at the vertical focal plane is selected for the physical events while the side parts are used for the determination of the contribution from the flat background contained in the central region.
However, the method is only applicable for the analysis of the full solid-angle data since the vertical scattering angle is correlated with the vertical trajectory at the focal plane. To enable a simultaneous background subtraction and vertical scattering-angle determination, a mild under-focus mode of the spectrometer Grand Raiden and an extended subtraction method were developed tam09 . The essence of the extended background subtraction is to shift the vertical position data of each event instead of changing the gate on the vertical position. Figure 8 shows an application of the extended subtraction method as well as a cut to scattering angles to the data of fig. 6.
2.5 Polarization-transfer measurement at RCNP
2.5.1 Polarization-transfer coefficients of zero-degree proton scattering
Cartesian coordinate systems ( ,) and (,,) are defined for the incoming and outgoing protons, respectively, in the laboratory system as shown in Fig. 9. Here, (), (), and () correspond to the axes of the sideways, normal and longitudinal components of the proton polarization following the Madison convention ohl72 . Polarization-transfer coefficients, , are described by the proton polarization vectors under the condition of the parity invariance as
[TABLE]
where and are the components of polarization vectors of the incoming and outgoing protons, respectively, is the vector analyzing power and denotes the induced polarization of the scattered protons. Since , , and are odd functions of the scattering angle , they vanish at a scattering angle. Thus, eq. (15) reduces to
[TABLE]
Note that the coordinate systems of the incoming and outgoing protons coincide with each other at . Thus, one can write as etc. In addition, the sideways and normal polarization-transfer coefficients are equal to each other due to rotational symmetry with respect to the beam axis
[TABLE]
2.5.2 Spin-precession in the spectrometer
The polarization vector after scattering, , precesses in the magnetic field of the Grand Raiden spectrometer. The coordinate system of the polarization vector, , at the detector position of Grand Raiden is defined with respect to the direction of the central orbit of the spectrometer as shown in Fig. 9. The direction of the polarization vector relative to the momentum precesses by an angle in the spectrometer
[TABLE]
where is the Lorentz factor, the -factor of the proton magnetic moment and the bending angle of the proton in the spectrometer. The bending angles of the central orbit of the Grand Raiden spectrometer are =162∘ (=180∘ ) for the () setups, see figs. 9(a) and (b).
Each component of the polarization vector, , at the detector position is described by the components of the polarization vector, , at the entrance of the spectrometer by
[TABLE]
The FPP is sensitive to and but not to . Combining eqs. (15) and (19), one can express and as
[TABLE]
and
[TABLE]
The angular acceptance of Grand Raiden is only rad in the zero-degree setup. The terms containing and vanish in the first order due to their property of being an odd function of and due to the symmetry of the Grand Raiden angular acceptance. , and are equal to their values at in first order due to their property of being even functions of . Then eqs. (20) and (21) can be simplified as
[TABLE]
and
[TABLE]
respectively.
As an example, in the case of proton scattering measurements at MeV, the central orbit corresponds to an excitation energy 7 MeV.
For the corresponding proton energy of 288 MeV, =379.6∘, , for the setup and =421.7∘, , for the setup. The bending angle in the spectrometer is determined for each detected proton. The angle depends on the horizontal position at the detector with respect to the proton momentum and on the incidence angle at the detector with respect to the horizontal scattering angle at the target.
2.5.3 Principle of the polarization analysis
The polarization vector of scattered protons is measured by the FPP for the components in the plane perpendicular to the proton momentum, i.e. and . The scattering direction of each event is defined by the relative angle between the proton momenta before and after the carbon scatterer using a polar coordinate system (, ) as shown in fig. 10.
The intensity of protons scattered at angles (, ) is described by
[TABLE]
where and are the +C inclusive scattering cross section and analyzing power, respectively. They depend on the proton energy and the thickness of the carbon scatterer. is a normalization constant. is the amplitude of the polarization vector in the plane perpendicular to the proton momentum before scattering and is its azimuthal angle from the axis with respect to the axis. Thus, the sideways and normal components of the proton polarization can be described as
[TABLE]
and
[TABLE]
The angular range of is chosen to maximize the figure of merit of measuring the polarization of the protons. The scattered events with small angles have negligible analyzing power due to multiple Coulomb scattering in the carbon slab. Thus, a typical minimum scattering angle is . The maximum is determined by the angular acceptance of the FPP and is typically . After integration of the events from to , the polarization of the protons can be expressed by the following equations
[TABLE]
[TABLE]
[TABLE]
Thus, from the distribution of the scattered events given by eq. (27), and in eqs. (25) and (26), respectively, can be determined using the knowledge of the p+C effective analyzing power . The values of and are tabulated as a function of proton energy at the carbon center, and thickness of the carbon slab apr83 ; mcn85 . After integration, ranges from 0.5 at MeV to 0.3 at 400 MeV with a typical uncertainty of 0.02. Note that the absolute value of cancels out in the analysis of polarization transfer coefficients at zero degrees as described in the next subsections, and thus does not affect the final results.
2.5.4 Estimator method
In the early stage of the measurements tam09 ; tam99 ; kaw02 , the sector method was applied for the determination of the polarization of the scattered protons. In this method, the number of scattered events in leftward (L), rightward (R), downward (D) and upward (U) regions of are counted to extract from the asymmetry and from tam09 . Later, starting with the analysis of the data tam11 , the estimator method bes79 has been applied. Furthermore, a way to remove the dependence on the effective analyzing power of the FPP has been developed as described below.
The unbiased efficiency estimator of the polarization
[TABLE]
is defined as bes79
[TABLE]
[TABLE]
[TABLE]
where the sums are taken for events in the proper angular range. The and components of the polarization vector are given by bes79
[TABLE]
The negative sign in the lower component originates from the definition of eq. (2) in ref. bes79 . The statistical uncertainties are determined from the covariance matrix
[TABLE]
For the data taken with the beam polarization direction flipped (Beam-Spin#2), the angle in the above equations is replaced by and the sums are taken together with the non-flipped data (Beam-Spin#1).
2.5.5 Removal of the instrumental-background contribution
The contribution from the instrumental background is subtracted for the determination of the proton polarization with the following method. At first the counts of the true signal () due to scattering from the target and the counts of the instrumental background () are determined with the same method as described for the differential cross sections in sec. 2.4. Here, we consider only events that satisfy the condition .
The polarization of the events () in the true-signal gate is a mixture of the polarization of the true signal () and that of the background () that are given by the ratio of and . Here, denotes either or . Thus one gets
[TABLE]
The ratio of the polarization of the true signal to that of the background is given by
[TABLE]
The right-hand side of the equation consists of experimental quantities only. The effective analyzing power cancels out since both the signal and background polarizations are measured by the same polarimeter for the same proton energy bin.
The instrumental-background protons originate from slit scattering following multiple Coulomb scattering in the target and have no depolarization, i.e.
[TABLE]
This fact represents a big advantage in the polarization analysis. First, the background polarization can be assumed to be the same as the beam polarization. The number of instrumental-background events is larger than the signal events and the beam-line polarimeter events and thus has a smaller statistical uncertainty. Second, the background polarization is simultaneously measured with the signal polarization. Any fluctuation in the degree of beam polarization cancels out. Third, the background polarization and the signal polarization are measured by the same detector system. Since only the ratio between the two polarizations is required as shown in eq. (37), knowledge of the absolute value of the effective analyzing power is not required. Therefore, the measurements are independent of any variations of the detector efficiency and the proton beam energy. Furthermore, no absolute calibration of the beam-line polarimeters is needed.
We can now rewrite the measured polarizations in eqs. (22) and (23) for the true signal () and the background events () as
[TABLE]
The l.h.s. of eq. (37) can be expressed in terms of the polarization-transfer coefficients
[TABLE]
Note that the ratio, depends only on the angle of the beam polarization vector in the - plane, and is independent of the magnitude of the beam polarization. The angle can be determined with high accuracy by the BLPs. The spectrometer bending angle () and the beam polarization direction () are optimized to have a small value of (), typically , for the () measurement. The two independent coefficients, and , can be determined with two measurements, either by the combination of the and measurements with changing the spectrometer setup tam11 ; has15 , or by the combination of the and measurements in the same setup but changing the beam polarization direction mar17 ; kru15 . Some representative results of the polarization-transfer analysis are shown in sec. 2.6.
The above-described method of analysis is valid for the measurement centered at zero degrees that has a symmetric acceptance with respect to the rotation by 180∘. In a finite-angle setup of the spectrometer, the induced polarization, , and the analyzing power, , in eq. (15) break the rotational symmetry. Also, the contribution from the off-diagonal components of the polarization-transfer coefficients, and , must be taken into account.
2.6 Spectra and polarization-transfer observables
Experimental observables derived from the experiments are double-differential cross sections as a function of excitation energy and scattering angle and the polarization-transfer coefficients or and discussed above.
A typical example of the cross-section spectra and their angular dependence observed for heavy nuclei is displayed in fig. 11, which shows data of the 120Sn(p,p*′*) reaction kru15 . The top four spectra originate from a measurement with the Grand Raiden spectrometer angle set to applying software cuts on the reconstructed scattering angle, whereas the lower four result from a measurement with the spectrometer placed at . At most forward angles one observes a prominent structure around 15 MeV identified as excitation of the IVGDR. Furthermore, a resonance-like structure is visible at lower energies ( MeV) which contains E1 (PDR) and M1 (spin-flip resonance) parts. Both structures show a clear decrease of the cross sections with increasing angle consistent with the properties of relativistic E1 Coulomb excitation or angular distributions as expected for the spin-flip M1 transitions. Since the angular acceptance of the two spectrometer settings overlaps one can make a comparison of the cross sections at (dark green and lime green spectra), which agree within systematic uncertainties.
As discussed in sec. 3.2, a combination of spin transfer observables provides information on the spin-flip character of a transition in the reaction. Figure 12 presents a measurement on 96Mo as an example mar17 . The spectrum (top frame) shows again the characteristic double-hump structure due to excitation of the IVGDR and the PDR (+ spin-flip M1 resonance). The second and third frames present the measured and values. While they show strong variations at low excitation energies, about constant and equal values are found in the IVGDR region. As a result, their contributions cancel for the determination of the total spin transfer , cf. Eq. (43), shown in the bottom frame. For further interpretation, see sec. 3.2.
The spectra in light nuclei, where the level density is low, are dominated by individual resolved transitions. Taking 28Si as an example, one can resolve individual transitions at very forward angles (, top part of fig. 13) up to excitation energies well above 10 MeV mat15 . The vast majority of these transitions shows M1 character. The IVGDR lies at higher excitation energies and the cross sections are about an order of magnitude smaller than in heavy nuclei (see fig. 11 for an example) because of the target charge dependence of the Coulomb cross sections ber88 . The lower part of fig. 13 compares spectra at , and The large differences in the variation of cross sections with angle for different peaks indicate that the multipole character of the observed transitions can be well distinguished in a multipole-decomposition analysis (see sec. 3.1).
Figure 14 shows a zoom into the higher-energy region of the spectra for various nuclei from 20Ne to 40Ca. The data for 20Ne, 24Mg, 28Si and 32S exhibit a strong fragmentation of the IVGDR, which can be related to deformation and clustering fea18 , cf. sec. 6. It is also known that a non-negligible part of the IVGDR strength resides at even higher excitation energies era86 . In contrast, a compact resonance starts to form in 36Ar and is clearly observed in the doubly magic nucleus 40Ca.
3 Extraction of E1 and M1 strength
A separation of the E1 and M1 cross sections dominating the spectra at very forward angles from each other and from the excitation of other multipoles or nuclear processes was achieved with two independent methods. These are a multipole-decomposition analysis of the cross section angular distributions with the aid of DWBA calculations and an analysis based on the measurement of the polarization-transfer coefficients. We also explain the methods used to convert the separated cross sections into E1 and M1 transitions strengths.
3.1 Multipole-decomposition analysis (MDA)
MDA, based on model predictions of the angular distribution shapes, is commonly used in the analysis of complex spectra from hadronic reactions. It has been applied, e.g., for an extraction of B(GT) strengths in charge-exchange reactions wak97 or isoscalar giant resonance strength distributions from inelastic -particle scattering li09 , and also for inelastic electron scattering form factors of electric str00 and magnetic vnc99 giant resonances. In the present approach, theoretical proton scattering cross sections are calculated using the code DWBA07 dwba07 with RPA amplitudes and single-particle wave functions from the quasiparticle-phonon model (QPM) (see, e.g., ref. rye02 ) as input. The interference of Coulomb and nuclear contributions to the cross sections is taken into account for E1 transitions. The -matrix parameterization of Franey and Love at 325 MeV fra85 was used to generate an effective projectile-target interaction. For each discrete transition or excitation energy bin the experimental angular distributions are fitted by means of the least-square method to a sum of the calculated angular distributions weighted with coefficients (with the condition ), where is the multipolarity of the transition. Additionally, we include a phenomenological angular distribution accounting for other nuclear processes (mainly quasi-free scattering). In heavy nuclei, its shape was determined from the data at high excitation energies above the IVGDR (see ref. pol11 for the case of 208Pb).
Some approximations are necessary to make the MDA tractable. Experimental data, although available up to angles in some cases, were restricted to scattering angles because of the increasing complexity of contributions from different multipoles at higher momentum transfers hof07 . Isovector spin- excitations are represented by a single characteristic curve for each nucleus, justified by the identical angular dependence of the cross section for all transitions of this type in the angular range considered. Furthermore, in the calculations the largest part of the E1 strength resides in a few transitions only (typically less than 10) and only these are taken into account.
Figure 15(a) compares the shape of the isovector spin-M1 transition with representative examples of E1 transitions to states of the PDR and IVGDR, respectively, for the case of 208Pb pol12 . Indeed, the latter can be distinguished not only from the M1 case but also from each other. All other contributions to the cross sections are substituted by angular distributions of either or transitions, whose shapes were taken to be that of the most collective transition of each type. Other multipolarities of potential relevance like , or exhibit very similar angular distribution shapes to either or as demonstrated in figs. 15(b) and (c). The QPM results predict that isoscalar monopole transitions are only weakly excited in proton scattering at these incident energies with a contribution of less than 3% of the cross sections at at the maximum of the giant monopole resonance for 208Pb. Therefore, possible contributions from transitions were neglected in the MDA.
The final coefficients are obtained by computing the MDA for all possible combinations of , and (or ) transitions plus the phenomenological background taking the -weighted average of all individual values. Examples of fits are displayed for the 208Pb(p,p*′*) data in the bottom part of fig. 16. The corresponding energy bins are indicated by the vertical dashed lines in the spectrum taken with the spectrometer placed at shown in the top part of fig. 16. The two adjacent energy bins in the excitation-energy region of the PDR demonstrate the sensitivity of the MDA to distinguish E1 and M1 contributions to the cross sections with a dominance of E1 in the former and M1 in the latter bin, respectively. Figure 16(c) presents a fit for an energy bin near the maximum of the IVGDR, illustrating the expected dominance of E1 cross sections.
The decomposition of E1 and M1 cross sections for the example of 90Zr iwa12 in the excitation energy region from 6 to 12 MeV is shown in fig. 17 for 100 keV bins. One observes strong fluctuations of the E1/M1 ratio from bin to bin. The high resolution of the experiment is sufficient to resolve many individual transitions and the result of their MDA is shown as full red circles. The dotted lines show the fits for the PDR and spin-M1 resonance cross sections in 90Zr assuming Lorentzian shapes. We note, however, that 208Pb and 90Zr are the only cases investigated so far where individual transitions could be resolved in heavy nuclei. In general the level density is too large even in the energy region below the IVGDR (see, e.g., fig. 11).
The situation is different in light nuclei. The upper part of fig. 18 shows a spectrum of the 28Si(p,p′) reaction at extreme forward angles mat15 . Transitions up to MeV can be clearly resolved. All prominent excited states have been identified as states (marked with arrows).
The experimental angular distributions for each state were compared to distorted-wave impulse approximation (DWIA) calculations for identifying the transitions. The DWIA calculations were performed with the code DWBA07 dwba07 using one-body transition densities obtained from shell-model calculations with the code NuShellX@MSU bro14 incorporating the USD interactions bro87 ; bro06 ; ric08 . Predictions for different multipoles are shown in figs. 18(b) and (c) in comparison with experimental data for the transitions marked with red and blue arrow in fig. 18(a). All theoretical curves are normalized to the experimental data at the most forward angle. IS and IV M1 transitions can be clearly distinguished from other multipoles but also from each other, since the former angular distribution is flatter than the latter due to the contribution of an exchange tensor component in the effective NN interaction lov81 .
3.2 Polarization-transfer analysis (PTA)
An independent separation of E1 and M1 parts of the cross sections, particularly useful in the overlap region of the PDR and the spin-M1 resonance, can be achieved by a decomposition of spin-flip and non-spin-flip cross sections. This information can be extracted from the polarization-transfer observables , and introduced in sec. 2.5. As pointed there, and are indistinguishable at , thus only one of them needs to be measured. It is convenient to introduce the total spin transfer
[TABLE]
which takes values of zero for non-spin-flip and one for spin-flip transitions suz00 . The application of eq. (43) is illustrated in fig. 19 with data of the 26Mg reaction. The top part of fig. 19 displays the spectrum measured at a spectrometer angle of . All transitions observed are known from the literature ensdf and the more prominent excitations all have spin-M1 character cra89 . The second and third frames present the measured and values, respectively, which both show a wide scattering for the individual transitions. However, their values shown in the bottom frame of fig. 19 sort into two distinct groups with values close to either 0 or 1. Excitations with all correspond to transitions to natural-parity states, while those with belong to the spin-M1 resonance exciting unnatural-parity () states. The few cases with intermediate values observed between 12 and 13 MeV correspond to weak bumps in the spectrum, which most likely result from the unresolved superposition of non-spin-flip and spin-flip excitations.
In heavier nuclei, Coulomb excitation becomes an increasingly important contribution to the cross sections besides excitation of the spin-M1 resonance due to the strong spin-isospin-flip part of the proton-nucleus interaction at small momentum transfers. Because of the different reaction mechanisms, non-spin-flip and spin-flip excitations in the PTA can be identified with E1 and M1 transitions, respectively. As an example for a heavy nucleus, the PTA of the 208Pb reaction in the energy region MeV is presented in fig. 20, where (a) shows the spectrum measured at and (b) the total spin transfer . Values of between 0 and 1 result from a summation over partially unresolved transitions with different spin-flip character. The data reveal a competition of spin-flip strength in the energy region MeV, where the spin- resonance in 208Pb is located hey10 , with non-spin-flip excitation of the PDR. The bump between 10 and 16 MeV has character consistent with an excitation of the IVGDR. The strength at high excitation energies may result from the spin-flip part of quasi-free scattering bak97 dominating the cross sections above the IVGDR energy region.
E1 and M1 parts from the MDA and and 1 parts from the PTA applied to the 208Pb data are compared in fig. 21 for MeV tam11 . Within the experimental uncertainties the correspondence between the two completely independent decomposition methods is excellent. Similar agreement between the two methods was achieved in 120Sn has15 and 96Mo mar17 . This put confidence in the MDA results for heavy nuclei, where individual transitions typically cannot be resolved. The MDA of cross sections provides much better resolution because of the superior statistics compared to a double scattering measurement of polarization-transfer observables. As a consequence, later experiments have been restricted to the measurement of cross sections only. In the IVGDR region no direct comparison between the two methods is possible because of the unknown content of the phenomenological background. However, both methods agree that contributions are very small.
3.3 Conversion of Coulomb excitation to photoabsorption cross sections
The low-energy part of the 208Pb spectrum (fig. 20) up to 9 MeV is displayed in fig. 22. Arrows indicate dipole and quadrupole transitions known from previous work, mainly from () experiments rye02 ; end03 ; shi08 ; sch10 . One observes a one-to-one correspondence, and the largest transitions in the proton scattering experiment all have E1 character. This points to a dominance of Coulomb cross sections in the (p,p′) scattering at very forward angles, since nuclear excitation cross sections of E1 transitions are weak.
To verify the assumption, Coulomb-excitation predictions for the angular distributions of the prominent transitions to 1- states at MeV and 6.719 MeV were calculated based on a semi-classical model ber88 shown as dashed lines in fig. 23. Because of the finite angular resolution of the Grand Raiden spectrometer they were convoluted with Gaussian functions with widths corresponding to the vertical and horizontal angular acceptance of the detector system. The shape of the experimental angular distributions (solid squares) is well described and their absolute magnitudes can be reproduced when the calculations are normalized to the B(E1) strengths deduced from the (,) experiments rye02 ; end03 ; shi08 ; sch10 . The remaining deviations at angles larger than are attributed to effects of Coulomb-nuclear interference and in case of the transition to the state at 6.719 MeV to possible contributions from an unresolved transition with higher multipolarity.
Since the E1 cross sections for angles are shown to be of pure Coulomb nature, one can convert them to equivalent photoabsorption cross sections or B(E1) strengths with the virtual-photon method ber88
[TABLE]
relating the experimental to the photoabsorption cross section .
As an example, the virtual-photon numbers for E1 transitions averaged over the solid angle for the 120Sn(p,p*′*) reaction at MeV as a function of energy is presented in l.h.s. of fig. 24. It exhibits a strong energy dependence amounting to about an order of magnitude for the excitation-energy region of interest. The middle part of fig. 24 presents virtual-photon numbers per unit solid angle for E1, E2 and M1 transitions at MeV as a function of the scattering angle . M1 transitions show an angular distribution similar to E1, but smaller virtual-photon numbers. Taking into account the different excitation probability in real-photon experiments, the M1 Coulomb-excitation cross sections are negligible compared with nuclear excitation of the spin-M1 resonance discussed in sec. 3.4. For E2 transitions large virtual-photon numbers are observed. However, the corresponding contribution to is nevertheless negligible. All virtual-photon spectra show a steep minimum at due to the assumption of a sharp cutoff of the impact parameter (semi-classical approximation). The dominance of the E1 part of the photo-response is well known and independent of excitation energy (see, e.g., ref. bas16 ). Finally, the energy dependence of the angular distribution of is shown in the r.h.s. of fig. 24. The maximum moves towards larger angles with increasing energy. For a meaningful comparison with experiment it is important to integrate the cross sections over an angular region which includes the first maximum of the virtual-photon spectrum to avoid a dependence on the artificial minimum of the semi-classical approximation.
The application of the virtual-photon method to the 208Pb is presented in fig. 25. The upper part compares the extracted B(E1) strength distribution in the region MeV with rye02 ; end03 ; shi08 ; sch10 and (n,) koh87 experiments. Excellent agreement is obtained up to the neutron threshold . The excess strength in the (p,p*′*) data above the neutron threshold can be attributed to previously unknown neutron decay widths of the excited states, which modify the branching ratios in the -decay experiments and thus the extracted B values. The lower part shows the photoabsorption cross sections in the IVGDR region together with results from a (,xn) vey70 and an elastic photon scattering sch88 experiment. Again, very satisfactory agreement of all three measurements is observed. While the older analyses of 208Pb tam11 ; pol12 and 120Sn has15 ; kru15 were based on the semi-classical model, in more recent work mar17 ; bir17 an eikonal approach ber93 was used for the calculation of the virtual-photon spectra. It allows for a proper treatment of relativistic and retardation effects and provides more realistic angular distributions due to taking into account absorption on a diffuse nuclear surface. The differences between the two approaches are illustrated in fig. 26 again for the example of 120Sn. The dotted and solid lines compare the angular dependence of the virtual-photon spectra obtained with the semi-classical and eikonal approaches, respectively, for energies of 6 (blue) and 18 (red) MeV. One clearly sees that the unphysical minimum at zero degrees obtained in the semi-classical model vanishes when applying the eikonal approach and the resulting angular distributions are much closer to the experimental observations (cf. fig. 23). However, when integrating over the angular region where Coulomb/nuclear interference effects can be neglected (up to about in the example shown in fig. 26), differences of the resulting virtual-photon flux are small between both models, typically less than 10% in heavy nuclei. In contrast, differences become sizable in lighter nuclei and photoabsorption cross sections extracted using the virtual-photon flux calculated with the semi-classical model are found to be way too small compared to results obtained with real-photon probes bas14 .
3.4 Unit cross-section method
The extraction of spin-M1 matrix elements from the M1 (p,p*′) cross sections poses a problem. While the forward-peaked angular distribution of isovector spin-flip M1 (ISVM1) transitions can be well described independent of details of the DWBA calculation, absolute predictions of cross sections show a large uncertainty depending on the choice of the effective proton-nucleus interaction hof07 . Therefore, the concept of unit cross section developed for the extraction of Gamow-Teller (GT) strength from charge-exchange (CE) reactions tad87 ; zeg07 is employed and a similar relation is derived for the (p,p′*) reaction. For CE reactions the cross section at scattering angle can be written as
[TABLE]
where is a nuclear-mass dependent factor (the unit cross section), a kinematical factor normalized to correcting for non-zero momentum and energy transfer, and (GT) the reduced GT transition strength. The total energy transfer , where denotes the reaction value. One can define a corresponding relation for the inelastic scattering cross sections
[TABLE]
where denotes the reduced IVSM1 transition strength. Obviously, the kinematical factors in eqs. (45) and (46) differ for isobaric analog states. The kinematical correction factor depends on the energy transfer and is determined by DWBA calculations comparing the predicted cross sections for a given transition with and without energy transfer. Extrapolation to the cross section at from experimental data at finite angles is achieved with the aid of theoretical angular distributions.
The reduced GT and IVSM1 transition strengths from a ground state to a excited state can be expressed as
[TABLE]
Here, and are the spin and isospin operators acting on the nucleon, denotes a matrix element reduced in spin and isospin, and are initial and final states with isospin . The Clebsch-Gordan (CG) coefficients depend on the reaction and on the , values fuj11 . The reaction can excite GT transitions to states with isospin and the corresponding strength is commonly termed , , . The decay transitions used to determine the parameters of Eq. (45) possess while the IVSM1 resonance observed in the reaction has . states can also be excited in principle but are well separated in excitation energy and strongly suppressed for large values of fuj11 ).
At the small momentum transfers of inelastic scattering close to , isospin symmetry requires . The systematics of has been studied in ref. sas09 for the (p,n) reaction at a beam energy comparable to the present experiments (297 MeV). They find a parameterization of the mass dependence
[TABLE]
The assumption of equal unit cross sections leads to
[TABLE]
and for the case of an analog GT transition with
[TABLE]
Equations (50,51) imply that the IVSM1 matrix elements can also be derived from studies of the GT strength with the reaction in the same kinematics. However, in particular for the study of discrete transitions the poor energy resolution of the (p,n) reaction of several hundred keV (FWHM) represents a severe limitation. Furthermore, for nuclei with , the corresponding CG coefficients suppress the cross sections fuj11 .
A number of approximations was made in the derivation of eqs. (50,51), whose validity is discussed below. Several effects can break the equality of eqs. (50,51). In contrast to the purely IV CE reactions, the (p,p*′) cross sections contain IS contributions. However, because of the dominance of the over the part of the effective interaction lov81 these are typically % and energetically separated in heavy nuclei hey10 . Differences of exchange terms contributing to the (p,p′*) and (p,n) cross sections and Coulomb effects can affect the extrapolation of cross sections to . However, estimates based on the Love-Franey effective interaction lov81 ; fra85 indicate that these are negligible.
A general problem of (p,p*′*) as well as CE reactions are incoherent and coherent contributions to the angular distributions of M1 excitations, the latter due to the tensor part of the proton-nucleus interaction. Because of the difference of angular distribution shapes, the incoherent cross sections are effectively taken into account in a MDA of the data, while the coherent part requires explicit knowledge of the excited-state wave function. In ref. zeg06 , a shell-model study has been performed for the case of the 26Mg(3He,t) CE reaction at 140 MeV/u indicating % changes of individual transition strengths with decreasing importance for stronger transitions and random sign. Thus, for the total strength the uncertainties should be smaller than 10%.
With a few additional assumptions one can also derive the corresponding electromagnetic B(M1) transition strength
[TABLE]
which contains spin and orbital contributions for the isoscalar (IS) and isovector (IV) parts. For small orbital and IS contributions and can be related by
[TABLE]
The approximations made when going from eq. (52) to eq. (53) are justified by the following arguments. Because of the anomalous proton and neutron factors the IS spin part is small [] and can usually be neglected (see, however, the special case of 48Ca discussed below). Furthermore, orbital M1 strength is related to deformation end05 and thus can be neglected in nuclei near closed shells. However, one can even argue that eq. (53) should approximately hold in general, at least for the total strength. For light deformed nuclei the spin-orbital interference can be sizable for individual transitions (see e.g., refs. fuj97 ; hof02 ) but the overall strength is weakly modified (%) because of the random mixing sign ric90 ; fay97 . In heavy deformed nuclei, spin and orbital M1 strengths are energetically well separated and mixing is predicted to be weak hey10 .
Finally, meson-exchange current contributions can differ for electromagnetic and hadronic reactions. These differences are relevant in light nuclei and have, e.g., been observed in the comparison of M1 and GT strengths in -shell nuclei ric90 ; lue96 ; vnc97 . However, for the available data indicate that the quenching factors in microscopic calculations are the same ric85 , consistent with theoretical expectations tow87 ; tok80 . Overall, the approximations discussed above limit the accuracy of (M1) strengths derived from the (p,p*′*) data to about 10% near closed-shell nuclei and about 15-20% in deformed nuclei.
Since the mass dependence of in ref. sas09 was derived from -decay data of medium-mass and heavy nuclei only, an independent analysis was performed for the study of the (p,p′) reaction in light nuclei assuming the same functional form as in eq. (49) The result is shown in the r.h.s of fig.27. The resulting parameters are in very good agreement with those for heavier nuclei mat15 .
As mentioned above, the (p,p′) cross sections contain an IS part. It can usually be neglected for nuclei with a large g.s. isospin, but even in cases where the IS contribution is enhanced, it remains on the level of a few %. This is illustrated in fig. 28 for the case of the pure neutron transition in 48Ca bir16 discussed below. The figure compares the measured angular distribution with DWBA calculations assuming a neutron (full red line), pure IS (dotted line) and pure IV (dashed line) transition. The IS contribution is relevant at larger angles but close to it amounts to 2% of the total cross section only.
However, in nuclei with g.s. isospin pure IS M1 transitions can be excited and experimentally distinguished from IV transitions (cf. fig. 18). Utilizing a relation analogous to eq. (46), one can extract the reduced IS spin-M1 strength (called Bσ). The corresponding unit cross section has been determined using 11B() data kaw04 and an IS strength deduced from the -decay lifetimes of the first-excited mirror states in 11B and 11C ensdf . Note that the linear combination of the -decay strengths is proportional to the Bσ value because of isospin symmetry. Further details on the determination of the UCSs in light nuclei can be found in ref. mat10 . The l.h.s. of fig. 27 illustrates that the IS unit cross section at comparable mass number is about a factor of 20 smaller.
4 Electric dipole response
4.1 Polarizability, neutron skin and parameters of the symmetry energy
Besides their relevance for the test of nuclear structure models, experiments providing the E1 response over an energy range covering the PDR and the IVGDR are of particular interest for a determination of the static dipole polarizability boh81
[TABLE]
While the low-energy E1 strength typically amounts to at most a few % of the energy-weighted sum rule (EWSR) only, it is important for because of the inverse energy weighting. As discussed in sec. 4.2 the low-energy E1 strengths derived from different experimental methods show large variations, mainly because they depend on unknown properties of the decay. The importance of the (p,p′) experiments lies in the fact that they measure the absorption probability and are thus independent of knowledge or modeling of the -decay branching ratios.
Systematic studies within energy density functional (EDF) theory have shown that there are two experimental observables which can serve as a measure of the parameters of the symmetry energy, viz. the neutron-skin thickness and rei10 ; pie12 . The neutron-skin thickness is defined as the difference of the neutron and proton root-mean-square radii . For stable nuclei, the proton radii are experimentally well known ang13 and the neutron radii can be inferred from measurements of the matter radius by coherent photoproduction of mesons tar14 , antiproton annihilation klo07 ; bro07 or proton elastic scattering sak17 . A nearly model-independent determination of the neutron skin is possible by measuring the weak form factor of nuclei with parity-violating elastic electron scattering hor01 . Such an experiment has been performed for 208Pb abr12 but the statistical uncertainties are still too large for serious constraints of the neutron skin.
Figure 29 shows the correlation (defined in ref. rei10 ) of the neutron form factor at the momentum transfer of the experiment of ref. abr12 with other bulk properties of nuclei for a systematic variation of EDF model parameters. The correlation is almost perfect for the neutron-skin thickness and the polarizability of neutron-rich nuclei as well as the parameters of the symmetry energy (called and here). All those quantities can thus be viewed as good indicators of isovector properties of nuclei. Bulk properties like isoscalar and isovector effective mass, incompressibility and saturation density as well as the energies of ISGMR, IVGDR and ISGQR show a poor correlation. The results of ref. rei10 also suggest that the PDR is not a good observable to constrain the symmetry energy properties in contrast to other findings car10 . However, this may depend on the choice of the EDF (SV-min klu09 for the results of fig. 29). In particular, some relativistic mean field (RMF) functionals tend to predict a larger collectivity of the PDR and a higher correlation with the symmetry energy parameters kli07 ; roc18 .
While calculations with different EDFs all confirm the strong correlation of with the neutron skin and the symmetry-energy parameters, the absolute values can differ considerably pie12 . It is therefore important to compare experimental values systematically for many nuclei before conclusions on and can be drawn. The situation resembles the extraction of the nuclear-matter incompressibility from EDF calculations of the isoscalar giant monopole and dipole resonance energies gar18 . Values for from experiments have been extracted for 120Sn has15 and 208Pb tam11 . In principle, the integral in eq. (54) runs to infinity, but the inverse energy weighting limits the contribution from energies above the giant resonance region to less than 5%. Furthermore, the strength at high energies is dominated by non-resonant processes (the so-called quasi-deuteron mechanism lev51 ) which is not included in the nuclear-structure calculations. It was thus suggested to neglect it for the comparison between experiment and theory roc15 .
Roca-Maza et al. roc15 used these corrected data together with a measurement of in the exotic nucleus 68Ni ros13 to constrain the wealth of EDFs (both of Skyrme and RMF type) by requesting reproduction of all three experimental values within error bars. Figure 30 illustrates that only a handful of functionals can simultaneously describe all data. New constraints on , and could be derived from averaging over the predictions of these selected calculations.
A variety of experimental methods permits to extract information on the symmetry energy with different dependence on the density roc18 . Besides astrophysical observations of the mass-radius relation of neutron stars lat07 , constraints on the symmetry-energy parameters can be extracted from heavy-ion collisions, masses, isobaric analogue states, measurements of the difference of proton and neutron radii and from properties of the IVGDR and PDR (see, e.g., ref. tsa12 ). Current results together with those of neutron-matter studies of refs. heb10 and gan12 are summarized in fig. 31 lat16 . Concerning the measurements of , the droplet model predicts a relation of the form , which holds independent of the choice of a particular EDF functional roc13 . Using the results of refs. roc15 ; roc13 , one can derive the yellow band of allowed values from the polarizability result for 208Pb in fair agreement with the constraints from most other experimental methods. Since the extraction of the symmetry energy parameters is model-dependent, it is important to estimate the theoretical uncertainties for future improvement naz14 .
Recently, it has become possible to study such correlations in medium-mass nuclei with ab-initio calculations based on chiral effective field theory (EFT) interactions hag16a ; mio16 . By using a set of chiral two- plus three-nucleon interactions heb11 ; eks15 and exploiting correlations between and the proton and neutron radii, Hagen et al. hag16a predicted the electric dipole polarizability and a neutron-skin thickness for 48Ca. Since the analysis of ref. roc15 also provides a prediction of from EDF theory, a study of the dipole polarizability in 48Ca is of special interest. The B(E1) strength in 48Ca in the IVGDR energy region was extracted from (e,e′n) str00 and photoabsorption oke87 experiments with conflicting results at higher excitation energies as shown in fig. 32 by the green triangles and black squares, respectively. The result of a corresponding (p,p′) study bir17 shown as blue circles agrees within error bars with the data of ref. str00 . A possible explanation for the differences with ref. oke87 is the unfolding procedure with a not well-known bremsstrahlung spectrum as input necessary for the extraction of , leading to sizable systematic uncertainties not reflected in the quoted error bars.
The dipole polarizability of 48Ca was extracted from the combined (p,p′) and (e,e′n) data plus photoabsorption results of ref. ahr75 on a natural Ca target at energies above the IVGDR region. E1 strength below the neutron threshold was measured with the reaction har02 . Unlike in heavy nuclei, where the low-energy strength is a sizable correction, the contribution is negligibly small in 48Ca (about 0.05%). The experimental result is compared in fig. 33 with predictions from state-of-the-art EFT (green triangles) and EDFs (red squares) functionals (for details see ref. bir17 and references therein). It provides a clear constraint on the parameters of the EFT interaction and excludes most of the EDFs discussed in ref. hag16a , while the prediction based on EDFs describing the previously available data roc15 agrees within uncertainties. Taking only the interactions and functionals in fig. 33 consistent with the experimental range implies a small neutron skin in 48Ca, where the lower values stem from the ab-initio calculations. In the ab-initio results the small neutron skin is related to the strong shell closure leading to practically identical charge radii for 40Ca and 48Ca hag16a . The ab-initio results also provide symmetry-energy parameter ranges MeV and MeV. These constraints are highly competitive, in particular the value of if compared with the constraints from different methods shown in fig. 31. The EDF results show larger scattering, in particular for the density dependence, but this may be reduced if the analysis of roc15 is extended to include the 48Ca result.
4.2 Pygmy dipole resonance
Extraction of the properties of the PDR in nuclei with neutron excess is a complex problem both experimentally and theoretically. In models relating the PDR to the formation of a neutron skin, transitions are expected to have dominant neutron character. Thus, excitation of the states forming the PDR is expected for both IS and IV probes. Because of the dominance of Coulomb excitation at forward angles, the (p,p′) experiments discussed here investigate the electromagnetic strength, i.e. the IV channel. sav13 , heavy-ion bra15 and very recently also proton scattering sav18 at beam energies, where nuclear excitation dominates over Coulomb excitation, have been used to measure the IS response. Since these reactions are less selective, the identification of PDR transitions requires a coincidence measurement with decay to the g.s., which serves as a unique identification of the E1 character.
Theoretically, PDR transitions can be identified by the specific form of their transition densities paa07 with proton and neutron contributions approximately in-phase (i.e. isoscalar) in the interior and a pronounced peak of the neutron density at the surface. In contrast, transitions populating the IVGDR exhibit out-of-phase proton and neutron contributions (i.e. isovector). However, in the energy region between the peaks of the PDR and IVGDR one also finds transitions with mixed character and there is no clear procedure for a decomposition tso08 . The structure of the E1 transitions can only be inferred indirectly from the comparison of predictions of experimental observables like the IS and IV E1 strengths.
Most experimental techniques for the investigation of the IS or IV E1 strength are based on the measurement of or (above threshold) particle decay. An extraction of the corresponding reduced transition strengths requires knowledge of the branching ratio to the g.s., which – apart from exceptional cases like 208Pb pol12 – cannot be measured for the decay. Thus, a variety of correction methods has been developed based on branching ratios calculated within the statistical model rus09 or assuming different classes of states either decaying statistically or directly to the g.s. ton10 . Theoretically, a correlation of the total PDR strength with the neutron-skin thickness is expected in many models roc18 . Figure 34 presents a summary of the available data on the EWSR fraction of the E1 strength identified to belong to the PDR as a function of the parameter
[TABLE]
where and are the two-proton and two-neutron separation energies, respectively, and is the height of the Coulomb barrier at the nuclear radius (CFF = Coulomb-Corrected Fermi energy). This quantity is well correlated with the neutron-skin thickness in EDF calculations sav13 .
The experimental results do not clearly favor a correlation between the two quantities as theoretically predicted. Also, results obtained at comparable values of in different experiments do show a large scattering. (We note that the compilation shown in fig. 34 is several years old but inclusion of newer data would probably not change the picture significantly.)
Results from the (p,p′) experiments play a potentially important role because they are independent of the knowledge of branching ratios. The measured cross sections are directly related to the reduced B(E1) strengths, cf. eq. (44). However, so far only a limited number of results are available. For 208Pb, where decay to excited states can be neglected because of their large energy gap to the g.s., good agreement with studies is obtained pol12 ; sch10 as can be seen in figs. 35(a) and (b). It also represents a case of special interest for theory, because the double shell closure allows the application of refined methods including complex configurations beyond 1p-1h excitations considered in RPA. These have been shown to be important for a realistic description of the low-energy E1 strength (see, e.g., ref. oze14 ).
Figure 35 compares the experimental B(E1) strengths between 4.8 and 9 MeV with theoretical results from (c) QPM rye02 , (d) RTBA lit07 and (e) shell-model sch10 calculations. The QPM calculation, including a model space up to 3-phonon states, provides a good description up to 7.5 MeV. At higher excitation energies the strength is too small. The RTBA calculation includes only extra configurations of the type , and thus the fragmentation is insufficient to describe the data. (Note the reduction by a factor of 10 in fig. 35(d) to bring it on the scale of the other results). The integrated strength up to 9 MeV is more than a factor two too large. However, the model has been further developed to include full multiphonon coupling lit15 and one may expect an improved description within such an approach. The SM provides a good description with a fair agreement for the total strength but a slight indication that correlations beyond the present 2p-2h truncation of the model space are relevant.
For the case of 120Sn, fig. 36 presents the B(E1) strength distributions in 200 keV bins deduced from the (p,p′) kru15 and oze14 experiments shown as black histogram and red circles, respectively. Note that the measurement is limited to energies below the neutron threshold (MeV). Both results show reasonable agreement at excitation energies around 6 MeV although the absolute B(E1) strength from the (p,p′) data is on the average 30% larger. Above 6.3 MeV the results diverge. In the (p,p*′*) result a resonance-like structure at about 8.3 MeV is visible not seen in the data.
The blue squares in fig. 36 depict the strength distribution after correction for the unknown ground-state branching ratios by a statistical-model calculation. The method is described in ref. rus08 and details of the application to 120Sn in ref. oze14 . The result shown uses the level-density parameterization of ref. rau97 , but the dependence on the choice of the level-density model is weak oze14 . Inclusion of the statistical-model correction brings both results in fair agreement in the energy region around 6 MeV. Remaining differences at energies up to 6.5 MeV may be related to non-negligible unresolved strength in the data oze14 and for the region around 5.5 MeV to problems of the background subtraction in the (p,p′) data. However, these cannot explain the sizable differences at higher excitation energies with more than an order-of-magnitude difference for the peak at 8.3 MeV. While the increase of the E1 strength due to the statistical-model corrections can be large in more deformed nuclei rus08 ; mas14 , in the semi-magic nucleus 120Sn it is limited to about 40% independent of the choice of parameters.
The large discrepancy suggests the existence of two classes of states with distinct wave functions, viz. a number of selected states, in the present case around 6.5 MeV, with large g.s. decay probability loe16 , while the larger part of the B(E1) strength seems to come from states with non-negligible ground-state decay width but ground-state branching ratios decreasing with excitation energy sch13 . The bump around 6.5 MeV may be considered as the ’true’ PDR. This is supported by investigations of the isospin structure using isoscalar probes end10 ; pel14 . Although these were performed for 124Sn, the similarity of the IV strength distributions in the stable Sn isotope chain bas18 suggest a comparable picture for 120Sn. The nature of the pronounced peak around 8.3 MeV is presently unclear. A possible interpretation as local concentration on the low-energy tail of the GDR is discussed in ref. oro98 .
A similar comparison of dipole strengths from (p,p′) and experiments for the deformed nucleus 96Mo is presented in sec. 7.2. In this case, the E1 strength deduced from the data is larger but dominated by the statistical-model correction rus09 .
4.3 IVGDR in deformed nuclei
As pointed out above, the (p,p′) experiments do not only provide information on the PDR but also on the IVGDR. While good agreement with photoabsorption cross sections deduced from (,xn) experiments was reported for the closed-shell nuclei 120Sn has15 and 208Pb tam11 , unexpected differences are observed for deformed nuclei.
The chains of stable even-even neodymium and samarium isotopes are known to comprise a transition from spherical to deformed ground states for heavier isotopes and thus represent an excellent test case to study the influence of deformation on the properties of the IVGDR. The simultaneous measurement of the partial photonuclear cross sections and at Saclay using a monochromatic photon beam provides total photoabsorption cross sections in the IVGDR energy region for the stable even-even neodymium car71 and samarium car74 isotopic chains. The results show a width increasing with deformation evolving into a pronounced double-hump structure in the most deformed nuclides, considered to be a textbook example of splitting boh75 owing to oscillations along the different axes of the quadrupole-deformed ground state.
New photoabsorption cross sections for 144,146,148,150Nd and 152Sm extracted from 200 MeV proton scattering experiments at iThemba LABS have been reported don18 with results differing significantly from those of refs. car71 ; car74 . No MDA could be performed with these data, thus the main background contributions in the energy region of the IVGDR from excitation of the ISGMR and ISGQR were subtracted using experimental strength functions ito03 (for details see ref. don18 ). Since the present configuration of the facility at iThemba LABS nev11 allows only to determine the energy dependence but not the magnitude of the photoabsoprtion cross sections, the results are plotted in fig. 37 normalized to the maximum of the Saclay data to facilitate a comparison of the evolution of the shape of the IVGDR with increasing deformation.
Carlos et al. car71 ; car74 (green histograms) observed a spreading of the IVGDR as the nuclei become softer followed by a splitting of the IVGDR into two distinct dipole modes for 150Nd and 152Sm, which were interpreted as and components. The equivalent photoabsorption cross sections from the new work (red histograms) display a similar trend, i.e., a general broadening of the IVGDR with increasing deformation. However, for the most deformed 150Nd and 152Sm, the resonance becomes skewed with increased strength on the low-energy side, but no splitting into two distinct components is observed.
Model calculations of the IVGDR evolution in the Nd and Sm isotope chains were performed in the framework of the Skyrme Separable Random-Phase Approximation (SSRPA) approach nes06 using the SLy6 cha98 interaction which was shown to provide a good description of the IVGDR in medium-heavy, deformed nuclei kle08 . The resulting photoabsorption cross sections are shown in fig. 37 as blue lines. They are normalized to the data at the high-energy flank of the IVGDR, where both sets of data agree reasonably well. The separation into and components is additionally shown for the most deformed nuclei, 150Nd and 152Sm as dash-dotted and dashed lines, respectively. For the spherical and transitional nuclei, 144,146,148Nd, the calculations are in better agreement with the present results, i.e. favoring smaller cross sections on the low-energy flank. For 150Nd and 152Sm, the SSRPA results display a double-hump structure, but again with a lower component than observed in the Saclay results and total cross sections somewhat closer to the present data.
One possible interpretation of the unexpected result is that it may be related to the special structure of these two nuclei which are predicted to lie near the critical point cas01 of a shape phase transition from spherical to quadrupole-deformed ground states characterized by a soft potential in the degree of freedom iac01 . The corresponding shape fluctuations may thus enhance the width of the resonance peaks which, in turn, may hinder a clear discrimination of the and 1 branches. This cannot be modeled presently in the SSRPA calculations, which start from a well-defined deformation. It is therefore of interest to extend the experiments to 154Sm with a well-defined prolate-deformed g.s. predicted by all models. Figure 38 compares the result of a 154Sm(p,p′) experiment performed at RCNP (red) kru14 with photoabsorption cross sections from (,xn) (green) car74 and (,n) (blue) fil14 experiments. The (p,p′) result does show a double-hump structure and agrees within error bars, but with a slightly reduced maximum of the peak and slightly increased peak compared to the Saclay data. One should note that the analysis of the (p,p′) data is based on PTA data and still contains the contributions from the ISGMR and ISGQR. A corrected analysis using the subtraction procedure described in ref. don18 is in preparation. The finding of a reduced ratio is qualitatively consistent with a global reanalysis of data taken with the Saclay method, which indicates that the (,n) cross sections are systematically too large and the (,2n) cross sections too small var14 . We also note that new measurements of (,xn) cross sections for the deformed nuclei and with laser-Compton backward-scattering gamma rays at New SUBARU utspc show different relative strengths between the two components compared with previous results ber75 .
5 Spin-magnetic dipole response
5.1 Spin-M1 resonance in heavy nuclei
A test case for the approach presented in sec. 3.4 is 208Pb, where information on the electromagnetic M1 strength is claimed to be complete las88 . Figure 39(a) presents the combined data of las88 and (n,) koh87 experiments providing information below and above threshold, respectively. Note that ref. las88 claims some M1 strength below 7 MeV, but the error bars are close to 100%. Furthermore, it is excluded by subsequent NRF experiments rye02 ; shi08 ; sch10 with much improved sensitivity. The B(M1) strength distribution extracted from the M1 part resulting from the MDA of the 208Pb(p,p′) cross sections pol12 is given in Fig. 39(b). The agreement of the energy distribution and total strength is excellent. The seeming discrepancies around 7.5 MeV result from the different binning of the two data sets, as one can see from the running sum [Fig. 39(c)]. The summed strength up to 8 MeV in ref. las88 of is to be compared with 16.0(1.2) from the data. In the energy region between 8 and 9 MeV, previous experiments had limited sensitivity (cf. fig. 6 in ref. koh87 ), which most likely explains why the strength seen in the experiment was missed. A total strength of is deduced for the spin-M1 resonance in 208Pb bir16 .
The result of the 120Sn(p,p*′*) experiment is presented in fig. 40. The distribution peaks at about 9 MeV with a width of about 1.5 MeV (FWHM), which is comparable to 208Pb but with broader tails. The total strength amounts to .
The spin-M1 resonance in heavy deformed nuclei has been studied in forward-angle (p,p*′*) experiments at TRIUMF and shows a broad structure in the excitation region MeV hey10 ; fre90 ; woe94 . A comparison of their result for 154Sm shown in fig. 41 is in good agreement with those from the experiment at RCNP kru14 . For the latter data only a PTA analysis in 200 keV bins was performed. The large error bars are dominated by the limited statistics. The bottom part of fig. 41 compares the running sums. No error bars are shown for the TRIUMF result. In this case, the experimental errors are certainly below 10%, but there is a hard-to-quantify additional systematic uncertainty from the model chosen to describe the quasi-free background in the MDA woe94 .
5.2 Quenching of the isovector strength
It is well known that the axial coupling constant in weak decay – and thus the GT strength – is modified in the nuclear medium with respect to its free value tow87 . Studies of the GT strength in CE reactions have shown that the Ikeda sum rule for nuclei with mass is systematically quenched by a factor of two with respect to shell-model or QRPA predictions ich06 . A similar behavior is expected for the isospin-analog, the isovector spin-M1 (IVSM1) resonance. GT strengths derived from the IVSM1 strength with the aid of eq. (53) do show significant differences from the results of CE reactions in lighter nuclei. These have been interpreted to arise from the different role of meson-exchange currents in vector and axial coupling ric90 ; lue96 ; vnc97 . However, in -shell nuclei a quenching with a factor of two comparable to GT decay strength mar96 has been found for the IVSM1 resonance vnc98 when comparing to shell-model calculations.
In heavy nuclei with shell closures, recent polarized photon scattering experiments at HIS have been able to extract the detailed spin-M1 strength distribution below neutron threshold ton10 ; rus13 ; ton17 . A comparable quenching is observed in this energy region with respect to QPM calculations. Nevertheless, some uncertainty remains because the IVSM1 resonance normally extends across the neutron threshold. The (p,p′) data on 208Pb and 120Sn discussed in sec. 5.1 demonstrate that indeed a considerable fraction of the full IVSM1 strength lies above threshold. The same is true in heavy deformed nuclei hey10 .
The IVSM1 resonance in 48Ca has long been considered as a reference case for the quenching of the spin-isospin response because its strength is largely concentrated in the excitation of a single state at 10.23 MeV. It was first observed in inelastic electron scattering ste83 with a reduced transition strength B(M1) = 3.9(3) . Its particle-hole structure is particularly simple allowing to investigate the role of second-order effects (see, e.g., ref. tak88 and references therein). Furthermore, shell-model calculations including the valence space are possible providing all correlations due to the one-body interaction.
Recently, a new result from a 48Ca(,n) measurement at the HIS facility has been reported tom11 . The deduced B(M1) strength B(M1) of 6.8(5) was almost two times larger. If correct, this value would question our present understanding of quenching in microscopic models, since the consistent shell-model quenching factors of the IVSM1 in -shell nuclei (including 48Ca) vnc98 and GT decay strength mar96 , successfully applied to the modeling of weak interaction processes in stars lan03 , would be challenged. The 48Ca(p,p′) experiment discussed in sec. 4.1 provides an independent result to resolve this discrepancy bir16 . The excitation of the state at 10.23 MeV is by far the strongest line in all spectra as shown by way of example in fig. 42 for . The broad structure peaking at about 18.5 MeV is identified as the IVGDR bir17 . The inset of fig. 42 expands the energy region around the 10.23 MeV peak (note the factor-of-ten difference in the Y axis).
The pure neutron character of the strong M1 transition in 48Ca predicted by the independent particle model was experimentally demonstrated by comparing with its excitation using an IS probe ( scattering) deh84 . In this particular case, the term of the electromagnetic operator of M1 transitions [eq. (52)] cannot be neglected for the extraction of the value because of the interference term. The IS contribution to the (p,p cross sections was estimated by fitting the theoretical angular distributions for IS and IV transitions shown in fig. 28 to the experimental angular distribution.
Extraction of the analog electromagnetic strength requires the inclusion of quenching conveniently implemented in microscopic calculations by effective factors in eq. (52), where denotes the magnitude of quenching. As discussed above, a quenching factor should be applied for the IV strength in -shell nuclei. The quenching factor for the IS part is less well known and one may assume that . However, it is generally expected that isoscalar spin-M1 strength (ISSM1) is less quenched lip84 . A recent study in a series of -shell nuclei discussed in sec. 5.3 indicates that shell-model calculations can describe the ISSM1 strength without the need for a quenching factor mat15 , i.e. . Taking these two extremes one gets a range of possible transition strengths . The same analysis was applied to older data for the 48Ca(p,p reaction at MeV cra83 with very similar results summarized in fig. 43.
Because of the large spin matrix element, the isobaric analog state of the level at 10.23 MeV in 48Ca is prominently excited in the 48Ca(p,n) yak09 and (3He,t) gre07 reactions at high excitation energies in the forward angle spectra. The assumption of equal unit cross sections for (p,p′) and CE reactions based on isospin symmetry provides a relation between the spin-M1 transition strength (B(M1)στ) and the GT strength
[TABLE]
where denotes the isospin of the initial state. Application of eq. (56) leads to B(M1) strengths from the 48Ca(p,n) reaction ranging between 3.45(85) and 4.1(1.0) , depending on the assumption about the IS quenching in the determination of B(M1)στ. The summary of all results in fig. 43 shows that the B(M1) strengths deduced from all three hadronic reactions agree well with each other and with the result from the experiment, in particular if no or little IS quenching is assumed. Even considering the uncertainty due to the unknown magnitude of IS quenching, the large value from the experiment is inconsistent with these results.
For a quantitative interpretation of quenching in microscopic models the full IVSM1 strength must be known experimentally. Eighteen additional M1 transitions in 48Ca were identified in (e,e′) scattering ste83 , whose strength distribution is shown in fig. 44(b). Although individually weak ( ), they sum up to about 1.2 corresponding to roughly 25% of the total B(M1) strength. Most of these transitions were close to the detection limit of the (e,e′) experiment, and there is considerable uncertainty about possible unobserved strength below the detection limit set by the radiative background and the high level density in the spectra at excitation energies above 10 MeV. The 48Ca(p,p′) data are free of instrumental background. Besides the excitation of the E1 and spin-M1 modes, at momentum transfers close to there is only a small contribution from quasi-free scattering, which sets in above the neutron threshold MeV). A MDA of the 48Ca(p,p′) data was performed to extract the spin-flip M1 cross sections mat17 . The resulting B(M1) strength distribution is displayed in fig. 44(a). Arrows indicate experimental upper limits.
The strengths from electron scattering tend to be larger but are still consistent within error bars in many cases. Possible differences between the strengths may be related to the assumptions underlying the analysis of the (p,p′) data discussed in sec. 3.4. For example, orbital contributions – although shown to be weak ric85 – could lead to a systematic enhancement of the strength by constructive interference with the spin part, since the dominant shell-model configurations are the same in all states. For the same reason one could also speculate about a systematic reduction of due to the interference of contributions to the angular distributions. While the shell-model study of 26Mg showed a random sign of the interference in an open-shell nucleus zeg06 , this may be different here because the main components of the wave functions of all excited states are similar.
The present analysis finds 30 M1 transitions compared to 18 seen in ref. ste83 . This may be related to the different sensitivity thresholds in both experiments. For the (e,e*′*) data, a statistical limit due to the radiative tail in the spectra and difficulties to distinguish and form factors for weak transitions dominate the uncertainties. The limits for the (p,p′) data come from the model assumptions of the MDA.
Figure 45 compares the running sums of the B(M1) strengths from both experiments. They exhibit a similar slope and agree within error bars except for the region between 10.5 and 11.5 MeV, where the present analysis finds a number of weaker transitions not observed in ref. ste83 . However, considering that most of the transitions are near the limits of experimental sensitivity in both experiments and taking into account the effects which may modify their relative ratio discussed above, the agreement is good. The good correspondence suggests that there is little additional fragmented strength hidden in the data. Accordingly, the quenching factor for strength deduced from the comparison of large-scale shell-model calculations with (e,e′) data on the IVSM1 resonance in nuclei lan04 ; vnc98 is confirmed.
5.3 Quenching of the isoscalar strength
While the quenching of IV spin-flip transitions has been studied extensively as discussed in the previous section, much less is known for IS transitions. In most cases IS and IV contributions to spin-M1 transitions compete in (p,p′) scattering and because of the dominance of the over the part of the effective proton-nucleus interaction lov81 , the IS cross sections are small (see fig. 28 for an example) and thus hard to determine. A clear distinction is possible though for targets with g.s. isospin , where isospin symmetry requires and final state isospins for IS and IV transitions, respectively. Pure IS and IV spin-M1 transitions can be distinguished by their different angular distributions (cf. fig. 18).
Forward-angle inelastic proton scattering by the nuclear interaction is the preferred probe for experimental investigations of the ISSM1 response because of the additional orbital contributions of M1 transitions excited in electromagnetic reactions. -shell nuclei are particularly suited for experiments since effective shell-model interactions provide an excellent description of the magnetic dipole moments and transition strengths. Various theoretical studies bro87 ; tow87 ; ari87 suggest that the quenching of IS spin- transitions in -shell nuclei should be similar to that of the IV ones. Several experimental studies have been performed with conflicting results ana84 ; cra89 . It was not clear to what extent they were caused by limitations with respect to the sensitivity of the assignments of excited states or by the model for the conversion from the differential cross sections to transition strengths.
The (p,p′) setup at RCNP has been used to systematically study the spin-M1 strength in nuclei from 12C to 40Ca mat10 . While results for the IVSM1 strength in -shell nuclei agrees fairly well with previous studies ric90 ; cra89 , significant differences are found for the ISSM1 strength mat15 . Figure 46 presents the sum of the squared spin-M1 matrix elements, defined for IS (operator ) and IV (operator ) transitions as
[TABLE]
for 24Mg, 28Si, 32S and 36Ar up to MeV. The initial state spin () is zero for all target nuclei. Shell-model calculations with the USD interaction bro87 are shown by the solid lines. The dashed lines are scaled by the ratio of the effective spin factors to their free values. (We note that the difference between predictions of the summed strengths using the USD and the newer USDA/B interactions bro06 ; ric08 is less than 10% and thus not significant in the following discussion). Averaging over the nuclei measured, one obtains quenching factors and for the IS and IV spin- strengths, respectively. The quenching factor of the IS spin- transitions is consistent with unity within error bars, while that of the IV ones is significantly smaller and in agreement with the studies of the analogous GT transitions and87 ; and91 .
The present result shows that the widely-used effective -factors lead to an over-quenching for IS spin- transitions in the -shell. Effective IS -factors were introduced to reproduce the diagonal spin matrix element of the ground state, see eq. (20) in ref. bro83 . Experimental values were obtained from the IS magnetic moments of mirror nuclei and subtracting the contribution of the total angular momentum . Although the quenching of in nuclei with closed--shell plus/minus one nucleon is obvious bro87 ; tow87 ; ari87 , the quenching in the middle of the -shell seems to be insignificant bro83 . The finding is consistent with the present observation of no quenching of ISSM1 transitions in open -shell nuclei.
In order to shed further light on these observations, one can consider the difference between the summed ISSM1 and IVSM1 transition strengths
[TABLE]
where it is assumed that summing the experimental results up to MeV exhausts the strengths. With the total spin operators for protons (neutrons)
[TABLE]
the spin-M1 transition strengths can be rewritten as mat15
[TABLE]
where the expectation values are taken for the 0+ ground state. Insertion into eq. (59) leads to
[TABLE]
i.e., the difference of total ISSM1 and IVSM1 strengths is related to the spin correlation between protons and neutrons in the ground state.
Figure 47 presents experimental and theoretical results for eq. (62) in several shell regions. values from state-of-the-art nuclear structure calculations for 4He using the Correlated Gaussian (CG) method suz08 and No-Core Shell Model (NCSM) bar13 are displayed in fig. 47(a). Positive values are obtained for realistic AV8’ pud97 , G3RS tam68 ) and chiral ent03 NN forces due to the inclusion of tensor correlations, in contrast to the Minnesota tho77 interaction, which does not contain the tensor force. Figure 47(b) compares experimental results for in 12C derived from (p,p*′) mat10 and (e,e′*) vnc00 experiments with values obtained from shell-model calculations. Both the experiments and the NCSM with realistic forces show positive values while a calculation using the effective interaction of ref. suz03 gives a slightly negative value. Finally, fig. 47(c) shows values derived from the (p,p′) data for -shell nuclei in comparison to the shell-model calculations using the USD interaction discussed above. The data exhibit positive values as in 12C and are comparable to the values predicted with realistic forces for lower-mass nuclei. In contrast, the shell-model calculations are unable to reproduce the experimental results independent of the correction by the ratio of the effective spin -factors to their free values.
However, predictions by the NCSM (open blue circles) indicate positive values for () and (). Here, defines the maximal allowed harmonic-oscillator excitation energy above the unperturbed ground state bar13 and hence represents a measure of the model space. The results (, 0.028, and 0.072 for = 0, 2, and 4 for and and 0.011 for =0 and 2 for 24Mg, respectively) show a clear correlation with the size of but represent a lower boundary only because they are not converged yet for the present values. The increase of with increasing implies that mixing with higher-lying orbits due to tensor correlations is important for reproducing values. This should be verified in future NCSM calculations, which might be possible up to for the nuclei under investigation rothpc .
We note that both the observed isoscalar and isovector strengths, and thus , are reproduced in a shell-model calculation by enhancing the isoscalar spin-triplet pairing interaction and by introducing the -hole coupling effect sag16 ; sag18 .
6 Fine structure of the IVGDR
Fine structure of the giant resonances in heavy nuclei has been observed for many different modes like the IVGDR iwa12 ; pol14 , the ISGQR she04 , the GT resonance kal06 , or the magnetic quadrupole resonance vnc99 . For the IVGDR fea18 ; bir17 ; jin18 and the ISGQR she09 ; usm11 ; usm16 it has been demonstrated to appear across the nuclear chart. The phenomenon of fine structure is also independent of the exciting probe provided the reaction is selective for the mode under investigation. This is illustrated in the l.h.s. fig. 48 for the case of the IVGDR (an example for the ISGQR is shown in ref. kam97 ), which compares spectra of 28Si in the IVGDR energy region from different probes fea18 . These sets of high-resolution data are from (a) the 28Si(p,p′) reaction, (b) the 28Si reaction ric85 , (c) the 27Al reaction sin65 , and (d) the 27Al reaction law65 ; put68 . It is expected that reactions (a)-(c) predominantly excite the IVGDR and indeed all three reactions show very similar structures. Reaction (d) favors isospin states in 28Si and is therefore not selective towards levels. The spectrum clearly shows different patterns compared with spectra (a)-(c).
6.1 Quantitative characterization with a wavelet analysis
Wavelet transforms are an established tool to analyze different types of signals hidden in fluctuating quantities, e.g., as a function of time or energy. They are used in diverse areas, such as image processing and data compression dau92 ; byr92 , meteorology tor98 , astrophysics ire99 or accelerator physics fed98 . Wavelet analysis can be regarded as an extension of the Fourier analysis, which allows to conserve the correlation between the observable and its transform.
In the present case, energy spectra of nuclear giant resonances are analyzed. The coefficients of the wavelet transform are then defined as
[TABLE]
They depend on two parameters, the scale stretching and compressing the wavelet function , and the position Ex shifting the wavelet function in the spectrum . The variation of the variables can be carried out using continuous or discrete steps called continuous (CWT) and discrete (DWT) wavelet transform, respectively. The analysis of the fine structure of giant resonances is performed using CWT, where the fit procedure can be adjusted to the required precision. Applications of the CWT to high-resolution nuclear spectra of giant resonances are described in refs. she04 ; she09 ; fea18 ; pol14 ; usm16 ; pet10 ; kur18 . Further details and a comparison with other techniques for the analysis of fine structure in nuclear giant resonances can be found in ref. she08 .
The choice of the wavelet function plays an important role in the analysis. In order to achieve an optimum representation of the signal using wavelet transformation one has to select a function which resembles the properties of the studied signal . In fact, the better the correspondence between the shape of and the signal is, the larger is the wavelet coefficient. A maximum of the wavelet coefficients at certain value E indicates a correlation in the signal at the given scale, called characteristic scale. The best resolution for nuclear spectra is obtained with the so-called Morlet wavelet (cf. fig. 9 in ref. she08 ) because the detector response is typically close to the Gaussian line shape and the Morlet wavelet is a product of Gaussian and cosine functions
[TABLE]
As an example, a CWT analysis of a 208Pb(p,p′) excitation spectrum in the energy region of the IVGDR and for scattering angles is discussed. At these extreme forward angles Coulomb excitation dominates the cross sections and nuclear transitions are suppressed with the exception of the isovector spin-flip resonance. The excitation energy region below 9 MeV, where the spin- mode is located and contributes significantly to the cross sections (cf. sec. 5.1), is thus excluded. In order to search for characteristic scales it is helpful to construct the power spectrum of the signal, i.e. the projection of the absolute values of the wavelet coefficients on the scale axis.
In Fig. 49 the excitation energy spectrum (upper right) and corresponding absolute values of the wavelet coefficients (middle and lower right) are plotted. White regions indicate the smallest values of the wavelet coefficients, while dark (blue) ones denote maxima, i.e. characteristic scales. One identifies scale values where the absolute values of the wavelet coefficients show a local maximum, albeit with a characteristic minimum/maximum variation as a function of excitation energy induced by the oscillating wavelet function. For a better recognition of such characteristic scales, power spectra are plotted (middle- and lower-left). The power values are divided by the corresponding scale in order to remove a trivial increase with increasing scale liu07 . The middle panel shows the scale region up to 7 MeV, while the lower panel gives an enlarged view of the region below 1 MeV. Local maxima indicated by the horizontal arrows in the power spectra are identified as characteristic scales. Note that these can appear as a peak but also as a shoulder on the flank of another, more prominent scale, like the one at about 4 MeV. The relation of characteristic scales to specific giant resonance decay mechanisms is discussed in sec. 6.2.
Another application of the CWT is presented on the r.h.s. of fig. 48 discussed above. The different reactions selective towards population of the IVGDR in 28Si exhibit very similar power spectra and characteristic scales, while the power spectrum of reaction (d) is distinctively different. The impact of choosing different excitation-energy windows for the CWT analysis is illustrated by the dashed ( MeV) and full ( MeV) lines and found to be small.
An exact spectrum decomposition can be achieved with the DWT, where scales and positions in the wavelet analysis are varied by powers of two. It works by filtering and provides two signals in each step , approximation and detail . Application of the method to the spectrum of the 208Pb(p,p′) reaction is shown in fig. 50. The approximation is the large-scale or low-frequency component of the signal, and the detail corresponds to the small-scale or high-frequency part for a given scale region analogue to the effect of high- and low-pass filters in an electric circuit. In each step of the decomposition, the initial signal can be reconstructed as
[TABLE]
This operation can be repeated until the individual detail consists of a single bin.
A DWT can only be performed with a certain class of wavelets possessing a so-called scaling function she08 . This is not the case for the Morlet wavelet, thus the Bior3.9 wavelet function mal98 is used in the example, which has a similar form (cf. fig. 9 in ref. she08 ). Each wavelet function can be characterized by its number of vanishing moments,
[TABLE]
For Bior3.9 the number is equal to three, i.e. any background in the spectrum that can be approximated by a quadratic polynomial function does not contribute to the wavelet coefficients.
The largest characteristic scale in the spectrum is given by the total width of the IVGDR and should thus show up in the approximations. Indeed, approximation provides a very good description of the broad structure in the experimental spectrum displayed in the top row of fig. 50. Thus, the next approximation A10 can be considered to describe the shape of non-resonant contributions to the spectrum.
6.2 Characteristic scales and giant resonance decay mechanisms
Giant resonances are elementary excitations of the nucleus and their understanding forms a cornerstone of microscopic nuclear theory. They are classified according to their quantum numbers (angular momentum, parity, isospin). Gross properties like energy centroid and strength in terms of exhaustion of sum rules are fairly well described by microscopic models har01 . However, a systematic understanding of the decay widths is still lacking.
The giant resonance width is determined by the interplay of different mechanisms illustrated in fig. 51: fragmentation of the elementary 1p-1h excitations (Landau damping ), direct particle decay out of the continuum (escape width ), and statistical particle decay due to coupling to 2p-2h and many particle-many hole (np-nh) states (spreading width )
[TABLE]
This scheme implies a hierarchy of widths and timescales resulting in a fragmentation of the giant resonance strength in a hierarchical manner bbb98 . An important theoretical problem is to explain the nature of couplings between the levels in this hierarchy, and to predict the scales of the fragmentation of the strength which arise from it.
A powerful approach to investigate the role of the different components are coincidence experiments, where direct decay can be identified by the population of hole states in the daughter nucleus and the spreading width contribution can be estimated by comparison with statistical model calculations (see, e.g., refs. str00 ; bol88 ; die94 ; hun03 ). Recently, alternative methods have been developed based on a quantitative analysis of the fine structure of giant resonances observed in high-resolution inelastic scattering and charge-exchange reactions. These new methods for the extraction of such scales include the local scaling dimension approach aib99 , the entropy index method lac00 , and the use of wavelet techniques she08 ; hei10 . Of these, wavelet analysis has been established as a particularly successful approach she08 .
A direct interpretation of the wavelet scales as underlying widths, respectively a characteristic time scale, is not possible because the wavelet analysis is also sensitive to spacing, and both effects are intertwined in the power spectrum. Therefore, one needs microscopic calculations of the giant-resonance strength including one or several of the possible giant-resonance decay mechanisms. The CWT can be applied to the model results and the resulting scales compared to experiment. At present there are no calculations available including all three mechanisms. RPA results account for Landau damping and extensions to include the spreading width via coupling to the continuum or 2p-2h configurations at various levels of approximation have been formulated for nonrelativistic and relativistic interactions.
Taking again the IVGDR in 208Pb as an example, the escape width is expected to make a minor contribution in heavy nuclei and the focus is on the possible role of the spreading width. The 2p-2h states, or more specifically the coupling to low-lying surface vibrations ber83 , was shown to be the mechanism responsible for the fine structure observed in the ISGQR she04 ; she09 . Results of the CWT analysis for microscopic calculations of the electric dipole response in 208Pb with the quasiparticle phonon model (QPM) and relativistic RPA (RRPA) are discussed here. Both models allow for the inclusion of complex configurations. Therefore, besides calculations on the 1p-1h level (called QPM 1-phonon and RRPA, respectively), also extensions including 2p-2h states (called QPM and relativistic time-blocking approximation (RTBA), respectively) are considered. A general description of the QPM can be found in ref. sol92 and of the RTBA in ref. lit07 . Details of the present QPM calculations are discussed in refs. rye02 ; tam11 ; pol12 .
The experimental cross sections at (l.h.s.) and the power spectrum (r.h.s.) resulting from the CWT analysis are plotted in fig. 52(a) together with the B(E1) strength distributions obtained with the different models in fig. 52(b-e). It should be noted that the experimental spectrum does not represent the B(E1) strength but the Coulomb-excitation cross section, which is modified by the virtual-photon spectrum discussed in sec. 3.3. Extraction of the B(E1) distribution is possible (cf. Refs. tam11 ; pol12 ). However, the need to disentangle the E1 cross section from other contributions can only be achieved for larger energy bins, where the information on the fine structure is partially lost. A conversion of the experimental Coulomb cross sections to B(E1) strength would lead to a slight shift (%) of the characteristic scales and a relative increase of the average power towards higher excitation energies.
As shown in fig. 52(b), a QPM calculation on the RPA level results in a B(E1) strength distribution dominated by 5 transitions distributed between 11 and 15 MeV with a centroid energy of 13.25 MeV (defined as , where denotes the th moment of the distribution). The experimental centroid energy of 13.43 MeV is fairly well reproduced. Inclusion of 2-phonon configurations, fig. 52(c), leads to fragmentation but the dominant 1p-1h transitions remain and the centroid energy is unaffected. A similar comparison of RRPA, fig. 52(d), and RTBA, fig. 52(e), results shows somewhat larger differences of the distributions although the centroid energy is hardly changed (13.01 MeV for RRPA and 13.06 MeV for RTBA, respectively).
Since there is no absolute scale, the corresponding CWT power spectra shown on the r.h.s. of fig. 52 are normalized relative to each other. They provide a qualitative measure for the ability of different models to describe fine structure and characteristic scales. Overall, both models broadly reproduce the variation of power with scale value but the scale values of power maxima and minima are better reproduced by the QPM. However, the relative ratio of maxima at smaller and larger scales is predicted to decrease in the QPM while experiment shows an increase Here, the RTBA result is closer to the data. The region of scales in the figure is restricted to 2 MeV because the theoretical calculations show limited power at even larger scale values, in contrast to the experiment. This finding may be related to neglecting the coupling to complex states beyond the 2p-2h level in the models.
The comparison of figs. 52(b,c) and (d,e) allows to extract information on the damping mechanism responsible for the fine structure. Clearly, the QPM results show structure already at the 1-phonon level. While the appearance of scales MeV can be easily understood by the spacing of the five dominant transitions, the wavelet analysis of the 1-phonon results (b) also finds characteristic scales with smaller values MeV. The similarity between the power spectra and scales deduced from the QPM calculation for a 1-phonon model space with those including two-phonon states suggests that the fragmentation of 1p-1h transitions (i.e., Landau damping) is the most important mechanism leading to fine structure of the IVGDR in 208Pb. While the relative weight changes, major scales are also found at about the same energies in the CWT analysis of the RRPA (d) and RTBA (e) results. The observation of characteristic scales in the RRPA calculation again supports an interpretation of Landau damping as a main cause of the fine structure of the IVGDR in 208Pb. Similar conclusions are drawn in lighter nuclei jin18 . An in-depth discussion of the relation between the wavelet analysis of spectra of the IVGDR and ISGQR and different damping mechanisms can be found in ref. vnc19b .
A surprising result of the high-resolution (p,p′) experiments is that the fine structure prevails in heavy deformed nuclei despite many-orders-of-magnitude larger LDs than in closed-shell or vibrational nuclei. Indeed, wavelet analysis provided the first clear experimental signature for splitting of the ISGQR in heavy deformed nuclei kur18 . Unlike the IVGDR, where splitting is already visible in the gross structure ber75 , the average separation of components of the ISGQR is smaller than the average width and the width exhibits a broadening only with respect to spherical nuclei.
Here, we discuss whether characteristic scales of the fine structure in a heavy deformed nucleus (150Nd) can be related to the components of the IVGDR. The upper part of Fig. 53 shows on the l.h.s. a spectrum of the 150Nd(p,p′) reaction measured at iThemba LABS don18 and the corresponding CWT and on the r.h.s. the power spectra of the full data (solid line) and a separation into (dash-dotted) and (dotted) components. The latter were produced summing over parts of the spectrum ( MeV for , MeV for ), where one of the components dominates. The power spectra do show distinctive differences in the two excitation regions with the strongest scales at about 1.5 MeV and 860 keV appearing in the low-energy() and at 680 keV in the high-energy () part only. The peak in the total power spectrum at about 740 keV seems to be the unresolved superposition of a scale at about 860 keV and a scale at about 680 keV.
The lower part of fig. 53 displays the results of an analogous analysis of a 150Nd photoabsorption spectrum calculated with a Skyrme separable RPA (SSRPA) approach kle08 . It provides a good description of the experimental data (red line). The corresponding power spectra show a picture very similar to the experimental results with different scales for the and components and bumps in the total power spectrum resulting from the superposition of and 1 scales. Further details of such an analysis can be found in ref. don16 .
6.3 Level densities
In the following, we describe how level densities can be extracted from the (p,p′) spectra with a fluctuation analysis. The method was originally proposed to analyze -delayed particle emission spectra jon76 , but later it was successfully adopted for the study of electron scattering data mue83 ; kil87 and can be used in general for high-resolution spectra of nuclear reactions (see, e.g., refs. kal07 ; kal06 ; end97 ). The analysis takes advantage of the autocorrelation function in order to obtain a measure of the cross-section fluctuations with respect to a stationary mean value.
The method can be applied in an energy region where the mean level spacing is smaller than the experimental energy resolution . One has to distinguish between two possible cases: (i) , i.e., the mean level width is smaller than the average distance between levels and the fluctuations result from the density of states and their incoherent overlap, and (ii) , so-called Ericson fluctuations eri60 , which result from the coherent overlap of the states. In principle, it is possible to utilize the method in the Ericson regime, but the statistics has to be very high because of the large number of open decay channels. Thus, in practice one is usually limited to the regime .
The application of the fluctuation analysis is based on the assumption that the average spacing and intensity distributions can be described by random matrix theory (RMT) wei09 ; mit10 , i.e., the average spacing can be described by a Wigner distribution and the transition strengths by a Porter-Thomas distribution. This is motivated by the good description of nuclear excitations in the vicinity of the neutron separation energy by RMT haq82 .
The main steps of the fluctuation analysis are demonstrated for the 208Pb(p,p′) data in the excitation-energy region of the IVGDR. In order to obtain a spectrum containing only the information needed, one has to subtract any background not arising from excitations of the nuclear mode under investigation (a). In the present case, there are two independent results from the MDA (sec. 3.1) and DWT (sec. 6.1), fig. 54(a). After background subtraction, the spectrum contains the information on the fluctuations in the spectrum of the IVGDR. In order to eliminate the fluctuation contributions arising from finite statistics, the spectrum is folded with a Gaussian function with a width chosen to be smaller than the experimental energy resolution. The resulting spectrum is shown as green solid line in fig. 54(b). Similarly, a second spectrum is created by the convolution with a Gaussian function, whose width is at least two times larger than the energy resolution in the experiment in order to remove gross structures from the spectrum (dashed line).
The dimensionless stationary spectrum defined by
[TABLE]
is shown in fig. 54(c). As a result of the normalization on the local mean value, the energy dependence of the cross sections vanishes. The value of is sensitive to the fine structure of the spectrum and distributed around an average intensity . With increasing excitation energy the mean level spacing is decreasing, and in turn the oscillations of are damped. A quantitative description is given by the autocorrelation function
[TABLE]
The value is nothing but the variance of
[TABLE]
According to ref. jon76 , this experimental autocorrelation function (d) can be approximated by an expression
[TABLE]
where the function depends on the experimental parameters (energy resolution, smoothing widths) only. The value is the sum of the normalized variances of the assumed spacing () and transition width () distributions
[TABLE]
If only transitions with the same quantum numbers contribute to the spectrum, then can be directly determined as the sum of the variances of the Wigner and Porter-Thomas distributions, . The mean level spacing is proportional to the variance of and can be extracted from the value of . The nuclear level density can then be determined from the mean level spacing as .
The experimental level densities of 1- states in 208Pb determined for the two different approaches of background subtraction are shown in fig. 55 as open and full circles, respectively. For the fluctuation analysis the considered excitation-energy interval between 8.5 MeV and 16 MeV was split into subintervals of 0.5 MeV length and the mean level spacing was determined in each bin. However, insufficient statistics of the experimental spectrum or the onset of the Ericson fluctuations lead to a drop of deduced level densities in the excitation-energy region above 12 MeV. The phenomenon has also been observed in a similar analysis of resonances in electron scattering data vnc99 . Repetition of the analysis using spectra for different angle bins suggests an excitation energy region MeV in which the fluctuation analysis can be applied in the presented example.
The experimental results are compared in fig. 55 with different parameterizations of the back-shifted Fermi gas (BSFG) rau97 ; egi05 and constant temperature (CT) models egi09 and with microscopic calculations performed in the framework of a Hartree-Fock-Bogoliubov (HFB) gor08 or a Hartree-Fock-BCS approach dem01 . Good agreement with the BSFG parameterization of ref. rau97 is found. The constant temperature model of ref. egi09 reproduces correctly the energy dependence but gives two times higher level densities. All other models including the BSFG parameterization of ref. egi05 and the microscopic HFB gor08 and HF-BCS dem01 approaches fail to reproduce the magnitude and the energy dependence of the experimental data.
As pointed out above, fine structure of giant resonances is a global phenomenon. This has been utilized to test predictions of a possible parity dependence of the LD nak97 ; hil06 ; hou09 with impact on astrophysical reaction network calculations by a fluctuation analysis of spectra of the ISGQR and M2 resonances populating and states in the same nuclei, respectively kal07 . In a similar way, data for different giant resonances in the same nucleus may contribute to improve our limited knowledge of the spin dependence vnc19a . As an example, a set of high-resolution spectra of the ISGQR she09 , the IVGDR measured at RCNP, and the ISGMR measured recently with scattering at the setup iThemba LABS are shown in fig. 56 for the nucleus 58Ni, providing information on the LDs. Such combined data now exist for various nuclei and a systematic analysis is underway.
7 Gamma strength function
The GSF describes the average -decay behavior of a nucleus. In general, all multipoles allowed for electromagnetic processes contribute but in practice E1 dominates. Thus, the isovector giant dipole resonance (IVGDR) dominates the GSF at higher excitation energies, but M1 (and E2) can also contribute to the total GSF. For the special case of decay to the g.s. the GSF can be related to the photoabsorption cross section by the principle of detailed balance
[TABLE]
where are the spins of excited and ground state (g.s.), respectively, denotes the electric or magnetic character, and the multipolarity. The brackets indicate averaging over an energy interval. Thus, g.s. photoabsorption experiments are a possible source of information on the GSF.
7.1 Test of global parameterizations
Many applications require information on the GSF for a large variety of nuclides and often no experimental data are available. Thus, a large effort is made to construct systematic parameterizations summarized in the RIPL-3 data library cap09 . In this section, we briefly demonstrate how the (p,p′) data can contribute to critically test these parameterizations. Again, we use the 208Pb results as a representative example.
The photoabsorption cross sections in 208Pb determined from the analysis described in sec. 3.3 can be converted to the E1 GSF with the aid of eq. (73). Figure 57 displays the result in comparison with three widely used models and with a GSF value at the neutron separation threshold deduced from experimental systematics over a wide mass range cap09 . Two of the models for the description of the E1 GSF are a standard Lorentzian (SLO) and an enhanced generalized Lorentzian (EGLO). The EGLO consists of two terms kop93 , a Lorentzian with an energy- and temperature-dependent width and a term describing the shape of the low-energy part of the GSF allowing for a finite GSF at zero temperature. The temperature dependence is estimated within Fermi liquid theory. The modified Lorentzian model (MLO) is based on general relations between the GSF and the imaginary part of the nuclear response function predicting an enhancement of the GSF with increasing temperature. The energy- and temperature-dependent width is calculated with micro-canonically distributed initial states plu99 . For details of the models see ref. cap09 .
The predictions for 208Pb are shown in Fig. 57 as green (SLO), magenta (EGLO), and cyan (MLO) curves. In the region around the maximum of the IVGDR all models provide a good description of the data. The high-energy tail of the IVGDR is well described by SLO and MLO while EGLO overestimates the photoabsorption cross sections. In 208Pb, the low-energy tail of the IVGDR exhibits strong fluctuations which complicate the comparison with smooth strength functions. For excitation energies down to about 8 MeV, MLO describes the average behavior fairly well while SLO(EGLO) are roughly consistent with the upper(lower) limits of the fluctuations but over(under)estimate the average cross sections. Between 6 and 8 MeV a resonance-like structure dominates the GSF identified as the PDR in 208Pb pol12 . This low-energy resonance is not included in the models. Finally, the GSF value expected at the neutron threshold ( MeV in the present case) from experimental systematics of neutron-capture cross sections (black circle) is almost an order of magnitude smaller than the experimental strengths in the PDR. However, this may be an artefact of the unusually low level density in the doubly magic nucleus 208Pb with corresponding strong fluctuations of individual strengths at energies close to the neutron threshold (note that the experimental GSF values correspond to energy bins rather than to individual transitions for excitation energies above 7 MeV (cf. table I in ref. pol12 ).
Figure 58 presents the M1 part of the GSF deduced with the method described in sec. 3.4 in comparison with SLO, EGLO, and MLO model predictions for 208Pb. The M1 GSF model results are derived from the E1 models by applying an empirical mass-dependent correction and assuming a SLO parameterization of the spin-flip M1 resonance with an energy centroid and MeV kop87 . Obviously, the assumed resonance properties represent a poor approximation of the data only. The theoretical maxima are about 500 keV too low and the experimental width is grossly overestimated. As a result, the predicted total strengths of the spin-flip M1 resonance exceed the experimental value bir16 by factors ranging from two (EGLO) to five (SLO).
The E2 contribution to the GSF can be estimated using the MDA results of an , scattering experiment you04 . The resulting ISGQR strength distribution exhausts of the energy weighted sum rule (EWSR). Figure 59 summarizes the E1, M1 and E2 contributions to the total GSF. As can be seen, E1 strength dominates at all energies. The M1 contribution is of the order of a few percent for excitation energies above 8 MeV and reaches about 10% (up to 30% in a single bin) near the peak of the M1 resonance. The E2 contribution is of comparable magnitude to M1 but located at higher excitation energies. Because of the simultaneous strong rise of the E1 part in the IVGDR energy region the E2 contribution to the GSF at the maximum of the E2 resonance is about 1% only.
7.2 Validity of the Brink-Axel hypothesis in the PDR energy region
Knowledge of the GSF is required for calculations of statistical nuclear reaction in astrophysics arn07 , reactor design cha11 , and waste transmutation sal11 . Most applications imply an environment of finite temperature, notably in stellar scenarios wie12 , and thus reactions on excited states (e.g., in a (n,) reaction) become relevant. Their contributions to the reaction rates are usually estimated applying the Brink-Axel (BA) hypothesis bri55 ; axe62 illustrated in fig. 60. Historically, it was formulated for the IVGDR stating that the strength function built on an excited state is the same as on the g.s. (l.h.s. of fig. 60). It was shown to hold approximately for not too high temperatures bbb98 . Later, it was generalized to hold for absorption and decay applying the principle of detailed balance (r.h.s. of fig. 60). Then, the GSF becomes independent of initial and final state energy and depends on the energy only. This is nowadays a commonly used assumption to calculate the low-energy E1 and M1 strength functions of astrophysical interest. However, recent theoretical studies joh15 ; hun17 put that into question demonstrating that the strength functions of collective modes built on excited states do show an energy dependence. However, numerical results for E1 strength functions in light nuclei showed an approximate constancy consistent with the BA hypothesis joh15 .
The so-called Oslo method, where primary spectra of decay following compound nuclear reactions are extracted, is a major source of data on the GSF below the particle thresholds. Since the transmission probability is proportional to the product of the GSF and the final-state LD, assumption of the generalized BA hypothesis is a prerequisite of the analysis sch00 . Recent Oslo-type experiments have indeed demonstrated independence of the GSF from excitation energies and spins of initial and final states in a given nucleus in accordance with the BA hypothesis lar17 ; gut16 ; cre18 . However, there are a number of results which clearly indicate violations in the low-energy region when comparing emission and absorption experiments. For example, the GSF in heavy deformed nuclei at excitation energies of MeV is dominated by the orbital M1 scissors mode boh84 and potentially large differences in B(M1) strengths are observed between upward end05 and downward gut12 ; ang16 GSFs. Furthermore, at very low energies ( MeV) an increase of GSFs is observed in Oslo-type experiments lar17 ; voi04 , which cannot have a counterpart in ground state absorption experiments on even-even nuclei because of the pairing gap.
For the low-energy E1 strength in the region of the PDR, the validity of the BA hypothesis is far from clear when comparing results from the Oslo method with photoabsorption data. Below particle thresholds most information on the GSF stems from nuclear resonance fluorescence (NRF) experiments, which suffer from the problem of unobserved branching ratios to excited states. These can be corrected, in principle, by Hauser-Feshbach calculations assuming statistical decay rus09 . The resulting correction factors are sizable and show a strong dependence on the neutron threshold energy and the g.s. deformation. On the other hand, there are clear indications of non-statistical decay behavior of the PDR from recent measurements rom15 ; loe16 ; isa19 . Violation of the BA hypothesis was also claimed in a simultaneous study of the reaction and average ground-state branching ratios ang12 in 142Nd (see, however, the erratum ang15 to ref. ang12 ). Clearly, information on the GSF in the PDR energy region from independent experiments is called for. The (p,p′) experiments described in this review are almost ideal for this purpose, since they simultaneously provide the E1 and (spin-)M1 part of the GSF and – with a completely independent method – also the level density.
The total GSF of 208Pb is displayed in fig. 61 (blue diamonds) and compared with reanalyzed bas16 data derived with the Oslo method from a 208Pb(3He,3He) experiment (red squares) sye09 . There are overlapping results from both experiments in the energy region between 5 and 8 MeV (see inset of fig. 61). The GSF derived from the (p,p data is systematically higher in the PDR region although they seem still compatible within error bars in the peak region around the neutron threshold. Between 6 and 7 MeV consistent results are found while below 6 MeV the strong transitions observed in ref. pol12 exceed the average strength in the Oslo data by factors 4 to 5. However, one should be aware that single transitions are analyzed for excitation energies MeV pol12 and the level density of states excited from the ground state is probably too low to discuss an average behavior in the PDR region. Rather, the upward GSF is dominated by Porter-Thomas intensity fluctuations.
The LD of states in 208Pb in the excitation energy region from 9 to 12.5 MeV was determined from the (p,p′) data pol14 as discussed in sec. 6.3. In order to compare with the results from the Oslo experiment, it must be converted to a total LD. The corresponding spin distribution was calculated with the aid of systematic BSFG parameterizations and their variation was taken as a measure of the systematic uncertainty of the procedure (for details see ref. bas16 ). Figure 62 displays the resulting total LD (blue diamonds) together with results from the Oslo experiment (red squares), from level counting heu16 (black triangles) at lower energies and the data point at the neutron threshold from neutron capture cap09 (black square). Several BSFG model results are shown as solid cap09 , dashed rau97 and dotted sye09 lines, respectively. The RIPL-3 parameterization cap09 provides a very satisfactory description of all experimental data indicating that the decomposition into GSF and LD in the Oslo method is essentially correct.
Another study of this type was performed for 96Mo mar17 , a considerably deformed nucleus with LDs high enough to permit a comparison with the GSF from a decay experiment averaging over appropriate energy intervals. The choice of 96Mo was motivated by the large discrepancies of GSFs derived from Oslo gut05 ; lar10 and NRF rus09 experiments. The top part of Fig. 63 summarizes the available GSF data. The energy region below neutron threshold is expanded in the bottom part showing the results from the Oslo (open circles), the NRF (black circles) and the (p,p′) experiments (red circles). For energies between 6 and 8 MeV covered by all experiments, the GSF deduced from Coulomb excitation lies between the two other results but overall agrees better with the Oslo result. The LD deduced from the (p,p*′*) data can again be described consistently with the Oslo results at lower energies using BSFG model parameterizations. For details see ref. mar17 .
8 Conclusions and outlook
This review presents a new approach to study the electric and spin-magnetic dipole strength distributions in nuclei based on very forward-angle inelastic proton scattering including at energies of a few 100 MeV, where these modes dominate the cross sections. Their decomposition can be achieved with two independent methods based on the momentum-transfer (or angle) dependence of the cross sections (MDA) or on polarization-transfer observables (PTA). Since the cases studied so far do show good correspondence of the two methods, future experiments can restrict themselves to the MDA avoiding the long measurement times needed for statistical significance of polarization-transfer observables determined in a secondary scattering process. Systematic uncertainties of the MDA at higher excitation energies are presently mainly determined by the assumptions about the continuum background, in particular for lighter nuclei. It is dominated by quasi-free scattering and systematic parameterizations are available in the energy range of interest kal90 . However, these do not include data at very small momentum transfers. Thus, future studies – in particular in lighter nuclei, where the Coulomb-excitation cross sections are reduced – would profit from experimental data at higher excitation energies permitting an improved description and reducing the MDA uncertainties.
The few results from the present work on the polarizability already made a significant impact on our understanding of the density dependence of the symmetry energy, a key quantity to understand the formation of neutron skins in nuclei and the EOS of neutron-rich matter governing the properties of neutron stars. Since the relation is model-dependent, systematic studies are needed to single out appropriate theoretical approaches. In heavy nuclei, these are based on mean-field models with either nonrelativistic (Skyrme- of Gogny-type) or relativistic effective interactions roc18 . The situation is reminiscent of the determination of the compressibility of nuclear matter from systematic investigations of the properties of compressional collective modes gar18 . Future experimental work needs to establish the impact of deformation and the role of neutron excess. The latter is best studied in isotopic chains and an investigation of the stable Sn isotopes is especially promising bas18 .
Recently, ab-initio calculations based on chiral effective field theory (EFT) interactions have been developed to study the correlations between , neutron skins and symmetry-energy properties in medium-mass nuclei hag16b ; mio16 . The present work on 48Ca bir17 demonstrates that the polarizability also provides important constraints on the chiral two- plus three-nucleon interactions heb11 ; eks15 used to predict neutron-matter properties. The coupled-cluster approach used to calculate the dipole strength distribution hag14 has been extended to heavier nuclei hag16b and calculations for heavier magic and semi-magic nuclei are within reach hag16b ; gys19 . Recent work also indicates the importance of np-nh correlations for a calculation of the dipole polarizability mio18 . This can be systematically tested by extending the experiments to nuclei with one or two holes or particles outside closed shells. Considering the availability of suitable targets, this can be done in particular around 40Ca and 90Zr.
It is clear that the anticipated new studies of the E1 response in a wide range of nuclei will also offer new insights into the much debated question of the structure underlying the formation of the PDR. The experiments provide the full low-energy IV E1 response independent of the problems of decay experiments discussed in sec. 4.2. These new results will also permit to establish the systematic features of the IV spin-M1 resonance in medium-mass and heavy nuclei allowing, e.g., critical tests of new global parameterizations gor19 . This is not only a genuine nuclear-structure problem hey10 but also impacts the physics of core-collapse supernovae. The IVSM1 strength represents the most important response in neutral-current neutrino-nucleus scattering lan04 ; sul18 , which serves as an important dissipative mechanism in the shock wave lan08 .
With knowledge of the E1 and spin-M1 strength distribution the GSF can be constructed from the (p,p′) experiments (except contributions from the orbital M1 scissors mode at low energies in deformed nuclei hey10 ; gut12 ). These data contribute to the present discussion on the validity of the generalized BA hypothesis underlying all applications of GSFs in statistical model reaction calculations. While the BA hypothesis seems to hold in the energy region of the IVGDR and in quasi-continuum decay it has been questioned for the special case of g.s. absorption experiments at excitation energies around and below the neutron threshold. Recent work trying to map the decay in NRF experiments loe16 ; isa19 indicate non-statistical contributions, and it is speculated that these are related to the states forming the PDR. Again systematics are needed, in particular on the role of g.s. deformation, which determines the relative importance of the IVGDR at low excitation energies. A coordinated program of comparing GSFs deduced from the (p,p′) experiments with those from the Oslo method in the same nuclei using the methods described in sec. 7 is foreseen.
One recent extension of the present studies are coincidence measurements. Since the beam is stopped far from the target position with efficient radiation shielding in the zero-degree setup, detectors sensitive to the surrounding background radiation can be placed close to the target. A first physics measurement has been carried out on and nuclei by placing twenty-five NaI detectors at a distance of 10 cm from the target ree19 . The experiment aims at a measurement of the gamma-emission probability after particle decay of the giant resonances for calibration of neutral-current neutrino detection lan96 by organic liquid scintillators (KAMLAND) KAMLAND or by water Čerenkov detectors (Super Kamiokande) SuperK . The double differential cross section for at MeV is plotted by the solid curve in the upper panel of Fig. 64. The hatched region shows the non-spin-flip cross section determined using the spin-flip probability measured in the same kinematics tam99 . It is almost fully described by the cross section calculated from (,total) photoabsorption cross sections ahr75 ; ful85 with the eikonal approximation (see sec. 3.3). The -emission probability shown in the lower panel of fig. 64 is found to increase with excitation energy up to 27 MeV with a maximum -emission probability of about 50% and then to decrease again.
Furthermore, -coincidence measurements were performed with the CAGRA array (Clover Array Gamma-ray spectrometer at RCNP/RIBF for Advanced research) cagra ; sul18 in a larger campaign at RCNP combining it with the Grand Raiden spectrometer. One of the motivations of the campaign was to study the IS electric dipole strength distribution and the decay of the PDR in nickel, zirconium, tin and lead isotopes. Recently, a pilot experiment testing the feasibility of measurements of direct decay from the IVGDR to the ground or low-lying states with large-volume LaBr3:Ce detectors gia13 has been performed on 90Zr scylla . Also, setups for coincidence measurements of particle (CAKE) cake and (BAGEL bagel , ALBA alba ) decay at the zero-degree setup have been developed at iThemba LABS, and first experiments were successfully conducted.
Finally, the capability to perform these experiments with high energy resolution provides unique information. In light nuclei, it allows an analysis on a state-by-state basis up to high excitation energies mat15 ; bir16 ; mat17 . The fine structure observed in the energy region of the IVGDR carries information on the role of different damping mechanisms contributing to the width of the resonance. A quantitative description of giant resonance widths remains a challenge to state-of-the-art nuclear structure calculations. Furthermore, the magnitude of the fine-structure fluctuations depends on the LD, which can be extracted in an energy region where a single excitation mode dominates. Unlike many other experimental techniques, where the LD is inferred from the comparison of experimental observables to statistical-model predictions, the fluctuation analysis provides LDs for a given spin and parity. This allows a direct comparison with LD models.
Since LDs are an essential ingredient of astrophysical network calculations, such data provide an important test of microscopic model predictions gor18 ; zel19 needed to describe reaction paths in exotic nuclei like the and processes. Experimentally, -shell nuclei, for which a shell-model approach has been recently developed sen16 , are of interest. In heavy nuclei, collective enhancement factors in EDF-based models gor08 and shell-model Monte Carlo calculations alh15 can be experimentally tested. Finally, systematic studies of the LDs can be combined with results for and 2 from analogous high-resolution studies of the ISGMR vnc19a and ISGQR she09 to experimentally constrain the LD spin distribution.
In conclusion, the present review demonstrates that the experimental techniques developed at RCNP and iThemba LABS to enable the measurement of inelastic proton scattering at very forward angles including are extremely fruitful providing contributions to a variety of current problems in nuclear structure, many of them with relevance to nuclear astrophysics. The ongoing and future programs promise a deeper insight into the physics related to E1 and M1 strengths in nuclei.
Acknowledgements.
The development and realization of the zero-degree programs at RCNP and iThemba LABS would not have been possible without the contributions of many colleagues, simply too numerous to name them all. Instead, we acknowledge the former and present graduate students working on the (p,p′) projects as representatives: Sergej Bassauer, Jonny Birkhan, Lindsay Donaldson, Chihiro Iwamoto, Maxwell Jingo, Andreas Krugmann, Anna Maria Krumbholz, Muftahou Latif, Dirk Martin, Michael Mathy, Hiroaki Matsubara, Iryna Poltoratska and Gerhart Steinhilber. Their enthusiasm, ingenuity and commitment has been a true inspiration. We thank M.N. Harakeh for a careful reading of the manuscript and many constructive comments. This work was funded by the Deutsche Forschungsgemeinschaft (DFG, German Research Foundation) – Projektnummer 279384907 – SFB 1245, by JSPS KAKENHI, Grant No. JP14740154 and by MEXT KAKENHI, Grant No. JP25105509.
The reference list from the paper itself. Each links out to its DOI / PubMed record.
- 1(1)
- 2(2) U. Kneissl, N. Pietralla, A. Zilges, J. Phys. G 32 , R 217 (2006).
- 3(3) W.G. Love, M.A. Franey, Phys. Rev. C 24 , 1073 (1981).
- 4(4) Y. Fujita, B. Rubio, W. Gelletly, Prog. Part. Nucl. Phys. 66 , 549 (2011).
- 5(5) J.B. Mc Clelland, T.A. Carey, S. Seestrom-Morris, LAMPF Progress Report 1984, pp. 61.
- 6(6) J.B. Mc Clelland, S.K. Nanda, T.A. Carey, K.W. Jones, M. Murray, M. Plum, T.N. Taddeucci, R.W. Fergerson, D.E. Ciskowski, L. Bimbot, B. Bonin, LAMPF Progress Report 1985, pp. 58; ibid. 1987, pp. 37.
- 7(7) G.P.A. Berg, L.C. Bland, B.M. Cox, D. Du Plantis, D.W. Miller, K. Murphy, P. Schwandt, K.A. Solberg, E. J. Stephenson, B. Flanders, IUCF Sci. Tech. Rep. 1986 – 1987 (unpublished), p. 152.
- 8(8) A. Tamii, Y. Fujita, H. Matsubara, T. Adachi, J. Carter, M. Dozono, H. Fujita, K. Fujita, H. Hashimoto, K. Hatanaka, T. Itahashi, M. Itoh, T. Kawabata, K. Nakanishi, S. Ninomiya, A. Perez-Cerdan, L. Popescu, B. Rubio, T. Saito, H. Sakaguchi, Y. Sakemi, Y. Sasamoto, Y. Shimbara, Y. Shimizu, F. Smit, Y. Tameshige, M. Yosoi, J. Zenihiro, Nucl. Instrum. Methods A 605 , 326 (2009).