Dynamical evolution of magnetic fields in the intracluster medium
Paola Dom\'inguez-Fern\'andez, Franco Vazza, Marcus Br\"uggen,, Gianfranco Brunetti

TL;DR
This study uses high-resolution cosmological MHD simulations to explore how magnetic fields in galaxy clusters evolve, amplify, and are affected by mergers, providing insights relevant for future radio observations.
Contribution
It presents detailed simulation results on magnetic field amplification and spectral evolution in galaxy clusters, highlighting the roles of mergers and turbulence.
Findings
Magnetic energy increases by a factor of 40-50 over 9 Gyr.
Major mergers shift magnetic spectra to smaller scales.
Minor mergers promote steady magnetic growth.
Abstract
We investigate the evolution of magnetic fields in galaxy clusters starting from constant primordial fields using highly resolved () cosmological MHD simulations. The magnetic fields in our sample exhibit amplification via a small-scale dynamo and compression during structure formation. In particular, we study how the spectral properties of magnetic fields are affected by mergers, and we relate the measured magnetic energy spectra to the dynamical evolution of the intracluster medium. The magnetic energy grows by a factor of 40-50 in a time-span of Gyr and equipartition between kinetic and magnetic energy occurs on a range of scales ( at all epochs) depending on the turbulence state of the system. We also find that, in general, the outer scale of the magnetic field and the MHD scale are not simply correlated in time. The effect of…
Click any figure to enlarge with its caption.
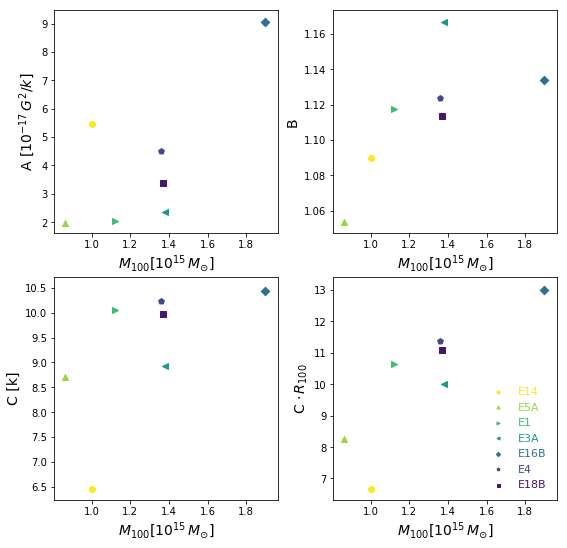 Figure 1
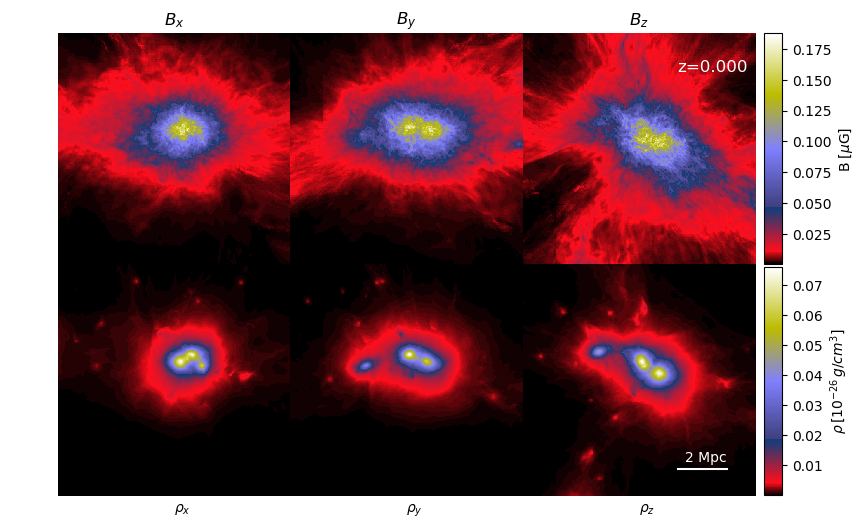 Figure 1
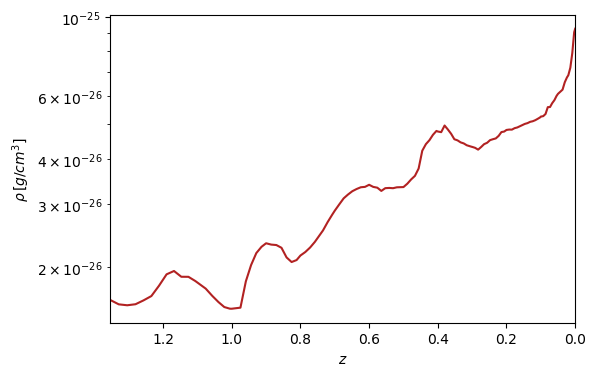 Figure 2
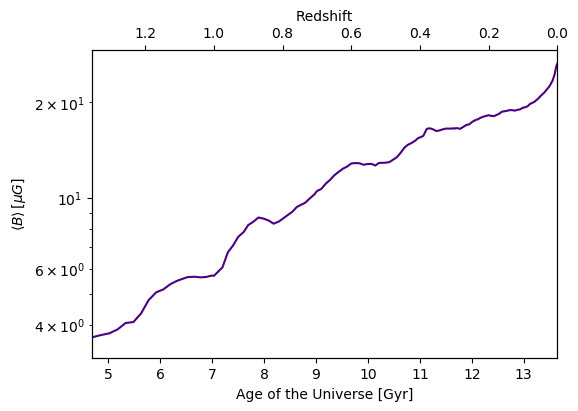 Figure 3
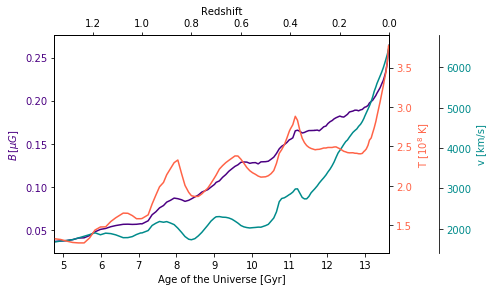 Figure 3
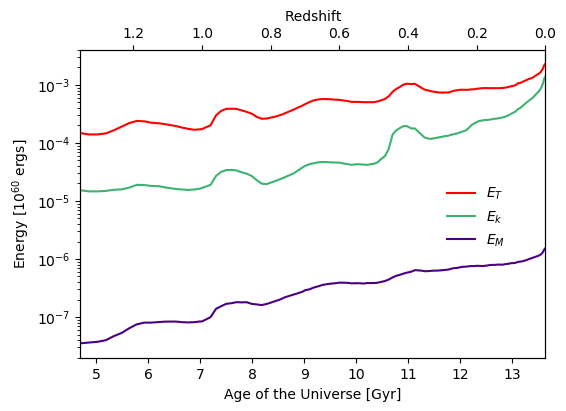 Figure 6
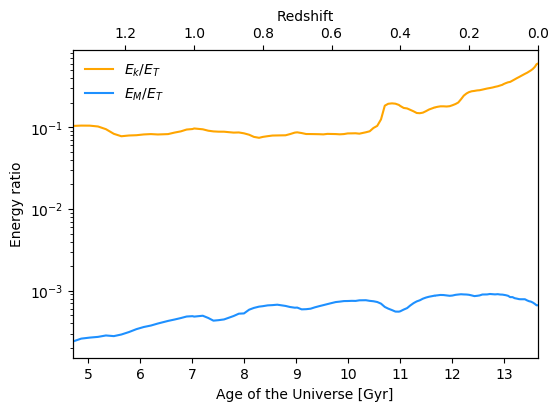 Figure 7
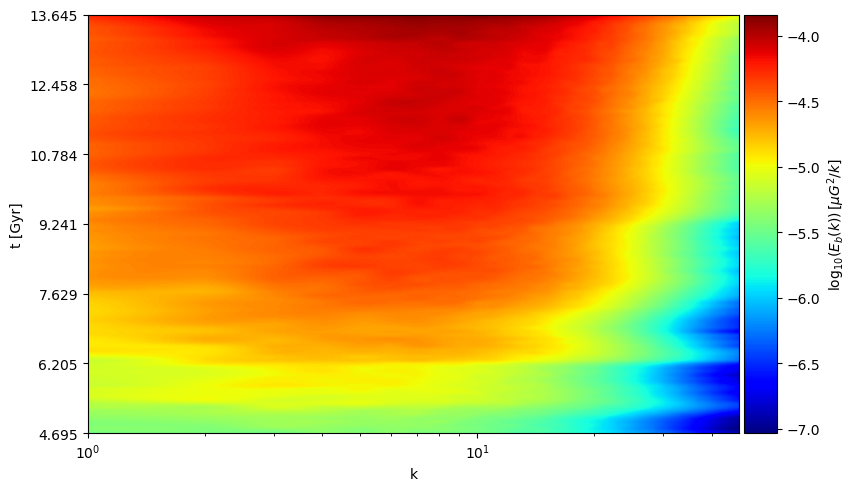 Figure 8
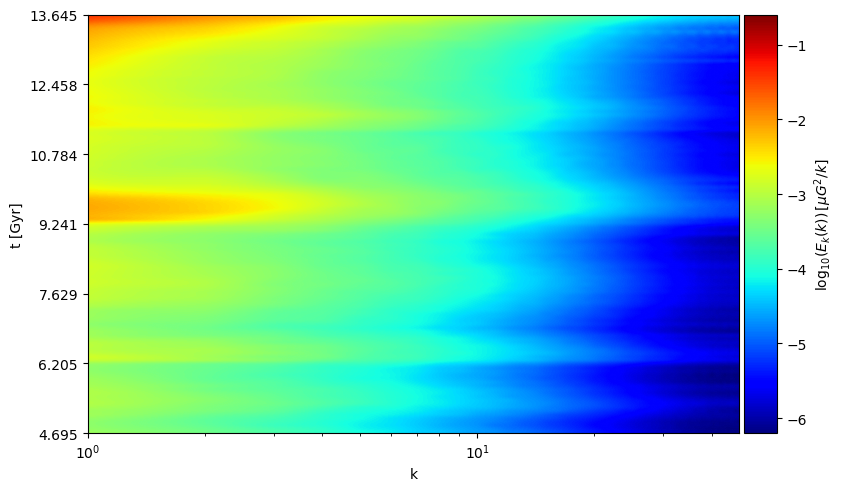 Figure 9
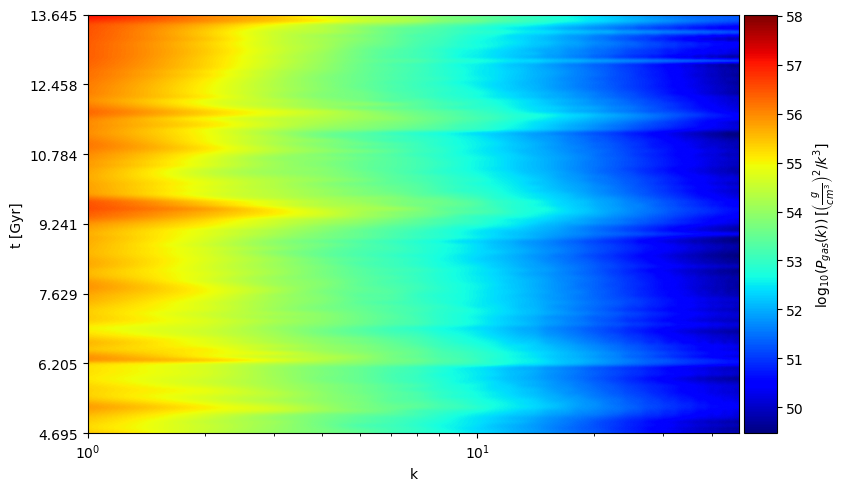 Figure 10
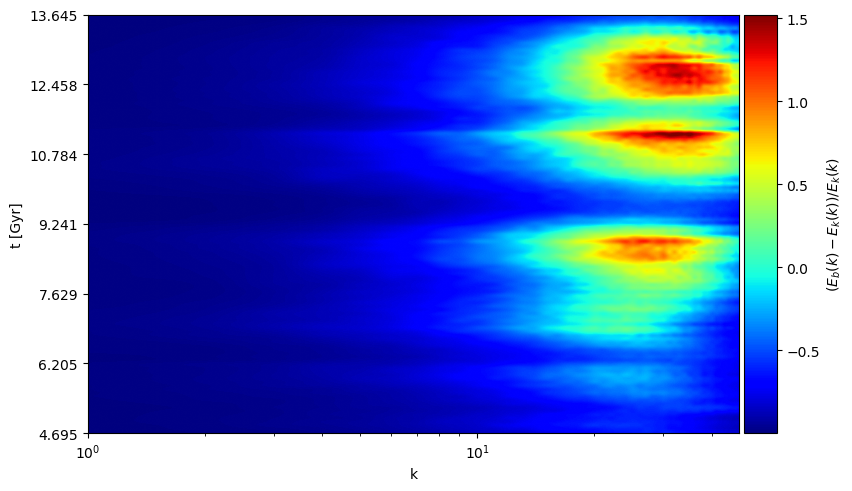 Figure 11
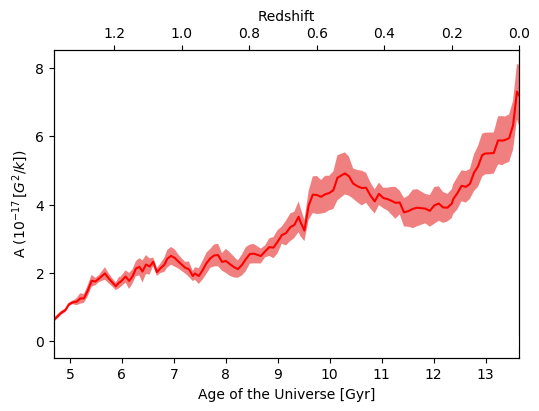 Figure 12
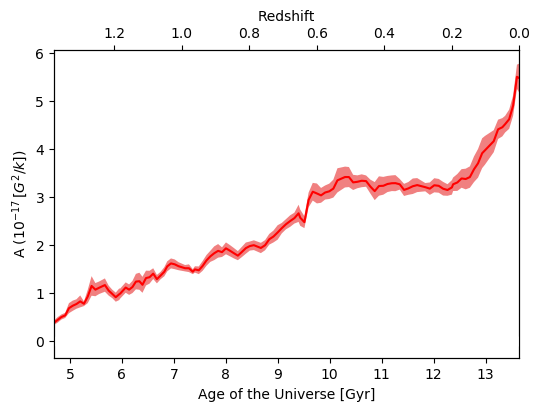 Figure 12
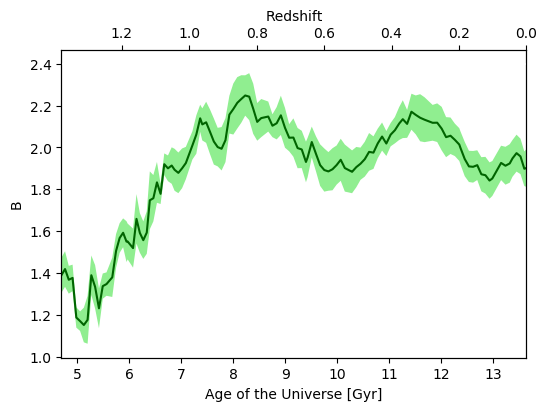 Figure 13
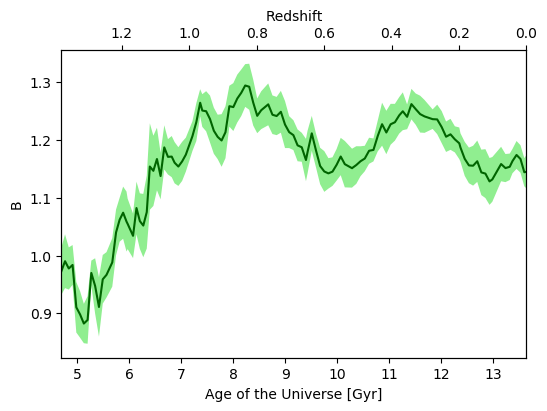 Figure 13
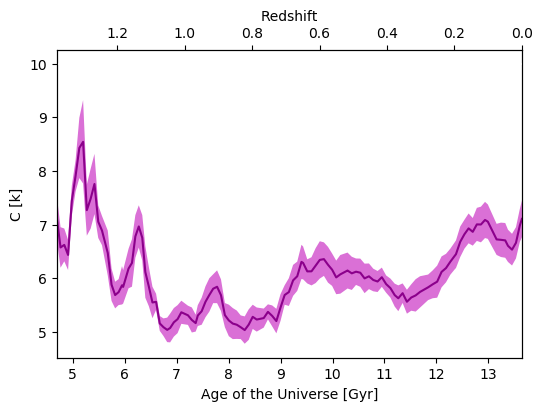 Figure 14
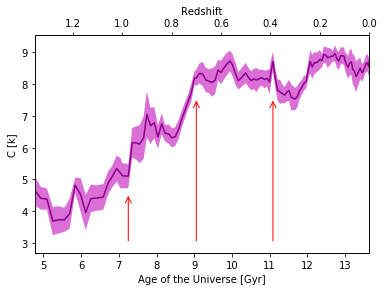 Figure 14
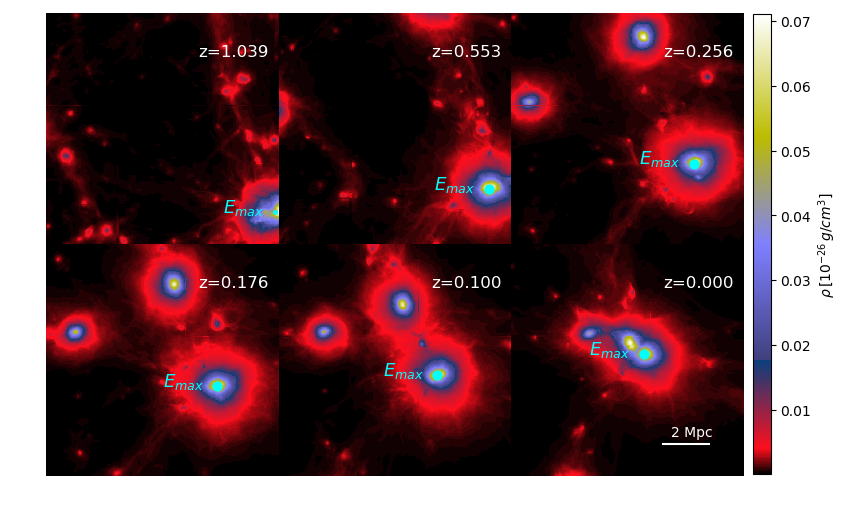 Figure 15
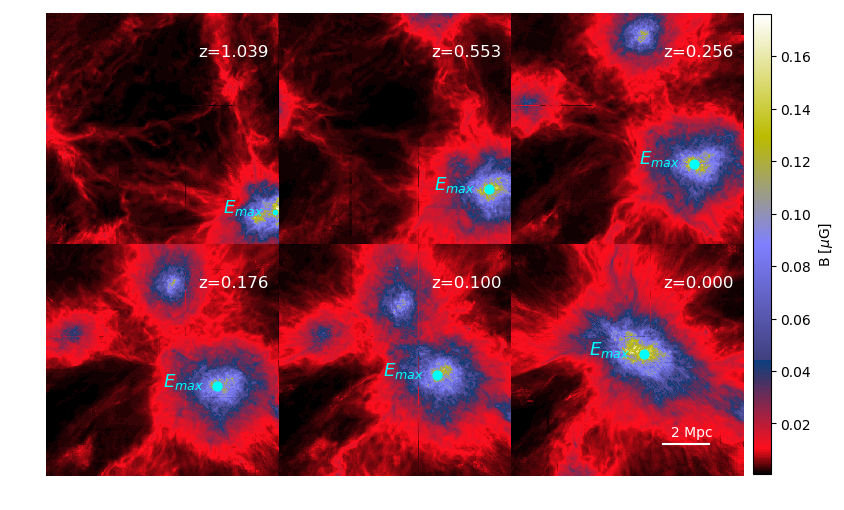 Figure 16
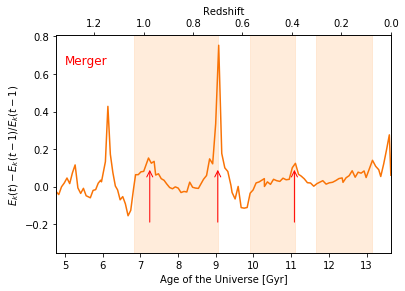 Figure 17
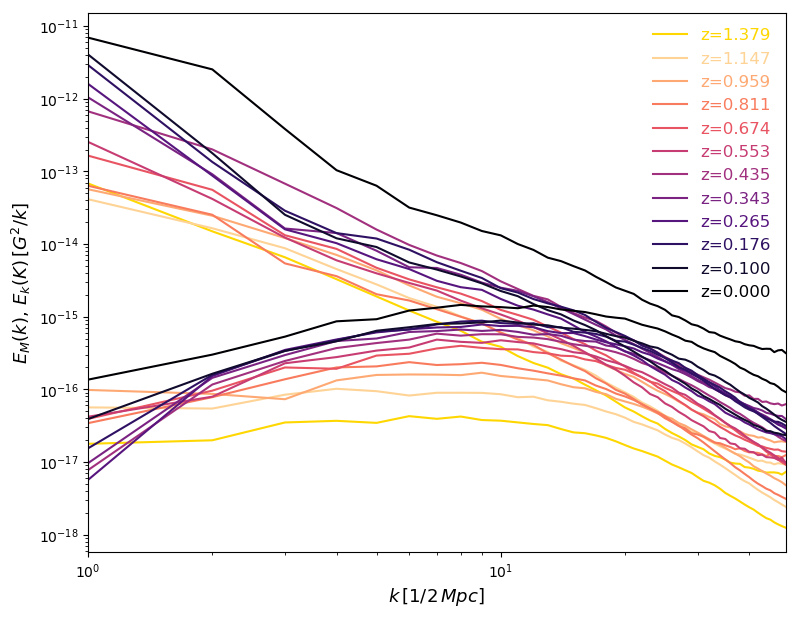 Figure 18
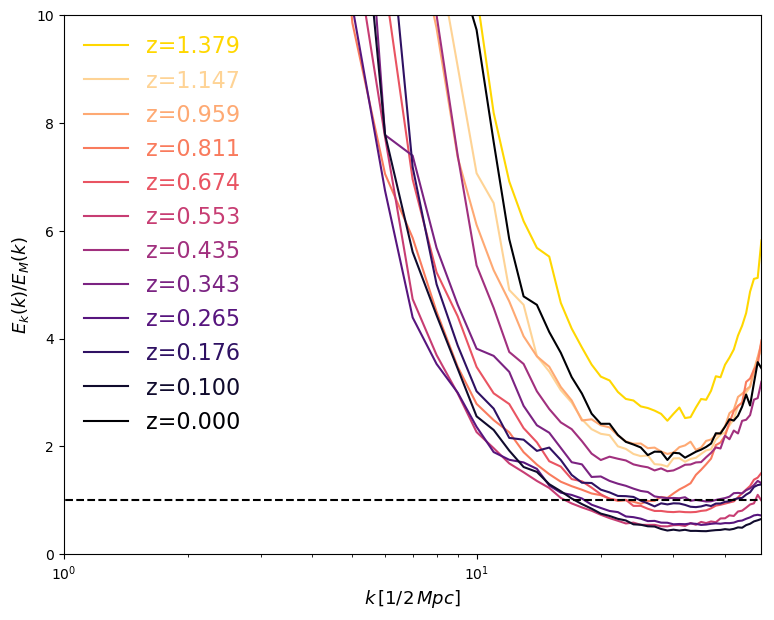 Figure 18
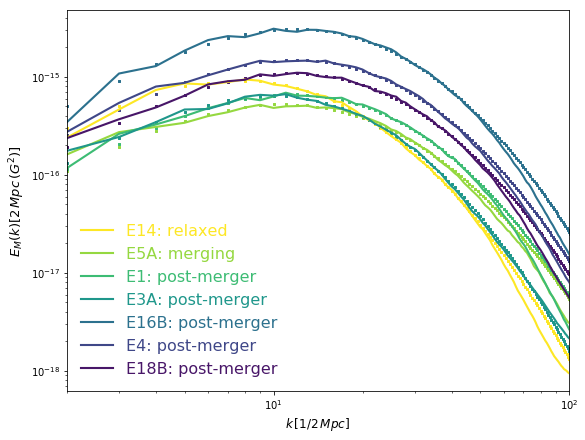 Figure 19
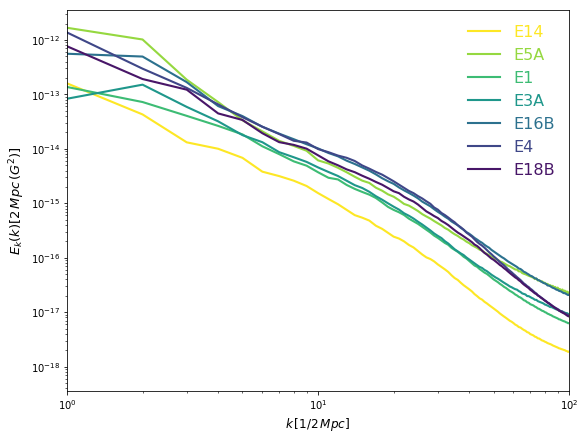 Figure 19
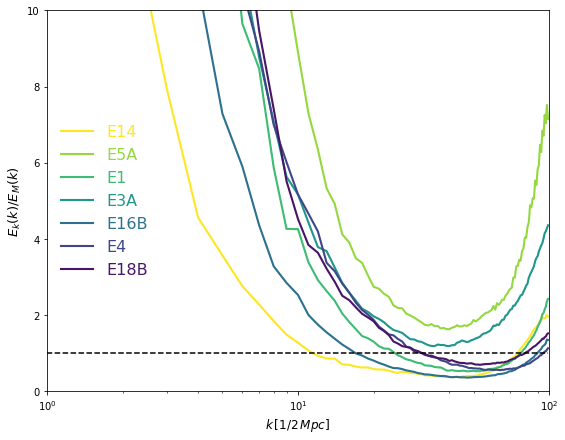 Figure 19
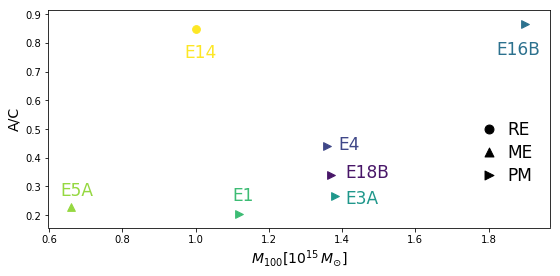 Figure 19
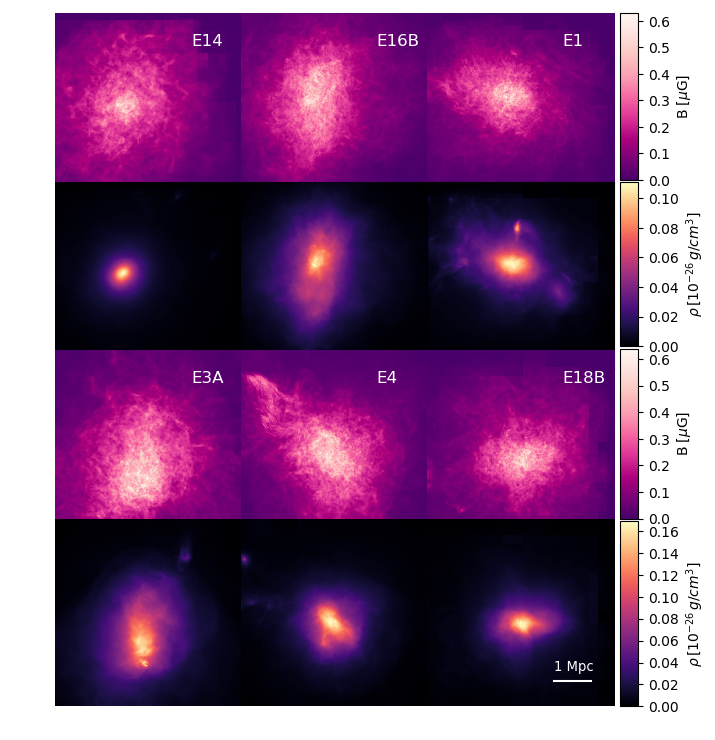 Figure 20
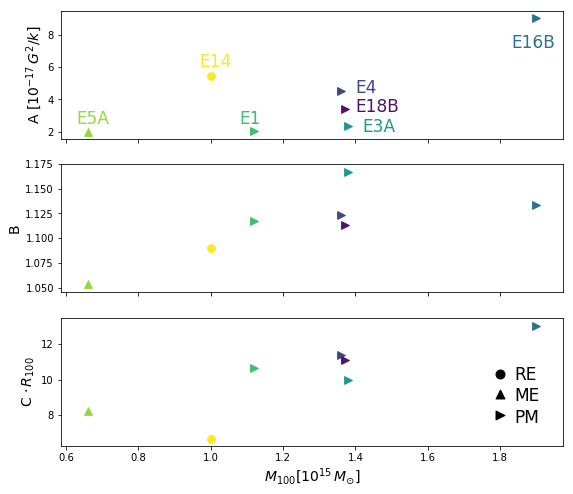 Figure 21
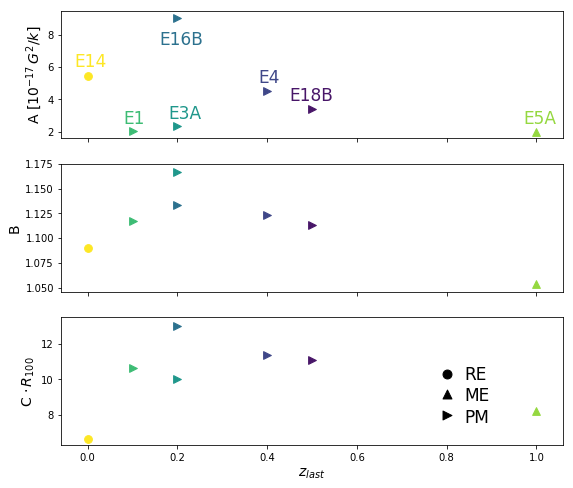 Figure 22
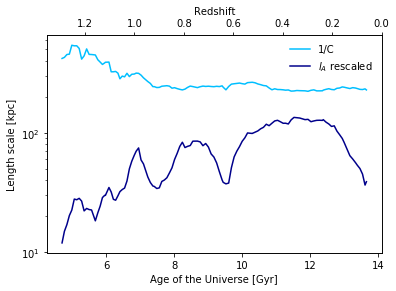 Figure 23
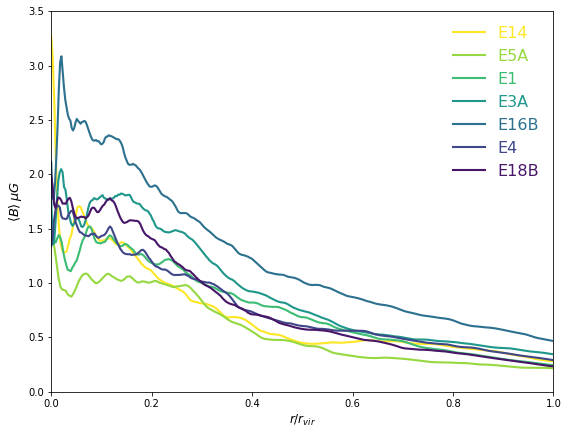 Figure 24
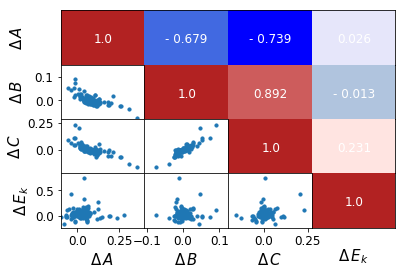 Figure 25
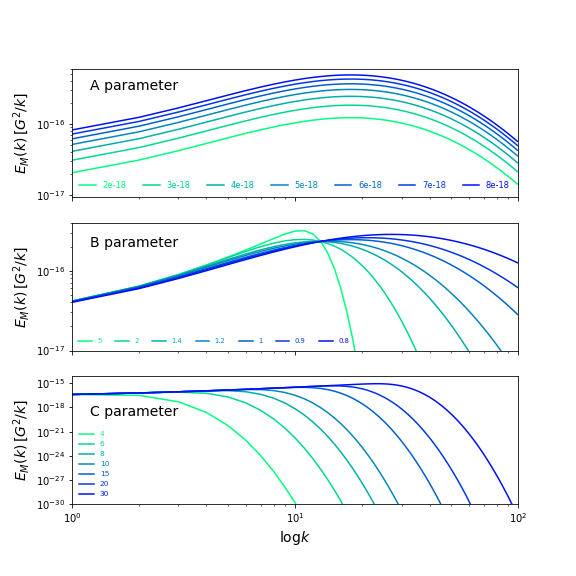 Figure 26
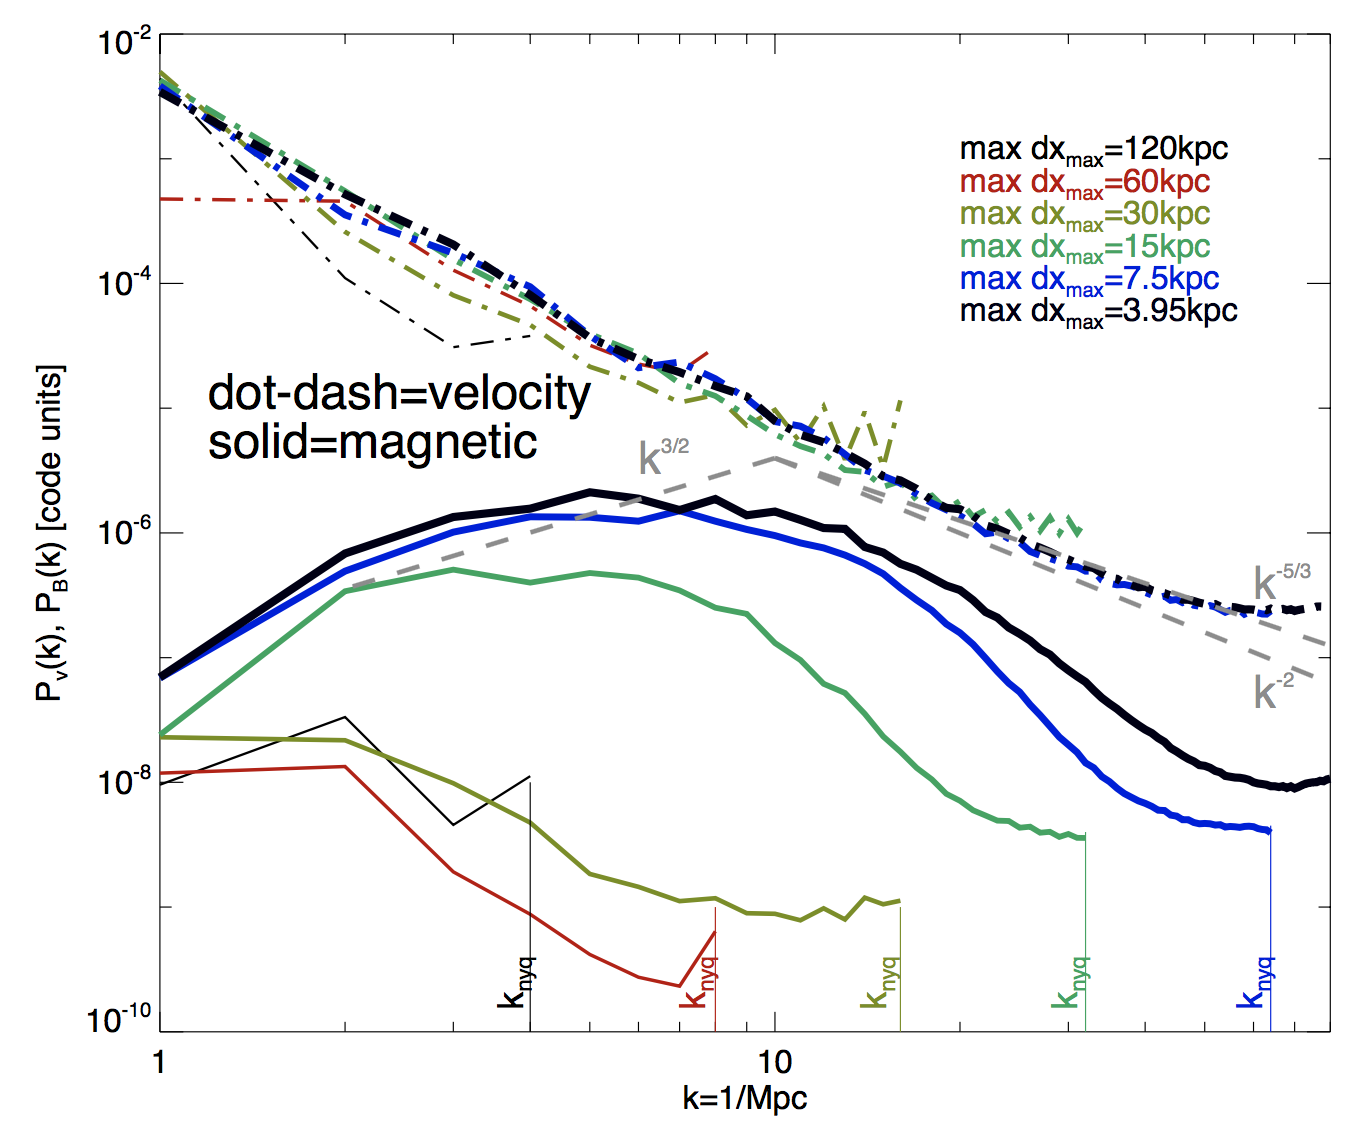 Figure 34
| ID | [Mpc] | Dynamical state | A () | B ([-]) | C (k[1/2 Mpc]) | ||
|---|---|---|---|---|---|---|---|
| E14 | RE | 1.726 | 5.470 0.111 | 1.090 0.009 | 6.461 0.096 | ||
| E5A | ME | 1.050 | 1.985 0.059 | 1.054 0.012 | 8.708 0.192 | ||
| E1 | PM | 1.308 | 2.052 0.036 | 1.118 0.009 | 10.052 0.131 | ||
| E3A | PM | 1.672 | 2.372 0.041 | 1.167 0.009 | 8.936 0.110 | ||
| E16B | PM | 2.474 | 9.041 0.164 | 1.134 0.009 | 10.437 0.138 | ||
| E4 | PM | 1.572 | 4.521 0.074 | 1.124 0.008 | 10.236 0.123 | ||
| E18B | PM | 1.716 | 3.396 0.049 | 1.113 0.007 | 9.974 0.106 |
Peer Reviews
No public reviews on file for this paper yet. If you reviewed it on a platform where reviews are public (OpenReview, ICLR, NeurIPS, ICML), you can paste yours below so the community can read it here.
Videos
No videos yet. Explain this paper in a talk, walkthrough, or lecture? Add one.
Dynamical evolution of magnetic fields in the intracluster medium
P. Domínguez-Fernández1 , F. Vazza2,3,1 , M. Brüggen1 and G. Brunetti3
1 Hamburger Sternwarte, Gojenbergsweg 112, 21029 Hamburg, Germany
2 Dipartimento di Fisica e Astronomia, Universitá di Bologna, Via Gobetti 92/3, 40121, Bologna, Italy
3 Istituto di Radio Astronomia, INAF, Via Gobetti 101, 40121 Bologna, Italy E-mail: [email protected]
(Received / Accepted)
Abstract
We investigate the evolution of magnetic fields in galaxy clusters starting from constant primordial fields using highly resolved () cosmological MHD simulations. The magnetic fields in our sample exhibit amplification via a small-scale dynamo and compression during structure formation. In particular, we study how the spectral properties of magnetic fields are affected by mergers, and we relate the measured magnetic energy spectra to the dynamical evolution of the intracluster medium. The magnetic energy grows by a factor of 40-50 in a time-span of Gyr and equipartition between kinetic and magnetic energy occurs on a range of scales ( at all epochs) depending on the turbulence state of the system. We also find that, in general, the outer scale of the magnetic field and the MHD scale are not simply correlated in time. The effect of major mergers is to shift the peak magnetic spectra to smaller scales, whereas the magnetic amplification only starts after 1 Gyr. In contrast, continuous minor mergers promote the steady growth of the magnetic field. We discuss the implications of these findings in the interpretation of future radio observations of galaxy clusters.
keywords:
galaxy: clusters, general – methods: numerical – intergalactic medium – large-scale structure of Universe
1 Introduction
Galaxy clusters assemble through mergers and accretion until they reach an approximate virial equilibrium (e.g. Kravtsov & Borgani, 2012; Planelles et al., 2015). These events affect the space between galaxies which is filled with a dilute plasma, known as the intracluster medium (ICM). In particular, radio observations shed light on the non-thermal component of the ICM revealing the existence of cosmic rays and magnetic fields permeating galaxy clusters (e.g. Feretti et al., 2012; Brunetti & Jones, 2014; Donnert et al., 2018). Observations of synchrotron emission indicate magnetic fields with strengths of a few (corresponding to an energy density of of the thermal energy of the ICM) and typical coherence scales in the range of kpc (e.g. Vogt & Enßlin, 2005). Typically, this coherence scale is derived by a Fourier analysis of rotation measure (RM) maps, and inferring the maximum and minimum scales in the magnetic spectrum (often assuming a Kolmogorov-like power spectrum) necessary to reproduce the observed properties within uncertainties (e.g. Murgia et al., 2004; Bonafede et al., 2010, 2013). In order to explain their observed morphology and strength, it has been suggested that magnetic fields get tangled over time by some other process than gas compression (e.g. Dolag et al., 1999; Brüggen et al., 2005a; Xu et al., 2009).
While the origin of magnetic fields in galaxy clusters is still subject to debate, two scenarios have been widely discussed: (i) the primordial scenario, in which magnetic fields have been generated in the early Universe possibly during (or after) inflation but prior to the formation of galaxies (e.g. Turner & Widrow, 1988; Kobayashi, 2014; Grasso & Rubinstein, 2001; Kandus et al., 2011; Subramanian, 2016) and (ii) the astrophysical scenario, in which magnetic fields were produced from stellar winds (e.g. Donnert et al., 2009) or active galactic nuclei (AGN) (e.g. Xu et al., 2011). A lower bound on the strength of the initial seed field of G (comoving) has been inferred for voids from the non-observation of secondary gamma-rays around blazars (e.g Neronov & Vovk, 2010). On the other extreme, upper limits of the order of G (comoving), derived from the observed level of cosmic microwave background (CMB) anisotropies (e.g. Planck Collaboration et al., 2016), can be used to limit the strength of any primordial seed field with coherence scales of Mpc or larger.
Regardless of the magnetogenesis scenario, magnetic fields must have been significantly amplified in order to have reached today’s values. It is generally assumed that the amplification of the initial magnetic fields occurred via the combined effect of adiabatic compression and the presence of a small-scale dynamo, both of which are driven by minor or major mergers (e.g. Roettiger et al., 1999; Brüggen et al., 2005b; Subramanian, 2016). The presence of a small-scale dynamo requires the existence of turbulence in the ICM, which is supported by cosmological simulations (e.g. Dolag et al., 2005; Vazza et al., 2009; Iapichino & Niemeyer, 2008; Ryu et al., 2008; Lau et al., 2009; Vazza et al., 2011; Marinacci et al., 2015, 2018b; Donnert et al., 2018) and more recently, also by observations (e.g. Hitomi Collaboration et al., 2018). A dynamo process converts kinetic energy into magnetic energy over the typical dynamical timescales of the turbulent cascade. It is believed that the amplification of ICM magnetic fields arises from the turbulence developing on scales which are a fraction of cluster virial radius () (e.g. Donnert et al., 2018, and references therein). Previous simulations have shown that only a few percent of the incompressible turbulent energy needs to be dissipated to account for the observed field strength (e.g Miniati & Beresnyak, 2015, and references therein).
Whenever the characteristic scale of the magnetic field is comparable or smaller than the characteristic scale of fluid motions, the dynamo is referred to as a small-scale dynamo (also called fluctuation dynamo) (e.g Zeldovich et al., 1983; Kazantzev, 1967). Conversely, a large-scale dynamo refers to magnetic fields that are spatially coherent on scales comparable to the scale of the underlying astrophysical system (e.g Zeldovich et al., 1983; Moffatt, 1978). Since galaxy clusters do not show substantial rotation, it is likely that the turbulent small-scale dynamo winds up magnetic fields on scales smaller than the turbulence injection scale (e.g Subramanian et al., 2006; Brandenburg et al., 2012; Kazantzev, 1967; Kraichnan & Nagarajan, 1967; Kulsrud & Anderson, 1992; Schekochihin & Cowley, 2007; Beresnyak & Lazarian, 2006; Schekochihin et al., 2008).
In previous papers (e.g Beresnyak & Miniati, 2016; Miniati & Beresnyak, 2015), driven turbulence in the ICM has been studied in a cosmological context. Still, it remains a challenge to push the spatial resolution down to the so-called MHD scale () at which the magnetic energy is strong enough to prevent additional bending of the magnetic field lines. It is crucial to resolve in order to fully capture the development of the small-scale dynamo amplification, but can in principle be extremely small () for arbitrarily small seed magnetic fields. The Reynolds number achieved in simulations is also an important factor that directly affects the magnetic field growth. While the Reynolds number based on the full Spitzer viscosity in the ICM is believed to be of the order of (e.g Brunetti & Lazarian, 2007; Cho, 2014a), the reduced proton mean free path in the collisionless ICM can result in much larger Reynolds numbers (Beresnyak & Miniati, 2016; Brunetti & Lazarian, 2011b). This suggests that the fluid approximation provides a suited model for the properties of the ICM (e.g Santos-Lima et al., 2017, 2014).
More recently, it has been shown that initial magnetic field seeds can be amplified via a dynamo up to strengths of G in cosmological grid simulations (e.g Vazza et al., 2018a) (hereafter Paper I). Here, we present a new sample of galaxy clusters to study the spectral properties of each galaxy cluster in our sample. Firstly, we study the characteristic spectral features of the magnetic energy in different types of clusters at . Secondly, we follow the spectral evolution of a particular cluster that is merging.
The paper is structured as follows: in Section 2 we present the numerical setup and describe the fitting process of the magnetic energy spectra. In Section 3 we present our results in two parts, the first one dedicated to the properties of our galaxy cluster sample at , and the second one describing the evolution of a merging cluster. In Section 4 we discuss numerical aspects and in Section 5, we discuss the implications of our results.
2 Methods
2.1 The Simulated Dataset
We simulated the formation of massive galaxy clusters in a cosmological framework with the ENZO grid code (The Enzo Collaboration et al., 2013). We used the Dedner formulation of MHD equations (Wang & Abel, 2009) and used adaptive mesh refinement (AMR) to increase the dynamical resolution within our clusters, as in Paper I. We assumed a CDM cosmology (, , and ) as in Vazza et al. (2010).
Each cluster was selected in a comoving volume of (260 Mpc)3, first simulated at coarse resolution (Vazza et al., 2010), and then resimulated with nested initial conditions (Wise & Abel, 2007). We employed two levels of static uniform grids with cells each and using particles each to sample the dark matter distribution, with a mass resolution per particle of at the highest level.
Then, we further refined the innermost (25 Mpc)3 volume, where each cluster forms, with additional 7 AMR levels (refinement ). The refinement was initiated wherever the gas density was higher than its surroundings. This gives us a maximum spatial resolution of per cell.
With our setup (see Paper I), for the virial volume of clusters is refined at least up to the 6th AMR level ( kpc) at , and most of the central volume within Mpc from the cluster centre is simulated with 3.95 kpc/cell.111Each cluster simulation used core hours running on 64 nodes on JUWELS at Jülich Supercomputing Centre.
In this work, we will only discuss non-radiative cosmological simulations, meaning that we only included the effect of cosmic expansion, gas, Dark Matter self-gravity and (magneto)hydrodynamics, in order to solely focus on the growth of magnetic fields by the turbulence induced by structure formation.
In order to seed magnetic fields at the beginning of our runs, we mimic a simple primordial origin of magnetic fields, in which we initialized the field to a uniform value across the entire computational domain, along each coordinate axis. The initial magnetic seed field of (comoving) is chosen to be below the upper limits from the analysis of the CMB (e.g. Subramanian, 2015). This particular setup is easy to implement, ensures by construction, and has been already tested in our previous work on the subject (Vazza et al., 2014, 2018a). Moreover, several studies have shown that the impact on the initial magnetic field topology within galaxy clusters (provided that the simulated dynamical range is large enough to enter the dynamo regime) is negligible (e.g. Marinacci et al., 2015; Vazza et al., 2017, 2018a), hence our results do not strongly depend on this particular setup.
We refer the reader to Appendix A for a short overview of the key findings of Paper I. There, we showed that our numerical setup provides enough resolution to resolve the MHD scale, , in a large fraction of the cluster volume during its late evolution (). Moreover, the simulations show features of small-scale dynamo amplification. However, as we discuss in depth in Sec. 4, some results can be affected by the limited spatial resolution.
2.2 Fitting the magnetic power spectrum
The three-dimensional power spectrum is defined as
[TABLE]
where is the two-point correlation function between the velocities and (e.g. Batchelor, 1951). When the corresponding fields do not depend on the position and only depend on the distance between two points, i.e. we consider homogeneous and isotropic fields, the total energy is given by
[TABLE]
where is thus the scalar energy distribution per unit mass for the mode related to the diagonal components of the tensor , and therefore, the relation between this spectral energy and the one-dimensional power spectrum is found to be
[TABLE]
This approximation works well for the rather chaotic and isotropic velocity field always found in cosmological cluster simulations (e.g. Dolag et al., 2005; Vazza et al., 2011; Wittor et al., 2017). We computed first the power spectrum by using standard algorithms for the three-dimensional Fast Fourier Transform (FFT) of the velocity and magnetic fields within the simulation box and then by summing up the contributions over spheres within a radius in Fourier space. Finally, by multiplying by the factor , we obtained the energy spectrum of the magnetic and velocity field.
While the velocity power spectra can be characterized by a power-law and by an injection scale, the magnetic spectra are more complex. We fit the magnetic spectra by the equation:
[TABLE]
where the parameter gives the normalization of the magnetic spectrum, is related to the width of the spectra and is a characteristic wavenumber corresponding to the inverse outer scale of the magnetic field (see Fig. 1). Eq. (4) is rooted in dynamo theory as a solution for single-scale turbulent flows (Kazantzev (1967), Kraichnan & Nagarajan (1967), Kulsrud & Anderson (1992)). In the remainder of the paper we propose to use Eq. (4) as a proxy to characterize our evolving magnetic spectra with a minimal set of parameters (, , as detailed above), even though the equation is not valid for the scales and conditions that we are studying. It should be stressed that the aim of the paper is not to connect directly these parameters with Kazantzev’s dynamo model since the generation and evolution of turbulent magnetic fields in the ICM are affected by a hierarchy of complex processes. In particular, we note that:
-
The assumptions under which Eq. (4) is derived, such as having a single-scale turbulent flow, a Kolmogorov spectrum for the velocity field, neglecting the resistive scale, etc. (see more details on the assumptions and derivation in Kulsrud & Anderson 1992) are not valid since, in our system, laminar gas motions and advection at many scales may also affect the topology of the magnetic fields in the ICM. Furthermore, the magnetic field is amplified and re-shaped by the turbulence generated every time a merger occurs.
-
The analysis of non-linear effects such as ambipolar diffusion or magnetic reconnection are far beyond the scope of this work. But we can comment that some of these affects have been also studied in Kulsrud & Anderson (1992), where the final magnetic power spectrum exhibits a similar shape, i.e. a power law multiplied by a Macdonald function (or modified Bessel function of second order) of different orders. For small , they can reduce to Eq. (4).
-
As long as the velocity scale responsible for the dynamo forcing is larger than the scales where the magnetic energy spectrum peaks, Eq. (4) is valid. This condition is matched during the initial stage of cluster formation, and is later violated after the magnetic field has grown to larger scales. It is our intention to quantify the development of magnetic fields as a function of resolution (as in Paper I) as well as of the cluster evolution. For this reason, it is convenient to apply Eq. (4), as the dynamo in our runs is expected to stay in the kinematic regime for long due to the finite numerical resolution (e.g. Beresnyak & Miniati, 2016).
3 Results
3.1 Magnetic fields in the cluster sample
In this section we analyze a sample of seven clusters in different dynamical states: clusters with ongoing mergers (ME) at , relaxed ones (RE) and post major merger ones (PM). In Fig. 2 we show the projected gas density and magnetic field strength for all of our clusters, considering the highest resolution of our simulation (3.95 kpc).
A list of the main parameters of our simulated clusters is given in Tab. 1. The estimate of the total (gas+DM) mass inside , as well as the tentative classification of the dynamical state at of each object follows from Vazza et al. (2010). Our dynamical classification is done in two steps: firstly, clusters with a major merger (based on the total mass accretion history within ) for are classified as post-mergers (PM). In particular, major mergers in the range are selected considering that the change of the mass increment is , where is the mass at a time and is the mass at time Gyr (Fakhouri et al., 2010). Secondly, if no major merger is found in this time interval, we additionally compute the ratio between the total kinetic energy of gas motions inside , , and the total energy () inside the same volume. This parameter has been shown to characterise the dynamical activity of clusters well (e.g. Tormen et al., 1997). Relaxed (RE) clusters typically have while merging (ME) clusters have . In Tab. 1 we also list the redshift of the last major merger () for post-merger systems, while for relaxed systems we conventionally consider and for merging systems. For a more detailed discussion of the classification scheme we refer the reader to Vazza et al. (2010) and references therein.
For each cluster, we computed the radial profile of the average magnetic field from the peak of gas density at at the highest resolution, as shown in Fig. 3. Within the sample variance, we find that the magnetic field follows gas density as (where is the gas density and is the core gas density) as in Paper I. In fact, the radial profiles in Paper I appear to be consistent with what can be derived by Faraday Rotation analysis of the Coma cluster (Bonafede et al., 2013), despite the fact that the distribution of magnetic field components found in our simulations deviate significantly from a Gaussian distribution. The central magnetic field value of each cluster, , is given for reference in Tab. 1. In general, we can see that the most perturbed cluster (E5A) does not show the strongest fields. The central value, (measured as the average within the innermost radius from the cluster centre), is strongly correlated with the mass of the cluster. Indeed, in Fig. 3 we can see that the higher the mass, the higher the central value of the magnetic field. While observations do not show a clear correlation of the mean magnetic field with the mass of the host cluster (e.g. Govoni et al., 2017), our normalization , which is the parameter most closely linked to the Faraday Rotation, shows little correlation with mass, and has a large scatter.
3.2 Spectral properties in the cluster sample
Next, we proceeded to compute the magnetic energy power spectra for the innermost region of all clusters at as described in Sec. 2.2 . We computed power spectra only for the innermost region of each cluster, where the resolution is approximately constant and equal to the 8th and maximum AMR level (corresponding to a grid). By doing so, we can neglect the effect of coarse-mesh effects in our FFT analysis as the majority of the central cluster volume is refined up to the highest level for all our clusters (see discussion in Vazza et al., 2018a). The corresponding spectra, along with the best-fit curves are plotted in the top panel of Fig. 4 and the best-fit parameters are listed in Tab. 1. To a good degree of approximation, all spectra are well fitted by Eq. (4) regardless of the dynamical state of each cluster. All clusters in the sample show similar spectral shapes, with a peak of magnetic energy in the range and differences in normalization of a factor . As shown in Vazza et al. (2018b), this non-Gaussian distribution of magnetic field strengths may result from the superposition of multiple magnetic field components that have been accreted at different times via mergers. For completeness, we also show the kinetic spectra of all the clusters in the central panel of Fig. 4. These kinetic spectra are very similar, i.e. we observe a higher normalization for perturbed clusters as there is more turbulence involved in these systems, and the lowest normalization is observed for the relaxed cluster (E14). Comparing this to the magnetic spectra shown in the top panel of Fig. 4, we can clearly see that a higher level of turbulence does not necessarily imply higher values of the magnetic field. This may seem counter-intuitive but it is caused by the fact that the amplification of magnetic fields from small to large spatial scales is a slow process that takes a few eddy turnover times. Therefore, even in the presence of a large input of turbulent kinetic energy, significant magnetic amplification can only be observed with a delay of . While part of this delay is caused by numerical effects (e.g. our numerical finite growth rate depends on the limited Reynolds number our simulation can resolve), this delay is of the same order as the eddy turnover timescale for turbulent eddies being injected with a velocity. This is the necessary time span for turbulence to cascade down to the scales that can drive a dynamo growth.
In the bottom panel of Fig. 4 we plot the ratio between kinetic and magnetic energy in order to visualize the scales at which equipartition is reached. RE systems reach equipartition at larger scales compared to PM systems, which is consistent with the general picture of a small-scale dynamo acting according to the amount of turbulence in the system. As expected, we also observe that the ME system is still not in equipartition at larger scales because this is the most perturbed cluster and it is mostly dominated by compressive turbulence.
3.2.1 Parameterization of cluster magnetic spectra
Our analysis in Paper I supports that the magnetic spectra show signs of a dynamo near saturation (see Appendix A). However, as we shall see in Sec. 3.3, if a small-scale dynamo is acting, it co-exists with bulk motions on larger scales that are affecting the evolution of the magnetic field during the whole assembly history of the clusters. As a consequence, the magnetic properties in our sample result from the cumulative (and discontinuous) action of dynamo during the entire cluster life-time. Therefore, there is no immediate connection between the spectral magnetic properties and the turbulent properties of the cluster at a given time.
In order to study how the best-fit parameters, , and , are related to the mass, dynamical state and redshift since the last major merger, we produced Figs. 5, 6 and 7. For our limited sample, we can conclude:
The spectrum normalization (): We find a dependence of the mass of the host cluster, and also a hint of a dependence on the dynamical state of the cluster. For a given mass bin we find . On the other hand, we do not find a correlation with the time since the last major merger.
- 2)
The spectrum width (): This parameter is found to depend on the dynamical state of each cluster, i.e. is larger in less perturbed systems (PM) and smaller in highly perturbed systems (ME). This presumably means that relaxed systems have had enough time for turbulence to cascade to the small scales and amplify the magnetic field during past mergers resulting in a broader spectrum; whereas the merging systems have a more restricted region of magnetic amplification. As will be mentioned in 3.4, mergers shift the spectrum towards smaller scales, thus the combination of this shift and the narrow spectrum means that merging systems contain more small-scale eddies. Therefore perturbed systems have a higher magnetic growth rate than relaxed systems.
- 3)
The inverse of the outer scale of magnetic field (): we find a hint of a dependence on the mass and the dynamical state of the cluster, . On the assumption of the existence of a small-scale dynamo, this would suggest that in more relaxed systems the dynamo had more time to grow towards larger scales (i.e. lower values of C). In the case of an on-going merger (as will be discussed in more detail in Sec. 3.3), large scale gas motions may also affect the magnetic spectra merely by compression. In principle, it will be possible that advection and buoyancy in a stratified medium such as the ICM also play a role in the outer scale behaviour, but the study of these effects are beyond the scope of this paper.
- 4)
Dependence on the time since the last major merger: We did not find a correlation between the epoch of the last major merger () and the best-fit parameters (, and ), which suggests that the magnetic energy spectrum at a given epoch does not retain much information about specific events, as well as that minor mergers are also an important player in setting the spectral properties of the ICM at (see discussion in 3.4). Moreover, given the limited sample size we have here, it is difficult to disentangle effects connected to the mass of the host cluster and the dynamical state.
- 5)
Rotation measure dependence on mass: The rotation measure (RM) of polarised radio emission from background sources scales as , which can be approximated to , where is the magnetic field at the autocorrelation scale . To a first approximation, the total from a clusters should scale with the . We find that the RM depends weakly on the mass(because of A and C dependence on mass), but scatters due to a dependence on the dynamical state of each cluster. This causes clusters with a factor difference in mass to show a very similar value (i.e. E14 and E16B, see Fig.7).
In order to link the evolution of magnetic spectra to the dynamical growth of galaxy clusters, in the next section we will analyze the assembly of one particular cluster.
3.3 Detailed evolution of cluster E5A
We studied the evolution of the cluster E5A by analysing a total of snapshots in the range from to . The cluster E5A is an interesting object as it forms via several mergers in the course of nearly 9 Gyr.
We work on uniformly gridded data reconstructed at the 6th AMR level (15.8 kpc resolution). This is done even if the simulation has refined down to the 8th AMR level. In Fig. 8 we show snapshots of the density and magnetic fields in a simulation box of cells. The maps in Figs. 8-9 show a volume-weighted projection of the magnetic field strength along the line-of-sight in order to emphasize the diffuse magnetic field structure on large scales. Hence, the magnetic field values in the map are biased towards lower values than the ones measured in the computational box.
Next, we identified the centre of the main cluster (cyan dot in Fig. 8) and then followed the evolution of gas and magnetic fields within a box of cells co-moving with the main cluster centre. The trajectory of the centre was obtained by computing the location of the maximum of the thermal energy after smoothing the data over a length of cells at each snapshot, and by applying a cubic spline time interpolation.
The final stage of the merger at is shown in Fig. 9, where the volume distribution of the gas density and the magnetic field strength are plotted in x,y and z directions. The magnetic field distribution is asymmetric, showing a tangled structure and its strength increases towards the centre of the major component. At least two prominent peaks in the magnetic field distribution (at the level) near the central region are visible in all lines of sight. These peaks correspond to the largest and the second largest components.
In Fig. 10 we show the evolution of the magnetic field strength, temperature and velocity within the moving simulation box. Every merger event is found to perturb the system and to increase the thermalization of the ICM, shown as peaks on the temperature evolution in Fig.10. While gas velocity and gas temperature show pronounced peaks close each merger event, the evolution of the averaged magnetic field strength is smoother. These smoothed peaks are correlated with the merger events, but show a delay of about Gyr with respect to the velocity peaks. In Fig. 11 we show the evolution of the total energy budget of the cluster (top panel) and the corresponding evolution of the energy ratios (bottom panel). During the whole period of evolution ( Gyr), the magnetic energy has grown by a factor 40-50, the kinetic energy by a factor of 90-100, and the thermal energy has grown by a factor 10-20. By the end of the simulation (), the kinetic energy is 10-40% of the thermal energy, while the magnetic energy is of the thermal energy.
3.4 Spectral evolution of cluster E5A
In this section we focus on the spectral features of the magnetic and kinetic energy power spectra, whose entire evolution is given in Fig. 12. The spectra are shown using comoving units and are computed within a box of comoving size Mpc, which moves with with the cluster centre identified as described in Section 3.3. The first thing to notice is that the shape of both spectra change very little over the period from to , while the normalization increases whenever a minor merger occurs. In the bottom panel of Fig. 12, we can observe that the evolution of the magnetic energy spectra shows a global increment on the magnetic field strength up to an approximate state of equipartition for (corresponding to scales kpc). This means that during a significant fraction of the system evolution the magnetic tension is strong enough to prevent the further bending of the magnetic lines, as would be expected from a classic small-scale dynamo. However, the range of scales in which equipartition is reached does not evolve monotonically with time (as expected in a classic dynamo), but it fluctuates in time, with features that are non-trivial to isolate. In particular, the epochs where there is no equipartition coincide with the occurrence of mergers, i.e. when the cluster is more perturbed. The various kinetic injections driving turbulence in this system will continuously change the magnetic field topology on spatial scales larger than the equipartition scale.
In order to examine the evolution of E5A, in Fig. 13 we colour coded the amplitude of the magnetic and kinetic spectra as a function of time. This spectral time sequence shows the entire evolution of the ICM as a function of time and spatial scale. As the system evolves, the magnetic power increases and tends to shift towards smaller scales, while the kinetic spectrum is always characterized by a maximum at , which mirrors the fact that the forcing of turbulence always occurs on scales . Merger events can be seen as horizontal stripes in the plot, which correspond to the injection of kinetic energy.
The resulting amplification of the magnetic field strength is then a complex interplay between compression and the small-scale dynamo. This is best shown by the appearance of dense gas structures at a similar time, as shown in the power spectra of gas density in Fig. 14, which is consistent with the relation between velocity and density fluctuations in the stratified ICM (e.g. Gaspari et al., 2014). A general trend is that every merger shifts the magnetic spectral power towards higher wave numbers, i.e. during most of these events the peak of the magnetic energy spectrum moves towards smaller spatial scales, unlike what is expected from the standard dynamo model, and most likely due to gas compression. As cluster mergers generate shocks and bulk flows that enhance the gas density and compress the magnetic field lines, this can also increase the normalization of the spectrum. Furthermore, it can also move the peak of the spectrum to higher wave numbers because the magnetic field lines get stretched along the merger direction.
Simultaneously, mergers inject turbulence, and only after the latter has decayed to small scales (where the eddy turnover time is the shortest), the peak magnetic spectra shifts towards lower wave numbers and the magnetic field is boosted again. This effect is characteristic of a small-scale dynamo.
Our analysis implies that both, compressive and dynamo amplification, tend to be present at the same time in galaxy clusters. This causes a difficult evolutionary pattern in the simulated ICM, adding complexity to what has been previously obtained by more idealized MHD simulations (e.g. Beresnyak & Miniati, 2016; Miniati & Beresnyak, 2015).
For better visualization, Fig. 15 shows the residual between magnetic and kinetic spectral energies also as a spectral time sequence plot. At all epochs, the excess magnetic energy is found on wave numbers (corresponding to scales kpc), showing that after merger events the magnetic tension gets strong enough to overcome further bending of the magnetic lines only at small scales. The magnetic amplification starts only after merger events because the turbulence injected takes a few eddy-turnover times to cascade.
In fact, if the kinetic energy injection is high enough, as we can observe around Gyr in Fig. 15, the amplification is slowed down.
In order to identify the specific times of kinetic energy injection, we plotted in Fig. 16 the difference of the total kinetic energy in the simulation box at timestep with respect to the previous timestep, . A peak in this plot can account mainly for either the entrance of a clump into the simulation box, a shock traveling across the cluster or a reflected shock. Since we are interested in studying the amplification periods identified in Fig. 15, we restrict ourselves to point out only some of these events confirmed by visual inspection with red arrows in Fig. 16. The shaded areas in the plot are placed as a reference for the amplification phases found in the spectral time sequence of Fig. 15. We noticed that, the maximum kinetic injection appears to happen either when gas substructures cross close to the cluster centre, which typically leads to shock waves ( 2–3 in this case, as we measured with a velocity-based shock finder following Vazza et al. 2017) sweeping through the cluster; or when there is a continuous injection of turbulence by minor mergers (period between 12–13 Gyr). In the first case, the most significant boosts of kinetic energy are followed by the compression of the magnetic field spectra. The injection of large amounts of kinetic energy on large scales impact the magnetic field only after Gyr (white areas after first and second red arrows in Fig. 15), suggesting that a small-scale dynamo is activated only after such amount of time. In the second case, continuous minor mergers contribute to the magnetic amplification at small scales by starting to shift the power towards higher scales (period between 12–13 Gyr). This seems to suggest that minor mergers significantly power the small-scale dynamo amplification.
Finally, we studied the evolution of the MHD scale () using the result from Brunetti & Lazarian (2007):
[TABLE]
where is the reference scale within the Kolmogorov inertial range and is the rms velocity within the scale . In this case, we measure the turbulent velocity by filtering the large motions on kpc. We obtain a distribution of the MHD scale for all of our snapshots and select the mean at each time. In Fig. 17 we show the resulting evolution of the corresponding scale () and compare it to the evolution of the outer scale of the magnetic spectrum (). It has been suggested in former studies (e.g. Beresnyak & Miniati, 2016; Miniati & Beresnyak, 2015) that will follow closely the evolution of the outer scale of the magnetic spectrum. Our analysis suggests that in reality the evolution of magnetic fields during mergers is more complicated than that. The system is significantly affected by compression and large-scale coherent motions, whose energy is larger than the small-scale turbulent energy on scales. In fact, the injected energy may contribute to advect magnetic field lines on large scales ( kpc). Overall, this means that our galaxy clusters exhibit cumulative turbulence cascades with different injection timescales, able to amplify the existing magnetic fields via a dynamo action. Under these conditions, the evolution of the outer scale is mismatched with respect to that of the MHD scale. This has important implications for the future surveys of magnetic fields in galaxy clusters. The interpretation of magnetic field spectra inferred by Faraday Rotation will not uniquely constrain the magnetic amplification coming from a small-scale dynamo, but may also be contaminated by compression amplification coming from large-scale gas flows.
3.4.1 Evolution of best-fit parameters for cluster E5A
Following the same approach of Section 2.2, we proceeded with the fitting of all magnetic spectra in the evolution of E5A, which yields the evolutionary tracks shown in Fig. 18. The top panel shows the normalization of the magnetic energy spectrum, where we can see a clear result: the overall amplification of the magnetic field continues to grow but steepens more where mergers occur. In fact, we observe that the normalization almost increases by one factor on the last Gyr where a major merger is about to happen. As a consequence of these events and the other effects previously mentioned, the magnetic growth is not linear. While the total magnetic energy increases by a factor of 40-50 (as mentioned in Section 3.3), the normalization of the spectrum only increased by a factor of in nearly 9 Gyr.
In the middle and bottom panels of Fig. 18 we show the evolution of the parameters B and C. It is notable that both evolution patterns seem to be correlated. The evolution of C (wave number corresponding to the outer scale of the magnetic spectrum) also shows a correlation with some identified merger events: the red arrows over-plotted corresponding to those in Fig. 16. Mergers induce an immediate change of the outer scale of the spectrum by shifting the power towards smaller scales. While this pattern is less obvious in the evolution of the parameter B, we can observe that mergers also induce an immediate broadening of the spectrum. These combined effects can be directly associated with the action of compression. A particular thing to notice is that, the change on B and C at the last (third arrow) merger event is not as large as the previous events. This suggests that at this point, the cluster has had enough turbulence input (at different injection scales and timescales) to amplify the magnetic field at smaller scales, making it harder for the spectrum to broaden or shift its power to even smaller scales.
4 Numerical aspects
As in Paper I, we relied on the Dedner cleaning algorithm (Dedner et al., 2002) to get rid of magnetic monopoles. The main limitation of this method is the reduction of the effective dynamical range, compared to Constrained Transport (CT) schemes at the same resolution, due to the intrinsic dissipation of the scheme by cleaning waves which keep the numerical divergence under control (Kritsuk et al., 2011). Several groups have tested that the Dedner cleaning method is robust and accurate for most idealized test problems, as long as the resolution is opportunely increased (e.g. Wang & Abel, 2009; Wang et al., 2010; Bryan et al., 2014). Even in the test of more realistic astrophysical applications, the Dedner method has been shown to quickly converge to the right solution, unlike different approaches to clean preserving at run time (Stasyszyn et al., 2013; Hopkins & Raives, 2016; Tricco et al., 2016; Barnes et al., 2018).
Despite the numerical dissipation introduced by the Dedner cleaning, all important features discussed in this paper (e.g. the peak in the power spectrum of magnetic fields, and the equipartition scales) are much larger than the length scales affected by numerical dissipation: e.g. the peak of power spectra are typically on scales larger than the minimum cell size in our the simulation. While the dissipation in the Dedner scheme can considerably slow down the first stage of the dynamo amplification (Beresnyak & Miniati, 2016), once that magnetic structure becomes sufficiently large, they are relatively unaffected by numerical dissipation.
In Paper I we verified that in the largest part of the simulation box, the numerical divergence of is of order of the local magnetic field strength, i.e. of the magnetic energy on larger scales. We refer the reader to the recent review by Donnert et al. (2018) for a broader discussion of the resolution and accuracy of different MHD schemes in the context of small-scale dynamo processes in galaxy clusters.
Our simulations neglect physical processes other than gravity and (magneto)hydrodynamics, such as radiative gas cooling, chemical evolution, star formation and feedback from active galactic nuclei. In this way, we can more easily isolate the effects of compression and dynamo from additional amplification caused by feedback and gas overcooling.222See however Katz et al. (2018), for a possible way of monitoring the growth of different magnetic field components within the same simulation. Comparisons between the predictions of primordial and astrophysical seeding scenarios of magnetic fields with ENZO can be found in Vazza et al. (2017). For recent high-resolution simulation of extragalactic magnetic fields with a moving-mesh algorithm we refer the reader to Marinacci et al. (2018c) and to the recent review by Donnert et al. (2018).
While the initial topology of possible seed magnetic fields is unknown, we tested in Paper I that variations of the assumed initial topology of seed fields do not to affect the strength of simulated magnetic fields in the ICM at low redshift. Variations of the assumed initial strength of magnetic seed fields are harder to test, as for very small seed fields resolving the Alfvenic scale becomes prohibitive and the amplification is stuck in the exponential regime for the entire cluster evolution (Beresnyak & Miniati, 2016). In Paper I, we provided evidence that our simulated magnetic fields are fairly independent on the initial field strength only for (comoving) fields. Future re-simulations at even higher resolution, or with less diffusive MHD schemes will be needed to test the scenario for lower seed fields.
Finally, as customary in simulations without explicit viscosity and resistivity, the numerical viscosity and resistivity are of the same order, meaning that the magnetic Prandtl number is .This assumption is reasonable enough given the existing uncertainties and the difficulties in the characterization of the magnetised plasma in galaxy clusters (e.g. Schekochihin et al., 2004; Brunetti & Lazarian, 2011a; Beresnyak & Miniati, 2016), and it further allows us to easily compare with the standard literature of small-scale dynamo in a box (e.g. Cho, 2014b; Porter et al., 2015). A few groups have explored the role of non-ideal MHD effects in cosmological simulations, such as the presence of a physical resistivity (e.g. Bonafede et al., 2011; Marinacci et al., 2018a), whose usefulness to explain observed ICM magnetic fields has been recently questioned by new simulations (Barnes et al., 2018).
5 Summary and conclusions
In this paper, we have presented new high-resolution cosmological MHD simulations of a sample of galaxy clusters, which allow us to study the spectral properties of magnetic amplification with unprecedented spatial and temporal detail.
In agreement with our earlier work, we find that we can reproduce cluster magnetic fields of the order of with primordial fields of G (comoving) at .
We computed the magnetic energy spectra at for all the clusters in the sample. The spectral shape remains similar across clusters, despite of their different dynamical states. We parameterize the magnetic spectra of all the clusters in our sample at and as a function of time for the merging cluster E5A by means of Eq. (4). The resulting best-fit parameters are used to characterize the magnetic properties of the ICM. In general, we could not find a simple one-to-one relation between the kinetic and magnetic spectra and the dynamical state of the clusters: this indicates that highly perturbed systems, exhibiting more turbulence, do not necessarily imply higher values of the magnetic fields, and that the cycle of amplification of magnetic fields in the realistic ICM is complex.
The normalization of the magnetic spectrum (), the spectrum width () and the inverse of the outer scale of the spectrum () show a positive correlation with the virial mass of each cluster. In addition, is correlated with the dynamical state of clusters. In general, we observe that the magnetic growth rate is larger for merging systems, while it is smaller in the relaxed system in our sample.
Finally, the outer scale of the magnetic spectrum () also correlates with the dynamical state of the cluster: the relaxed system in our sample reaches higher values of the outer scale ( kpc) compared to merging ( kpc) and post-merging ( kpc) systems, possibly indicating that the dynamo has acted for a longer time in such systems. We caution that the ubiquitous presence of large-scale bulk motions in the ICM may introduce larger correlation scales in the magnetic field, so that our best-fit parameters do not show an evident correlation with the last major merger of each cluster. This suggests that the history of minor mergers matters, but larger statistics of simulated clusters would be necessary to reach firmer conclusions.
Moreover, we studied the co-evolution of magnetic fields and the ICM properties in a merging cluster (E5A), which we could sample with a high time resolution. Our analysis reveals that the peak of the magnetic power spectrum shifts towards smaller spatial scales shortly after mergers, while overall it shifts to larger scales. In the cluster E5A, the peak of the magnetic power spectrum extends to kpc after Gyr of evolution, with equipartition at scales kpc. Large amounts of kinetic energy are injected by substructures that fall through the cluster which first amplify the magnetic field mainly via compression. These mergers prevent equipartition on the smallest scales, i.e. when the cluster is more perturbed, equipartition is not reached at scales above our current resolution.
In the course of a merger, the spectrum broadens and the outer scale is shifted towards smaller scales. While we observe that the total magnetic energy is continuously growing, the magnetic amplification at smaller scales starts only after the mergers. This behaviour is driven by two mechanisms:
- strong mergers introduce additional turbulence into the system that raises the kinetic energy above equipartition with the magnetic field. Nevertheless, this new energy will only become available for magnetic amplification after a few eddy-turnover times when the turbulence has already cascaded down to the smaller scales; Consequently, this changes the growth timescales by slowing down the process of amplification soon after a merger event. In particular, when there is a large input of kinetic energy, the magnetic amplification at small scales sets in only after since the merger.
Finally, our work has important implications for the interpretation of existing or future radio observations of magnetic fields in galaxy clusters. The total rotation measure from clusters is expected to scale . Therefore, our previous results imply that the RM only weakly depends on the mass of the galaxy cluster. We measure a scatter of up to a difference in RM between clusters of the same mass, while systems with a difference in mass can have the same RM, due to differences in their magnetic field correlation scale. This implies that the RM across the cluster population probably is not universal, but can significantly be affected by the complex sequence of amplification events in the past lifetime of each cluster, with important consequences in the predictions of the RM from galaxy clusters which should be observable by future radio polarisation surveys (e.g. Govoni et al., 2015; Taylor et al., 2015). We defer this analysis to future work.
6 Acknowledgements
We acknowledge our anonymous reviewer for helpful comments on the first version of this manuscript. The cosmological simulations were performed with the ENZO code (http://enzo-project.org), which is the product of a collaborative effort of scientists at many universities and national laboratories. We gratefully acknowledge the ENZO development group for providing extremely helpful and well-maintained on-line documentation and tutorials. The analysis presented in this work made use of computational resources on the JURECA cluster at the at the Juelich Supercomputing Centre (JSC), under projects no. 11823, 10755 and 9016 and HHH42, and partially on the Piz-Daint supercluster at CSCS-ETHZ (Lugano, Switzerland) under project s805. The original simulations on which this work is based have been produced by F.V. as PI on project HHH42 on JSC. We also acknowledge the usage of online storage tools kindly provided by the Inaf Astronomica Archive (IA2) initiave (http://www.ia2.inaf.it).
P.D.F and F.V. and acknowledges financial support from the European Union’s Horizon 2020 program under the ERC Starting Grant ”MAGCOW”, no. 714196. We acknowledge useful scientific discussions with K. Dolag, A. Beresnyak, J. Donnert, D. Ryu and T. Jones.
Appendix A Earlier results on dynamo amplification in simulated clusters.
We summarize here the main results of our previous work (Vazza et al., 2018a, , Paper I in this work), which motivates the analysis performed in this paper. Using an AMR prescription to refine most of the innermost regions of galaxy clusters with the ENZO code, in Vazza et al. (2018a) we simulated the growth of 0.1 nG (comoving) magnetic field seed, assumed of a cosmological origin, from to . We simulated the field growth as a function of the maximum cell resolution for a Coma-like galaxy cluster () an starting from the same initial field, and observed the onset of significant small-scale dynamo for resolutions , with near-equipartition magnetic fields on 100 kpc scales. For the best resolved run (), we measured a final magnetic fields strength of in the cluster core, with a radial profile that scales as (where is the gas density). For lower resolution, the magnetic field gets increasingly smaller, with a flatter radial profiles and a magnetic power spectrum of a power-law shape. In summary, the following are the key evidences that support that our runs do feature a resolved small-scale dynamo:
- •
the measured dependence of magnetic field strength and the effective resolution of the simulation: only when the numerical Reynolds number exceeds the magnetic field reaches values much larger than what gas compression () can produce;
- •
the onset of the curved magnetic field power spectrum only when the spatial resolution exceeds a critical value (estimated to be , even if this may vary with the adopted numerical scheme, e.g. Donnert et al. 2018), indicating that only at a large enough Reynolds number and high enough resolution we have enough solenoidal turbulence and we can resolve the scale (Fig.19);
- •
the slope of the power spectra for low wavenumbers is compatible with the Kasantsev model of dynamo (e.g. Schekochihin et al., 2004), while after the peak the spectrum rapidly steepens from to or less, consistent with (e.g. Porter et al., 2015; Rieder & Teyssier, 2017);
- •
the evolution of magnetic fields in our most resolved simulation, and its relation with the measured dissipation of kinetic turbulent energy, which indicate a dissipation rate of turbulent into magnetic energy, in line with Miniati & Beresnyak (2015) and Beresnyak & Miniati (2016);
- •
the measured anti-correlation between the curvature of magnetic field lines in our most resolved simulation and the magnetic field strength, as expected in the dynamo regime (e.g. Schekochihin et al., 2004);
- •
the measurement that the scale, estimated following in Brunetti & Lazarian (2007), which is well resolved for a good fraction of our cluster volume;
- •
the independence of the magnetic profile and power spectra at , for (comoving), above which our setup ensures to resolve in a large fraction of the cluster volume.
Moreover, the topology of the magnetic fields at produces profiles of Faraday Rotation of background polarised sources in good agreement with the real observations of the Coma cluster, which are the most stringent to date (Bonafede et al., 2010, 2013). A significant new finding of our first analysis in Paper I is also the detection of a significant non-Gaussian distribution of magnetic field components in the final cluster, which results from the superposition of different amplification patches mixing in the ICM.
All results obtained from this first study are also confirmed with the larger set of cluster simulations which is object of this paper.
Appendix B Correlating the best-fit parameters
We computed the cross-correlation matrix of the change in time of the best-fit parameters , , and the kinetic energy and show the result in Fig.20. Where of a variable , is defined as as in Fig. 16. The Pearson coefficients for all the cross-correlations are shown in the upper part of the diagonal in Fig. 20. In this way, we can better quantify the existing correlations and interpret them:
: a positive change in the normalization implies a negative change in the parameter B. This implies that a sudden increment on the normalization narrows down the spectrum width shortening the magnetic growth timescale. Therefore, the growth rate increases over time. 2. 2.
: an increment in the normalization implies that , i.e the power is shifted towards larger scales. We attribute this feature to the presence of dynamo amplification. This conclusion is supported by Section 3.4, where every merger event carrying enough kinetic energy was shown to shift the magnetic spectrum towards smaller scales (i.e. amplifying via compression). 3. 3.
: a wider spectrum coming along with a shift of the outer scale towards smaller scales is directly related to the action of compression. This matches our previous interpretation of Fig. 15, where compression shifts the power to smaller scales (i.e. ) and the new turbulent cascade does not play a role in the amplification instantaneously, but after an eddy-turnover time. 4. 4.
: a shift of the outer scale towards small scales is weakly correlated with the injection of kinetic energy. In this case, we checked the cross-correlation at each time and identified the times corresponding to some merger events (red arrows in Figs.16 and 18). The first two arrows corresponding to small clumps falling into the cluster show a higher correlation than the last arrow which corresponds to a larger clump. A plausible explanation is that the first two events generated sufficient turbulence that allowed the magnetic field to grow also at smaller scales (via the small-scale dynamo), so by the time of the third event, the effect of compression is not enough to shift the outer scale towards smaller scales anymore. This can be considered as a momentary state of ”balance” between the dynamo and compression effects and it would also explain the period of amplification between 12-13 Gyr.
The reference list from the paper itself. Each links out to its DOI / PubMed record.
- 1Barnes et al . (2018) Barnes D. J., On A. Y. L., Wu K., Kawata D., 2018, MNRAS, 476, 2890
- 2Batchelor (1951) Batchelor G. K., 1951, Mathematical Proceedings of the Cambridge Philosophical Society, 47, 359–374
- 3Beresnyak & Lazarian (2006) Beresnyak A., Lazarian A., 2006, The Astrophysical Journal, 640, L 175
- 4Beresnyak & Miniati (2016) Beresnyak A., Miniati F., 2016, Ap J, 817, 127
- 5Bonafede et al . (2011) Bonafede A., Dolag K., Stasyszyn F., Murante G., Borgani S., 2011, Ar Xiv e-prints
- 6Bonafede et al . (2010) Bonafede A., Feretti L., Murgia M., Govoni F., Giovannini G., Dallacasa D., Dolag K., Taylor G. B., 2010, A & A, 513, A 30+
- 7Bonafede et al . (2013) Bonafede A., Vazza F., Brüggen M., Murgia M., Govoni F., Feretti L., Giovannini G., Ogrean G., 2013, MNRAS, 433, 3208
- 8Brandenburg et al . (2012) Brandenburg A., Sokoloff D., Subramanian K., 2012, Science & Space Review, 169, 123