Evidence for the production of three massive vector bosons with the ATLAS detector
ATLAS Collaboration

TL;DR
This paper reports the first evidence for the production of three massive vector bosons in proton-proton collisions at 13 TeV using ATLAS data, with a significance of 4.1 standard deviations.
Contribution
It provides the first experimental evidence for the simultaneous production of three massive vector bosons at the LHC.
Findings
Evidence observed with 4.1 sigma significance
Expected significance was 3.1 sigma
Analysis used multiple leptonic and jet final states
Abstract
A search for the production of three massive vector bosons in proton-proton collisions is performed using data at TeV recorded with the ATLAS detector at the Large Hadron Collider in the years 2015-2017, corresponding to an integrated luminosity of fb. Events with two same-sign leptons (electrons or muons) and at least two reconstructed jets are selected to search for . Events with three leptons without any same-flavour opposite-sign lepton pairs are used to search for , while events with three leptons and at least one same-flavour opposite-sign lepton pair and one or more reconstructed jets are used to search for . Finally, events with four leptons are analysed to search for and .…
Click any figure to enlarge with its caption.
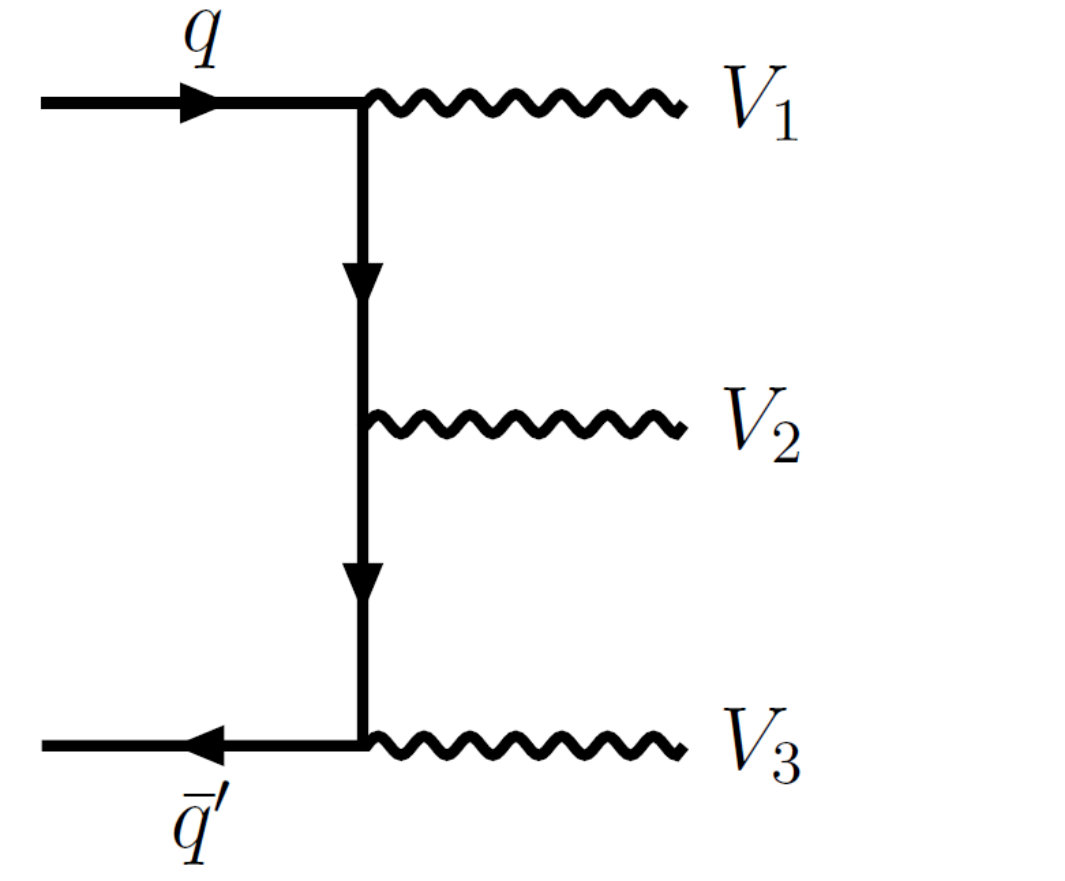 Figure 1
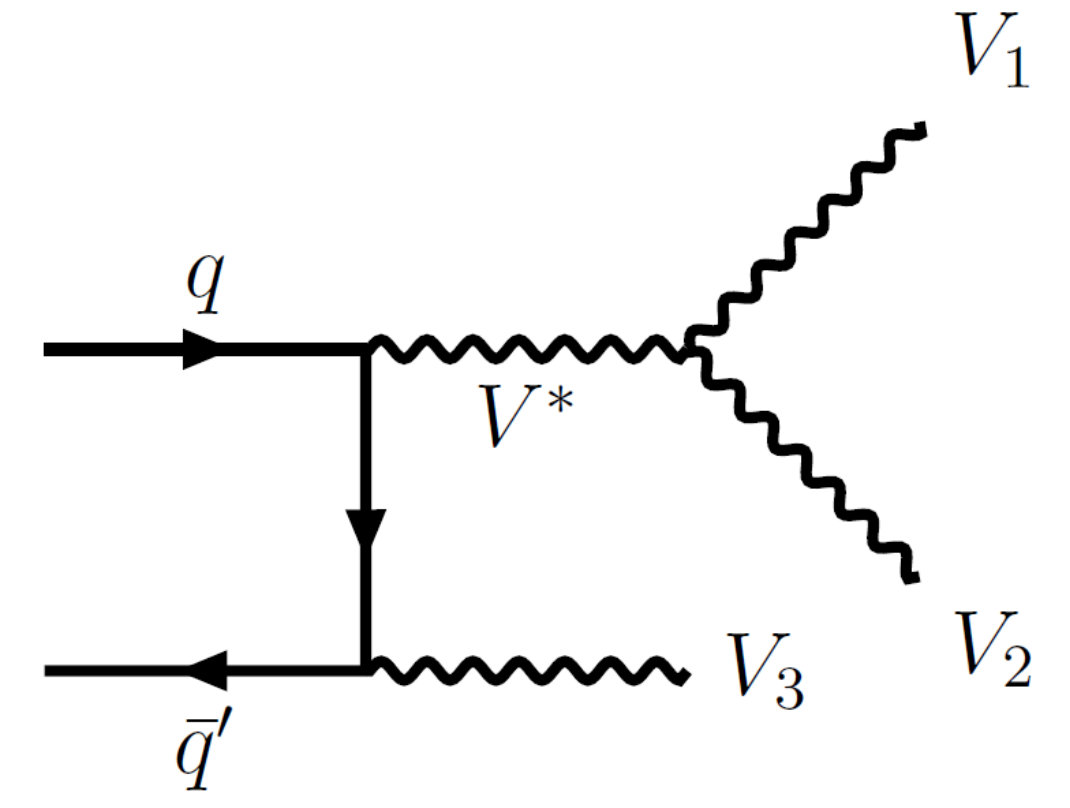 Figure 1
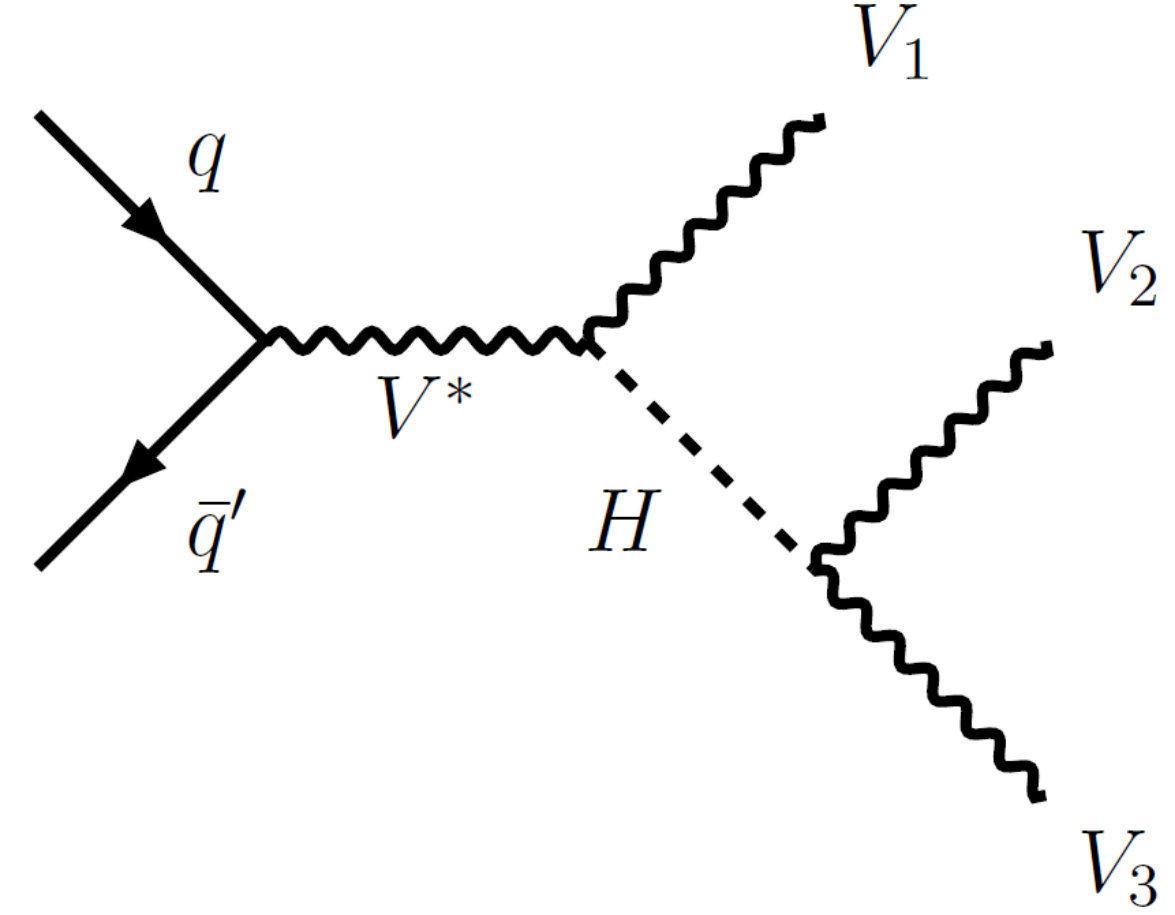 Figure 1
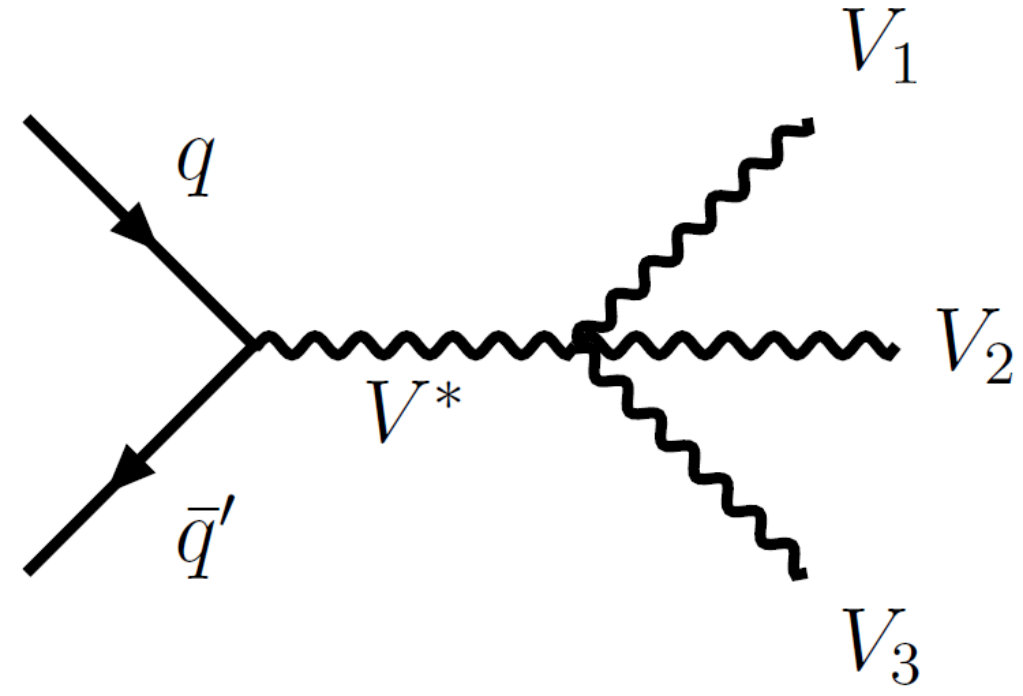 Figure 1
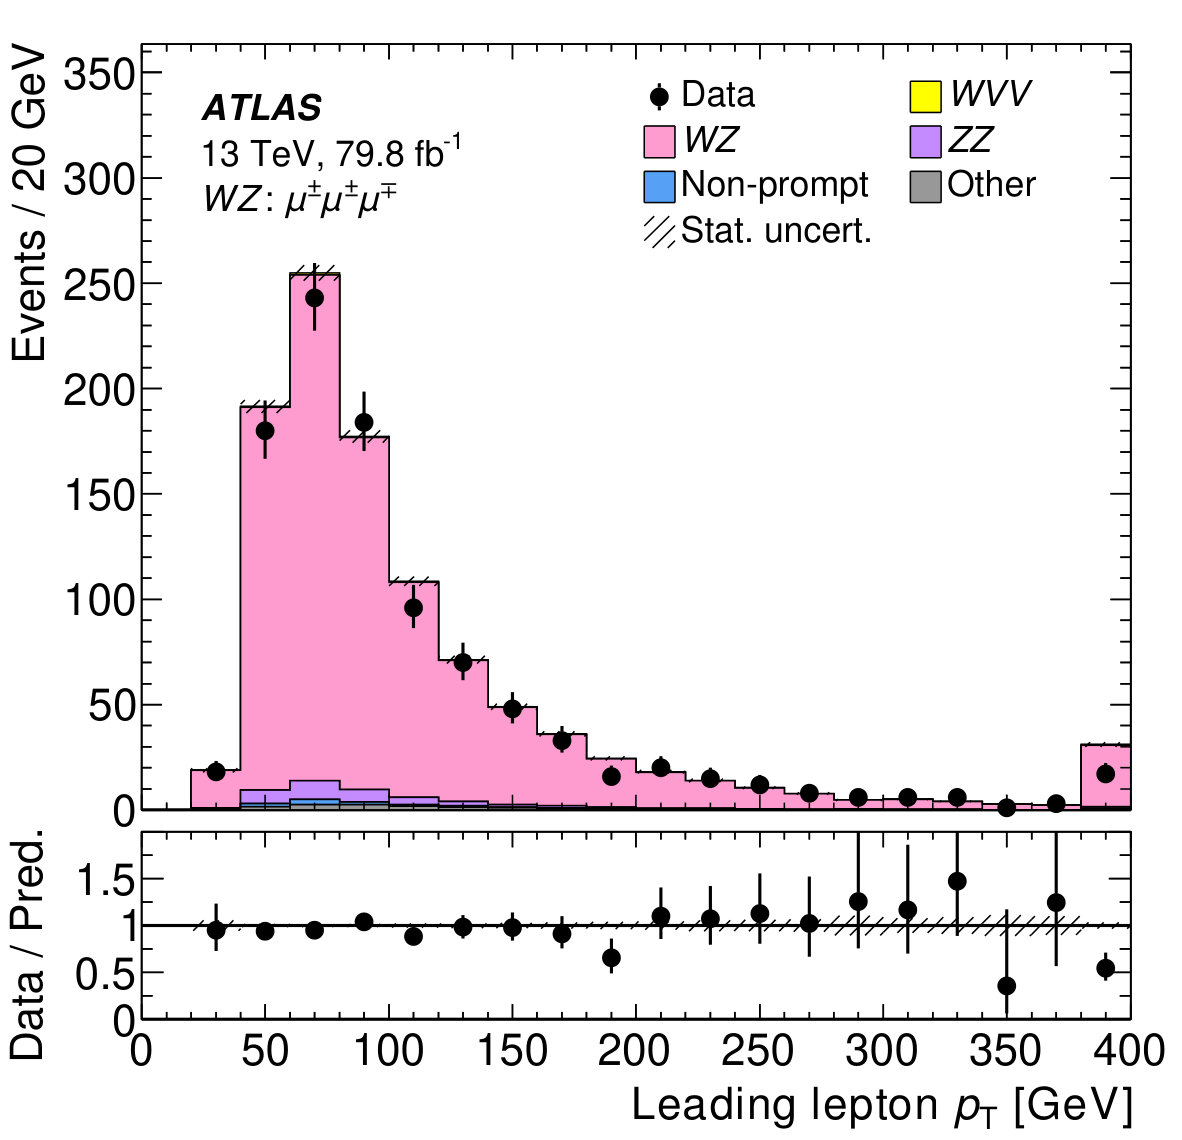 Figure 2
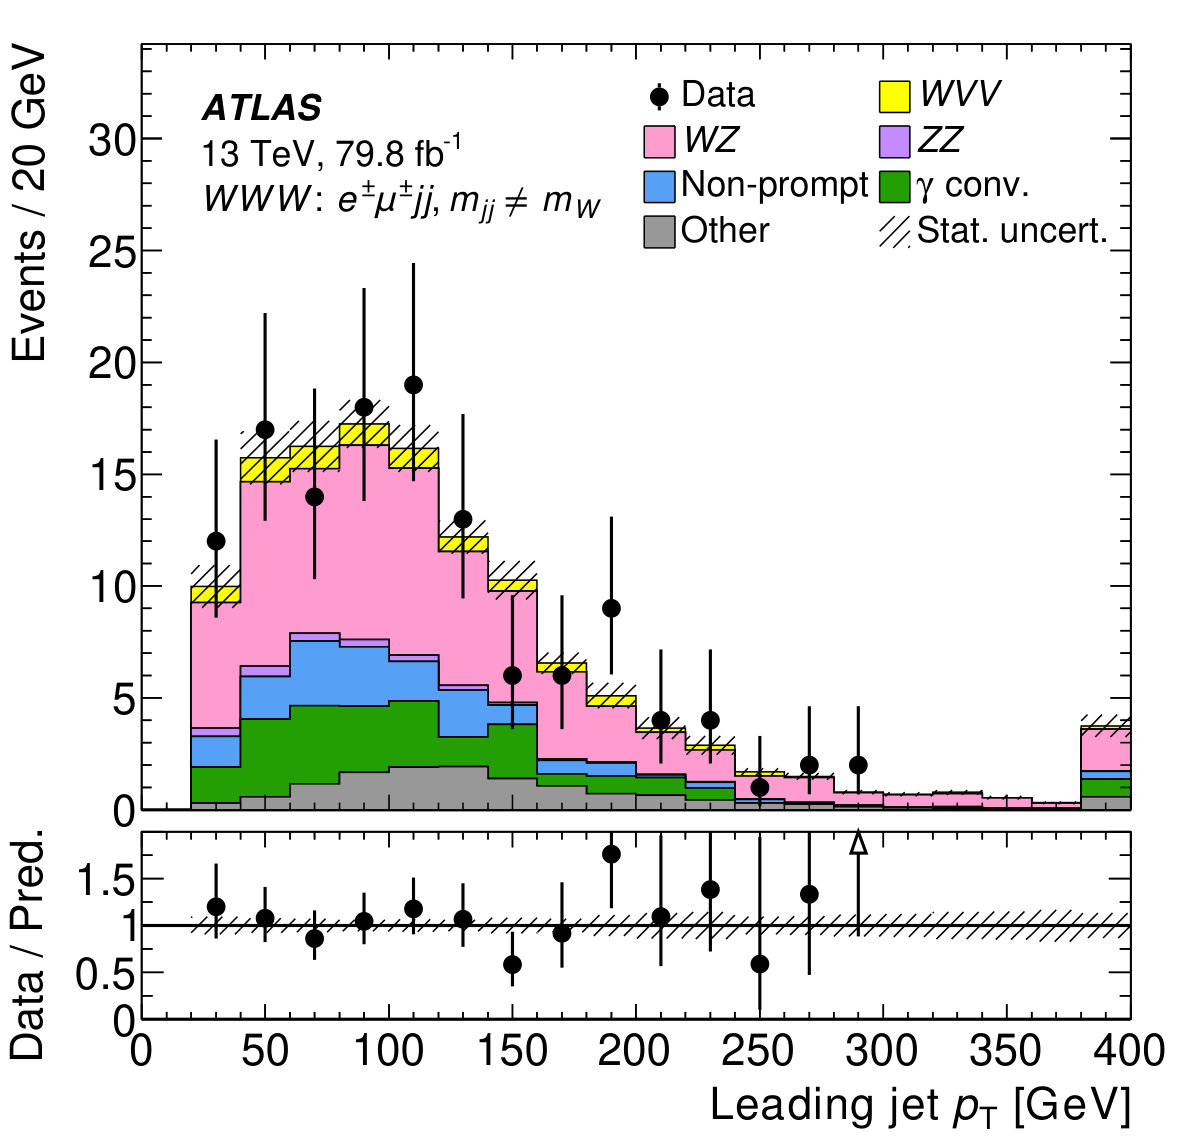 Figure 2
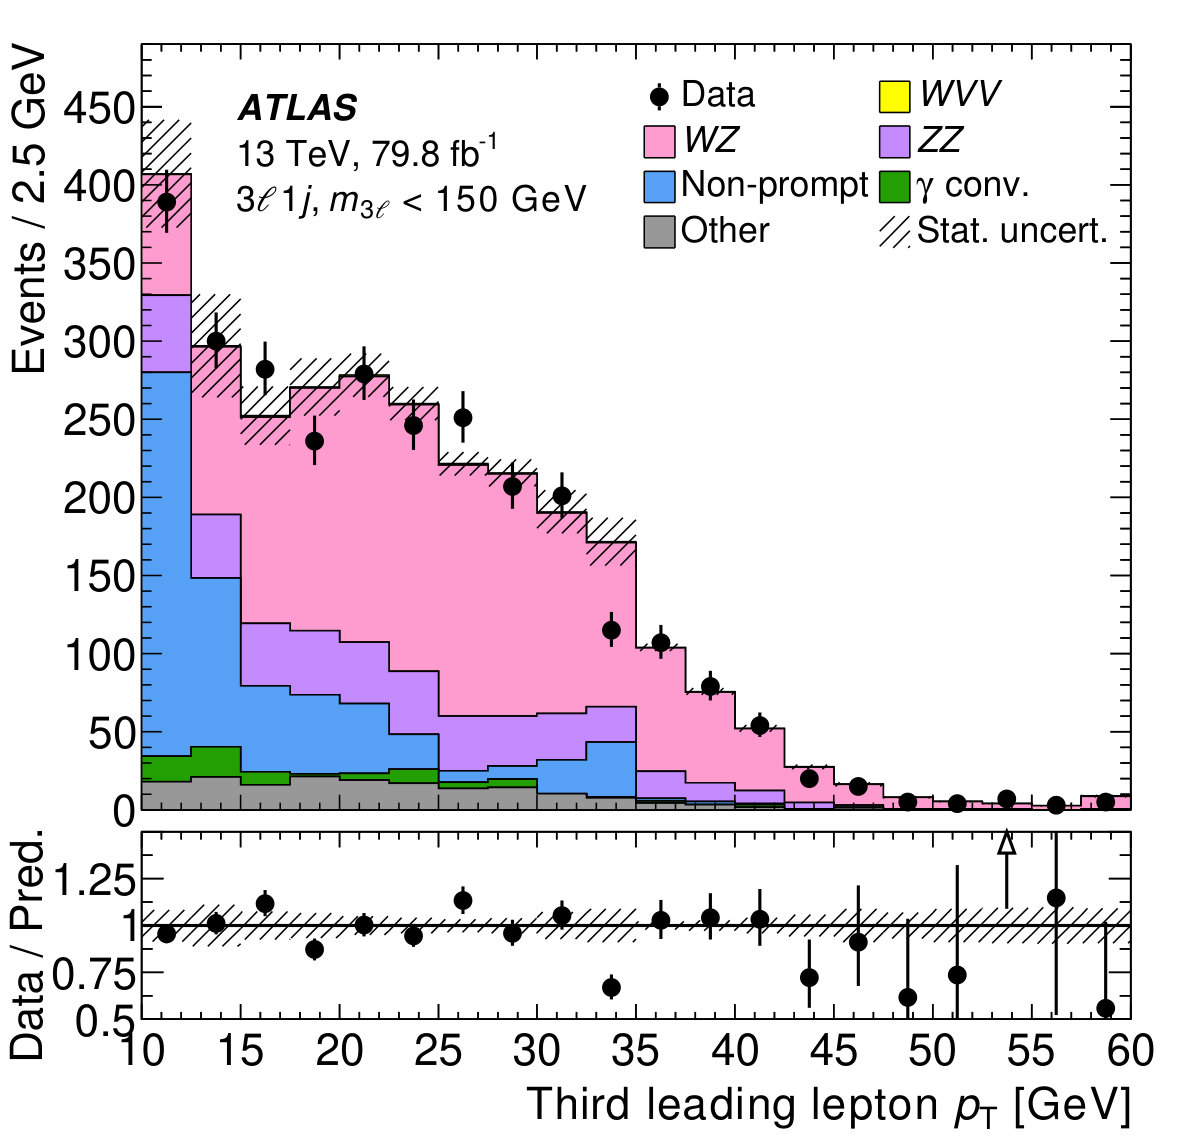 Figure 3
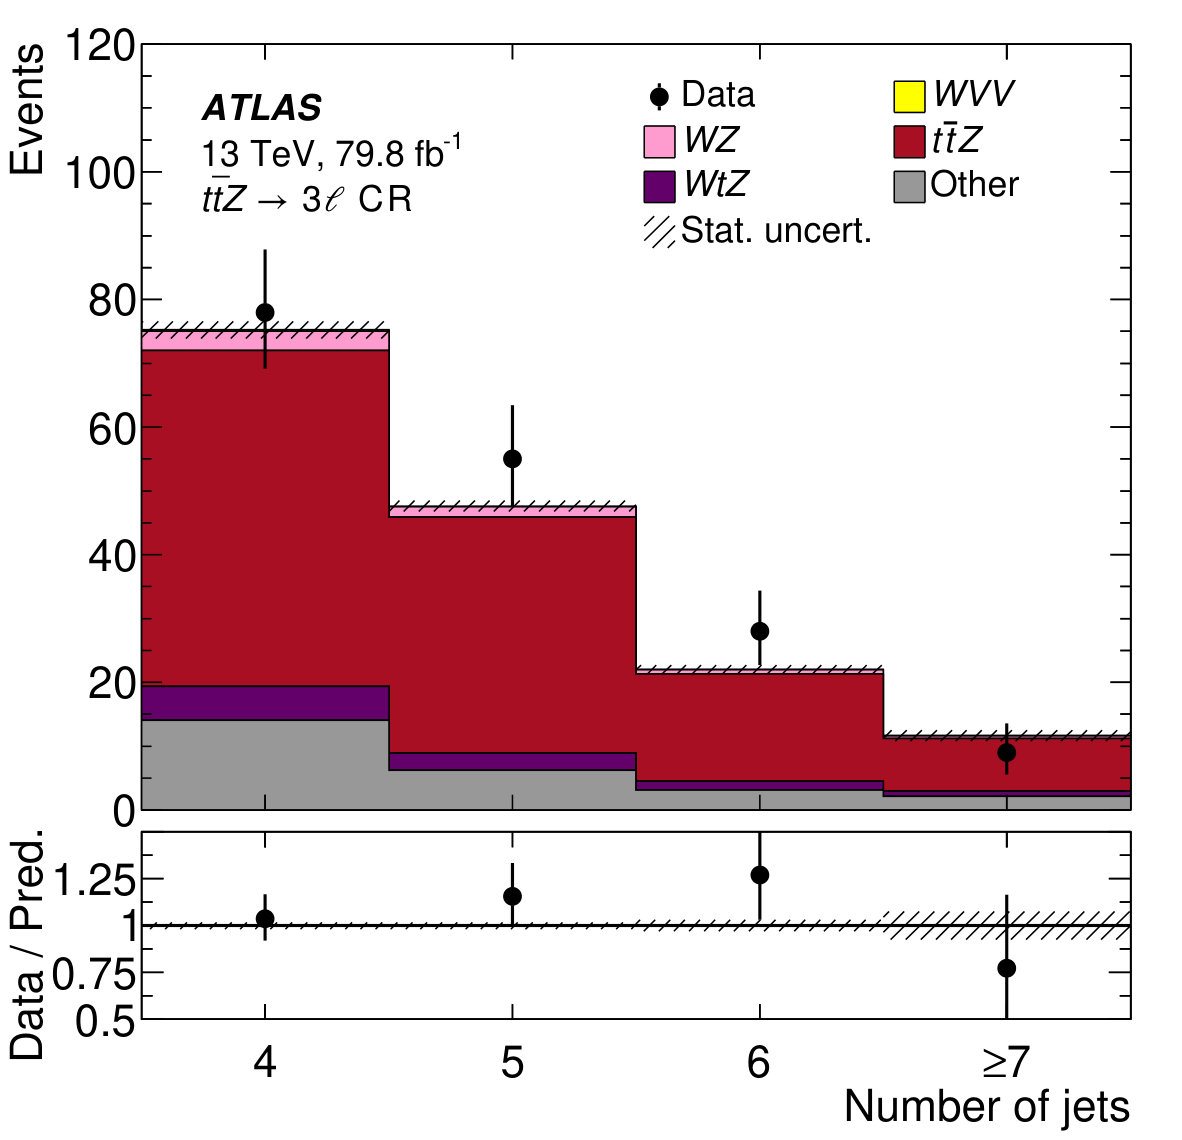 Figure 3
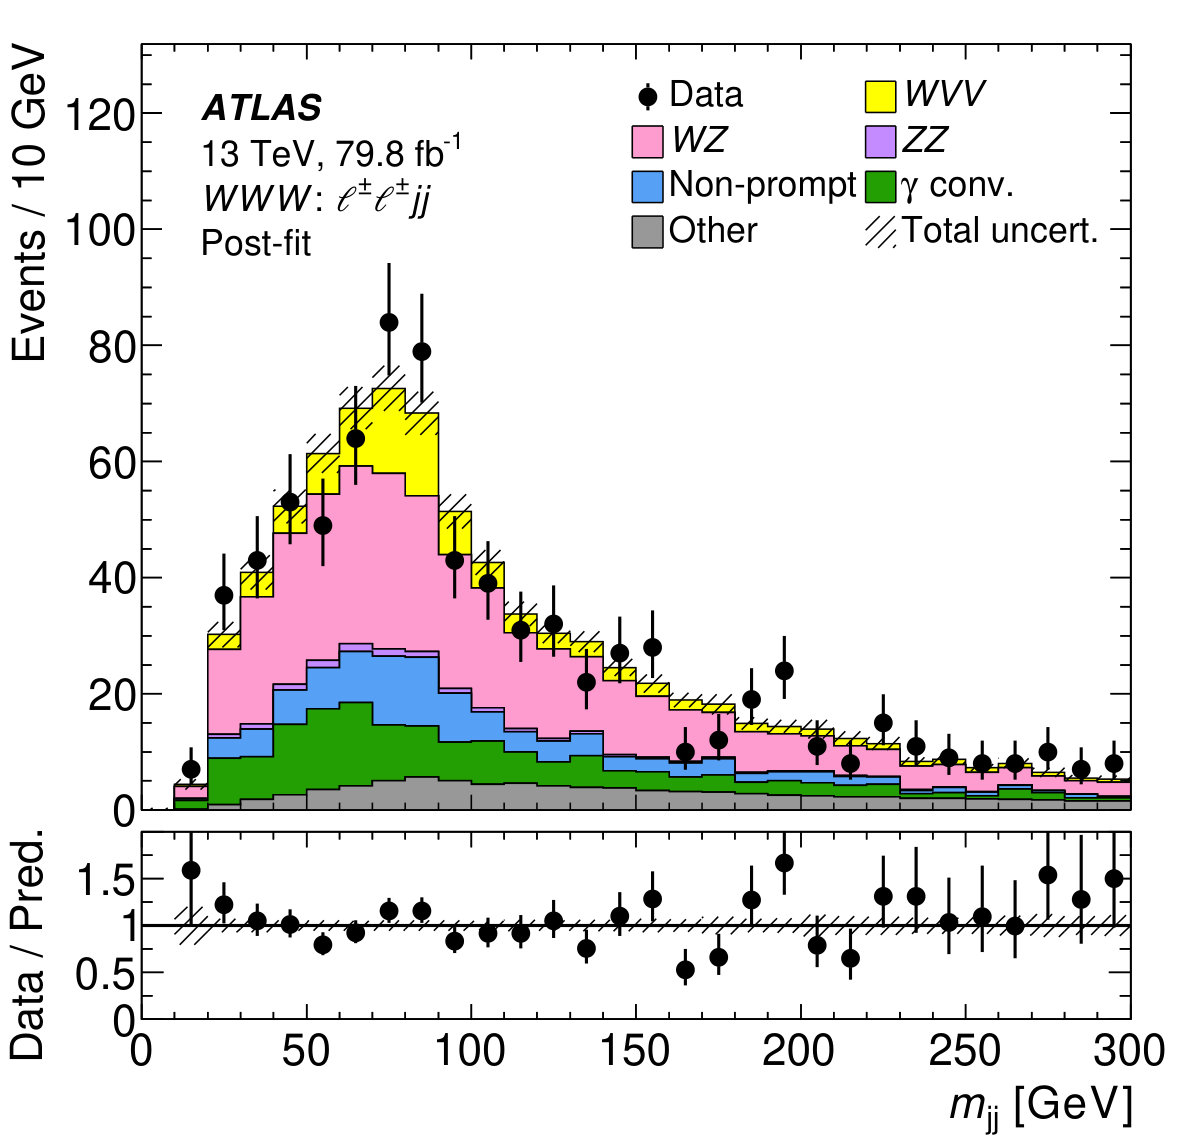 Figure 4
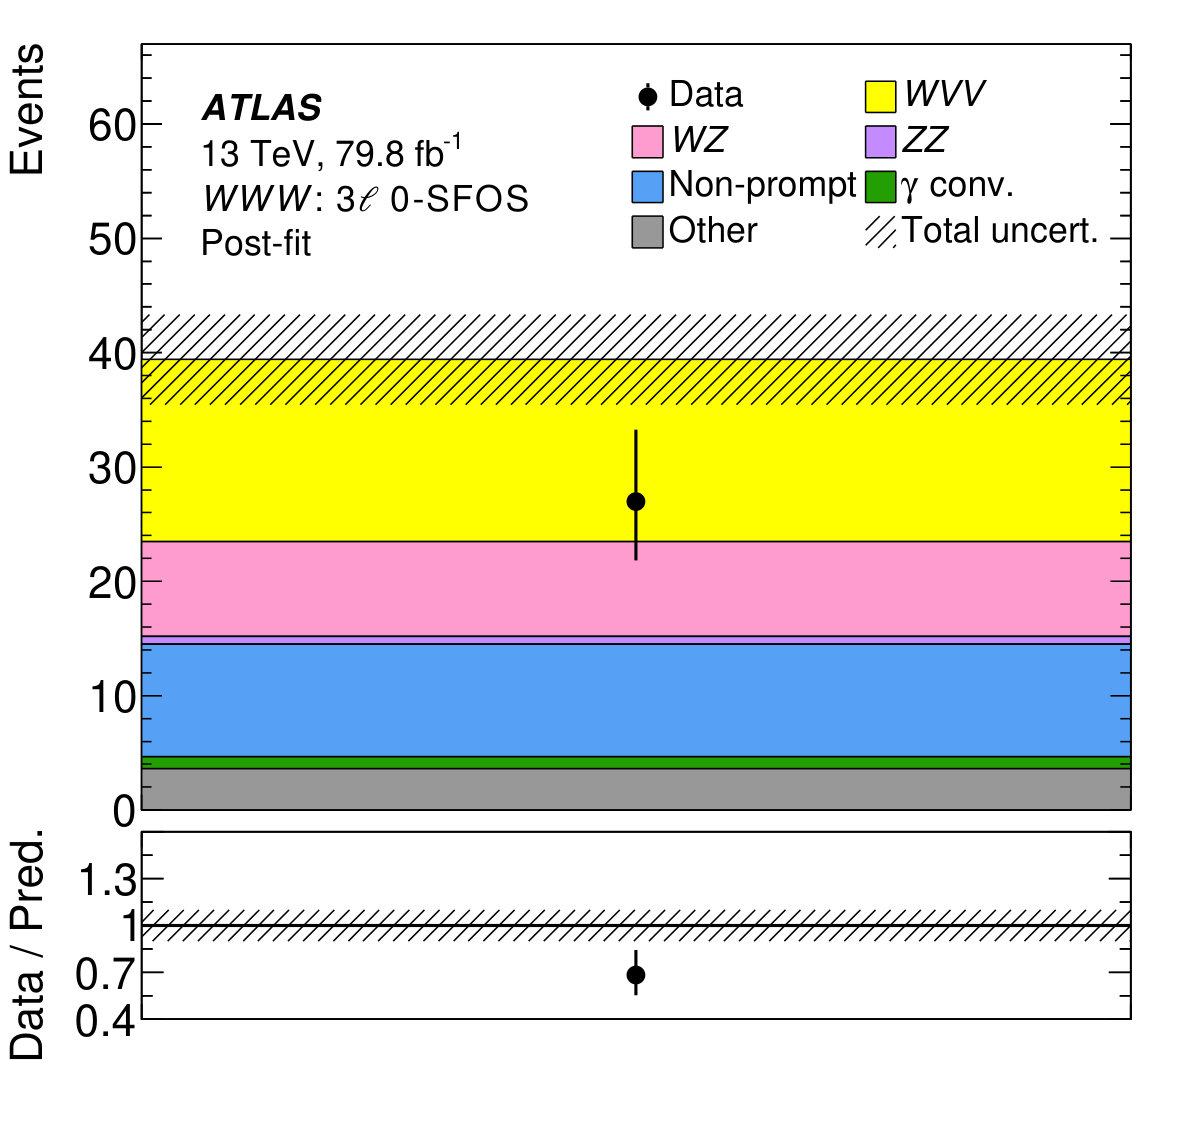 Figure 4
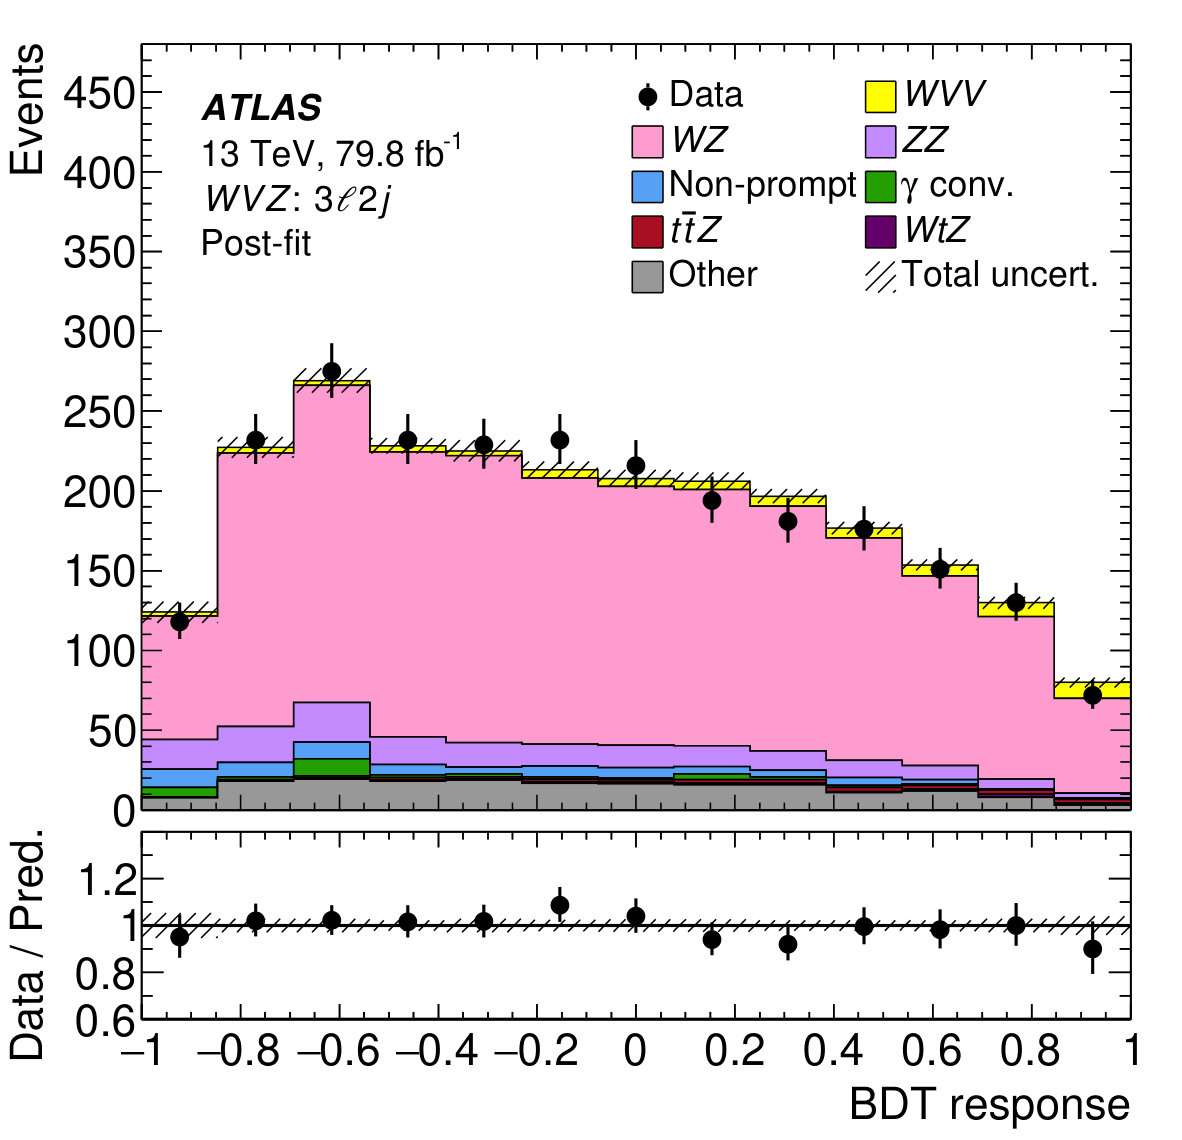 Figure 4
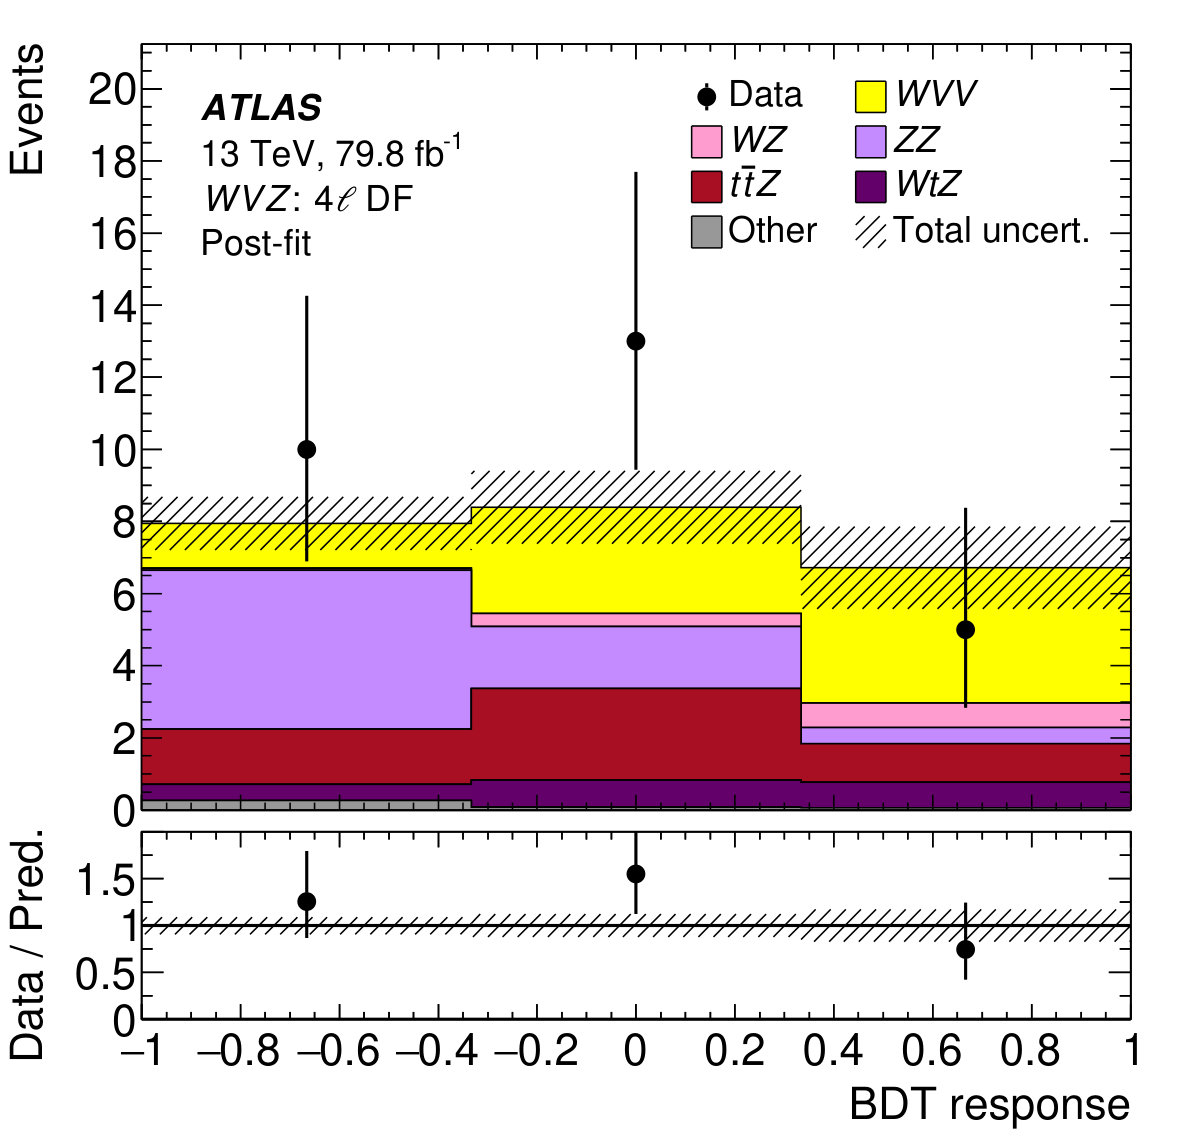 Figure 4
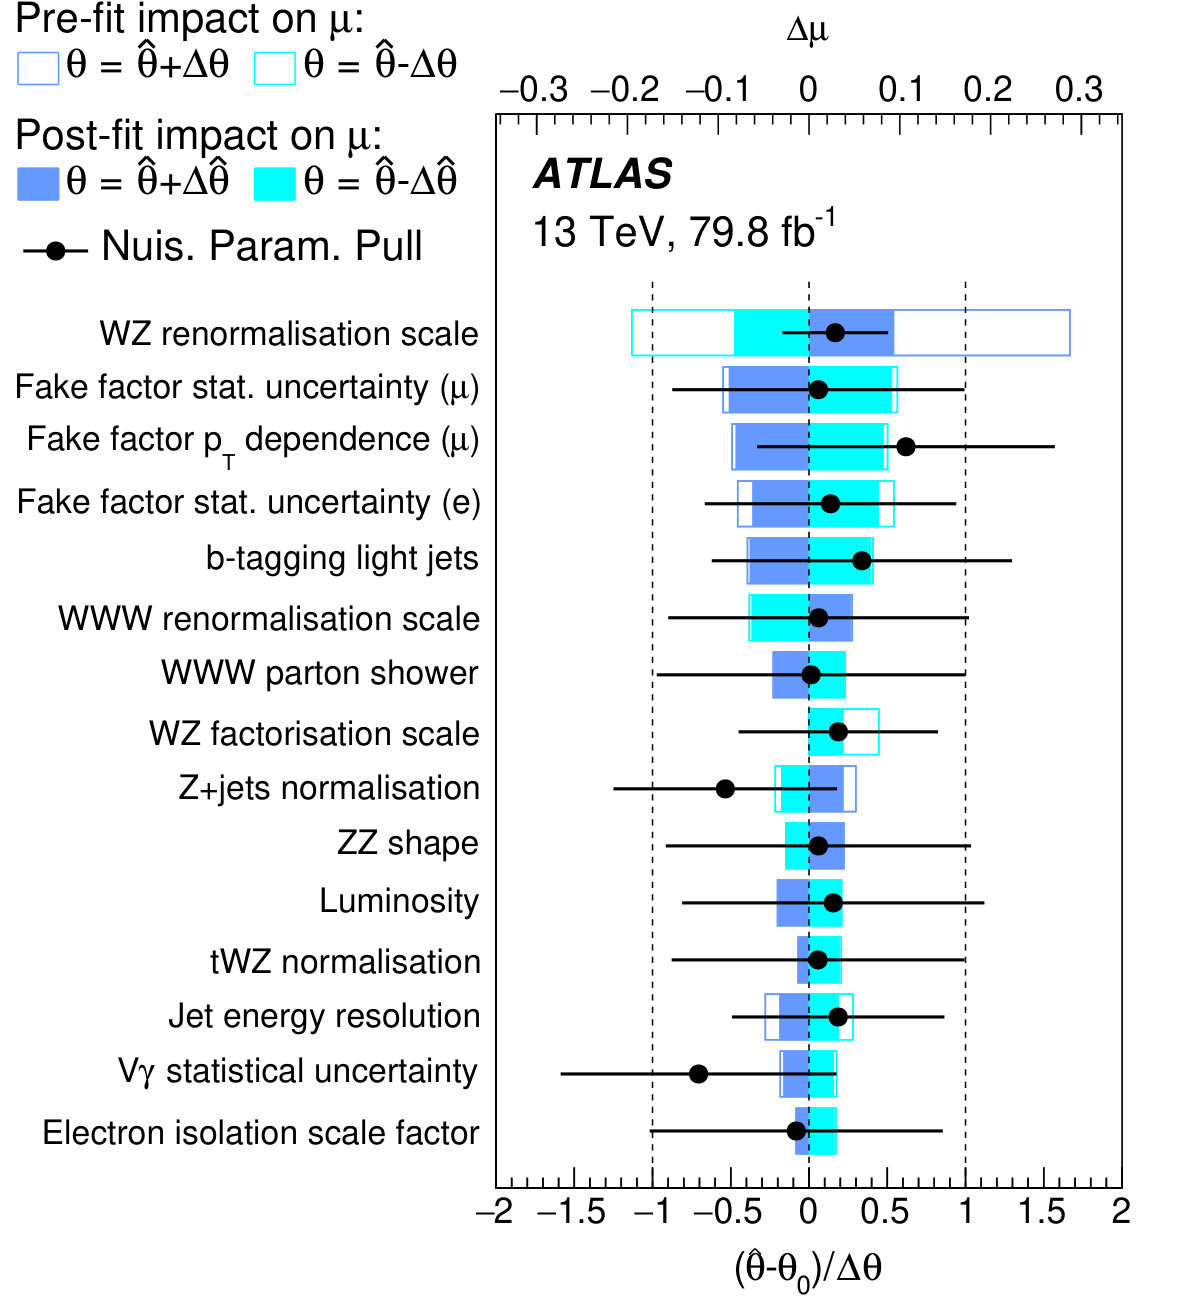 Figure 5
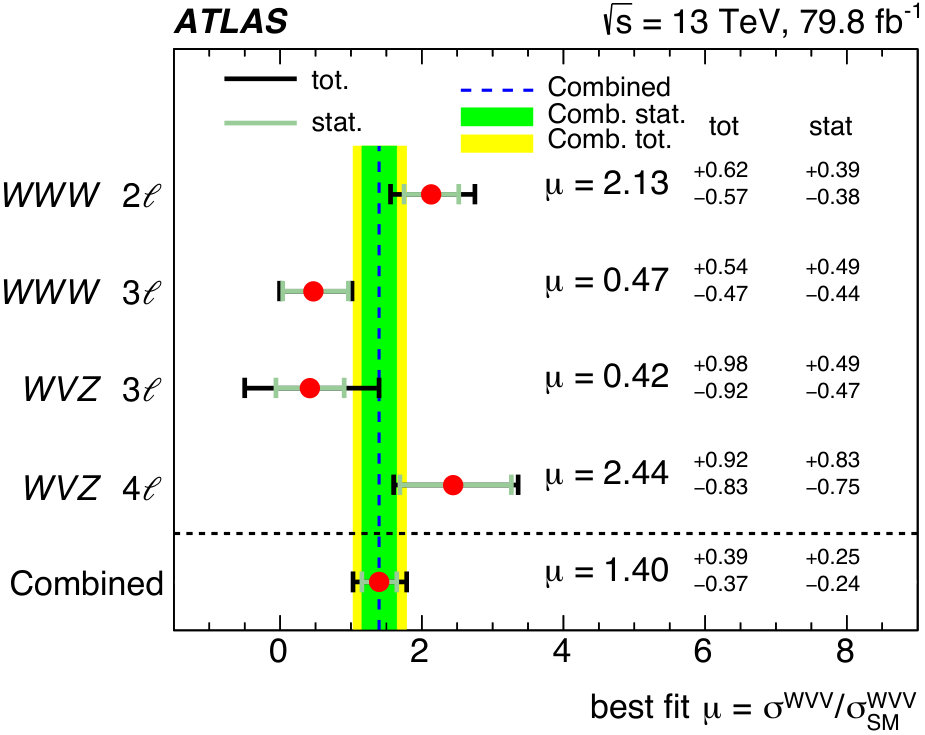 Figure 6
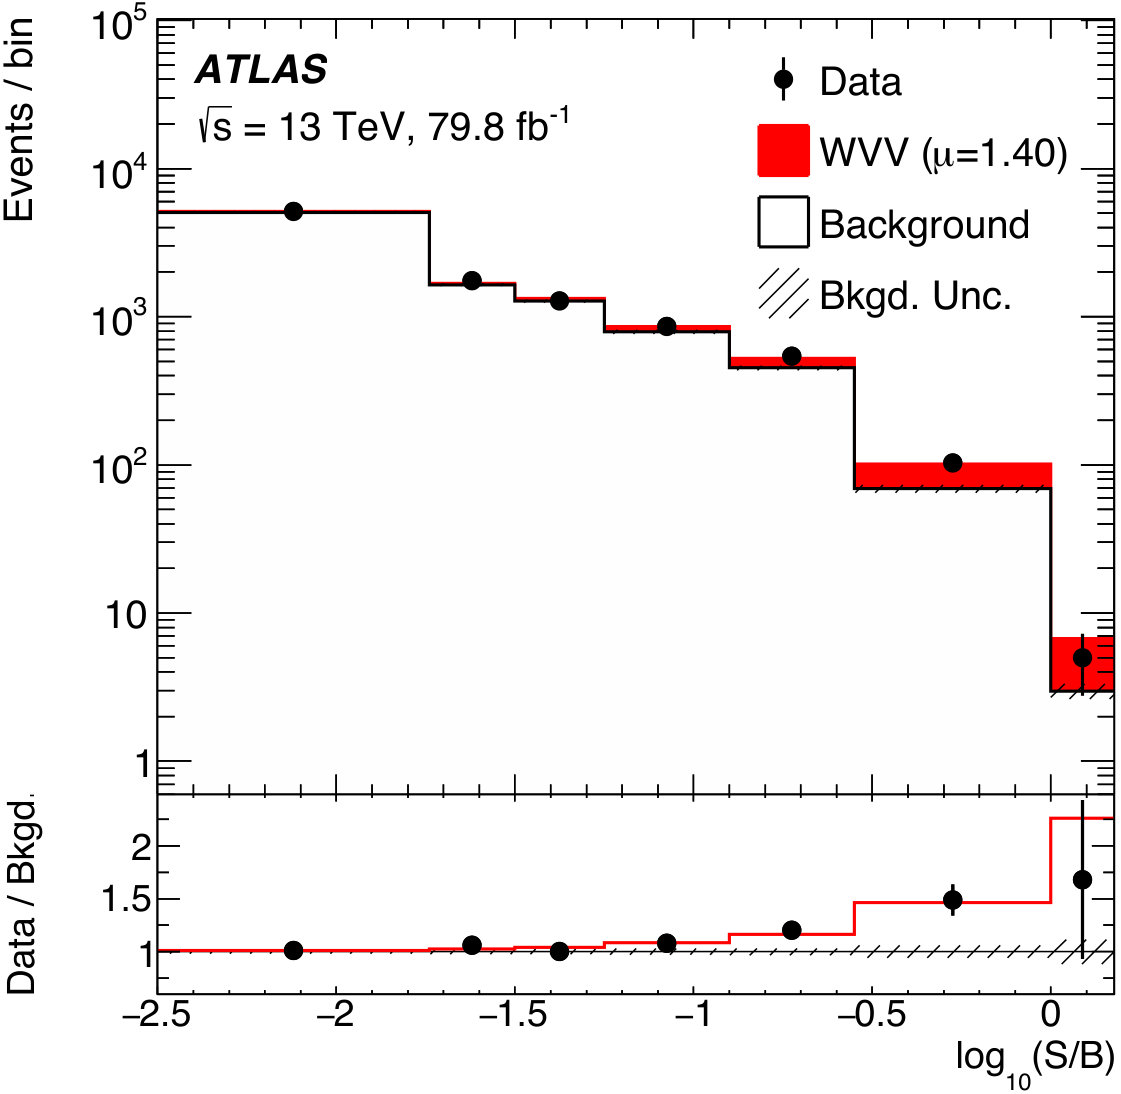 Figure 6
 Figure 16
 Figure 17
| Variable | 3-1j | 3-2j | 3-3j | DF | SF | SF |
|---|---|---|---|---|---|---|
| on-shell | off-shell | |||||
| Sum of | ||||||
| of best candidate | ||||||
| of other leptons | ||||||
| Sum of lepton charges | ||||||
| Sum of | ||||||
| Number of jets | ||||||
| of best candidate | ||||||
| Smallest | ||||||
| Leptonic | ||||||
| Hadronic | ||||||
| Invariant mass of all | ||||||
| leptons, jets and | ||||||
| Invariant mass of the | ||||||
| best leptons and |
| 9.9 | 3.3 | 26 | 9 | 23 | 8 | 30 | 10 | 15 | 5 | |
| 37.4 | 2.2 | 121 | 6 | 96 | 5 | 119 | 6 | 8.6 | 0.5 | |
| 0.46 | 0.05 | 5.11 | 0.25 | 3.44 | 0.18 | 4.12 | 0.24 | 0.69 | 0.03 | |
| Non-prompt | 6.1 | 3.0 | 35 | 5 | 17 | 9 | 37 | 7 | 9.4 | 1.5 |
| conv. | 20.9 | 1.9 | 35.0 | 3.1 | 76 | 7 | – | 1.06 | 0.11 | |
| Other | 12.9 | 1.0 | 25.7 | 1.7 | 20.3 | 1.3 | 25.3 | 1.6 | 3.5 | 0.4 |
| Total | 88 | 4 | 249 | 9 | 237 | 10 | 216 | 9 | 38 | 4 |
| Data | 87 | 239 | 235 | 237 | 27 | |||||
| 4-DF | 4-SF-Z | 4-SF-noZ | 3-1j | 3-2j | 3-3j | CR | ||||||||
| 9.6 | 3.5 | 5.0 | 1.8 | 10 | 4 | 62 | 23 | 85 | 30 | 84 | 30 | – | ||
| 1.11 | 0.13 | – | 1.08 | 0.14 | 2580 | 80 | 1830 | 60 | 1110 | 50 | 5.7 | 0.4 | ||
| 6.7 | 0.4 | 933 | 28 | 310 | 10 | 344 | 12 | 182 | 13 | 98 | 12 | 0.58 | 0.06 | |
| 5.1 | 0.5 | 0.55 | 0.08 | 4.5 | 0.5 | 7.6 | 1.1 | 22.6 | 2.5 | 82 | 8 | 122 | 9 | |
| 1.9 | 0.4 | 0.23 | 0.10 | 1.6 | 0.4 | 4.2 | 0.9 | 11.2 | 2.2 | 20 | 4 | 10.3 | 0.8 | |
| Non-prompt | – | – | 0.18 | 0.12 | 130 | 50 | 77 | 28 | 59 | 24 | 0.47 | 0.18 | ||
| conv. | – | – | – | 42 | 8 | 32 | 7 | 9.6 | 3.4 | 0.4 | 0.6 | |||
| Other | 0.4 | 0.4 | 1.8 | 1.1 | 1.0 | 0.7 | 200 | 15 | 182 | 16 | 120 | 10 | 24.4 | 2.5 |
| Total | 24.8 | 3.5 | 941 | 27 | 329 | 10 | 3370 | 70 | 2430 | 40 | 1580 | 40 | 160 | 10 |
| Data | 28 | 912 | 360 | 170 | ||||||||||
| Uncertainty source | ||
|---|---|---|
| Data-driven | +0.14 | –0.14 |
| Theory | +0.15 | –0.13 |
| Instrumental | +0.12 | –0.09 |
| MC stat. uncertainty | +0.06 | –0.04 |
| Generators | +0.04 | –0.03 |
| Total systematic uncertainty | +0.30 | –0.27 |
| Decay channel | Significance | |
|---|---|---|
| Observed | Expected | |
| combined | 3.2 | 2.4 |
| 4.0 | 1.7 | |
| 1.0 | 2.0 | |
| combined | 3.2 | 2.0 |
| 0.5 | 1.0 | |
| 3.5 | 1.8 | |
| combined | 4.1 | 3.1 |
Peer Reviews
No public reviews on file for this paper yet. If you reviewed it on a platform where reviews are public (OpenReview, ICLR, NeurIPS, ICML), you can paste yours below so the community can read it here.
Videos
No videos yet. Explain this paper in a talk, walkthrough, or lecture? Add one.
\AtlasTitle
Evidence for the production of three massive vector bosons with the ATLAS detector \AtlasAbstractA search for the production of three massive vector bosons in proton–proton collisions is performed using data at TeV recorded with the ATLAS detector at the Large Hadron Collider in the years 2015–2017, corresponding to an integrated luminosity of fb*-1*. Events with two same-sign leptons (electrons or muons) and at least two reconstructed jets are selected to search for . Events with three leptons without any same-flavour opposite-sign lepton pairs are used to search for , while events with three leptons and at least one same-flavour opposite-sign lepton pair and one or more reconstructed jets are used to search for . Finally, events with four leptons are analysed to search for and . Evidence for the joint production of three massive vector bosons is observed with a significance of 4.1 standard deviations, where the expectation is 3.1 standard deviations.
\PreprintIdNumberCERN-EP-2019-041 \AtlasRefCodeSTDM-2017-22 \AtlasJournalRefPhys. Lett. B 798 (2019) 134913 \AtlasDOI10.1016/j.physletb.2019.134913
1 Introduction
The joint production of three vector bosons is a rare process in the Standard Model (SM). Studies of triboson production can test the non-Abelian gauge structure of the SM theory and any deviations from the SM prediction would provide hints of new physics at higher energy scales [1, 2, 3, 4]. Triboson production has been studied at the Large Hadron Collider (LHC) using proton–proton () collision data taken at 8\text{,}\mathrm{TeV}$$ for processes such as [5], [6, 7], [8, 7], and [9, 10], and [11].
This letter presents the first evidence for the joint production of three massive vector bosons in collisions using the dataset collected with the ATLAS detector between 2015 and 2017 at 13\text{,}\mathrm{TeV}$$. At leading order (LO) in quantum chromodynamics (QCD), the production of three massive vector bosons (, with ) can proceed via the radiation of each vector boson from a fermion, from an associated boson production with an intermediate boson (, or ) decaying into two vector bosons, or from a quartic gauge coupling vertex. Representative Feynman diagrams are shown in Figure 1.
Two dedicated searches are performed, one for the (denoted as ) process and one for the (denoted as ) and (denoted as ) processes. To search for the process, events with two same-sign leptons with at least two jets resulting from (, including ) or three leptons resulting from are considered and are hereafter referred to as the and channels, respectively. To search for the and (denoted as ) processes, events with three or four leptons resulting from , , and are used. Selection criteria are chosen in order to ensure there is no overlap between different channels. A discriminant that separates the or signal from the background is defined in each channel. The discriminants are combined using a binned maximum-likelihood fit, which allows the signal yield and the background normalisations to be extracted. The combined observable is the signal strength parameter defined as the ratio of the measured cross section to its SM expectation, where one common ratio is assumed for and .
2 The ATLAS detector, data and simulation samples
The ATLAS detector [12, 13, 14] is a multi-purpose particle detector comprised of an inner detector (ID) surrounded by a superconducting solenoid, electromagnetic (EM) and hadronic calorimeters, and a muon spectrometer (MS) with one barrel and two endcap air-core toroids. The ID consists of a silicon pixel detector, a silicon microstrip detector, and a transition radiation tracker, and covers in pseudorapidity.111ATLAS uses a right-handed coordinate system with its origin at the nominal interaction point (IP) in the centre of the detector and the -axis along the beam pipe. The -axis points from the IP to the centre of the LHC ring, and the -axis points upward. Cylindrical coordinates are used in the transverse plane, being the azimuthal angle around the beam pipe. The pseudorapidity is defined in terms of the polar angle as . Angular distance is measured in units of . The calorimeter system covers the pseudorapidity range . The MS provides muon triggering capability for and muon identification and measurement for . A two-level trigger system [15], using custom hardware followed by a software-based trigger level, is used to reduce the event rate to an average of around for offline storage.
The data used were collected between 2015 and 2017 in collisions at 13\text{,}\mathrm{TeV}. Only events recorded with a fully operational detector and stable beams are included. Candidate events are selected by single isolated-lepton ($e$ or $\mu$) triggers with transverse momentum thresholds varying from $p_{\text{T}}=$20\text{\,}\mathrm{GeV} to (depending on the lepton flavour and run period) or single-lepton triggers with thresholds of 50\text{,}\mathrm{GeV} for muons and $p_{\text{T}}=$60\text{\,}\mathrm{GeV} for electrons. Due to the presence of two, three or four leptons in the final state, these single-lepton triggers are fully efficient for the triboson signals in the signal regions defined in Sections 4 and 5. The resulting total integrated luminosity is .
Signal and background processes were simulated with several Monte Carlo (MC) event generators, while the ATLAS detector response was modelled [16] with Geant4 [17]. The effect of multiple interactions in the same and neighbouring bunch crossings (pile-up) was included by overlaying minimum-bias events simulated with Pythia 8.186 [18] interfaced to EvtGen 1.2.0 [19], referred to as Pythia 8.1 in the following, and using the A3 [20] set of tuned MC parameters, on each generated event in all samples. Triboson signal events [21] were generated using Sherpa 2.2.2 [22, 23, 24] with the NNPDF3.0NNLO [25] parton distribution function (PDF) set, where all three bosons are on-mass-shell, using a factorised approach [26]. Events with an off-mass-shell boson through and were generated using Powheg-Box 2 [27, 28, 29, 30, 31, 32] interfaced to Pythia 8.1 for the analysis, while for the analysis only Pythia 8.1 was used. The generator was interfaced to the CT10 [33] (NNPDF2.3LO [34]) PDF and the AZNLO [35] (A14 [36]) set of tuned MC parameters for the () analysis. Both on-mass-shell and off-mass-shell processes were generated at next-to-leading order (NLO) QCD accuracy [37, 38, 39, 40] and are included in the signal definition. The expected cross sections for and production are and , respectively, with an uncertainty of , evaluated by varying parameters in the simulation related to the renormalisation and factorisation scales, parton shower and PDF sets.
Diboson (, , ) [26], [21] and single boson (+jets) [41] production, as well as electroweak production of jets, jets, and jets, were modelled using Sherpa 2.2.2 with the NNPDF3.0NNLO PDF set. In order to improve the agreement between the simulated and observed jet multiplicity distributions for the and events, a jet-multiplicity based reweighting was applied to the simulated and samples. Top-quark pair events () were generated using Powheg-Box 2 [42] interfaced to Pythia 8.230 [43] and EvtGen 1.6.0. The NNPDF3.0NLO PDF set was used for the matrix-element calculation, while the NNPDF2.3LO PDF set was used for the showering with the A14 set of tuned parameters. Other background processes containing top quarks were generated with MadGraph5_aMC@NLO [44] interfaced to Pythia 8, at LO (, , , and ) or at NLO (, , and ), with MadGraph5_aMC@NLO interfaced to Herwig [45] ( and ) or with Powheg-Box 2 [46] interfaced to Pythia 6 ().
3 Object definitions and selection criteria
Selected events are required to contain at least one reconstructed primary vertex. If more than one vertex is found, the vertex with the largest sum of associated ID tracks is selected as the primary vertex.
Electrons are reconstructed as energy clusters in the EM calorimeter that are matched to tracks found in the ID. Muons are reconstructed by combining tracks reconstructed in the ID with tracks or track segments found in the MS. Leptons need to satisfy 15\text{,}\mathrm{GeV} and have $|\eta|<2.47$ for electrons (electrons within the transition region between the barrel and endcap calorimeters, $1.37<|\eta|<1.52$, are excluded) and $|\eta|<2.5$ for muons. Leptons are required to be consistent with originating from the primary vertex by imposing requirements on the transverse impact parameter, $d_{0}$, its uncertainty, $\sigma_{d_{0}}$, the longitudinal impact parameter, $z_{0}$, and the polar angle $\theta$. These requirements are $|d_{0}|/\sigma_{d_{0}}<5$ and $|z_{0}\times\sin\theta|<$0.5\text{\,}\mathrm{m}\mathrm{m} for electrons, and and 0.5\text{,}\mathrm{m}\mathrm{m} for muons. Electrons have to satisfy the likelihood-based “Tight” quality definition which results in efficiencies of $58\%$ at $E_{\text{T}}=$4.5\text{\,}\mathrm{G}\mathrm{e}\mathrm{V} to at 100\text{,}\mathrm{GeV}$$ [47]. For the () analysis, muons are required to pass the “Medium” (“Loose”) identification criteria which results in efficiencies of approximately () for muons from a sample [48].
To reject jets misidentified as leptons or leptons from hadron decays (including - and -hadron decays), referred to as “non-prompt” leptons in the following, leptons are required to be isolated from other particles in both the calorimeters and the ID. The lepton isolation cone size is at most , except for the muon isolation in the ID, where it is at most . Electrons are required to pass the “Fix (Loose)” isolation requirement [49] and muons are required to pass the “Gradient” (“FixedCutLoose”) isolation requirement [48] for the () analysis. The identification and isolation requirements for muons are more restrictive in the analysis because a larger contamination from non-prompt leptons is expected. The electron Fix (Loose) isolation requirement results in an efficiency above 95% [47]. The muon isolation efficiency is above 90% (99%) for the Gradient isolation criteria for muons with of (), and the FixedCutLoose efficiency is above 95% [48].
A dedicated boosted decision tree (BDT), termed “non-prompt lepton BDT” [50], is used to reject leptons likely to originate from heavy-flavour decays. In addition, electrons have to pass the “charge misidentification suppression BDT” [49] to reject electrons likely to have the electric charge wrongly measured. The non-prompt lepton BDT uses isolation and -tagging information derived from energy deposits and tracks in a cone around the lepton direction. The charge misidentification suppression BDT uses the electron track impact parameter, the track curvature significance, the cluster width and the quality of the matching between the cluster and its associated track. Leptons passing all requirements listed above are referred to as “nominal” leptons. The combination of isolation, non-prompt lepton BDT and charge misidentification suppression BDT criteria results in an efficiency of 65% (89%) for electrons with of () [47]. The combination of isolation and non-prompt lepton BDT results in an efficiency of 65% (99%) for muons that have the Gradient isolation with of (), and an efficiency of 74% (99%) for muons that have the FixedCutLoose isolation with of () [48].
Jets are reconstructed from calibrated topological clusters built from energy deposits in the calorimeter [51] using the anti- algorithm with a radius parameter of 0.4 [52, 53] and calibrated using the techniques described in Ref. [54]. Jet candidates are required to have 20\text{,}\mathrm{GeV} and $|\eta|<2.5$. To reject jets likely to be arising from pile-up collisions, an additional criterion using the jet vertex tagger [[55](#bib.bibx55)] discriminant is applied for jets with $p_{\text{T}}<$60\text{\,}\mathrm{GeV} and . Jets containing -hadrons (-jets) are identified by a multivariate discriminant combining information from algorithms using secondary vertices reconstructed within the jet and track impact parameters [56, 57], with an efficiency of 85% (70%) for the () analysis.
The missing transverse momentum, whose magnitude is denoted , is defined as the negative vector sum of the of all reconstructed and calibrated objects in the event. This sum includes a term to account for the energy from low-momentum particles that are not associated with any of the selected objects, and is calculated from ID tracks matched to the reconstructed primary vertex in the event [58]. The sum also includes jets with and 30\text{,}\mathrm{GeV}$$.
The object reconstruction and identification algorithms do not always result in unambiguous identifications. An overlap removal algorithm is therefore applied. Electrons sharing a track with any muons are removed. Any jet within of an electron is removed and electrons within of any remaining jets are removed. Jets with less than three associated tracks and within of a muon are removed, and muons within of any of the remaining jets are removed.
At least one reconstructed “trigger” lepton with a minimum is required to match within a lepton with the same flavour reconstructed by the trigger algorithm. The thresholds for the trigger (other) leptons are () for the analysis, and from to (), depending on the run period and lepton flavour, for the analysis.
4 Analysis targeting
The experimental signature of the process is the presence of two same-sign leptons, , and two jets. The signature of the process is the presence of three leptons and . To reduce the background contributions from processes that have more than two (three) leptons in the () channel a “veto lepton” definition is introduced. Compared with the nominal lepton selection criteria described in Section 3, the veto lepton threshold is lowered to , and the isolation, non-prompt lepton BDT, charge misidentification suppression BDT, and impact parameter requirements are removed. For veto electrons, the likelihood-based Loose identification definition [49] is used. For veto muons, the Loose identification definition [48] is used, and the pseudorapidity range is extended to .
To select candidates, events are required to have exactly two nominal leptons with 20\text{,}\mathrm{GeV} and the same electric charge, at least two jets, and no identified $b$-jets. Four regions are considered, based on the lepton flavour, namely $ee$, $e\mu$, $\mu e$, and $\mu\mu$, where $e\mu$ denotes the highest-$p_{\text{T}}$ (leading) lepton being an electron, while $\mu e$ denotes the leading lepton being a muon. Events with an additional veto lepton are removed. The invariant mass of the dilepton system is required to be in the range $40<m_{\ell\ell}<$400\text{\,}\mathrm{GeV}. The upper mass limit reduces the contribution from the +jets process. The leading (sub-leading) jet must have and . The dijet system, formed by the two jets with the largest , is required to have 300\text{,}\mathrm{GeV} and $|\Delta\eta_{jj}|<1.5$, where $m_{jj}$ is the dijet invariant mass and $\Delta\eta_{jj}$ is the pseudorapidity separation between the two jets. The cuts applied on the dijet system mainly reduce the contributions from the same-sign $WW$ vector boson scattering process. Additionally, in the $ee$ final state, $E_{\text{T}}^{\text{miss}}$ is required to be above $55\text{\,}\mathrm{GeV}$ and $m_{\ell\ell}$ must satisfy $m_{\ell\ell}<$80\text{\,}\mathrm{GeV} or 100\text{,}\mathrm{GeV}$$, to reduce contamination from where the charge of one electron is misidentified. This cut is not applied in the final state, since the muon charge misidentification rate is found to be negligible, nor is it applied in the and final states, where the contamination from events is small.
To select candidates, events are required to have exactly three nominal leptons with 20\text{,}\mathrm{GeV}$$ and no identified -jets. Events with an additional veto lepton are removed. To reduce the contribution from the process, events are required to have no same-flavour opposite-sign (SFOS) lepton pairs, and thus only and events are selected.
A major background originates from the +jets +jets process, contributing to the channel when one lepton is not reconstructed or identified, or to the channel, when a boson decays into a pair of leptons both of which decay to an electron or muon. Simulation is used to estimate this background. The +jets modelling is tested in a -dominated validation region defined by selecting events with exactly three nominal leptons with one SFOS lepton pair. In addition, events are required to have no -jets reconstructed, 55\text{,}\mathrm{GeV} and the trilepton invariant mass $m_{\ell\ell\ell}>$110\text{\,}\mathrm{GeV}. Data and simulation agree in this validation region, as shown in Figure 2(a) for the leading lepton distribution.
Contributions from SM processes that produce at least one non-prompt lepton are estimated using a data-driven method as described in Ref. [59] by introducing “fake” leptons. The definitions of nominal and fake leptons are mutually exclusive. Fake electrons have to satisfy the likelihood-based Medium [49] but fail the Tight identification, and the isolation, non-prompt lepton BDT and charge misidentification suppression BDT requirements are removed. Fake muons have the impact parameter requirements loosened to , and both isolation and non-prompt lepton BDT requirements are removed. Additionally, they have to fail the nominal muon definition. Simulation shows that the process is the dominant contributor of events with fake leptons, with more than 90% in the channel and more than 95% in the channel originating from this process. Events containing one (two) nominal lepton(s) and one fake lepton with 20\text{,}\mathrm{GeV}$$ are scaled by a “fake factor” to predict the non-prompt lepton background contribution in the () channel. The fake factor is the ratio of the number of non-prompt leptons passing the nominal lepton criteria over the number passing the fake lepton criteria. Its value is derived from two -enriched regions selected with two or three leptons (no SFOS lepton pairs) and exactly one -jet. One of the same-sign leptons passes either nominal or fake lepton criteria, while the other lepton(s) must pass the nominal lepton criteria. The fake factor is found to be for electrons and for muons.
Events resulting from the production can pass the , or signal selection criteria if the photon is misreconstructed as an electron. This contribution (referred to as “ conv.”) is evaluated using a data-driven method similar to the non-prompt lepton background evaluation by introducing “photon-like” electrons. A photon-like electron is an object reconstructed like a nominal electron except that the track has no hit in the innermost layer of the pixel detector and the non-prompt lepton BDT and charge misidentification suppression BDT requirements are not applied. The photon fake factor is determined in two regions selected with two nominal muons, no -jets, and one nominal or photon-like electron. The trilepton invariant mass is required to satisfy 80\text{\,}\mathrm{GeV}$<m_{e\mu\mu}<$100\text{\,}\mathrm{GeV}. Most of these events contain a decay, where one muon radiates a photon, which is misreconstructed as an electron.
The charge misidentification background originates from processes that produce oppositely-charged prompt leptons, where one lepton’s charge is misidentified and results in final states with two same-sign leptons. The background is estimated using a data-driven technique as described in Ref. [11].
All candidates with 50\text{,}\mathrm{GeV} or $m_{jj}>$120\text{\,}\mathrm{GeV} (denoted as the “ sideband” region) are used to validate the modelling of different backgrounds described above. Data and prediction agree, as shown in Figure 2(b) for the leading jet distribution. Events with 300\text{,}\mathrm{GeV}$$ are used in the fit to extract the signal.
5 Analysis targeting and
The experimental signature of the , , and processes is the presence of three or four charged leptons. In order to increase the signal acceptance, “loose” leptons are defined in addition to nominal leptons, the latter being a subset of the former. Loose leptons have both the isolation and non-prompt lepton BDT requirements removed. In addition, loose electrons are required to pass the likelihood-based Loose identification definition and the charge misidentification suppression BDT requirement is removed.
Six regions are defined with either three or four loose leptons, sensitive to triboson final states containing bosons. Among all possible SFOS lepton pairs, the one with closest to the boson mass is defined as the best candidate. In all regions, the presence of such a best candidate with 91.2\text{,}\mathrm{GeV}10\text{,}\mathrm{GeV}, is required. Furthermore, any SFOS lepton pair combination is required to have a minimum invariant mass of $m_{\ell\ell}>$12\text{\,}\mathrm{GeV}. Events with -tagged jets are vetoed.
For the three-lepton channel, the lepton which is not part of the best candidate is required to be a nominal lepton. The scalar sum of the transverse momenta of all leptons and jets () is required to be larger than . This significantly reduces the contribution of the processes with one additional non-prompt lepton. Three regions are defined according to the number of jets in the event: one jet (3-1j), two jets (3-2j), and at least three jets (3-3j).
For the four-lepton channel, the third and fourth leading leptons are required to be nominal leptons. The two leptons which are not part of the best candidate definition are required to have opposite charges. These “other leptons” are used to define three regions, depending on whether they are different-flavour (4-DF), or same-flavour and their mass lies within a window of around the boson mass (4-SF-Z) or their mass is outside this window (4-SF-noZ).
In each of the six regions the distribution of a dedicated BDT discriminant, separating the signal from the dominating diboson background, is fed as input to the binned maximum-likelihood fit to extract the signal. For the three-lepton channels, 13, 15, and 12 input variables are used for the 3-1j, 3-2j, and 3-3j final states, respectively, while for the four-lepton channels, six input variables are used for each of the 4-DF, 4-SF-Z and 4-SF-noZ final states. These input variables are listed in Table 1.
Due to the required presence of nominal leptons in the three- and four-lepton channels, backgrounds with a boson and non-prompt leptons are reduced. The remaining backgrounds are dominated by processes with prompt leptons and thus all backgrounds are estimated using simulation. The jets and +jets backgrounds are validated in a region defined in the same way as the 3-1j region, with the exception that no requirement on is applied, the third-highest- lepton is required to have a small transverse momentum (10\text{\,}\mathrm{GeV}$<p_{\text{T}}<$15\text{\,}\mathrm{GeV}), and the invariant mass of the three leptons has to be smaller than . Data and expectation agree in the 3-1j validation region, as shown in Figure 3(a) for the transverse momentum distribution of the third-highest- lepton.
The background is determined in a region defined like the 3-3j region with the exception that no requirement on is applied, and at least four jets are required, of which at least two are -tagged. This region is included as a single-bin control region (CR) in the fit model, outlined in Section 6. Data and expectation agree, as shown in Figure 3(b) for the control region.
6 Signal extraction and combination
The , and regions are combined using the profile likelihood method described in Ref. [60] based on a simultaneous fit to distributions in the signal and background control regions. A total of eleven signal regions are considered: four regions (, , , and ) for the channel, one region ( and combined) for the channel, three regions (3-1j, 3-2j, and 3-3j) for the three-lepton channel, and three regions (4-DF, 4-SF-Z, and 4-SF-noZ) for the four-lepton channel. One control region is considered: the control region described in Section 5. The distributions used in the fit are the distributions for the channel and the BDT distributions for the three-lepton and four-lepton channels. The number of selected events in the channel and the control region are each included as a single bin in the fit. In total, 186 bins are used in the combined fit.
A binned likelihood function , ) is constructed as a product of Poisson probability terms over all bins considered. This likelihood function depends on the signal-strength parameter , a multiplicative factor that scales the number of expected signal events, and , a set of nuisance parameters that encode the effect of systematic uncertainties in the signal and background expectations. The nuisance parameters are implemented in the likelihood function as Gaussian, log-normal or Poisson constraints. The same value for is assumed for the on- and off-mass-shell , and processes. Correlations of systematic uncertainties arising from common sources are maintained across processes and channels.
Experimental uncertainties are related to the lepton trigger, reconstruction and identification efficiencies [49, 48], lepton isolation criteria [50], lepton energy (momentum) scale and resolution [48, 61], jet energy scale and resolution [54], jet vertex tagging [55, 62], -tagging [57], modelling of pile-up and missing transverse momentum [58], and integrated luminosity [63, 64]. Nuisance parameters related to these uncertainties are treated as correlated between all channels. The time-dependence of the efficiencies, scales and resolutions across the various run periods is taken into account.
For each of the background processes evaluated using simulation, a nuisance parameter representing its normalisation uncertainty is included. The following prior uncertainties in the normalisations are assumed: 20% for and ; 40% for +jets, 10% [65] for , 30% [66, 67] for , 11% [68] for , and 30% for not producing three massive bosons. For dominant backgrounds from the and processes, the simultaneous fit model has the power to constrain their normalisations at the 5% level, independently of the assumed prior. In addition, shape-only variations for backgrounds from the and processes are derived from alternative samples, generated using Powheg [69] with Pythia 8 for the parton shower to account for differences in the modelling of diboson production and showering. Shape variations due to renormalisation and factorisation scales are also considered for these two processes. The prior uncertainties assumed for +jets and cover the observed data/simulation agreement in validation regions, and the calculations in Ref. [68], respectively. The impact of these uncertainties on the measurement is small.
Uncertainties in data-driven background evaluations mainly come from statistical and systematic uncertainties in the charge misidentification rate, lepton fake factor, and photon-like electron scale factor. Additional uncertainties come from the statistical uncertainties in the subsamples used to extrapolate the background evaluations to the signal region. Nuisance parameters are treated as correlated for backgrounds evaluated using the same method and from the same systematic sources.
Shape-only variations of the signal distributions due to QCD renormalisation and factorisation scales, PDF, and parton-shower matching scales are considered in the simultaneous fit. The corresponding nuisance parameters are treated as correlated between the and channels in the analysis and between three-lepton and four-lepton channels in the analysis. These parameters are treated as uncorrelated between the and analyses.
Tables 2 and 3 show the post-fit background, signal and observed yields for the signal regions and the background control region. The contribution to the signal from associated production is in the fiducial regions and in the fiducial regions. Contributions from SM processes producing the same detector signature as events in these signal regions (or the control region) besides those listed are combined into “Other”. The uncertainties shown include both statistical and systematic uncertainties. Data and predictions agree in all channels.
Figure 4 shows the comparison between data and post-fit prediction of the combined distribution for the channel, the number of selected events for the channel, and the BDT output distributions in the 3-2j and 4-DF regions for the analysis. The 3-2j and 4-DF regions are chosen since they have the best sensitivity among the three-lepton and four-lepton channels. Data and predictions agree in all distributions.
The overall observed (expected) significance for production is found to be 4.1 (3.1), constituting evidence for the production of three massive vector bosons. The combined best-fit signal strength for the process, obtained by the fit to the eleven signal regions and one control region, is with respect to the SM prediction (Section 2). The compatibility of the individual signal strengths is , determined by repeating the fit, assuming individual signal strengths, and evaluating the -value of the of the comparison. The statistical uncertainty in the measured signal strength is and the systematic uncertainty is . The impact of the most important groups of systematic uncertainties on the measured value of is shown in Table 4. The largest systematic uncertainties come from uncertainties related to data-driven background evaluations affecting the channels, from theoretical uncertainties related to renormalisation and factorisation scale variations and experimental uncertainties. The impact of each systematic uncertainty on the result is assessed and the ranking for the nuisance parameters with the largest contribution to the uncertainty in is shown in Figure 5.
Additional fits are performed separately in the and the channels. For these fits the other signal strength is fixed to its SM expectation. For the fits of the channels, the control region defined in Section 4 is used in the fit. The inclusion of the control region helps constraining the overall normalisation of the +jets background, which in the combined fit is constrained by the three-lepton signal regions. The control region is used in the fit, however, it is not used in the fit. The observed (expected) significance is 3.2 (2.4) for production and 3.2 (2.0) for production.
Table 5 and Figure 6(a) summarise the observed and expected significances with respect to the background-only hypothesis and the observed best-fit values of the signal strength for the individual and combined fits. The measured signal strengths from the individual fits are converted to inclusive cross-section measurements using the signal samples described in Section 2 and the central values of the theoretical predictions. All uncertainties determined in the fit are included in the conversion, except for the normalisation uncertainty in the signal prediction. The results are: pb and pb. For the extraction, the normalisation is fixed to the SM expectation. The cross section of the latter is not reported, since there is not enough sensitivity to this channel to quote a separate cross-section value.
Figure 6(b) shows the data, background and signal yields, where the discriminant bins in all signal regions are combined into bins of , S being the expected signal yield and B the background yield. The background and signal yields are shown after the global signal-plus-background fit to the data.
7 Conclusion
In conclusion, a search for the joint production of three massive vector bosons ( or ) in proton–proton collisions using 79.8 fb*-1* of data at 13\text{,}\mathrm{TeV}$$ collected by the ATLAS detector at the LHC, is presented. Events with two, three or four reconstructed electrons or muons are analysed. Evidence for the production of three massive vector bosons is observed with a combined significance of 4.1 standard deviations, where the expectation is 3.1 standard deviations. The measured production cross sections are pb, and pb, in agreement with the Standard Model predictions.
Acknowledgements
We thank CERN for the very successful operation of the LHC, as well as the support staff from our institutions without whom ATLAS could not be operated efficiently.
We acknowledge the support of ANPCyT, Argentina; YerPhI, Armenia; ARC, Australia; BMWFW and FWF, Austria; ANAS, Azerbaijan; SSTC, Belarus; CNPq and FAPESP, Brazil; NSERC, NRC and CFI, Canada; CERN; CONICYT, Chile; CAS, MOST and NSFC, China; COLCIENCIAS, Colombia; MSMT CR, MPO CR and VSC CR, Czech Republic; DNRF and DNSRC, Denmark; IN2P3-CNRS, CEA-DRF/IRFU, France; SRNSFG, Georgia; BMBF, HGF, and MPG, Germany; GSRT, Greece; RGC, Hong Kong SAR, China; ISF and Benoziyo Center, Israel; INFN, Italy; MEXT and JSPS, Japan; CNRST, Morocco; NWO, Netherlands; RCN, Norway; MNiSW and NCN, Poland; FCT, Portugal; MNE/IFA, Romania; MES of Russia and NRC KI, Russian Federation; JINR; MESTD, Serbia; MSSR, Slovakia; ARRS and MIZŠ, Slovenia; DST/NRF, South Africa; MINECO, Spain; SRC and Wallenberg Foundation, Sweden; SERI, SNSF and Cantons of Bern and Geneva, Switzerland; MOST, Taiwan; TAEK, Turkey; STFC, United Kingdom; DOE and NSF, United States of America. In addition, individual groups and members have received support from BCKDF, CANARIE, CRC and Compute Canada, Canada; COST, ERC, ERDF, Horizon 2020, and Marie Skłodowska-Curie Actions, European Union; Investissements d’ Avenir Labex and Idex, ANR, France; DFG and AvH Foundation, Germany; Herakleitos, Thales and Aristeia programmes co-financed by EU-ESF and the Greek NSRF, Greece; BSF-NSF and GIF, Israel; CERCA Programme Generalitat de Catalunya, Spain; The Royal Society and Leverhulme Trust, United Kingdom.
The crucial computing support from all WLCG partners is acknowledged gratefully, in particular from CERN, the ATLAS Tier-1 facilities at TRIUMF (Canada), NDGF (Denmark, Norway, Sweden), CC-IN2P3 (France), KIT/GridKA (Germany), INFN-CNAF (Italy), NL-T1 (Netherlands), PIC (Spain), ASGC (Taiwan), RAL (UK) and BNL (USA), the Tier-2 facilities worldwide and large non-WLCG resource providers. Major contributors of computing resources are listed in Ref. [70].
The reference list from the paper itself. Each links out to its DOI / PubMed record.
- 1[1] A.. Belyaev et al. “Strongly interacting vector bosons at the CERN LHC: Quartic anomalous couplings” In Phys. Rev. D 59 , 1999, pp. 015022 DOI: 10.1103/Phys Rev D.59.015022 · doi ↗
- 2[2] Chun Du et al. “Discovering new gauge bosons of electroweak symmetry breaking at LHC-8” In Phys. Rev. D 86 , 2012, pp. 095011 DOI: 10.1103/Phys Rev D.86.095011 · doi ↗
- 3[3] Sylvain Fichet and Gero Gersdorff “Anomalous gauge couplings from composite Higgs and warped extra dimensions” In JHEP 03 , 2014, pp. 102 DOI: 10.1007/JHEP 03(2014)102 · doi ↗
- 4[4] G.. Giudice, C. Grojean, A. Pomarol and R. Rattazzi “The strongly-interacting light Higgs” In JHEP 06 , 2007, pp. 045 DOI: 10.1088/1126-6708/2007/06/045 · doi ↗
- 5[5] ATLAS Collaboration “Measurement of the production cross section of three isolated photons in p p 𝑝 𝑝 pp collisions at s = 8 Te V 𝑠 8 Te V \sqrt{s}=8\leavevmode\nobreak\ \text{Te V} using the ATLAS detector” In Phys. Lett. B 781 , 2018, pp. 55 DOI: 10.1016/j.physletb.2018.03.057 · doi ↗
- 6[6] ATLAS Collaboration “Evidence of W γ γ 𝑊 𝛾 𝛾 W\gamma\gamma Production in p p 𝑝 𝑝 pp Collisions at s = 8 Te V 𝑠 8 Te V \sqrt{s}=8\leavevmode\nobreak\ \text{Te V} and Limits on Anomalous Quartic Gauge Couplings with the ATLAS Detector” In Phys. Rev. Lett. 115 , 2015, pp. 031802 DOI: 10.1103/Phys Rev Lett.115.031802 · doi ↗
- 7[7] CMS Collaboration “Measurements of the p p → W γ γ → 𝑝 𝑝 𝑊 𝛾 𝛾 pp\rightarrow W\gamma\gamma and p p → Z γ γ → 𝑝 𝑝 𝑍 𝛾 𝛾 pp\rightarrow Z\gamma\gamma cross sections and limits on anomalous quartic gauge couplings at s = 8 Te V 𝑠 8 Te V \sqrt{s}=8\leavevmode\nobreak\ \text{Te V} ” In JHEP 10 , 2017, pp. 072 DOI: 10.1007/JHEP 10(2017)072 · doi ↗
- 8[8] ATLAS Collaboration “Measurements of Z γ 𝑍 𝛾 Z\gamma and Z γ γ 𝑍 𝛾 𝛾 Z\gamma\gamma production in p p 𝑝 𝑝 pp collisions at s = 8 Te V 𝑠 8 Te V \sqrt{s}=8\leavevmode\nobreak\ \text{Te V} with the ATLAS detector” In Phys. Rev. D 93 , 2016, pp. 112002 DOI: 10.1103/Phys Rev D.93.112002 · doi ↗