An Analytical Model for Performance and Lifetime Estimation of Hybrid DRAM-NVM Main Memories
Reza Salkhordeh, Onur Mutlu, Hossein Asadi

TL;DR
This paper introduces a Markov decision process-based analytical model to accurately and efficiently estimate the performance and lifetime of hybrid DRAM-NVM main memories across various configurations and workloads.
Contribution
It presents a novel, fast analytical model for hybrid memory performance and lifetime estimation, improving design tuning and reducing reliance on time-consuming simulations.
Findings
Predicts hybrid memory hit ratio with 4.61% average error
Estimates NVM lifetime with 2.93% average error
Runs 4 times faster than traditional simulation methods
Abstract
NVMs have promising advantages (e.g., lower idle power, higher density) over the existing predominant main memory technology, DRAM. Yet, NVMs also have disadvantages (e.g., limited endurance). System architects are therefore examining hybrid DRAM-NVM main memories to enable the advantages of NVMs while avoiding the disadvantages as much as possible. Unfortunately, the hybrid memory design space is very large and complex due to the existence of very different types of NVMs and their rapidly-changing characteristics. Therefore, optimization of performance and lifetime of hybrid memory based computing platforms and their experimental evaluation using traditional simulation methods can be very time-consuming and sometimes even impractical. As such, it is necessary to develop a fast and flexible analytical model to estimate the performance and lifetime of hybrid memories on various…
Click any figure to enlarge with its caption.
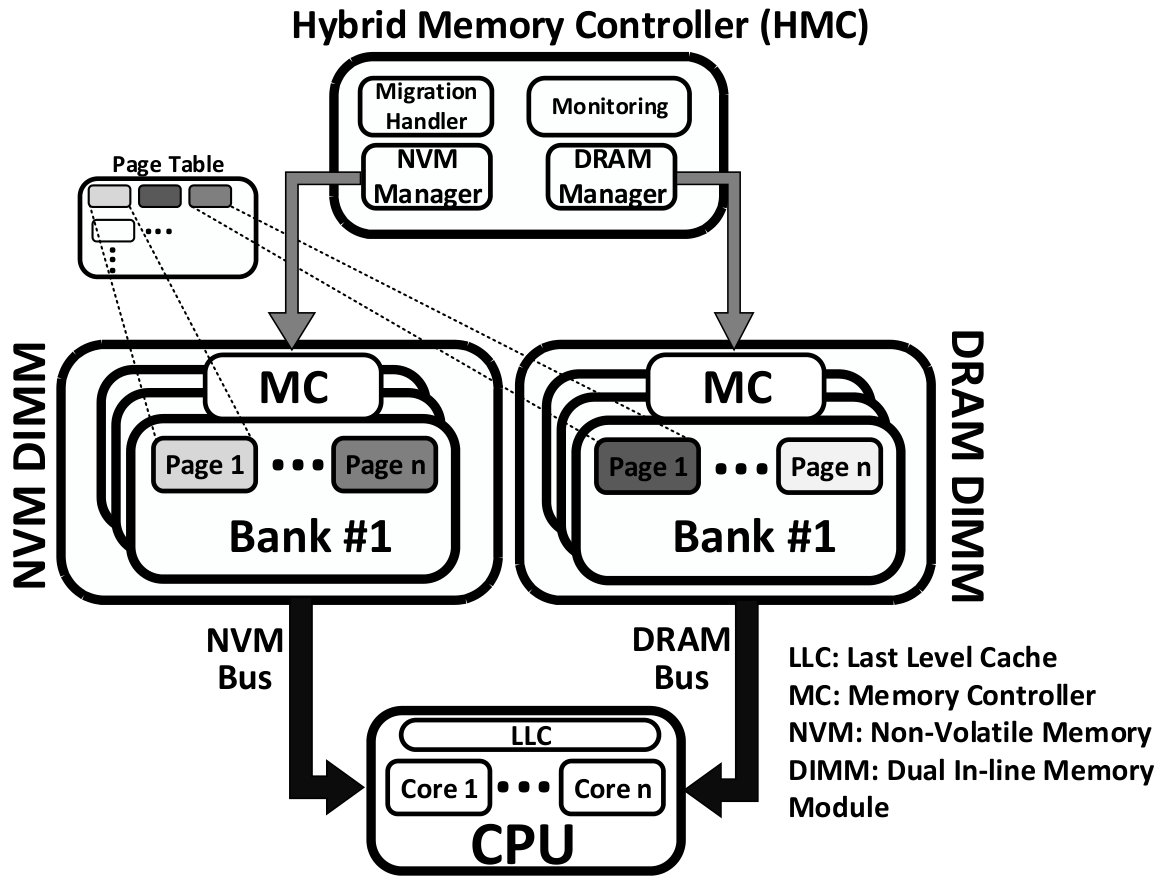 Figure 1
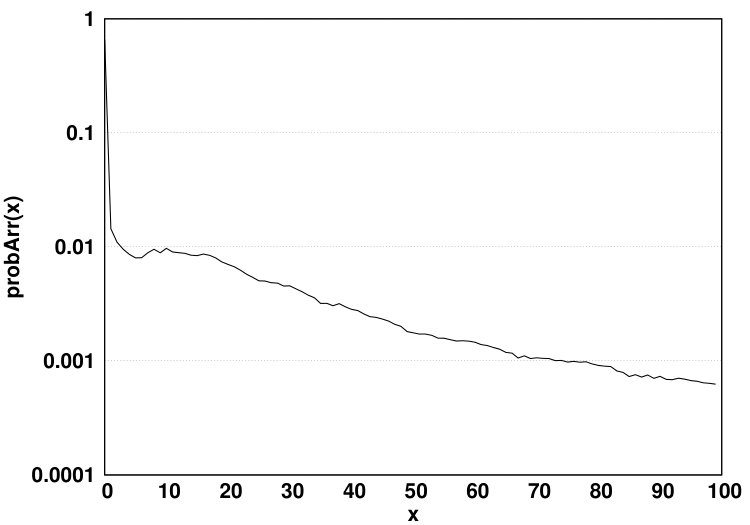 Figure 2
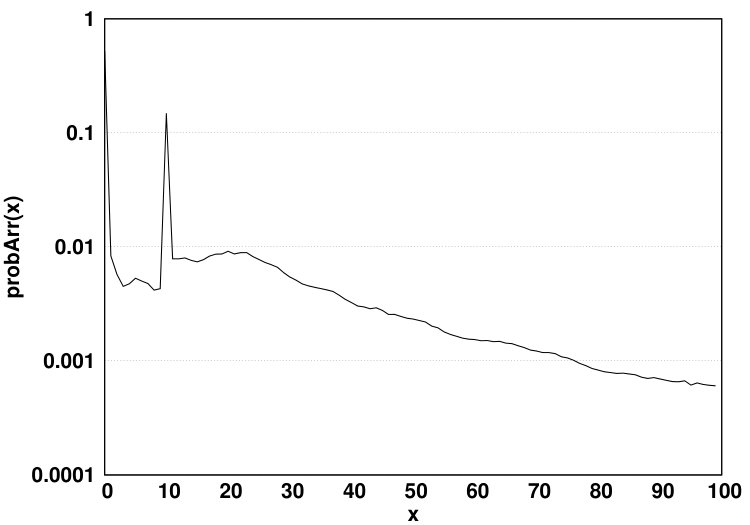 Figure 3
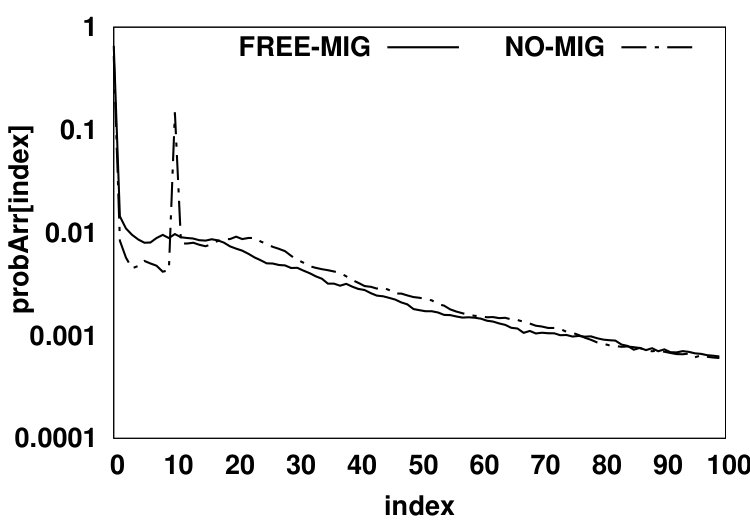 Figure 4
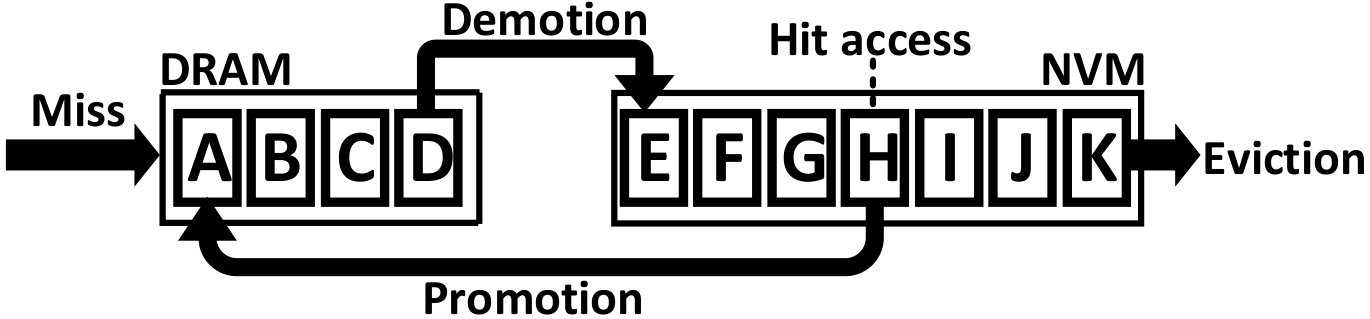 Figure 5
 Figure 6
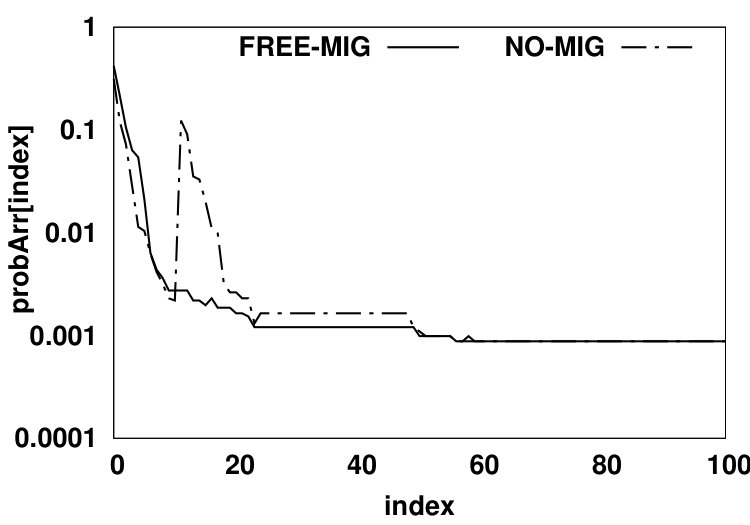 Figure 7
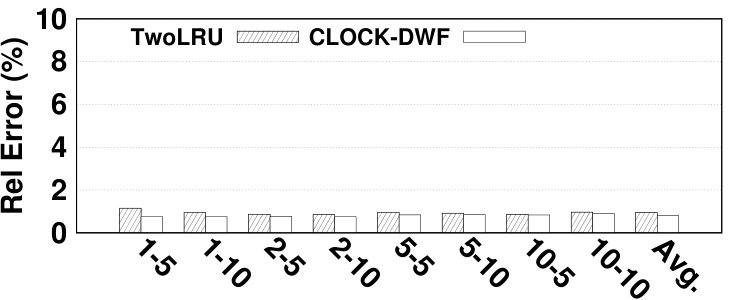 Figure 8
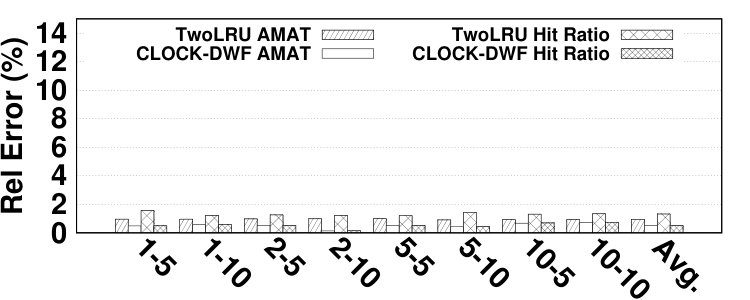 Figure 9
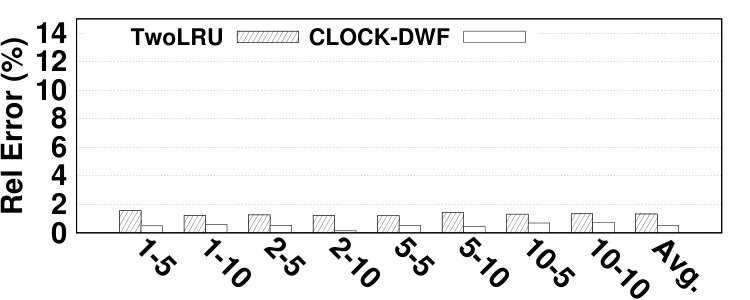 Figure 10
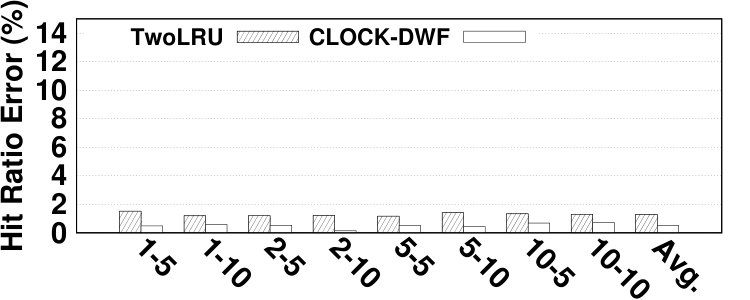 Figure 11
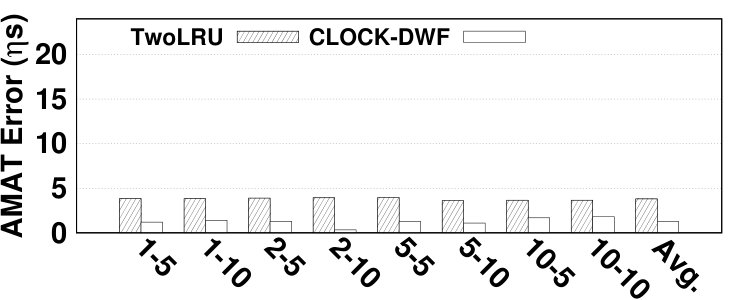 Figure 12
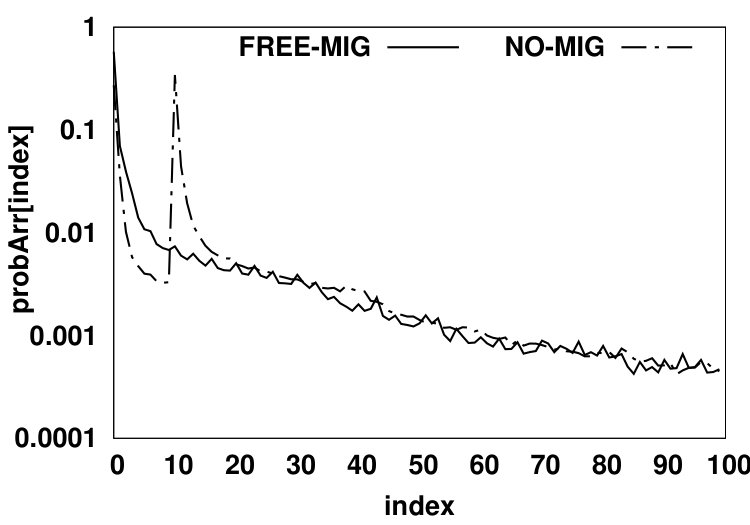 Figure 13
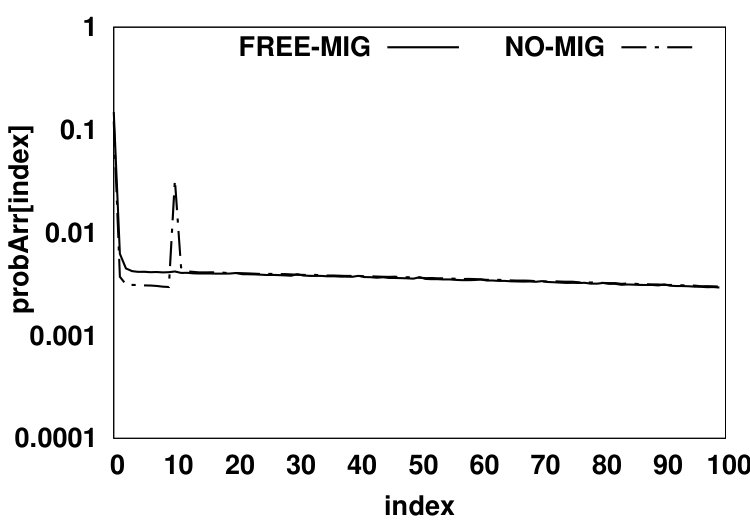 Figure 19
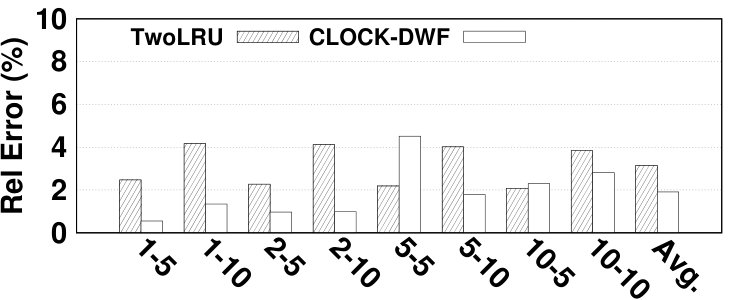 Figure 20
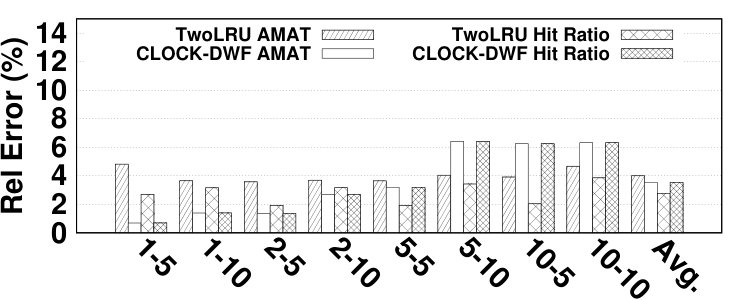 Figure 21
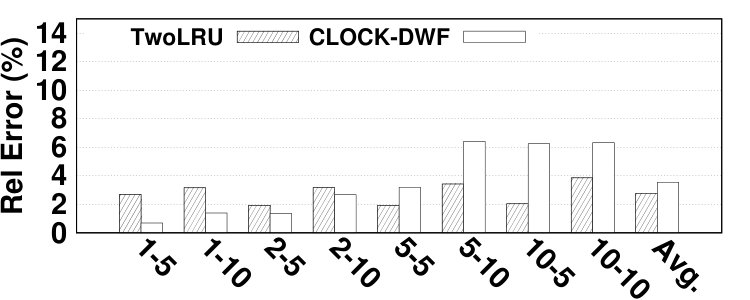 Figure 22
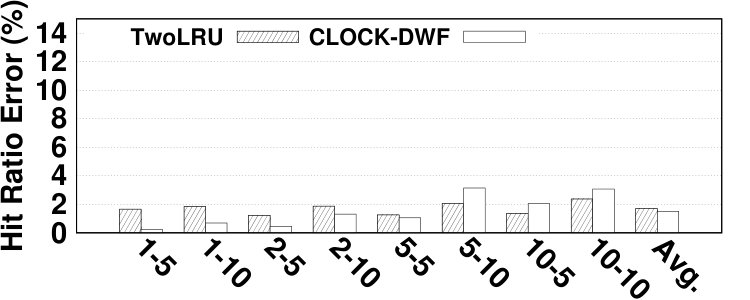 Figure 23
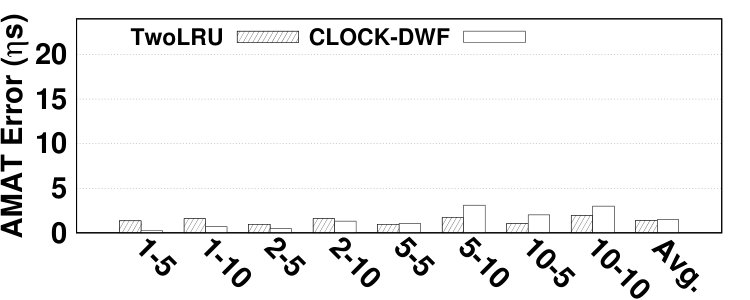 Figure 24
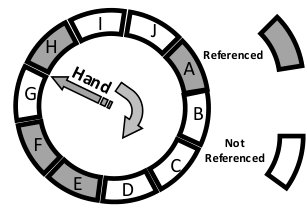 Figure 25
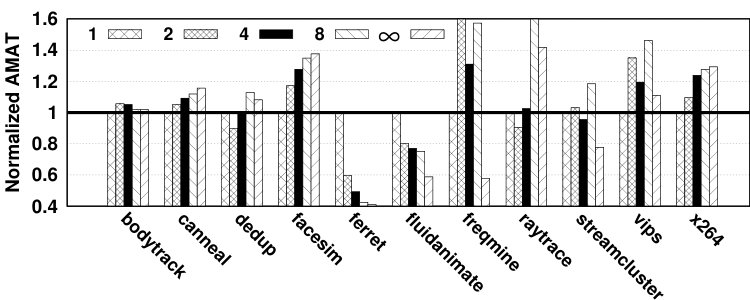 Figure 26
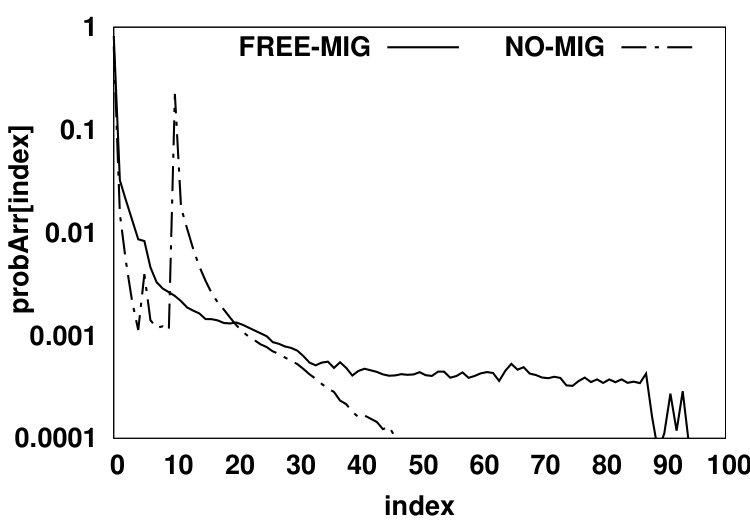 Figure 27
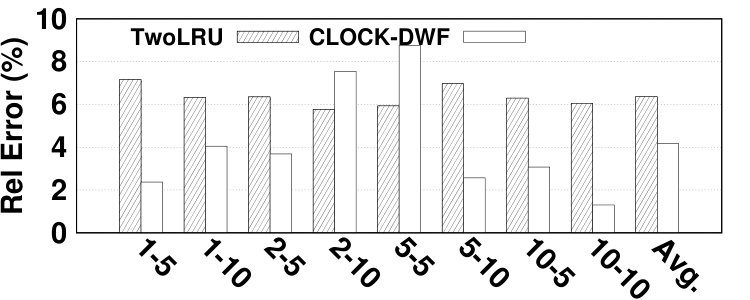 Figure 28
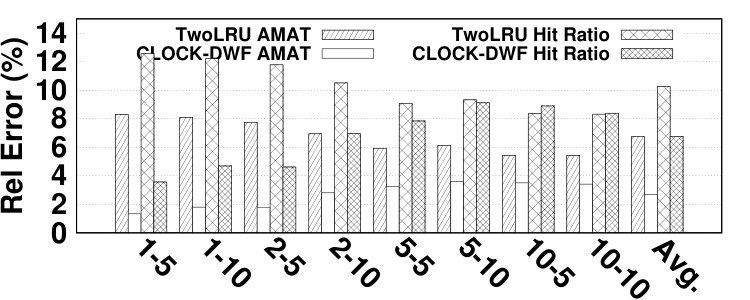 Figure 29
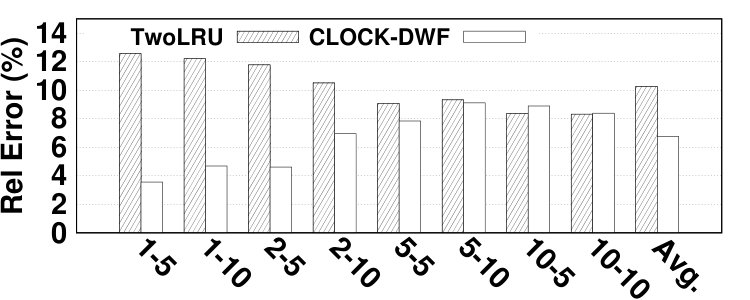 Figure 30
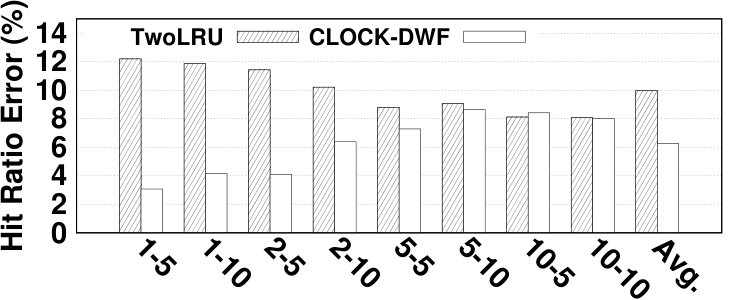 Figure 31
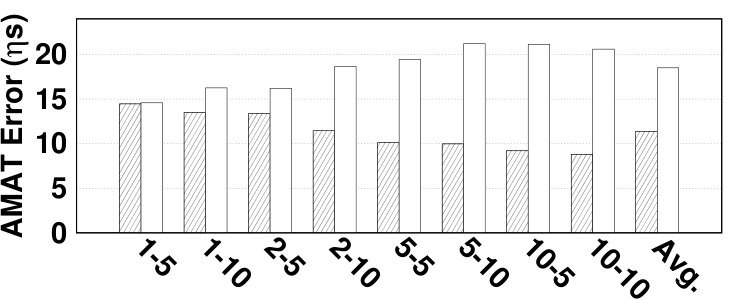 Figure 32
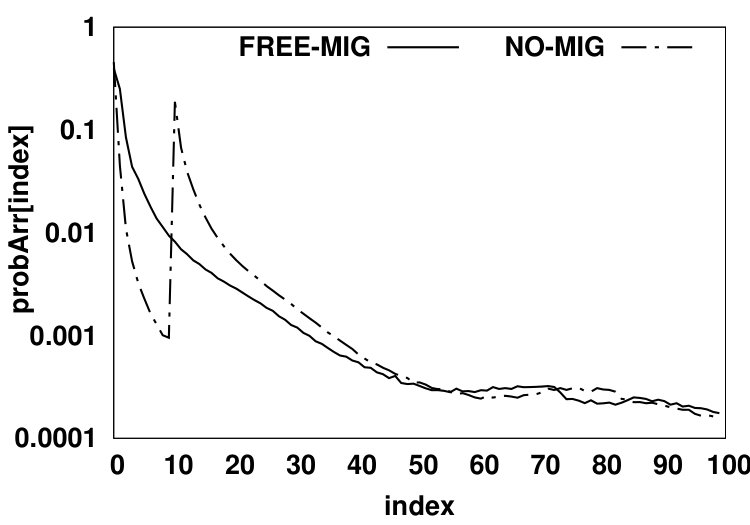 Figure 33
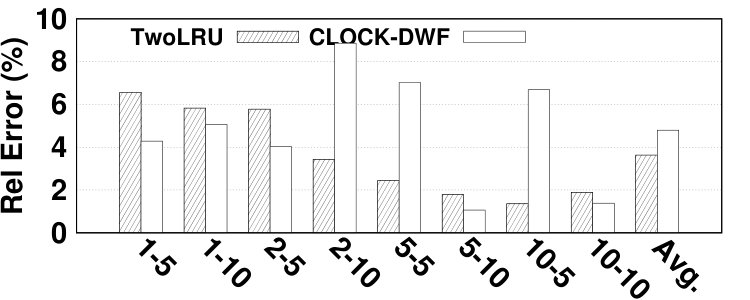 Figure 34
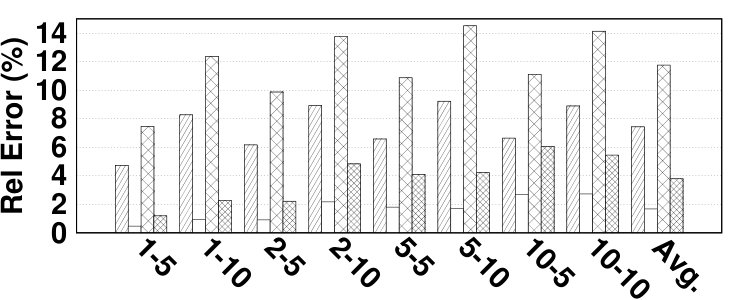 Figure 35
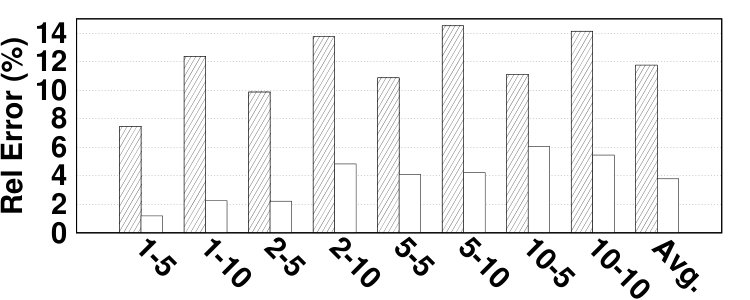 Figure 36
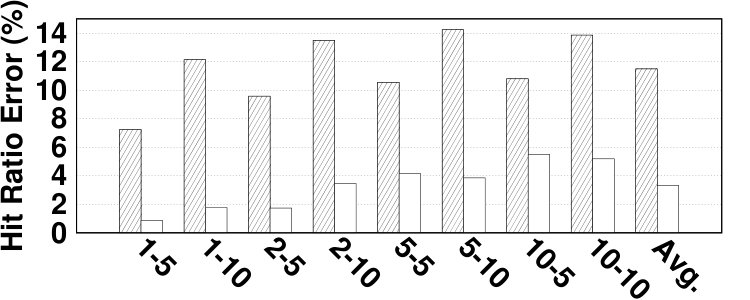 Figure 37
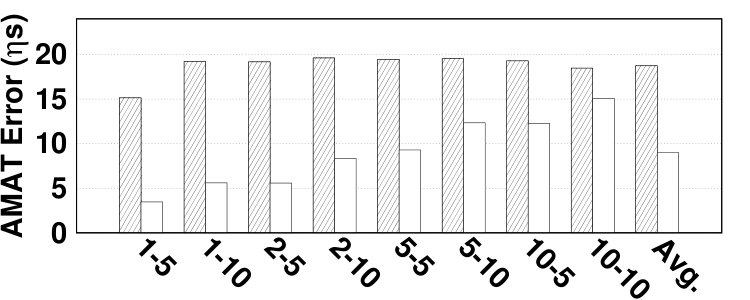 Figure 38
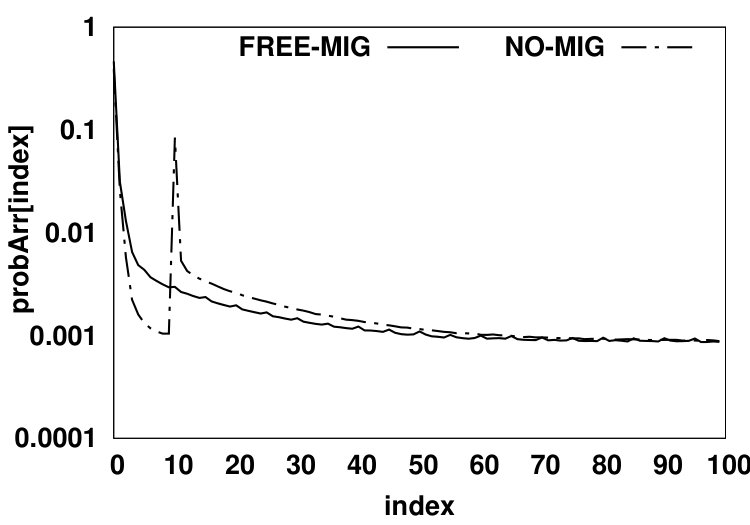 Figure 39
 Figure 40
| Notation | Description |
|---|---|
| Probability that a request is the first access | |
| to a data page. | |
| Eviction probability of the data page. | |
| Array containing percentage of requests with | |
| number of unique accesses. | |
| Probability that an access hits in DRAM | |
| when normal LRU is employed. | |
| Probability that an access hits in NVM | |
| when normal LRU is employed. | |
| Probability that an access misses from HMA | |
| when normal LRU is employed. | |
| Probability that an access hits in DRAM | |
| when no migration is allowed. | |
| Probability that an access hits in NVM | |
| when no migration is allowed. | |
| Probability that an access hits in DRAM | |
| when migrations are allowed. | |
| Probability that the next access is a unique | |
| access. | |
| Probability that an access that hits in HMA | |
| hits in DRAM. | |
| Probability that a data page is moved to the | |
| head of the NVM queue due to eviction from | |
| DRAM. | |
| Probability that a data page is moved to the | |
| head of the NVM queue due to a hit in NVM. | |
| Read latency for device x. | |
| Write latency for device x. | |
| Number of read accesses to device x. | |
| Number of write accesses to device x. | |
| Number of miss accesses. | |
| Number of migrations from DRAM to NVM. | |
| DRAM size. | |
| Total size of DRAM and NVM. | |
| Probability that an access to a data page in | |
| NVM results in a migration. | |
| Number of writes required for migrating a | |
| page. |
| Sequence | <> | <> | <> | <> | <> |
|---|---|---|---|---|---|
| Weight |
| DRAM | NVM | ||||||||||||||||||||||||||
| No. |
|
|
|
|
Dest. | No. |
|
|
|
|
Dest. | ||||||||||||||||
| N/A | N/A | (r-1, u, D, p+1) | N/A | N/A | (r-1, u, N, p+1) | ||||||||||||||||||||||
| ✓ | Before | N/A | (r-1, u, D, p) | ✓ | Before | N/A | (r-1, u, N, p) | ||||||||||||||||||||
| ✓ | After |
|
✓ | After | 0 | ||||||||||||||||||||||
| ✓ | After | ✓ |
|
||||||||||||||||||||||||
| ✓ | N/A | N/A | (r-1, u-1, D, p+1) | ✓ | N/A | N/A | (r-1, u-1, N, p+1) | ||||||||||||||||||||
| ✓ | ✓ | Before | N/A | 0 | ✓ | ✓ | Before | N/A | (r-1, u-1, N, p) | ||||||||||||||||||
| ✓ | ✓ | After |
|
✓ | ✓ | After | N/A | (r-1, u-1, N, p+1) | |||||||||||||||||||
| ✓ | ✓ | After | ✓ | (r-1, u-1, D, p+1) | |||||||||||||||||||||||
| Workload | Unique Pages | Read Requests | Write Requests |
|---|---|---|---|
| Blackscholes | 5,188 | 26,242 (100%) | 0 (0%) |
| Bodytrack | 25,304 | 658,606 (62%) | 403,835 (38%) |
| Canneal | 164,768 | 24,432,900 (98%) | 653,623 (2%) |
| Dedup | 512,460 | 17,187,130 (71%) | 6,998,314 (29%) |
| Facesim | 210,368 | 11,730,278 (66%) | 6,137,519 (34%) |
| Ferret | 68,904 | 54,538,546 (89%) | 7,033,936 (11%) |
| Fluidanimate | 266,120 | 9,951,202 (69%) | 4,492,775 (31%) |
| Freqmine | 156,108 | 8,427,181 (69%) | 3,947,122 (31%) |
| Raytrace | 57,116 | 1,807,142 (83%) | 370,573 (17%) |
| Streamcluster | 15,452 | 168,666,464 (99.8%) | 448,612 (0.2%) |
| Vips | 115,380 | 5,802,657 (59%) | 4,117,660 (41%) |
| X264 | 80,232 | 14,669,353 (74%) | 5,220,400 (26%) |
| Threshold | Migration Probability |
|---|---|
| 1 | 0.16 |
| 4 | 0.13 |
| 8 | 0.08 |
| 16 | 0.05 |
| Device | Latency r/w |
|---|---|
| DRAM | 50/50 |
| NVM | 100/350 |
| Disk | 5,000,000 |
Peer Reviews
No public reviews on file for this paper yet. If you reviewed it on a platform where reviews are public (OpenReview, ICLR, NeurIPS, ICML), you can paste yours below so the community can read it here.
Videos
No videos yet. Explain this paper in a talk, walkthrough, or lecture? Add one.
Taxonomy
TopicsAdvanced Data Storage Technologies · Parallel Computing and Optimization Techniques · Caching and Content Delivery
\justify
An Analytical Model for Performance and Lifetime Estimation of Hybrid DRAM-NVM Main Memories
Reza Salkhordeh, Onur Mutlu, and Hossein Asadi
Abstract
Emerging Non-Volatile Memories (NVMs) have promising advantages (e.g., lower idle power, higher density, and non-volatility) over the existing predominant main memory technology, DRAM. Yet, NVMs also have disadvantages (e.g., longer latencies, higher active power, and limited endurance). System architects are therefore examining hybrid DRAM-NVM main memories to enable the advantages of NVMs while avoiding the disadvantages as much as possible. Unfortunately, the hybrid memory design space is very large and complex due to the existence of very different types of NVMs and their rapidly-changing characteristics. Therefore, optimization of performance and lifetime of hybrid memory based computing platforms and their experimental evaluation using traditional simulation methods can be very time-consuming and sometimes even impractical. As such, it is necessary to develop a fast and flexible analytical model to estimate the performance and lifetime of hybrid memories on various workloads.
This paper presents an analytical model for hybrid memories based on Markov decision processes. The proposed model estimates the hit ratio and lifetime for various configurations of DRAM-NVM hybrid main memories. Our model also provides accurate estimation of the effect of data migration policies on the hybrid memory hit ratio (i.e., percentage of accesses supplied by either DRAM or NVM), one of the most important factors in hybrid memory performance and lifetime. Such an analytical model can aid designers to tune hybrid memory configurations to improve performance and/or lifetime. We present several optimizations that make our model more efficient while maintaining its accuracy. Our experimental evaluations conducted using the PARSEC benchmark suite show that the proposed model (a) accurately predicts the hybrid memory hit ratio compared to the state-of-the-art hybrid memory simulators with an average (maximum) error of 4.61% (13.6%) on a commodity server (equipped with 192GB main memory and quad-core Xeon processor), (b) accurately estimates the NVM lifetime with an average (maximum) error of 2.93% (8.8%), and (c) is on average (up to) 4x (10x) faster than conventional state-of-the-art simulation platforms for hybrid memories.
Index Terms:
Memory, Non-Volatile Memory, Analytical Modeling, Memory Systems, Reliability, Performance.
1 Introduction
Large-scale data-intensive applications increasingly require large and efficient main memory due their large data footprints. Traditionally, Dynamic Random Access Memory (DRAM) has been used as the predominant main memory technology in computer systems due to its low cost per bit ($/GB), low access latency, and symmetric performance on read and write accesses. DRAM technology, however, suffers from major shortcomings, such as high idle power, low scalability, and reduced reliability due to its fundamental dependence on charge storage [1, 2, 3, 4].
To address the shortcomings of DRAM, emerging Non-Volatile Memories (NVMs) offer promising characteristics, such as low idle power, high density, and non-volatility [5, 6, 7, 8, 9, 3, 4]. Example emerging NVM technologies include Phase Change Memory (PCM), Spin-Transfer Torque Magnetic Random-Access Memory (STT-MRAM), Metal Oxide Resistive RAM, and memristors. NVMs, however, have several drawbacks, such as limited endurance, longer latencies, and high active power for write requests, which prevents them from completely replacing DRAM as main memory [2, 8].
In order to take advantage of the promising characteristics of NVMs while minimizing the effect of their limitations, previous studies suggested employing Hybrid Memory Architectures (HMAs) composed of DRAM and NVMs in a single level or multiple levels of the memory hierarchy [10, 11, 12, 13, 14, 15, 16, 8, 17, 18, 19, 20, 21, 22, 23, 24, 25, 26, 27, 28, 29, 30, 31, 32, 33, 34]. Fig. 1 shows the general hardware structure commonly used by HMAs. In this example HMA, each memory device has a separate controller and is connected to the memory bus using a traditional DRAM channel.111The hybrid memory controller can be implemented either as a hardware memory controller or a module in the Operating System. Migrating data pages from DRAM to NVM and vice versa is done by the same memory bus via Direct Memory Access (DMA). In HMAs, management policies can significantly affect system performance. This necessitates significant effort to carefully optimize such policies. In addition to selecting the most suitable policies, our analysis in this paper reveals that the internal configurations and parameters of the selected policies also significantly affect system performance, which is evaluated using the Average Memory Access Time (AMAT) metric in this work. This metric, in turn, depends mainly on the latency of memory devices and the hit ratio of the hybrid memory. The hybrid memory hit ratio is defined as the ratio of accesses to the virtual memory (excluding accesses that hit in processor caches) that are supplied by either DRAM or NVM.
To show the importance of the internal configurations of hybrid memory management systems, we evaluate the performance of two different software-based management mechanisms used in HMAs (CLOCK-DWF [17] and TwoLRU [18]) by assigning different values to their major configuration parameters. As we show in our analysis in Fig. 2, performance222Throughout the paper, we use the terms performance and AMAT interchangeably. of HMAs heavily depends on the selected values for parameters used in each HMA management mechanism. The performance difference is greater than 30% (up to 150%) in many cases, which indicates the importance of selecting the most suitable values for HMA parameters to reduce the AMAT.
With such a significant effect HMA parameters have on performance, memory architects put a lot of effort into finding optimized parameters for HMA management mechanisms across a wide variety of workloads. Such studies usually result in sub-optimal configurations for HMAs since they explore and experiment in a limited design space. With various configurations of HMAs and different types of NVMs, the design space is very large, which makes design and optimization of HMAs using traditional simulation-based methods very time-consuming and sometimes impractical. In recent years, this problem has become even more challenging due to rapid changes in NVM characteristics. Any change in NVM characteristics requires re-running time-consuming simulations to find optimized HMA parameters. Thus, using traditional simulation-based methods to find suitable parameters for emerging HMAs for a specific NVM and/or workload has become either very cumbersome or extremely time-consuming due to the wide variety of design choices and fast evolution of NVMs. This shortcoming exists in HMAs described in [17, 18].
To alleviate the shortcomings of simulation techniques, it is very beneficial for system designers to have a fast but accurate analytical performance model for HMAs. Analytical modeling of an HMA enables designers to (a) perform accurate performance analysis of any arbitrary HMA architecture, (b) explore various tradeoffs, and (c) quickly predict the HMA hit ratio and NVM lifetime for a given HMA configuration.
To our knowledge, no previous study has attempted to analytically model HMAs. However, several analytical models have been proposed in previous studies for other levels of the memory hierarchy, such as CPU cache management policies [35, 36, 37, 38]. Gui et. al. [35] propose an analytical model to predict the hit ratio for Least Recently Used (LRU)-based cache management policies based on circular sequence profiling [39]. Another study attempts to model LRU-based policies with less profiling overhead [36]. Due to the fundamentally-different performance and endurance characteristics of NVMs used in main memory and the need to model the effects of the migration policy between NVM and DRAM, to our knowledge, none of the previously suggested analytical models are applicable to HMAs.
In this paper, we present the first analytical model for HMAs. Our model can accurately a) predict the HMA hit ratio, b) predict the lifetime of the NVM used in the HMA, and c) provide an estimation of the effect of various parameters of the HMA architecture, such as migration policy, on the HMA hit ratio. The proposed model is applicable to a wide range of HMAs (with a structure similar to the one presented in Fig. 1).333Appendix A presents the assumptions on HMAs that can be evaluated with the proposed analytical model. The proposed model can also accurately estimate the effect of migration probability on the hybrid memory hit ratio. This can be used to estimate the effect of internal parameters of the examined HMA on the hybrid memory hit ratio. To accurately estimate the hit ratio of a hybrid memory, the proposed model uses three major inputs: a) an access profile of the workload, b) probability of evicting each data page when the HMA needs to free up space in main memory, and c) the probability of promotion from NVM to DRAM when a data page is accessed in NVM. We extract the first input from the workload by using a trace analyzer while the other two inputs are extracted from the target HMA.
To evaluate the performance and accuracy of the proposed model, we have applied it to TwoLRU [18] and CLOCK-DWF [17] architectures, which are the most recent software-based HMAs.444HMAs with memory controller modifications are not evaluated in our experiments since their full implementation in simulators is rather complex and error-prone, which can lead to inaccurate results for evaluating the proposed model. In other words, HMAs that require hardware modifications do not have a ground-truth baseline to which we can compare our model to. Experimental results over the PARSEC and the SPEC CPU2006 benchmark suites show that the proposed model can accurately predict the hybrid memory hit ratio and AMAT of these two HMAs with an average error of 4.61% (13.6% at most), and 2.99% (11.3% at most), respectively. The proposed model can also estimate the NVM lifetime with an average error of 2.93% (8.8% at most). Our model is on average 10x (20x at most) faster than performing simulations when estimating the hit ratio of 1000 different HMA configurations.
The main contributions of this paper are as follows:
- •
We introduce the first analytical model for hybrid memories. Our model can accurately predict the hit ratio of general hybrid memories.
- •
The proposed model provides an easy-to-use framework for designers to explore various trade-offs between hit ratio and major configuration parameters of an arbitrary HMA. Such analysis is critical in exploring hybrid memory designs and optimizing the configuration of a hybrid memory system.
- •
The proposed model can accurately estimate the NVM lifetime without any additional computation and/or memory overhead over hit ratio estimation.
- •
We develop an open-source framework, based on our model, which can be used by architects and designers to propose and evaluate new HMA designs, taking advantage of emerging NVMs.555http://dsn.ce.sharif.edu/software/
2 Previous Studies
Numerous analytical models have been proposed in previous studies for the memory hierarchy and LRU-based cache management policies [40, 35, 36, 41, 42, 43, 44, 45, 46, 47, 48, 49]. The main goal of such models is to predict the virtual memory or Last Level Cache (LLC) hit ratio by profiling the running workload. Most of the previous analytical studies use hit ratio as a main estimator for performance as it can accurately represent the performance of the memory hierarchy. Utilization is another predictor for memory performance which is used in an analytical performance model of main memory [43]. Predicting latency using analytical modeling has also been examined in previous studies using queuing models [44].
In [50], an analysis over memory workloads shows that the stack distance of memory accesses follows a Zipf distribution law, which is also observed in other application domains such as web caching and disk I/O [51, 52]. A low-overhead hardware mechanism for calculating the stack distance is proposed in [53]. The accuracy of modelling LRU-based caching techniques is discussed in [54]. Extension and generalization of such techniques is investigated in [55], where temporal locality is included in the suggested model. The behavior of LRU and First-In First-Out (FIFO) policies can also be predicted using the low-complexity method presented in [40]. A model for estimating CPU cache miss ratio for age-based eviction policies is presented in [56]. Estimating cache miss ratio based on reuse distance is suggested in [45, 57, 49]. In [58], reuse distance is modified to support hybrid cache line sizes. An analytical model for cache eviction policies is proposed in [35], which uses workload profiling and Markov processes in order to predict the cache hit ratio. The profiler in [35] is based on circular sequence profiling [39] that is obtained using a single run of the workload and can be used for predicting the hit ratio of many eviction policies. This profiler collects the total number of accesses and the number of unique data pages between each two consecutive accesses to a data page, which is also employed in [46]. To reduce the profiling overhead, a profiling technique is proposed in [36], which enables the prediction of cache hit ratio under various eviction policies and cache associativities. Queuing models can also be employed to predict the behavior of DRAM main memories [44]. Such queuing models can be used for many on-chip schedulers by re-arranging accesses in the trace file while maintaining the high accuracy of the technique.
Since HMAs consist of more than one memory module and have multiple governing policies for managing data pages, the models discussed in this section cannot accurately predict the hybrid memory behavior. In addition, the effect of page migrations on the memory behavior cannot be modelled by the traditional analytical models proposed for main memory or caches.
There are numerous HMAs proposed in previous studies, which require hardware modifications and/or controller re-programming [10, 14, 15, 16, 8, 59, 11, 60]. A simple write-only DRAM cache for NVM main memory is proposed in [20] to increase NVM lifetime. [8] proposes a lazy write technique to reduce the number of writes in NVM by using DRAM as an intermediate cache. [15] proposes a row-buffer-miss-aware HMA, which improves performance by moving data blocks that frequently cause row buffer misses to DRAM. HpMC [14] proposes a hybrid inclusive/exclusive HMA in the memory controller that attempts to switch DRAM between a cache for NVM and a separate module visible to applications to reduce the energy consumption. A modification of the CLOCK data structure [61] with two CLOCK handles is proposed in [19] to reduce the number of writes to NVM. Using two CLOCK handles along with another CLOCK for frequency of accesses is proposed in [62] to improve performance, lifetime, and energy consumption of hybrid memories. CLOCK-DWF [17] uses two CLOCK data structures to manage DRAM and NVM memory modules and decide page demotions from DRAM to NVM. To reduce the migration cost in terms of performance and endurance, UH-MEM [12] and TwoLRU [18] aim to limit the migrations by estimating their benefit and cost.
3 Characterization of Trace Files
Before presenting the proposed analytical model, we first describe the methods for extracting the required inputs of the proposed model from a memory access trace file. The proposed model requires the frequency of sequences for estimating the behavior of HMAs. A sequence is defined as a set of accesses between two consecutive accesses to a data page. As an example, consider an arbitrary sequence of accesses to the data pages in Fig. 3. The corresponding sequence for the second access to page “A” is <C, B, B, D, E, B, D> . It contains the accesses between two consecutive accesses to page “A”. In this access sequence, page “A” is called the target data page. This notation is used throughout the paper.
The proposed analytical model also requires DRAM hit probability in case of a hit in the HMA (). The required computations for calculating has O(n) time complexity. In the remainder of this section, we first present the algorithm for extracting sequences of requests and then propose a low-overhead mechanism for estimating .
3.1 Extracting Sequences
The goal of sequence profiling is to find the number of total and unique accesses between two consecutive accesses to each data page. For each sequence of accesses between two consecutive accesses to a data page, the sequence profiler counts 1) the number of accesses in the sequence (denoted as ), and 2) the number of unique data pages accessed in the sequence (denoted as ). The sequence profiler computes the (r,u) pair for consecutive accesses to the same data page. It does not store sequences or the corresponding (r,u) pairs for each data page. Only the frequency of observing each pair is stored by the profiler. The parameter is similar to the reuse distance metric, which is employed in caching algorithms [63]. As an example, there are a total of seven accesses between two accesses to page “A” belonging to four different data pages in Fig. 3. Therefore, the second access to page “A” belongs to the (7, 4) pair. The second access to page B belongs to (0, 0) since the second access is exactly after the first access.
This profiling has complexity, where is the average number of unique data pages in sequences. Algorithm 1 shows how (r,u) pairs are extracted from the trace file. The profiler function is called for each request in the trace file and the variable holds the number of occurrences of each (r,u) pair. For each request, if the address was accessed before, this request will be considered a consecutive request and the sequence for the previous access is calculated. This data page is also added to the request sequences for all other data pages. Our analysis shows that unlike the Last Level Cache (LLC), a significant percentage of accesses to virtual memory belongs to the (0,0) pair for traces obtained from the PARSEC benchmark suite, as shown in Fig. 4. This is due to the coarse granularity of data pages in virtual memory (4KB/8KB), as opposed to the fine granularity of cache blocks in LLC (32/64B).
3.2 DRAM Hit Estimation Model
In addition to the frequency of pairs, the proposed analytical model requires hit probability in DRAM in case of a hit access in hybrid memory . This probability enables the proposed model to stay memory-less and still accurately predict the hit ratio of the HMA. Calculating an accurate value of requires running different workloads on the HMA and extracting the hit ratio of DRAM. This goes against the goal of using an analytical model, which requires predicting the hit ratio without running the workload on the target architecture. The profiler calculates an estimation of . Previous analytical models that can predict the position of a data page in a queue after a certain number of accesses can be used to determine . Such models, however, increase the computational complexity from an degree polynomial to an degree polynomial, where and are maximum number of accesses in a sequence and maximum number of accesses to any data page, respectively. To address such complexity, we propose a formula for predicting with low complexity and less overhead. To predict , we consider three scenarios: a) all accesses to NVM result in a migration, called FREE-MIG, b) no migration is allowed from NVM to DRAM, called NO-MIG, and c) there is a probability for an access to NVM to result in a migration from NVM to DRAM, called MIG-PROB. We describe these three scenarios next.
3.2.1 FREE-MIG
The number of unique accesses in a sequence determines the position of the target data page in DRAM/NVM when the page is hit again. A sequence of accesses starts from an access to the target data page and ends at the second access to the same data page. In the FREE-MIG scenario (shown in Fig. 5a), we use a simple LRU queue. When a sequence starts, the target data page is at the head of the LRU queue. The position of the target data page changes only when a new data page (either present in the memory and after the target data page in the queue or a miss access) is accessed. Thus, the number of unique accesses can determine the position of the target data page when the sequence ends. If the number of unique data pages is less than the DRAM size, the target data page will hit in DRAM.
To estimate the DRAM hit probability after extracting sequences, the profiler groups sequences by their number of unique accesses () and creates a probability array () for all values between 0 and the maximum value of . The index of this array is the number of unique accesses and its value stores the percentage of sequences with the corresponding number of unique accesses. Note that Prob[i] represents only the number of unique accesses, regardless of whether the page resides in the HMA. A value of 0.3 for means that by randomly selecting an access from a trace file and computing its sequence profile, it has 30% probability to have only one unique access (similar to the third access to page D in Fig. 3). To calculate , we first assume that DRAM and NVM are managed by a single LRU queue, where pages in DRAM occupy the first positions of the queue (scenario a). Therefore, each hit in NVM results in migrating the data page to DRAM and demoting the last data page in the DRAM queue to NVM, similar to Fig. 5a. In this scenario, is calculated based on using Equation 1, Equation 2, and Equation 3. and denote the probability of a hit in DRAM and NVM, respectively, when memory is managed by a simple LRU replacement mechanism. Table I also summarizes the key notational elements used in equations throughout the paper.
3.2.2 NO-MIG
In the second scenario (shown in Fig. 5b), no migration is allowed from NVM to DRAM. We use a demotion arc in the NO-MIG scenario since a new data page will be added to DRAM only if the access misses in the HMA (i.e., both DRAM and NVM) and thus, one of the data pages currently residing in DRAM should be evicted from DRAM to NVM to free up space for the newly-accessed data page. By not allowing migrations, the NVM hit ratio will increase since data pages that hit in the NVM will stay there and such recently accessed data pages likely have a high probability of being re-referenced in the near future. Fig. 6 compares values for scenarios (a) and (b) for the PARSEC benchmark suite. The y-axis shows the values in array for all array indexes. and denote DRAM hit probability in FREE-MIG and NO-MIG, respectively. We observe that the increase in the NVM hit ratio causes all DRAM data pages to be accessed less frequently (leading to almost 20% reduction in the number of DRAM accesses compared to FREE-MIG). As Fig. 6 shows, when no migration is allowed, the Most Recently Used (MRU) position in DRAM () still receives more than three times the accesses (on average) than the MRU position in NVM () since newly-accessed data pages are moved to DRAM and such data pages are accessed frequently.
An accessed data page in NVM has a hit probability of for its upcoming accesses in FREE-MIG (as defined in Equation 1). Since the accessed data pages in NVM will remain in NVM in NO-MIG, the NVM hit ratio will be higher than that in FREE-MIG. A normal eviction from DRAM in NO-MIG will have the same hit probability as in FREE-MIG. The NVM hit ratio can be calculated using Equation 3.2.2, where and are probabilities of each source of moving a data page to the head of the NVM LRU queue. The eviction probability from DRAM () is the same as the HMA miss probability since each miss will result in moving a data page to DRAM and consequently will result in evicting a data page to NVM. NVM hit ratio is calculated via where is equal to in this scenario. Therefore, the NVM hit ratio in NO-MIG can be calculated using Equation 3.2.2. The description of notations used in Equation 3.2.2 is reported in Table I. Our analysis shows that the migration policy has negligible effect on the total memory hit ratio, which enables us to easily calculate the DRAM hit ratio based on the miss probability of FREE-MIG and NVM hit ratio of NO-MIG (Equation 3.2.2).
3.2.3 MIG-PROB
The third scenario (shown in Fig. 5c) is the general case where the migration probability () decides whether or not to migrate a page into DRAM when it is accessed in NVM. If migration is allowed, we use the equation of FREE-MIG. Otherwise, we use the equation of NO-MIG. Therefore, the hit probability of DRAM can be calculated using Equation 6.
In order to evaluate the accuracy of our DRAM hit rate estimation model, Fig. 7 presents the percentage error in our mechanism’s prediction of the DRAM hit rate. The error is calculated by comparing the value of in our model and the simulation method. The error reported in Fig. 7 will not directly translate into error in our analytical model for hybrid memories, since even if the place of a data page is inaccurately predicted, there is a probability that the proposed model correctly decides whether the request will be hit or miss. This is dependent on the number of unique pages in sequence profiles. If an access has a few unique pages in its sequence, there is a high probability that the data page remains in the HMA under most of the eviction policies.
4 Workflow
In this section, we present the overall workflow of our HMA hit ratio estimation model using a simple example. The process of estimating the HMA hit ratio consists of two stages: 1) collecting inputs and 2) applying the proposed analytical model to the inputs. The first stage requires 1) analyzing a trace file containing accesses to the memory and 2) examining the HMA to extract the necessary information. In the second stage, we configure the proposed analytical model, which is based on Markov decision processes, using the extracted information and then estimate the HMA hit ratio by solving the analytical model.
Fig. 8 demonstrates the overall workflow of the proposed model.
1 Profiler collects the required information from the trace file, which consists of (a) the frequency of (r,u) and (b) an estimation of the hit probability in DRAM in case of an HMA hit. Section 3 already presented the detailed algorithm for the profiler. If we assume Fig. 3 shows an example trace file, the profiler extracts the sequences and their corresponding weights, as reported in Table II. In the example trace file shown in Fig. 3, the (1,1) pair is found twice out of a total of the 11 requests. Therefore, the weight of (1,1) pair is . The special sequence <,> denotes the first access to each data page, which will be a miss regardless of the examined HMA. Once such information is extracted, the trace file is no longer required for further steps.
In the proposed model, the HMA miss ratio is computed using the formula shown in Equation 4. In this equation, the variables denote the weights of sequences (e.g., the weight values reported in Table II). The function computes the miss ratio for the input values based on a Markov model. Equation 4 shows the HMA miss ratio formula for the example trace file and its extracted weights (reported in Table II).
2
Markov Solver solves the Markov process for all sequences. Since the equations in this step are dependent only on the initial states, the output can be reused for any trace file and/or HMA. As an example, consider the simple example Markov process shown in Fig. 9, where and are two parameters of sequences. For this example, Fig. 10 depicts the recursive calls for calculating the miss ratio of a sequence. Since the number of remaining requests () cannot be less than the number of remaining unique requests (), many states, such as (1,2), are not possible and thus, are not considered in the computations. Equation 9 shows the expanded formula for calculating the Markov process depicted in Fig. 10. The first access to a data page in a sequence is considered while later accesses to the same data page are not . The parameter denotes the probability that the target data page is evicted from the HMA on the next HMA miss access. To understand the parameter, consider the LRU algorithm. In LRU, the last data page in the LRU queue is evicted when a new data page is added and the memory is full. Therefore, for all data pages will be equal to zero except the last data page in the queue, which will have equal to one. The CLOCK algorithm, which employs a similar deterministic approach as LRU also has a single data page with eviction equal to one, while all other data pages have *eviction * equal to zero.
3
In the next step, the target
HMA is analyzed to extract the transition probabilities of the Markov
states.
The probabilities can be a function of the inner state of hybrid memory,
i.e, position of the target data page in the queue.
To solve Equation 4,
4
Seq. Solver and
5
Miss/Migration Solver receive the values for the variables of Markov equations.
Considering a very simple memory architecture that randomly evicts data
pages (i.e., ), Equation 10
solves the sample miss ratio formula in Equation 9 for this
memory architecture assuming is equal to 4.
Solution of the equation is divided into two steps to minimize the required
computations by reusing the outputs of previous runs, i.e., a) running
an HMA over various trace files and b) showing the effect of various
migration probabilities on hit ratio.
5 Proposed Analytical Model
The proposed analytical model attempts to estimate the hit ratio of HMAs using Markov decision processes [64]. A Markov process is composed of a) initial states and their weights, b) transitions between states, and c) transition probabilities. The initial states and their corresponding weights are determined by the data collected from the trace files (as described in Section 3). The transitions of the proposed model are the same across different HMAs while transition probabilities are dependent on the target HMA. Section 5.1 describes the states of the proposed analytical model. Section 5.2 and Section 5.3 present transitions and their probabilities, respectively.
5.1 States
The states of the Markov model are defined recursively, where the depth of recursion is equal to the number of accesses in the currently-processed (r,u) pair. Since in all transitions, the number of remaining requests () decreases by one, the proposed model will have a finite number of states under any HMA. Each state in the Markov process of the proposed model is identified with four parameters, denoted as :
- •
Request (r): Number of accesses in the remainder of the sequence
- •
Unique (u): Number of unique data pages in the remainder of the sequence
- •
Memory (m): current memory in which the target data page resides
- •
Position (p): current position of the target data page in the memory queue
Note that Markov states are not dependent on the data pages and their addresses. For instance, the state (3, 2, DRAM, 0) can be used for both of the following access patterns: [1000, 1001, 1002, 1001, 1000] and [2500, 1200, 3001, 3001, 2500]. The data page with position 0 is the last data page that will be evicted from the memory. Similarly, the data page whose position value set to the number of data pages is the first data page to be evicted. In other words, Position denotes the number of data pages that remain in memory right after evicting the target data page. For the LRU algorithm, this value is simply equal to the position of the target data page in the LRU queue. For more complex algorithms such as CLOCK, the data pages can still be ordered based on the clock hand position and the referenced bit. For instance, Fig. 11 shows the state of a memory architecture managed by the CLOCK algorithm. The value of Position for target data page C will be six since exactly after evicting the data page C, 6 data pages remain in the memory (data pages A, D, E, F, G, H). Thus, the CLOCK hand and any other parameters of the memory management algorithms can be encoded into Position.
Each state in the proposed Markov model needs to store the (r,u) pair to calculate the transition probabilities and identify terminating states. The states of the Markov model follow a target data page between two accesses to the target data page. This is done to find the probability that the data page is evicted from the memory. The remainder of accesses determines how many transitions we need to execute on the Markov state to reach the final state. The number of unique remainder pages is employed to increase the accuracy of the proposed model. The first access to a unique page will be a miss access, which requires evicting a data page from the memory (HMA). The number of evicted data pages greatly affects the probability that the target data page is evicted from the memory. Consider two sequences, both with 10 accesses, where the number of unique data pages in the first sequence is equal to three and in the second sequence is equal to 10. The probability that the target data page is evicted from the memory is higher in the second sequence since more data pages should be evicted from the memory.
The relative position () of the target data page compared to the other data pages in HMA is stored in states to calculate the transition probabilities. Although the Markov model does not need additional information in the states, a Boolean variable () is also stored in each state to determine the residing memory of the target data page. The current residing memory of the target data page can be calculated using the relative position of the data page in memory queue () and the size of the memory modules. This, however, restricts the reusability of calculations to specific memory module sizes. Thus, storing the residing memory of the target data page reduces the computation.
In contrast to modeling a single memory architecture, a hybrid memory model should have two originating states since the corresponding data page might reside in either DRAM or NVM. Therefore, our model calculates the miss probability of each access for both cases and uses their weighted average as the miss probability. The weights are determined based on the equations presented in Section 3 and are calculated only once per trace file, which enables their reuse for any HMA.
To clarify the states, let’s consider an example HMA with four DRAM and five NVM data pages, shown in Fig. 12. Since the target data page is in the third position of the DRAM queue, it has the state of (x,y,DRAM,2). Note that the position is zero-indexed. A miss access will change the state to (x-1,y-1,DRAM,3) as depicted in Fig. 12. Each access reduces the number of remaining requests (x). A miss request is to an address that has not been accessed before. It is considered a unique request. Therefore, the number of remaining unique data pages (y) is reduced by one. Miss accesses result in moving the data page to DRAM, which results in shifting the target data page from position 2 to position 3.
5.2 Transitions
Transitions between states are defined based on the possible conditions of the requests. Our model considers four conditions of requests: 1) hit/miss: Requests can be either hit or miss in the memory. Miss accesses result in moving a new data page to the memory and therefore changing the position of the target data page. 2) before/after: By considering the total order of pages in memory, each hit access can be either before or after the target data page, which might affect the target data page position. 3) uniqueness: The first access to a data page in the sequence has a distinct outcome from the next access to the same data page due to the policies employed in the HMA. 4) migrations: Requests can result in migrating the accessed data page between memories. The discussed conditions are not independent of each other and many of their combinations may not be possible in the examined HMA. For instance, the transition in Fig. 12 is a unique miss access (cases 3 and 1). The other two conditions are not applicable since both are defined only when the access is a hit in the HMA.
Table III shows the transitions of the proposed analytical model. Since the transitions and their destination states differ based on the residing memory of the target data page, DRAM and NVM cases are shown separately. “N/A” values in Table III depict Not Applicable and/or an invalid combination of conditions. We assign each transition a unique number, which we will refer to throughout the paper. Unique shows that the current request is a unique request in the current sequence. Hit shows that the current request is a hit in the HMA (DRAM or NVM). If a request is a hit, the Before/After column states whether it is hit in the data pages queue before or after the target data page. The NVM queue is considered after the DRAM queue when comparing the positions of data pages. Section 5.3.3 details the Before/After parameter. Migration Mig. shows if the current request will result in the migration of its corresponding data page from NVM to DRAM. Destination (Dest.) depicts the destination state of the transition. If the target data page is selected for eviction from DRAM, the destination state will be set to <r,u,NVM,0>. Choosing the target data page for eviction from NVM will result in since the next access to an evicted data page will always be a miss.
The Markov process of the proposed analytical model is depicted in Fig. 13. States are grouped based on the residing memory of the target data page (i.e., the third identifying parameter of a state). The only interaction between DRAM and NVM for the target data page is through eviction from DRAM. The Markov process has two final states. All sequences will reach one of the final states in at most transitions. This is because we reduce the parameter in all of the transitions (except transition 9) and declare a state final when reaches zero. Transition 9 cannot create an infinite loop since there is no transition back from NVM to DRAM to complete such a loop. The promotions (migrations from NVM to DRAM) are not present in the Markov process because of their intrinsic difference from demotions (migrations from DRAM to NVM). A data page can be promoted only when it is accessed. However, sequences are constructed from accesses to other data pages between two consecutive accesses to the target data page and therefore, no access to the target data page exists in the sequence. As such, it is not possible for the target data page to be promoted. Promotions of the other data pages, however, are considered in the proposed model (transitions 4 and 8).
Transitions 9, 10, and 17 are exceptional transitions and their conditions will be examined before other transitions. In miss accesses, Mig. and Before/After conditions are not applicable (transitions 1, 5, 11, 14). Both conditions are defined only when the request is a hit in the HMA. If a request is a hit, it can be a hit either before or after the target data page. A hit before the target data page will not have any effect on the target data page’s position in the queue (transitions 2, 12, and 15). Transition 6 is not practical since data pages before the target data page are accessed at least once and hence, cannot be unique. A hit after the target data page in NVM (transition 16) will result in increasing the position value in the state regardless of whether or not a migration happens. The output of a hit after the target data page in DRAM, however, depends on the probability of migration. If an access hits in NVM and 1) the data page migrates to DRAM, the target data page will be shifted into the queue (transitions 4 and 8), 2) otherwise, if the page does not migrate to DRAM, the target data page will stay in the same position as before (transitions 3 and 7). A non-unique access cannot hit in DRAM if the target data page also resides in DRAM (transitions 3 and 4) since non-unique data pages are either before (as in the Before/After parameter of Markov states) the target data page in DRAM or reside in NVM. Similar to transition 6, transition 13 is also impractical. Non-unique pages have been accessed before and therefore, either reside in DRAM or before the target data page in NVM.
5.3 Transition probabilities
In order to accurately estimate the miss probability of each state, the probabilities of transitions are also required. The sum of probabilities of transitions going out of each state should be equal to one. Since transitions are based on four parameters (uniqueness, hit, before/after, and migration), the probability of a transition is calculated based on the probability of each of the four parameters, which we will present in the remainder of this section.
5.3.1 Uniqueness
In a given state with requests and unique data pages, denotes the probability that the next processed access is a unique access. Our analysis shows that the number of unique accesses has a higher impact on the HMA hit ratio than the order of unique accesses inside the sequence. This is also demonstrated in previous studies that employed sequence profiling [35]. Therefore, we consider each access to have an equal probability to be . Based on this assumption, the probability of uniqueness is calculated as: .
5.3.2 Hit Probability
Hit probability (HMA hit ratio) in the transition probabilities can either be set to a constant value or remains as a variable in the equations. Since predicting hit probability is the main goal of the proposed analytical model, using a constant value for this parameter will reduce the accuracy of the model. Therefore, remains as a variable in the transition probabilities of our model. Replacing with a constant value significantly reduces the required computational processing power to solve the final equation in Miss/Migration Solver. By using a constant value for and iteratively improving its accuracy, one can compute the final hit ratio. This technique, however, requires an accurate initial value for and is beneficial only when the miss/migration solver cannot solve the formula due to the high degree of the polynomial equation. In the proposed analytical model, we solve the the Markov model by leaving as a variable, to increase the accuracy of the model.
5.3.3 Before/After
In order to estimate the position of the target data page in the case of a hit in the HMA, we should decide whether the accessed data page is hit before or after the target data page. The Before/After parameter denotes the relative position of the accessed data page compared to the target data page if we sort the data pages based on their eviction time. A data page is labeled before if the target data page is evicted before the accessed data page and vice versa. For instance, considering the target data page C in Fig. 11, the data pages (I, J, and B) are labeled after and other data pages will be labeled before. In the proposed analytical model, we use the stack distance data in to estimate the before/after probability of a data page. If the target data page resides in DRAM, is calculated by summing all values of in positions before the target data page. Since this probability is defined as , we do not need to consider the miss probability in or . The migration probability, however, affects since the distribution of stack distance is dependent on the migration probability. Therefore, is computed with respect to Equation 6. In addition, the probabilities in are calculated as for an arbitrary position , which enables us to sum their values without the need for additional calculations. If the target data page resides in NVM, a hit data page might be hit in DRAM, before the target data page in NVM, or after the target data page. The hit probability in DRAM is pre-calculated in Equation 6 and the hit before the target data page in NVM is calculated using . Equation 11 shows the overall formula for estimating before/after probability for an arbitrary data page residing in position .
5.3.4 Migrations
Migration probability is one of the design parameters of the examined HMAs, which depicts the probability that an access to NVM can result in migrating the corresponding data page to DRAM. This probability can either be set to a) a fixed value to calculate the performance or b) a formula to calculate the effect of various migration policies on the performance. The fixed value can be set 1) according to the empirical studies on the examined hybrid memory or 2) by substituting the migration variables with actual values from the HMA in the provided formula. Section 6.1 describes the process of extracting the migration probability from the examined hybrid memories.
5.4 AMAT & NVM Lifetime Estimation
The proposed model estimates the HMA hit ratio using a trace file for a given HMA. By slightly modifying transitions and storing additional data, the proposed model can also estimate AMAT and NVM lifetime.
To estimate AMAT, a) the number of accesses to each memory, b) read/write ratio, c) the number of migrations, and d) the number of miss accesses are required. The number of accesses to each memory (a) can simply be computed by using and estimated hit ratio by the proposed analytical model. The read/write ratio (b) is collected while parsing the trace file. The other two parameters (c and d) are already estimated by the proposed model. This method, however, has a few limitations. For example, it does not consider the concurrent processing of requests by the memory controller. To address this shortcoming, the concurrency of the requests is included in the average response time of the memory when computing HMA average response time. Thus, the error of the formula to calculate AMAT is low.
The NVM lifetime depends on a) the number of writes and b) the wear-leveling algorithm employed in the NVM. The wear-leveling algorithm is a design parameter of the NVM memory device. It has almost a fixed effect on the NVM lifetime. Wear-leveling algorithms try to erase data blocks that are a) mostly read or b) have low erase count, to evenly distribute erase count across all blocks. Both cases add additional writes to the NVM, compared to the normal garbage collection operations. These algorithms limit the rate of erasing data blocks to reduce the impact of wear-leveling on NVM lifetime. Therefore, we can consider a fixed overhead for wear-leveling algorithms in our evaluations. The experimental results in previous studies also have such a fixed overhead in various workloads [65, 66, 67]. Thus, by estimating the NVM writes, we can estimate the NVM lifetime. NVM lifetime estimation requires a) the number of writes to NVM, b) the number of migrations to NVM, and c) the number of disk-to-NVM page copy operations. The first parameter can be estimated by the number of accesses to NVM and the write ratio of the trace file. The second parameter is estimated during the hit ratio estimation process by counting the number of times transition 9 is triggered. To calculate the third parameter, the page fault destination of the examined HMA is considered, which can have one of the three scenarios: a) the data page is copied from disk to DRAM in the case of a page fault, b) the data page is copied from disk to NVM, and c) the data page is copied to either DRAM or NVM based on request type (read/write). In the first scenario, the number of disk to NVM page copy operations will be zero. In the second scenario, it will be equal to the number of miss accesses. In the last scenario, it will be computed by the number of miss accesses and the read/write ratio of the trace file.
6 Experimental Setup & Results
In this section, we describe our evaluation methodology and experimental results of our model, compared to the traditional simulation method. Section 6.1 presents our experimental setup. Section 6.2 reports accuracy and Section 6.3 reports the computation time. Section 6.4 presents an application of the proposed analytical model. Finally, Section 6.5 discusses the overhead of using the proposed analytical model.
6.1 Experimental Setup & HMA Modeling
We evaluate our analytical model using two recent HMAs (TwoLRU [18] and CLOCK-DWF [17]). These HMAs enable us to measure the accuracy of the proposed model for HMAs based on LRU and CLOCK. All experiments are conducted on a server with 3.3 GHz CPU and 192 GB memory running a Linux kernel. For fair comparison, we use a single CPU core to perform computations of both our model and for the baseline simulation method. The input trace files are captured by running the PARSEC benchmark suite [68] in the COTSon [69] full system simulator. Table IV reports the characteristics of the trace files.
Most hybrid memories (including TwoLRU and CLOCK-DWF) implement a variation of either LRU or CLOCK as their DRAM and NVM eviction policies. Both policies have a deterministic algorithm for finding the victim data page. In LRU, the last data page in the queue and in CLOCK, the first data page with the reference bit set to 0 after the clock handle is evicted. Thus, only one data page is eligible for eviction, which has an eviction probability of 1. The eviction probability of all other data pages is 0. TwoLRU employs LRU as the eviction policy of both DRAM and NVM. Hence, the eviction probability for this architecture is the same as LRU. The NVM clock in CLOCK-DWF is a simple CLOCK algorithm without any modifications and thus we use the simple eviction probability based on the clock algorithm in the experiments. Although the CLOCK algorithm in DRAM determines the victim data page based on the values of counters stored for data pages, only one page is eligible for eviction. The proposed analytical model, however, does not store the actual values of counters and cannot determine the exact victim data page. Instead of the actual values, an approximate order of data pages based on the counter values is stored by the proposed analytical model. Based on this information, we can estimate the victim data page using two options: a) select the data page with the smallest counter value, and b) set a probability for data pages based on their order of counter values. In the experiments, we choose the first option since it simplifies the computations and its output is closer to the actual output of CLOCK-DWF.
The migration policy determines the probability that an access in NVM results in migrating the accessed data page to DRAM. The migration probability is extracted from the examined hybrid memory by analyzing the migration policy and conditions resulting in a migration. CLOCK-DWF migrates a data page from NVM to DRAM on a write access to the page. Thus, the probability of migration is equal to the probability that an access is a write access. In the proposed analytical model, we consider the write ratio of accesses in the trace file as the write probability and hence, the migration probability of CLOCK-DWF. TwoLRU employs a counter-based method to decide whether or not the accessed data page should be migrated from NVM to DRAM. Accurately formulating this method requires storing additional data, which significantly increases the memory and computation overhead of the proposed model. To avoid such cost, we approximate the complex migration policy into a simple probability function. To construct this function, we analyze the migration probability under various threshold counters, and construct a table (Table V) that translates the threshold counters to migration probabilities. We use this table in our proposed analytical model. Since we employ this simple function in our model for TwoLRU, we expect our model would have slightly higher accuracy in modeling of CLOCK-DWF than modeling TwoLRU.
6.2 Accuracy
The main goal of the proposed analytical model is to accurately estimate the hit ratio and performance of main memory under various HMA configurations. We evaluate the accuracy of the proposed model using the error in the estimated hit ratio and estimated performance, compared to the baseline simulation method. Relative error is defined as the relative difference between the hit ratio estimated by the proposed model () and the hit ratio measured using simulation (), as denoted in Equation 12. Relative error in estimated performance is measured similarly. In addition, we measure the error of our model in estimating NVM lifetime.
Fig. 14 depicts the relative error of the proposed model for estimating the hit ratio of various HMAs in a variety of workloads. DRAM and NVM sizes are set relative to the working set sizes of benchmarks. In most experiments, the proposed analytical model estimates the main memory hit ratio by less than 5% error. The average error is 4.61% while the maximum error is 13.6%. Due to the simplifications we employ in modeling its migration algorithm, TwoLRU has a higher error rate compared to CLOCK-DWF, which also has a more steady error rate across various memory sizes. Dedup has a high average error rate in both HMAs, which is because it does not have an easy-to-model memory access distribution, unlike other programs in the PARSEC benchmark suite. The abnormal behavior of the dedup benchmark also results in high error in estimating as depicted in Fig. 7. Comparing Fig. 7 and Fig. 14 shows that most of the error in estimating is masked throughout later calculations in our analytical model. Therefore, a more accurate and computation-intensive method for estimating will not significantly increase the accuracy of our proposed model.
The error in estimating the hit ratio under different memory sizes does not follow a fixed pattern across workloads. We observe increasing, decreasing, and stable error ratio trends in Fig. 14 as we increase the memory size. Workloads with a relatively steady access distribution, such as canneal, maintain a stable error ratio across different memory sizes in TwoLRU. Our analysis shows that workloads such as raytrace and vips have anomalies in their access distribution, which results in higher error with larger memory sizes. Anomalies are less visible in CLOCK-DWF since it uses a more deterministic algorithm compared to TwoLRU. Another interesting pattern in the experiments is the effect of the NVM/DRAM ratio on the hit ratio error. In streamcluster, experiments with a 1:1 DRAM/NVM ratio have higher error compared to a 1:2 ratio. This is due to the higher number of migrations in 1:2 ratio experiments.
The main memory hit ratio cannot be used as the main source for analyzing the performance of HMAs since HMAs tend to have different performance behavior on NVMs with different performance characteristics. To address this issue, the proposed model reports the number of accesses to each memory, which can be used to estimate the AMAT. The formula for AMAT estimation is depicted in Equation 13. and denote the read and write latencies for device x, respectively. Table I describes the notation employed in Equation 13. We extract the actual values for average DRAM and NVM response times from [18] and show them in Table VI. Fig. 14 presents the relative error of the proposed model in AMAT compared to the baseline simulation method, over various benchmarks and memory sizes. The relative error in AMAT, which is more meaningful for HMA designers than the relative error in hit ratio, is lower than the average error in hit ratio estimation in all experiments. This is due to the effect of very long latency of disk subsystem accesses for missed data pages on AMAT. The proposed model has only 2.99% average error in estimating performance of HMAs while the highest error is 11.3%, in the vips program.666Appendix B presents the absolute error values to estimate AMAT.
To evaluate the accuracy of the proposed model in estimating NVM lifetime, the number of write requests issued to NVM is calculated using Equation 14. is the number of writes required for migrating a page, which is set to 64. denotes the number of migrations from DRAM to NVM. CLOCK-DWF does not issue write requests directly to NVM and all writes in NVM are due to a) migrations from DRAM to NVM and b) moving data pages from disk to NVM. Therefore, evaluating the NVM lifetime in CLOCK-DWF directly evaluates the accuracy of estimating the number of migrations to NVM. Unlike CLOCK-DWF, TwoLRU issues write requests to NVM. Since estimating the number of write requests is relatively easier than estimating migrations, our model is expected to have slightly higher accuracy for TwoLRU compared to for CLOCK-DWF. Fig. 15 depicts the accuracy results for both examined HMAs. CLOCK-DWF does not follow a fixed pattern across workloads and memory sizes. The spikes in error rates are generally cases where the number of migrations is low. The error in estimating the NVM lifetime in TwoLRU follows a more stable pattern across different memory sizes compared to estimating hit ratio and AMAT. Both HMAs have high relative error rates in the Dedup benchmark, similar to the relative error in hit ratio due to the unique characteristics of this benchmark. The average error of estimating the NVM lifetime is 2.93%, while the maximum error is 8.8%, which is lower than the error in estimating hit ratio and AMAT.
6.3 Model Execution Time
The proposed model consists of offline and online phases. During the offline phase, all heavy computations for (r, u) pairs, which we described in Section 3.1, are conducted. In the online (runtime) phase, only frequency of occurrence of pairs is computed to obtain the results. Thus, the online phase does not have high complexity compared to simulation, which requires simulating all requests. In simulation methods, any modification in the trace file and/or the configuration of the examined architecture requires a re-run of the simulation, which is very time-consuming. The proposed analytical model can reuse most of the required computations when such changes happen, thereby significantly reducing the runtime per experiment. As a practical example to show the required number of simulations, consider running TwoLRU on 12 traces as conducted in the previous work proposing this technique [18]. For each workload, at least six combinations of thresholds need to be evaluated to find the most suitable threshold value. Therefore, at least 72 simulations need to be run. If different NVM sizes (e.g., 10 different values) are also required, this number will increase to more than 720 simulations. To calculate the reduction in experimental evaluation time due to using our proposed analytical model, we run each workload 50, 100, and 1000 times with various DRAM/NVM sizes and HMA configurations.
Fig. 16 depicts the normalized execution time of the proposed analytical model compared to simulation. The overhead of offline calculations in the proposed model is amortized over all experiments and is included in the execution time of the proposed model. Since efficient data structures are employed throughout simulations, and both HMAs have almost equal simulation time, we normalize the simulation time to the average execution time of both HMAs in Fig. 16. According to this figure, the online phase execution time is only 10% of the simulation time, on average. This shows that the runtime complexity of our proposed analytical model is much lower compared to simulation. The computations of the online phase can also be easily parallelized, which would further reduce the execution time of the online phase. We leave this for future works. In workloads with larger number of requests, such as streamcluster, the proposed model reduces the execution time by more than 10x over simulation when we run more than 1000 experiments. Smaller workloads, such as blackscholes see smaller reduction in execution time since their simulations are relatively fast. The highest execution time reductions are seen in programs with long simulation times, which are more challenging programs to simulate to begin with.
Another advantage of our proposed model over simulation is that its computational complexity grows more slowly with trace size. The runtime complexity, i.e., the required computations to calculate the HMA hit ratio is not proportional to the number of distinct data pages accessed throughout the trace file. Accessing thousands of different data pages only increases the values of i and u in the extracted (i,u) pairs from the trace files. For instance, consider a trace file accessing 1,000 different data pages. The profiler extracts X (i,u) pairs from the trace file, where the runtime algorithm needs to solve each of them. By adding Y accesses to the Z new distinct data pages to the trace file, the number of extracted (i,u) pairs by the profiler does not necessarily increase. Since adding an access to a new data page in a sequence currently belonging to the (i,u) pair only reduces the number of occurrences of the (i,u) pair and also increases the number of occurrences of (i+1, u+1) pair. There is, however, a small probability that the (i+1, u+1) pair does not exist in the extracted pairs from the original trace file. In this case, the runtime complexity increases to compute the output of the (i+1, u+1) pair (from computing X pairs to X+1 pairs). Note that the (i,u) pairs where u is greater than the size of the main memory are always a miss and hence, the number of possible (i,u) pairs is limited. In practice, due to the locality of the accesses of an application, the values of both i and u are rather small in most of the extracted pairs. To show the effect of increasing the trace size on the number of sequences and thus, on the execution time of the proposed model, we split the trace files and compute the number of required sequences for 10%, 25%, 50%, 75% and 100% of the trace files. As Fig. 17 shows, the number of sequences does not significantly increase when trace size increases once the trace file length is larger. Thus, the proposed analytical model has significant advantage over simulation when using large trace files. We conclude that the computational complexity of our proposed analytical model is much lower than that of simulation.
6.4 Model Application
As mentioned before, the proposed analytical model enables system architects to more easily identify the trade-offs and weaknesses of different hybrid memory architectures. For instance, the analytical model can provide a formula that shows the correlation between the migration threshold used in TwoLRU and the overall performance of the HMA. Using this data, we can predict the performance of TwoLRU without running the proposed analytical model for various migration thresholds, which further reduces the execution time of the proposed model. Fig. 18 shows the accuracy of our model’s performance estimates when we use the formula provided by our model. We generate the formula using a migration threshold of one. We calculate performance for other threshold values based on the formula, without running the HMA through the proposed analytical model. In most workloads, the relative error is less than 10%, which shows the accuracy of the provided formula in estimating the performance of TwoLRU. System architects can employ such a formula to easily find a suitable migration threshold for a vast range of workloads without the need for running simulations or even running the proposed analytical model for each possible migration threshold value.
6.5 Model Overheads
Most of the required computations of the proposed model can be performed offline and are reusable for any examined hybrid memory architecture and/or trace file. The output of such computations should be stored in persistent storage for repeated use. To reduce the required storage space, the generated formulas for Markov states are stored in gzip format on a hard disk, which can be extracted when needed. A current dataset of these formulas alongside their outputs require less than 50GB of storage space, which can be either loaded into the main memory before starting experiments or loaded on-demand. The storage overhead is independent of the memory size and trace size. We employ a dynamic programming approach [70] in the proposed analytical model to reduce the required computations. We use most of the storage space for storing the intermediate computation results. The proposed model does not require all these data to be fully loaded in the memory. The proposed model can still operate without losing any accuracy with the cost of slightly higher computation time, if we do not have a large enough memory to hold all data.
7 Conclusion
Hybrid DRAM-NVM main memory architectures have been proposed by system designers to exploit NVM benefits while reducing the effect of their negative characteristics. Designing an efficient hybrid memory architecture requires an exploration of the design space of its architectural parameters, which is very time-consuming using traditional simulation methods. This paper, for the first time, presents an analytical model for hybrid memory architectures, which significantly reduces the computation time for estimating the performance and lifetime of hybrid memories. The proposed model is based on Markov decision processes and employs recursive state definitions. Our model is capable of modeling various eviction and memory management policies and considers the interaction of memory modules when migrating data pages. The proposed model is designed in such a way that most of the calculations can be reused across different trace files and/or HMAs. Our model can also provide a formula to evaluate the effect of different migration thresholds on the overall HMA performance, which further reduces the required computations for analyzing HMAs. Our experimental results demonstrate that the proposed model can accurately estimate the main memory hit ratio, and NVM lifetime with an average error of only 4.61% and 2.93%, respectively, while reducing the computation time by up to 90% over simulation based methods.
Acknowledgments
This work has been partially supported by Iran National Science Foundation (INSF) under grant number 96006071 and by ETH Zurich and donations from various industrial partners, including Alibaba, Google, Huawei, HPDS, Intel, Microsoft, and VMware.
Appendix A HMA Assumptions
We present the assumptions we make about HMAs that can be evaluated by our proposed analytical model. We first present our definition of an HMA. Then, based on this definition, we present the assumptions we made about HMAs that enable us to accurately predict the HMA performance and lifetime.
A.1 HMA Definition
An HMA can be defined by a tuple <mapping, Upd, Mig, EvicP>: (a) mapping stores the required information for managing memory (per data page), such as position in the LRU queue or reference and dirty bits alongside the clock handle position in the CLOCK algorithm. Two subsets of mapping can also be present to depict data pages residing in DRAM and NVM which are denoted as mapping.DRAM and mapping.NVM, respectively. (b) For each access to the memory subsystem, *Upd(mapping, Page, )*777Parameters with overline are outputs. function called, which reconfigures the internal placement of data pages (setting ref bit in CLOCK and moving the data page to the Most Recently Used (MRU) position in the LRU queue). Upd function calls other functions to decide which pages to replace in case of migration or free space shortage in memory. (c) Any required movement of data pages between memories is governed by the Mig(mapping, ) function, which decides whether or not a data page should be moved to another memory module. (d) In case of a miss access, EvicP(mapping, Page, ) is called to calculate the eviction probability for data pages and deciding which data page should be evicted from the memory.
A.2 Assumptions
The HMAs that can be evaluated by the proposed model should have the following criteria:
- •
Data page eviction probabilities should be only dependent on the corresponding information in mapping (Equation A.2 below).
- •
Accessed data pages should have a static predefined mapping information , i.e., the first position of the queue in LRU algorithm (denoted as Hit_Mapping in Equation A.2 below).
- •
mapping.NVM and mapping.DRAM should be totally ordered under less than or equal () as denoted by Equation A.2 below.
- •
A page can be migrated from NVM to DRAM (i.e., promotion) only when it is accessed (Equation A.2 below).
- •
Evicted data pages from DRAM should be moved to NVM and as such, in the updated mapping (denoted as NM in Equation A.2 below), they should be treated similar to a hit access in NVM (Equation A.2 below).
- •
Evicted data pages from NVM are removed from memory (Equation A.2 below).
- •
Accessed data page will be assigned the highest position in (Equation 21 below).
Appendix B Absolute Error Values
We report absolute error values for hit ratio and AMAT. Relative errors for both hit ratio and AMAT are presented in Section 6.2. The absolute error of AMAT for various benchmarks is 7.14 on average, reported in Fig. 19. The maximum absolute error for estimating AMAT is for the vips benchmark in CLOCK-DWF, which is 22.35 . In bodytrack, TwoLRU and CLOCK-DWF have almost the same relative AMAT error as depicted in Fig. 14 while the absolute AMAT error is almost twofold in CLOCK-DWF. This is due to the difference in number of disk and memory accesses in the two examined HMAs.
The average absolute hit ratio error is 5.31% and 2.48% for TwoLRU and CLOCK-DWF, respectively as demonstrated in Fig. 20. The dedup benchmark has highest absolute hit ratio error (8.11% on average) in both examined HMAs, which is due to anomalies in the access distribution of this benchmark. Such anomalies also exist in estimating AMAT and NVM lifetime of dedup benchmark. The highest absolute hit ratio error (14.2%), however, belongs to facesim for TwoLRU. CLOCK-DWF has a lower maximum hit ratio error of 10.6%, which belongs to vips.
The reference list from the paper itself. Each links out to its DOI / PubMed record.
- 1[1] O. Mutlu, “The Row Hammer problem and other issues we may face as memory becomes denser,” in Design, Automation Test in Europe Conference Exhibition (DATE) , March 2017, pp. 1116–1121.
- 2[2] ——, “Memory scaling: A systems architecture perspective,” in 5th IEEE International Memory Workshop (IMW) , May 2013, pp. 21–25.
- 3[3] B. C. Lee, P. Zhou, J. Yang, Y. Zhang, B. Zhao, E. Ipek, O. Mutlu, and D. Burger, “Phase-change technology and the future of main memory,” IEEE Micro , vol. 30, no. 1, pp. 143–143, Jan 2010.
- 4[4] B. C. Lee, E. Ipek, O. Mutlu, and D. Burger, “Phase change memory architecture and the quest for scalability,” Communications of the ACM , vol. 53, no. 7, pp. 99–106, Jul. 2010. [Online]. Available: http://doi.acm.org/10.1145/1785414.1785441
- 5[5] ——, “Architecting phase change memory as a scalable DRAM alternative,” in International Symposium on Computer Architecture (ISCA) , 2009, pp. 2–13.
- 6[6] M. Tarihi, H. Asadi, A. Haghdoost, M. Arjomand, and H. Sarbazi-Azad, “A hybrid non-volatile cache design for solid-state drives using comprehensive I/O characterization,” IEEE Transactions on Computers (TC) , vol. 65, no. 6, pp. 1678–1691, 2016.
- 7[7] E. Kultursay, M. Kandemir, A. Sivasubramaniam, and O. Mutlu, “Evaluating STT-RAM as an energy-efficient main memory alternative,” in IEEE International Symposium on Performance Analysis of Systems and Software (ISPASS) , April 2013, pp. 256–267.
- 8[8] M. K. Qureshi, V. Srinivasan, and J. A. Rivers, “Scalable high performance main memory system using phase-change memory technology,” in International Symposium on Computer Architecture (ISCA) , 2009, pp. 24–33.