Measurement of the production cross section for a Higgs boson in association with a vector boson in the $H \rightarrow WW^{\ast} \rightarrow \ell\nu\ell\nu$ channel in $pp$ collisions at $\sqrt{s}$ = 13 TeV with the ATLAS detector
ATLAS Collaboration

TL;DR
This paper reports a measurement of the Higgs boson production cross sections in association with W and Z bosons, using the decay channel to WW* in proton-proton collisions at 13 TeV with the ATLAS detector, confirming Standard Model predictions.
Contribution
First measurement of associated Higgs production cross sections in the WW* decay channel at 13 TeV with ATLAS, providing data consistent with the Standard Model.
Findings
Measured cross sections agree with Standard Model predictions.
Quantified uncertainties in the production cross sections.
Provided the first such measurement at 13 TeV.
Abstract
A measurement of the Higgs boson production cross sections via associated and production using decays, where stands for either an electron or a muon, is presented. Results for combined and production are also presented. The analysis uses events produced in proton-proton collisions collected with the ATLAS detector at the Large Hadron Collider in 2015 and 2016. The data correspond to an integrated luminosity of 36.1 fb recorded at a centre-of-mass energy of 13 TeV. The products of the branching fraction times the and cross sections are measured to be (stat.)(syst.) pb and (stat.)(syst.) pb respectively, in agreement with the Standard Model predictions.
Click any figure to enlarge with its caption.
 Figure 1
 Figure 2
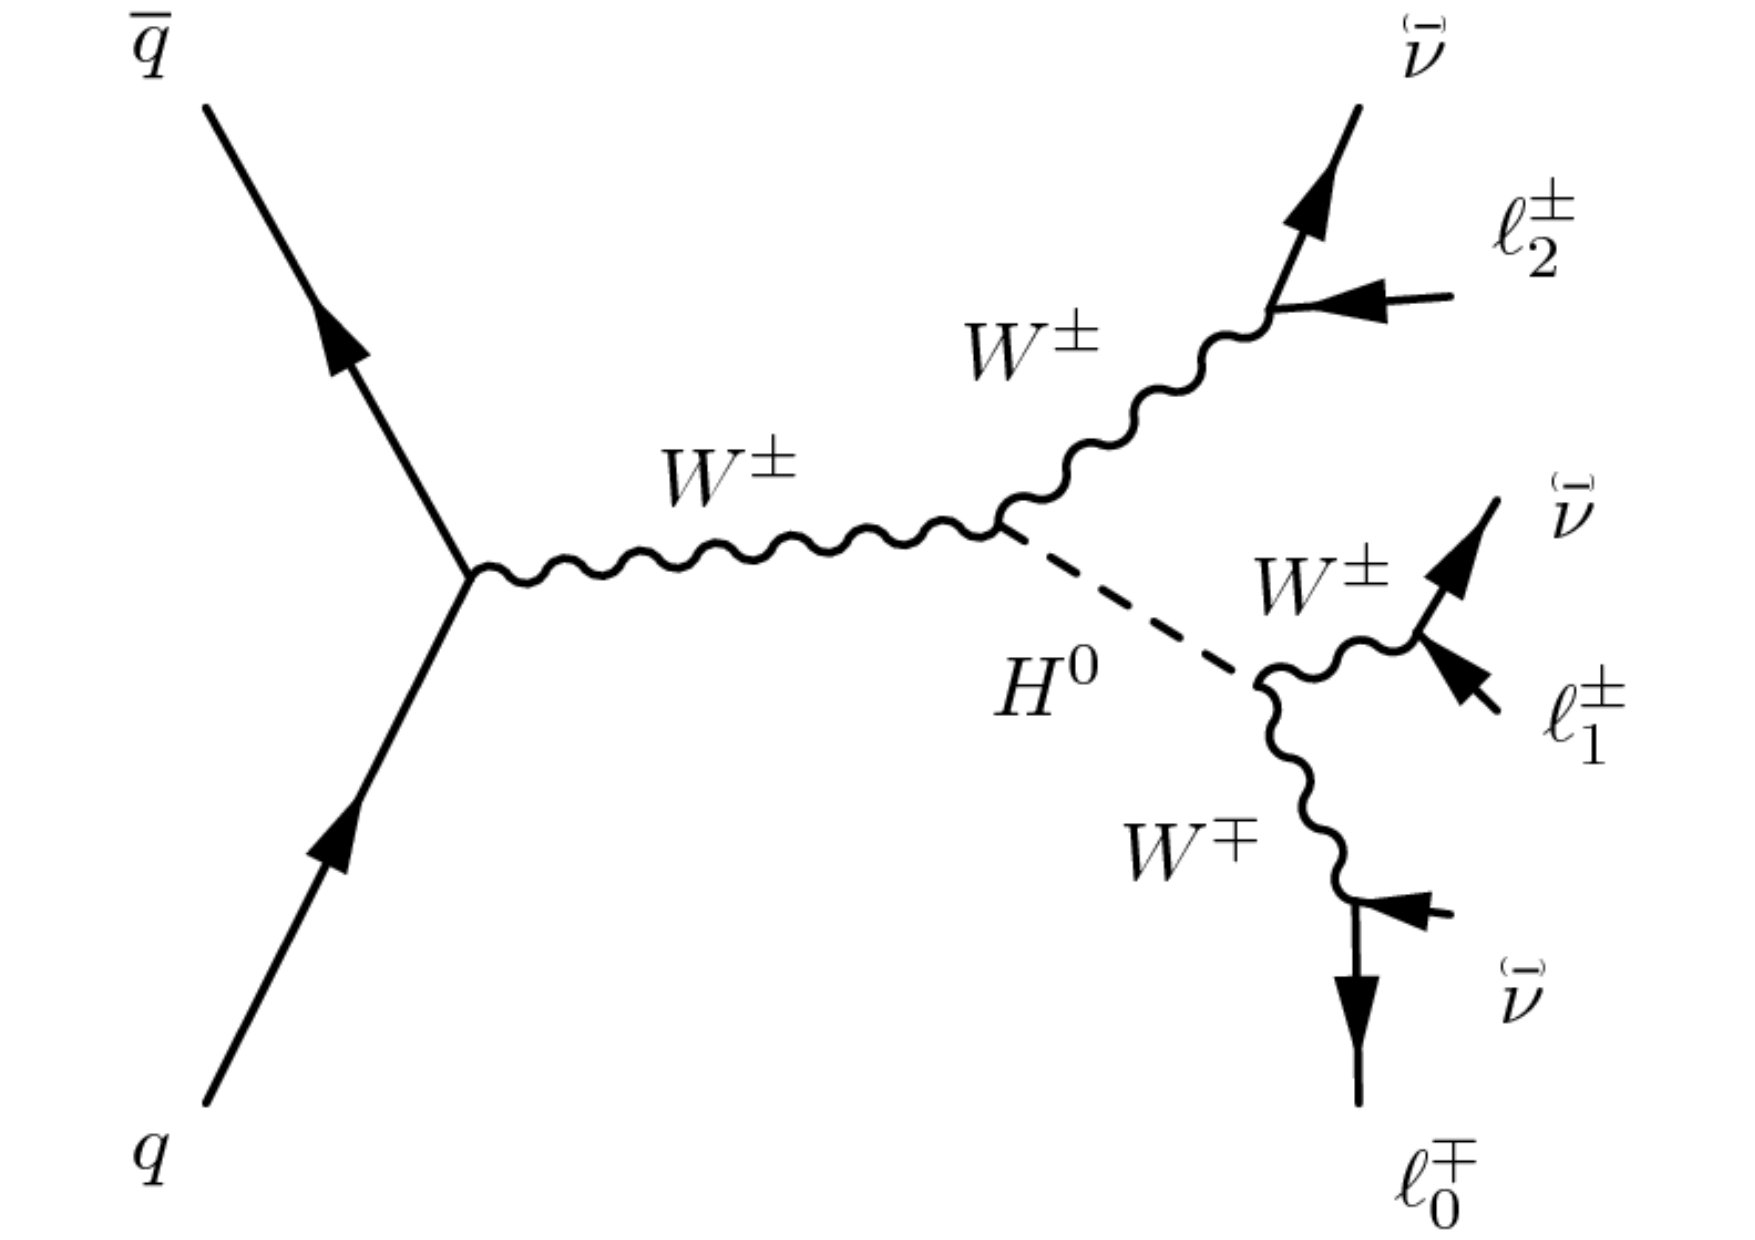 Figure 1
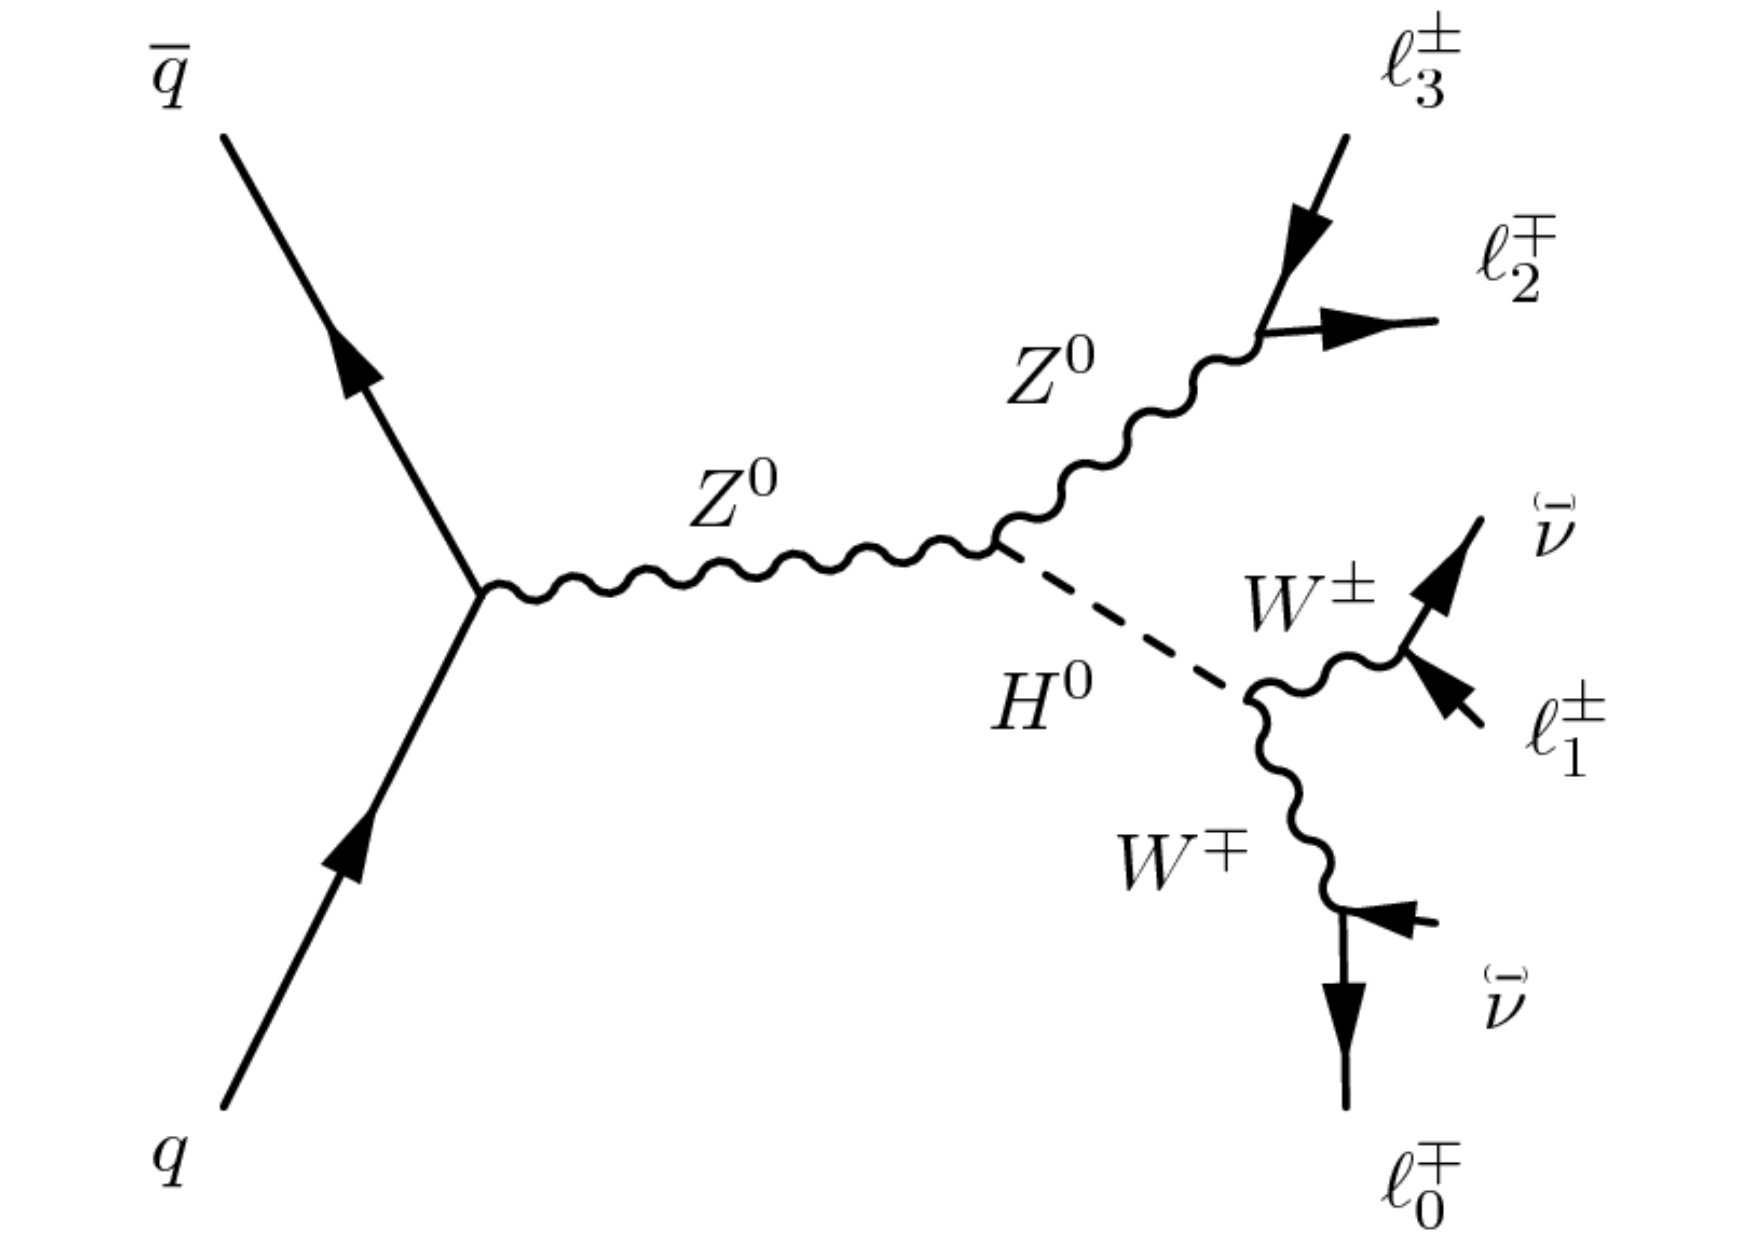 Figure 1
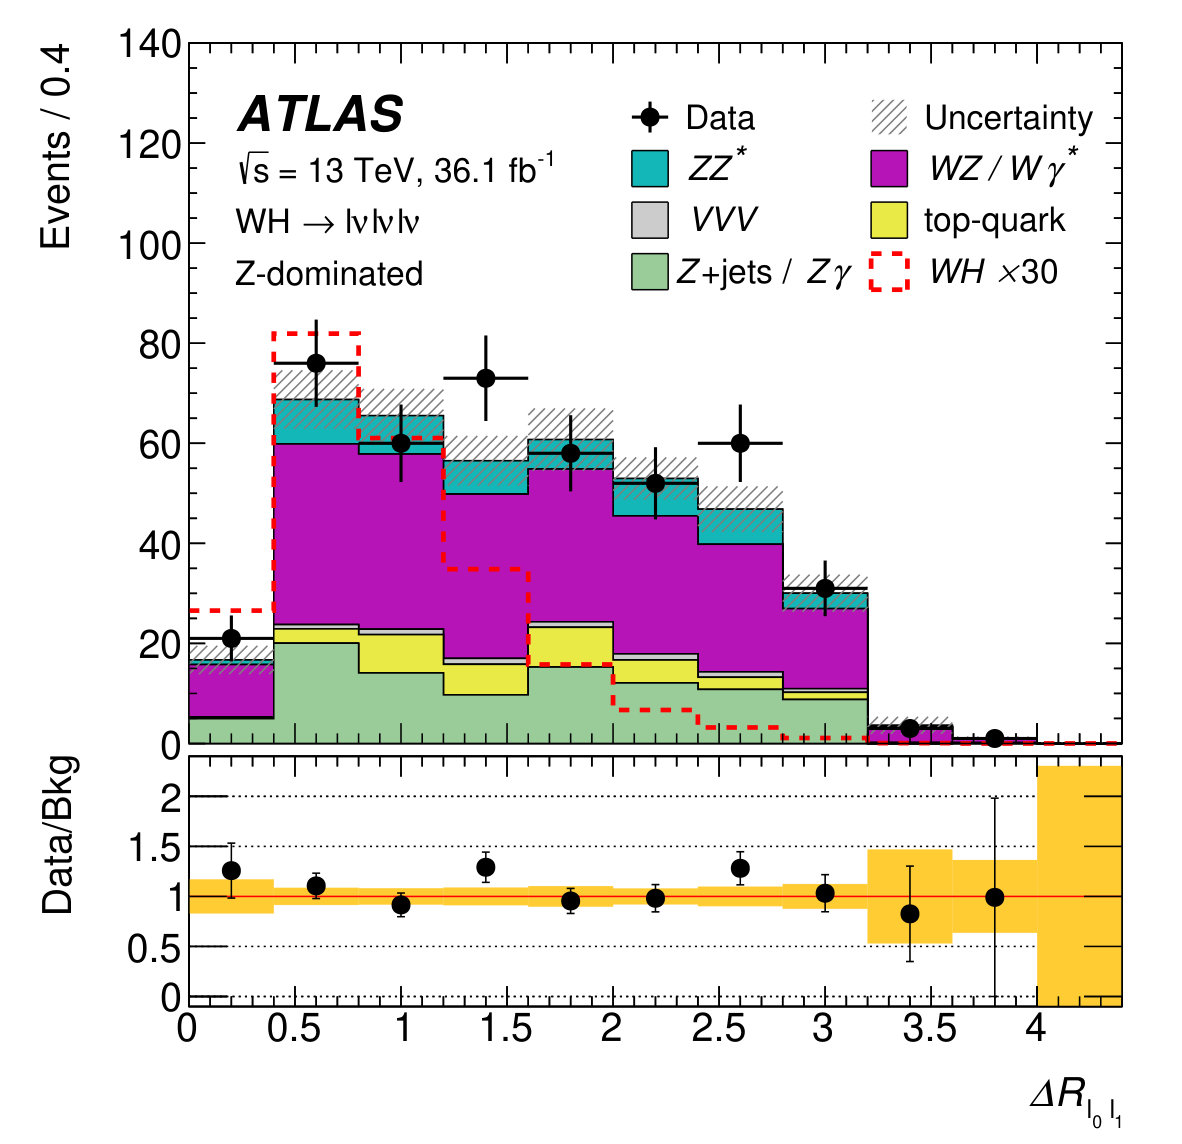 Figure 2
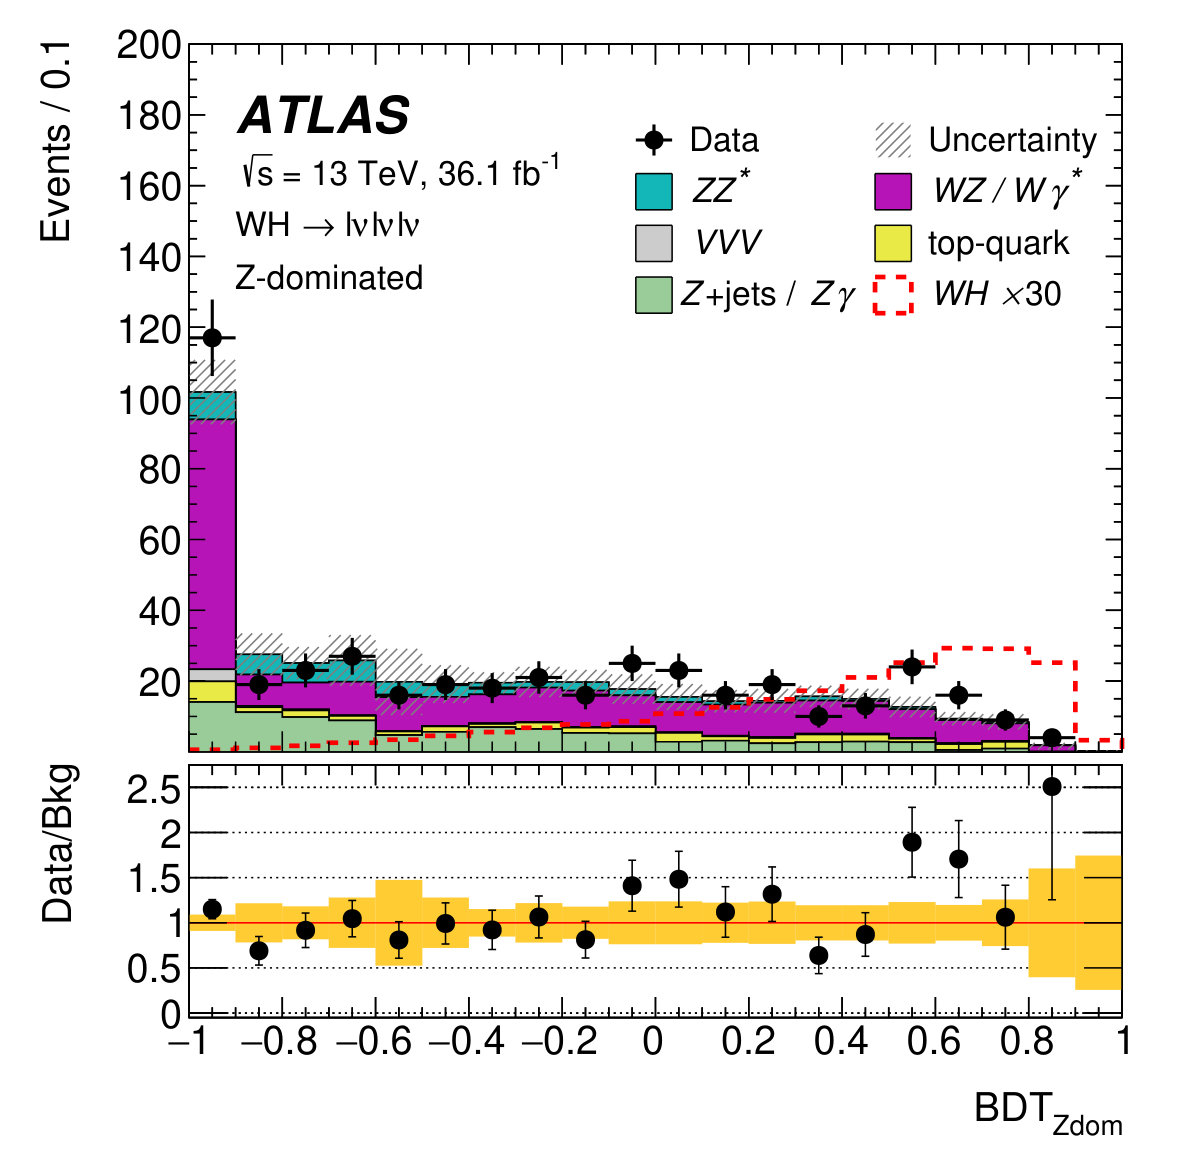 Figure 2
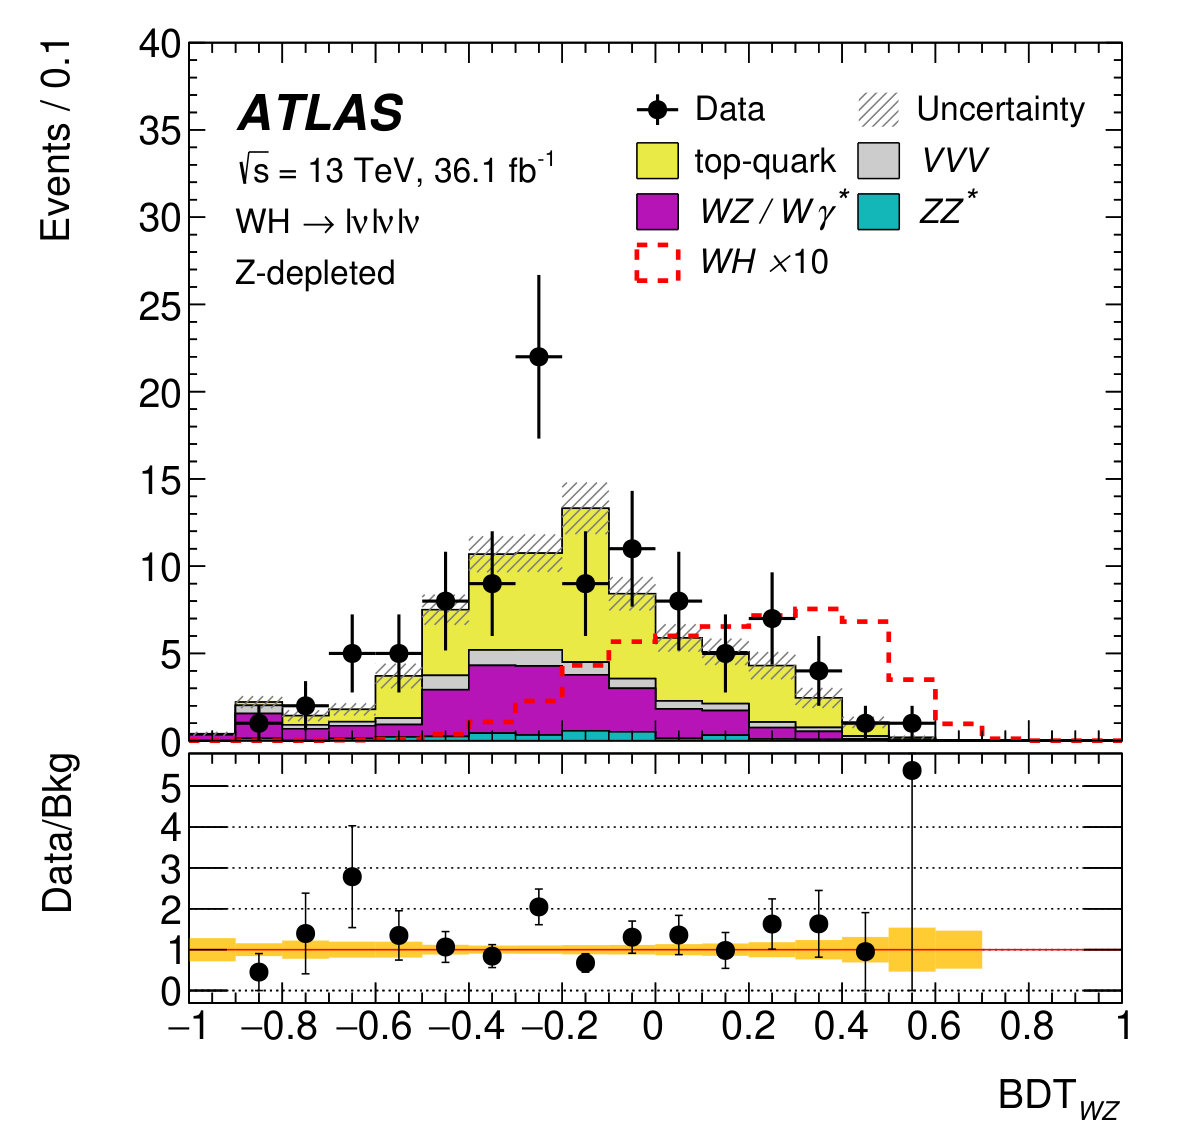 Figure 3
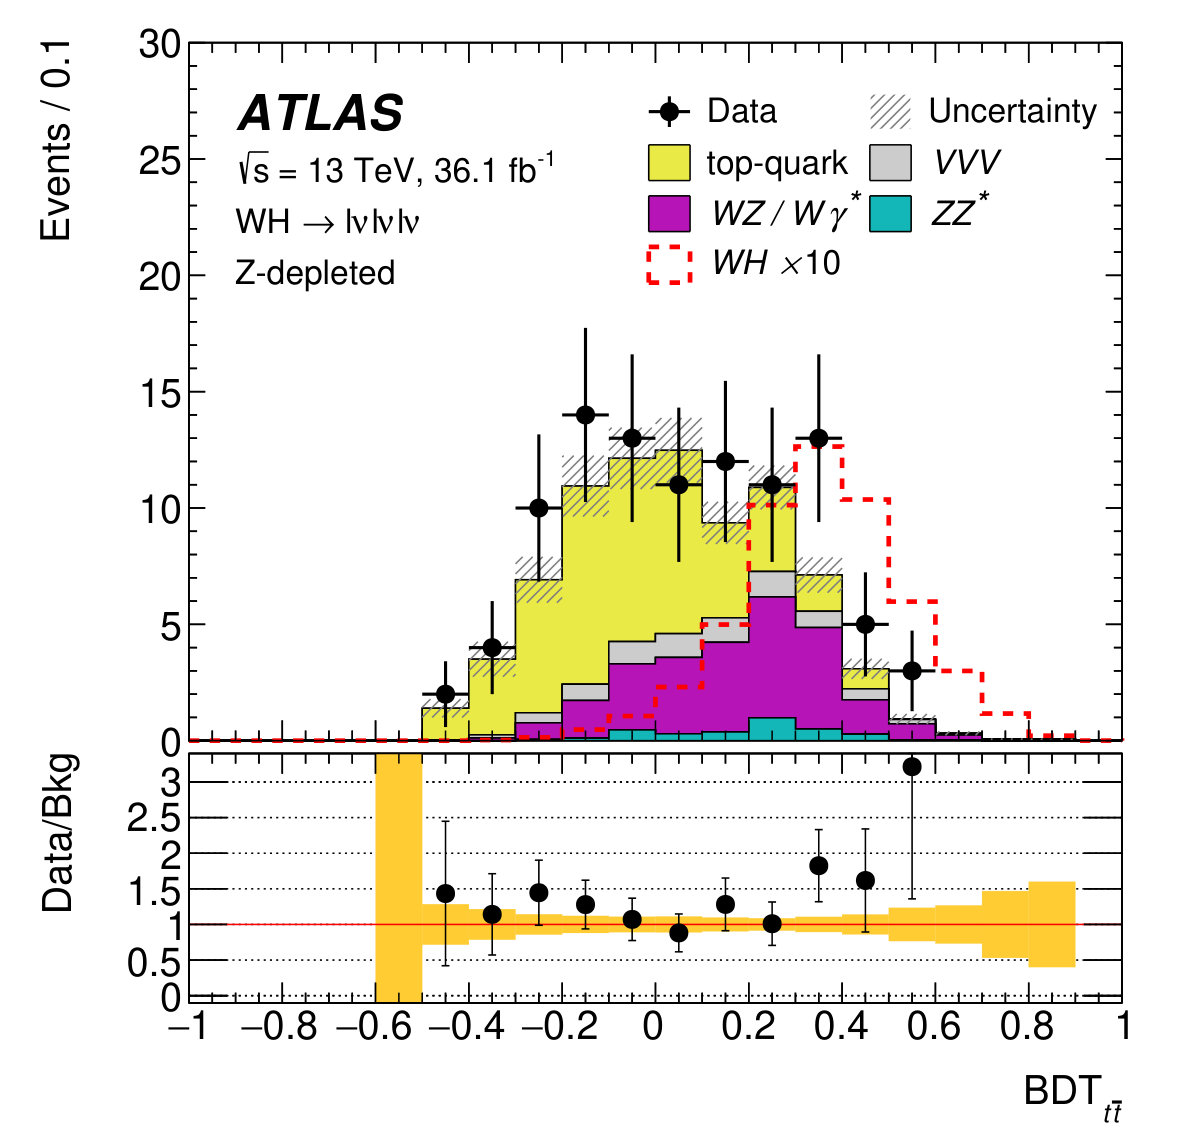 Figure 3
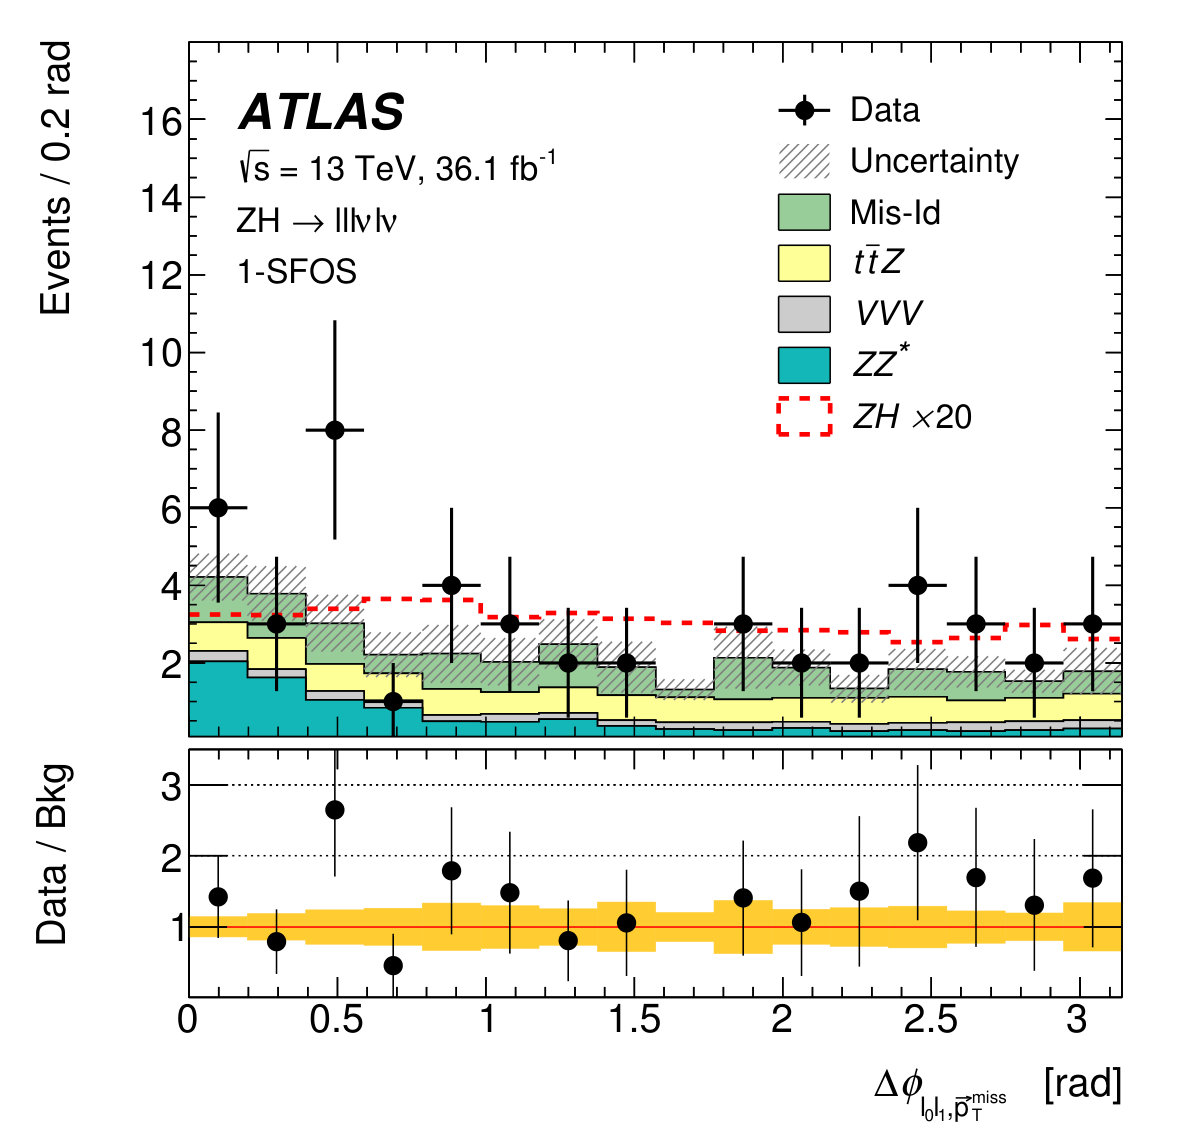 Figure 4
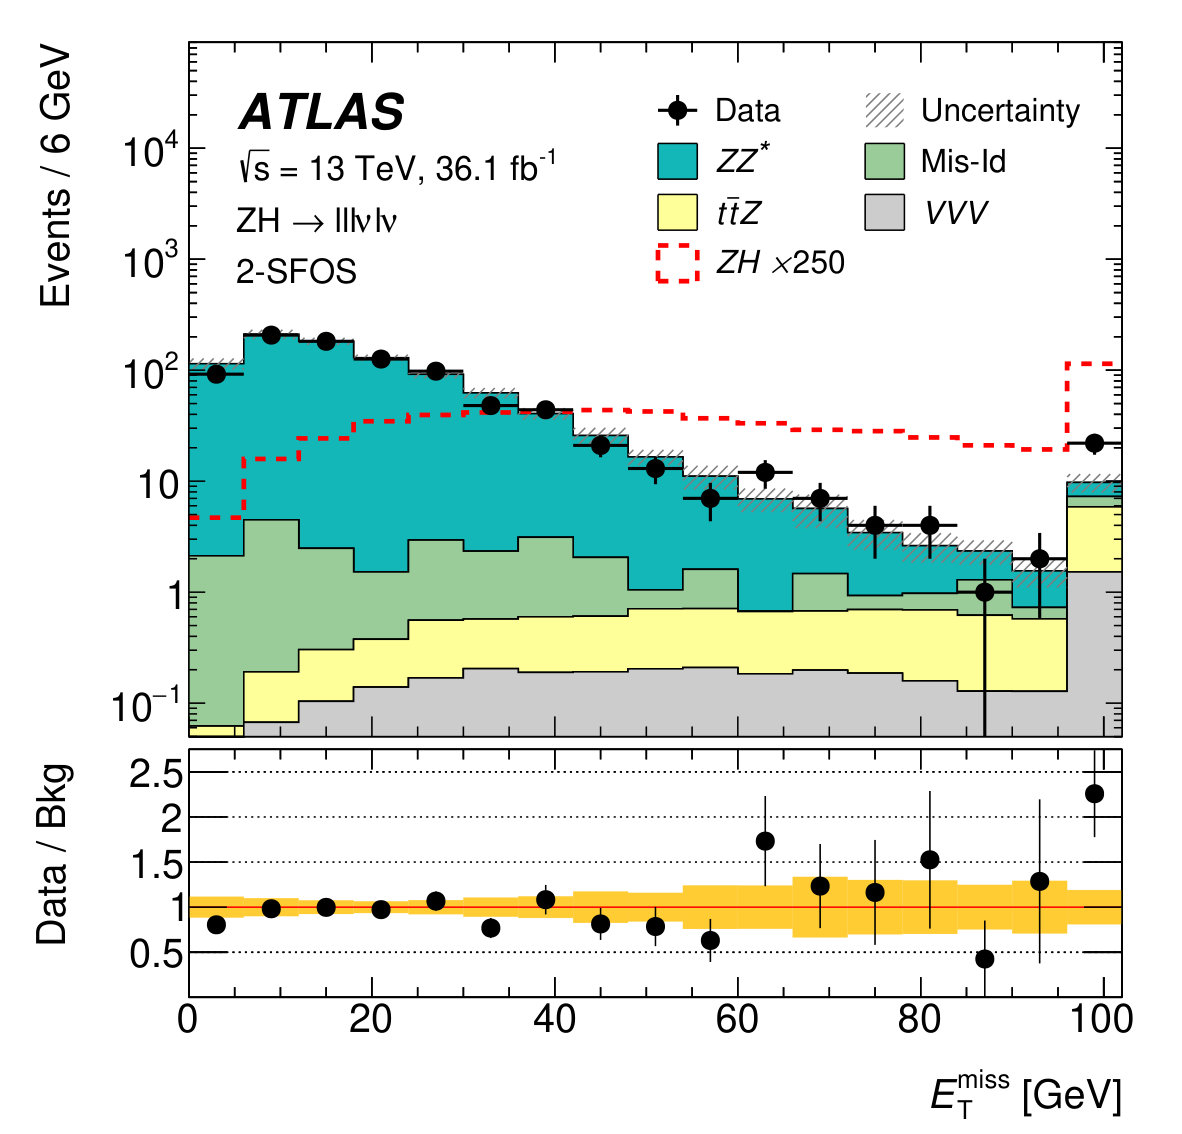 Figure 4
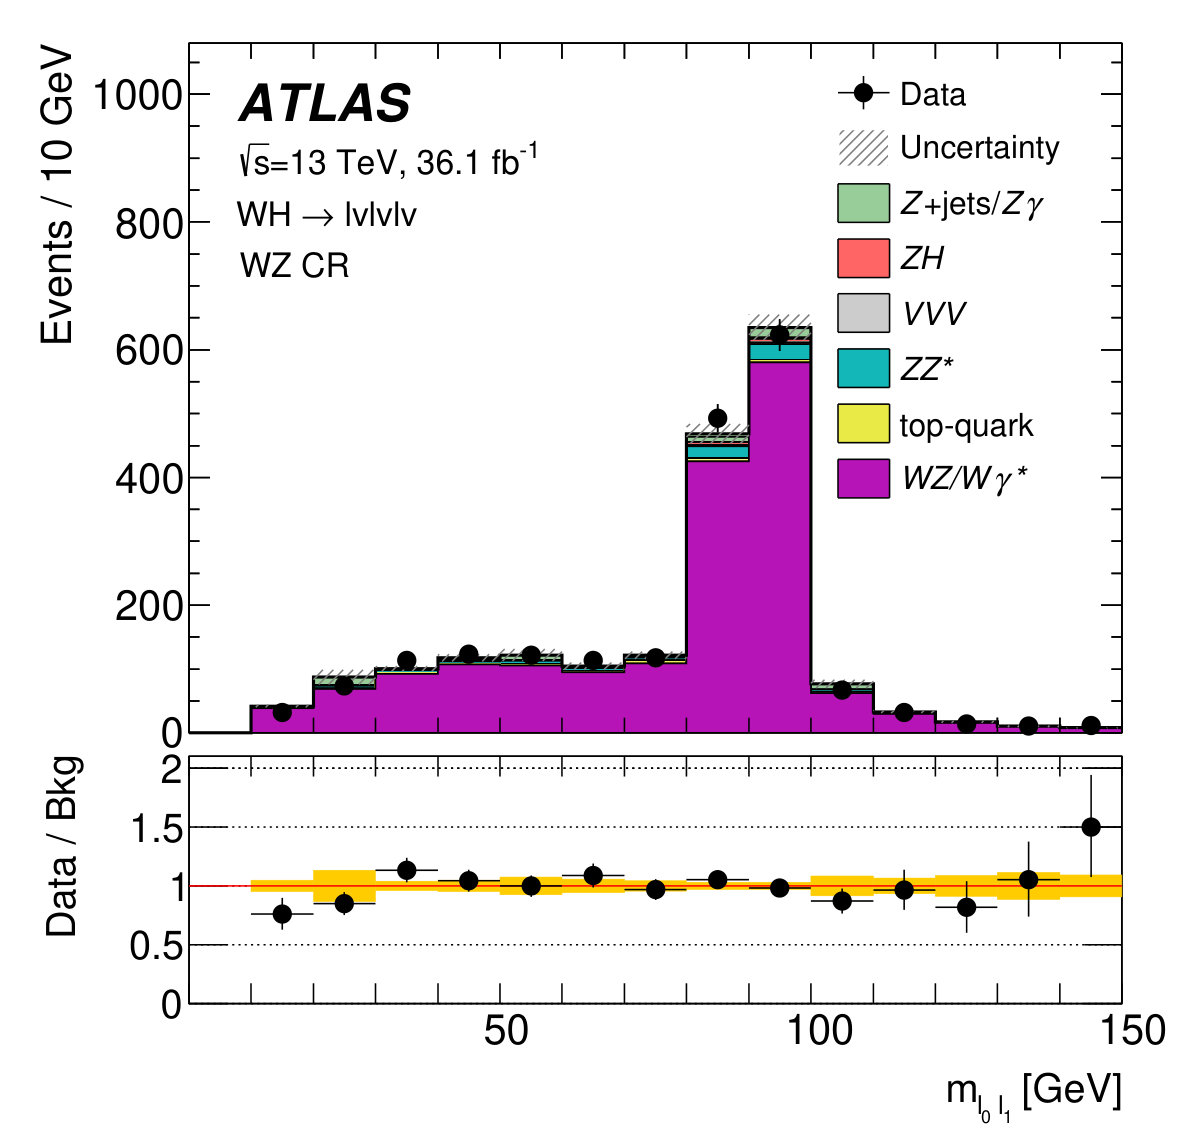 Figure 5
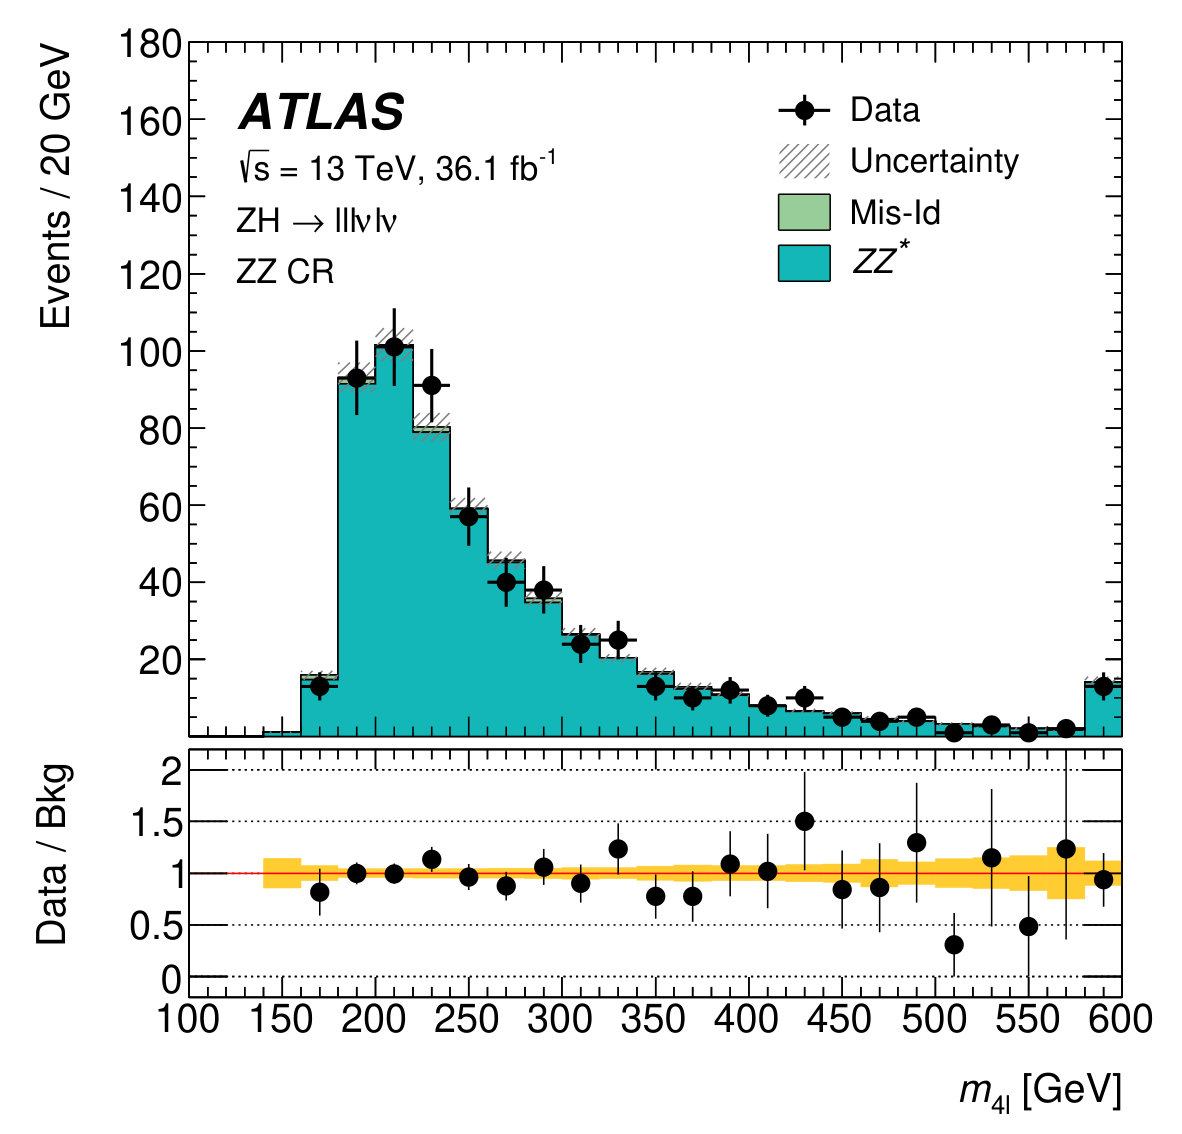 Figure 5
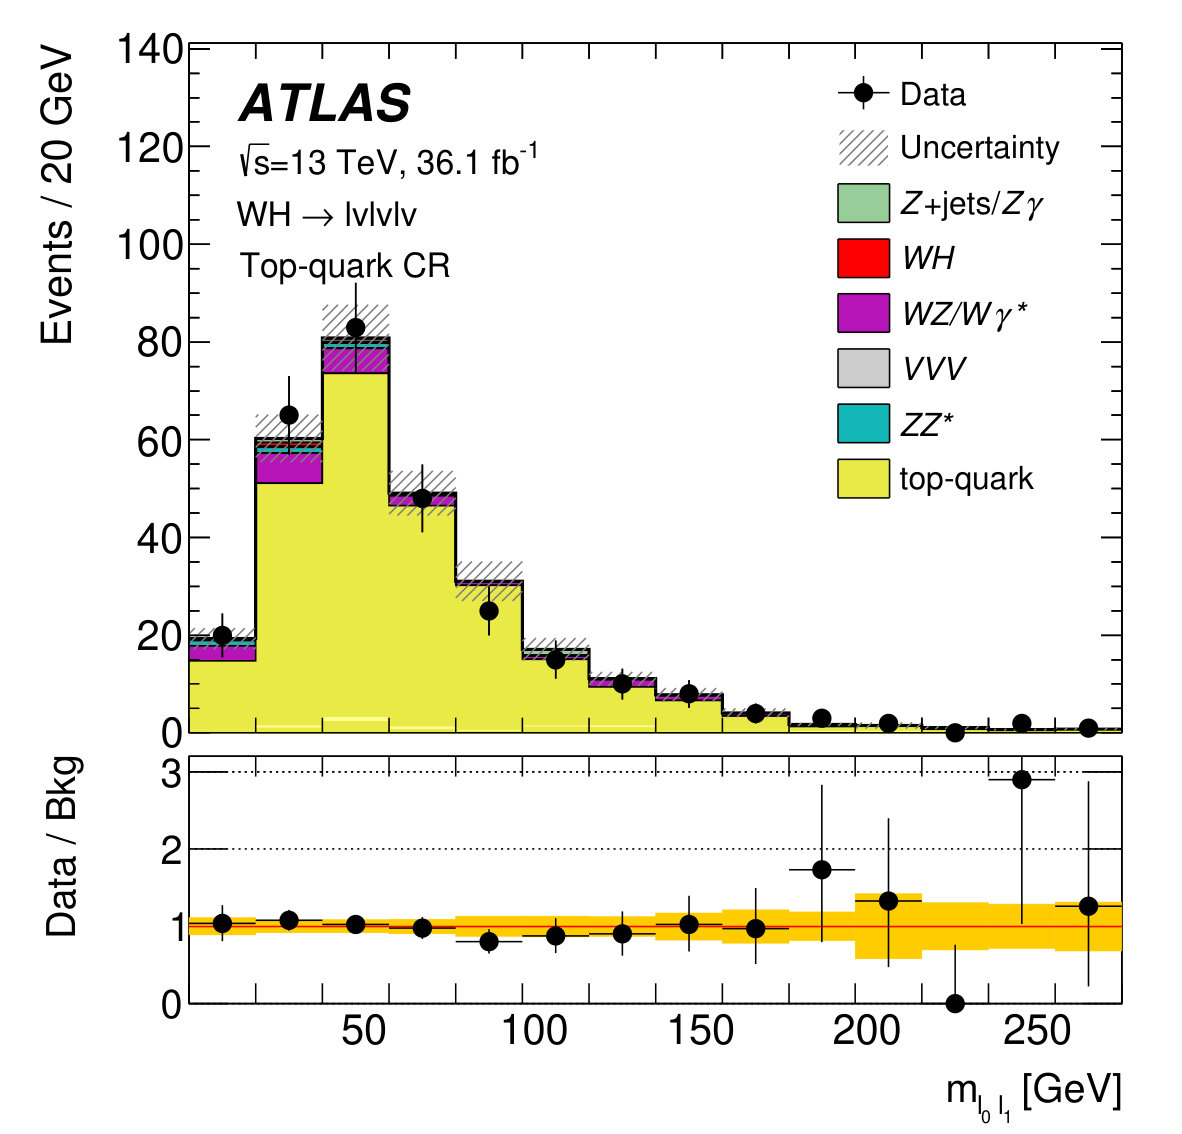 Figure 5
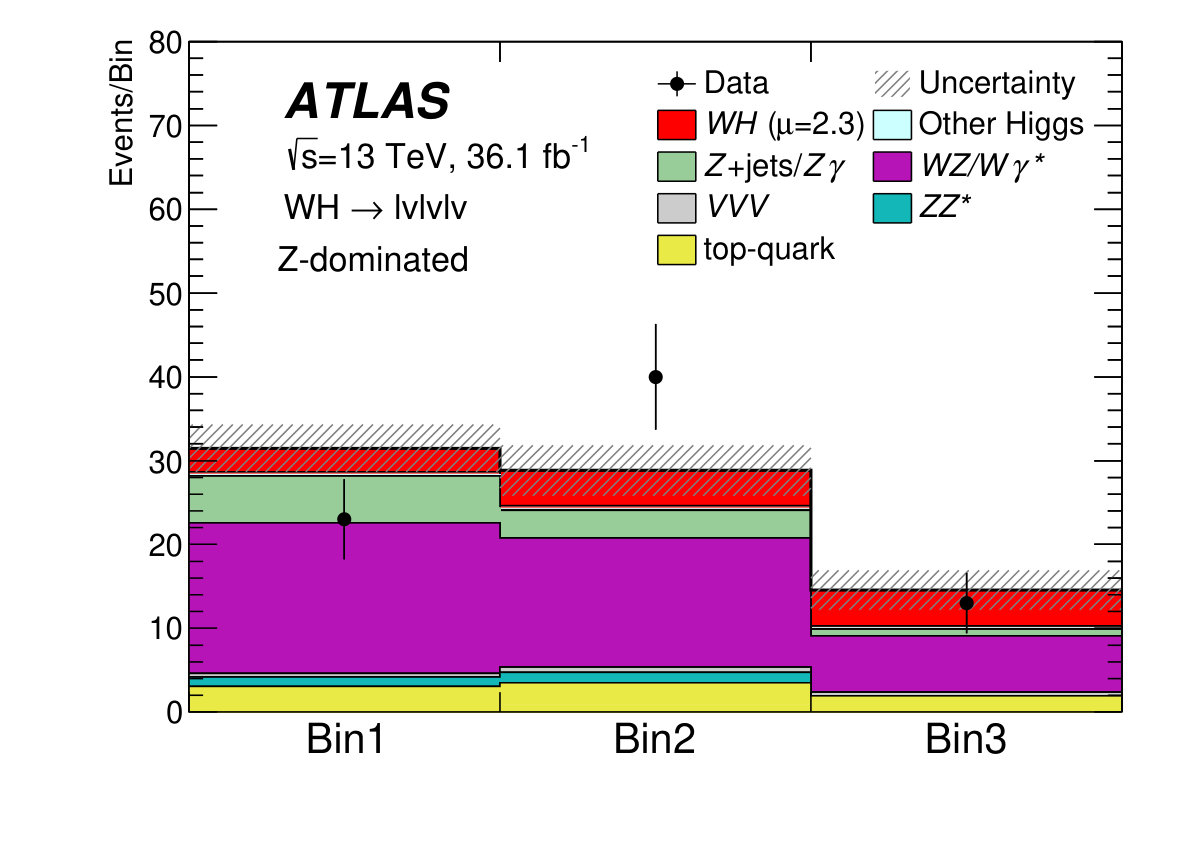 Figure 6
 Figure 6
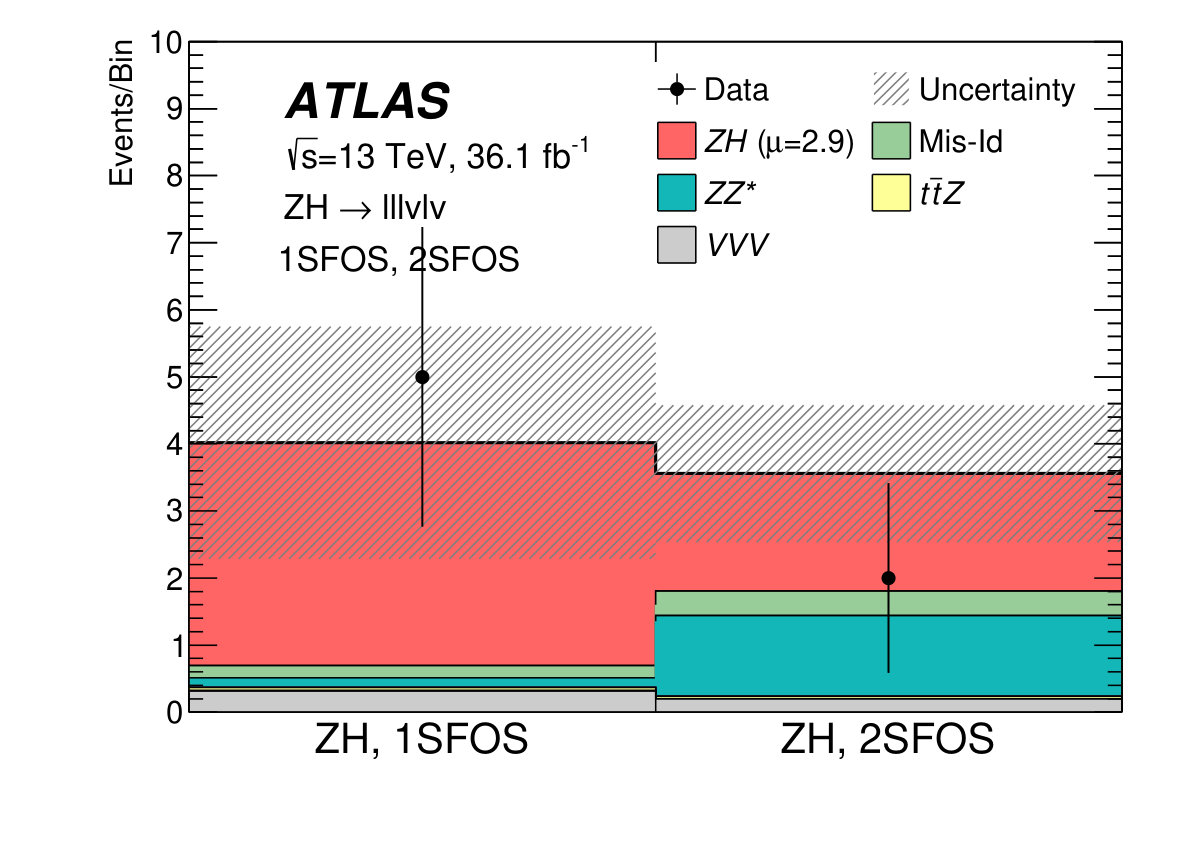 Figure 7
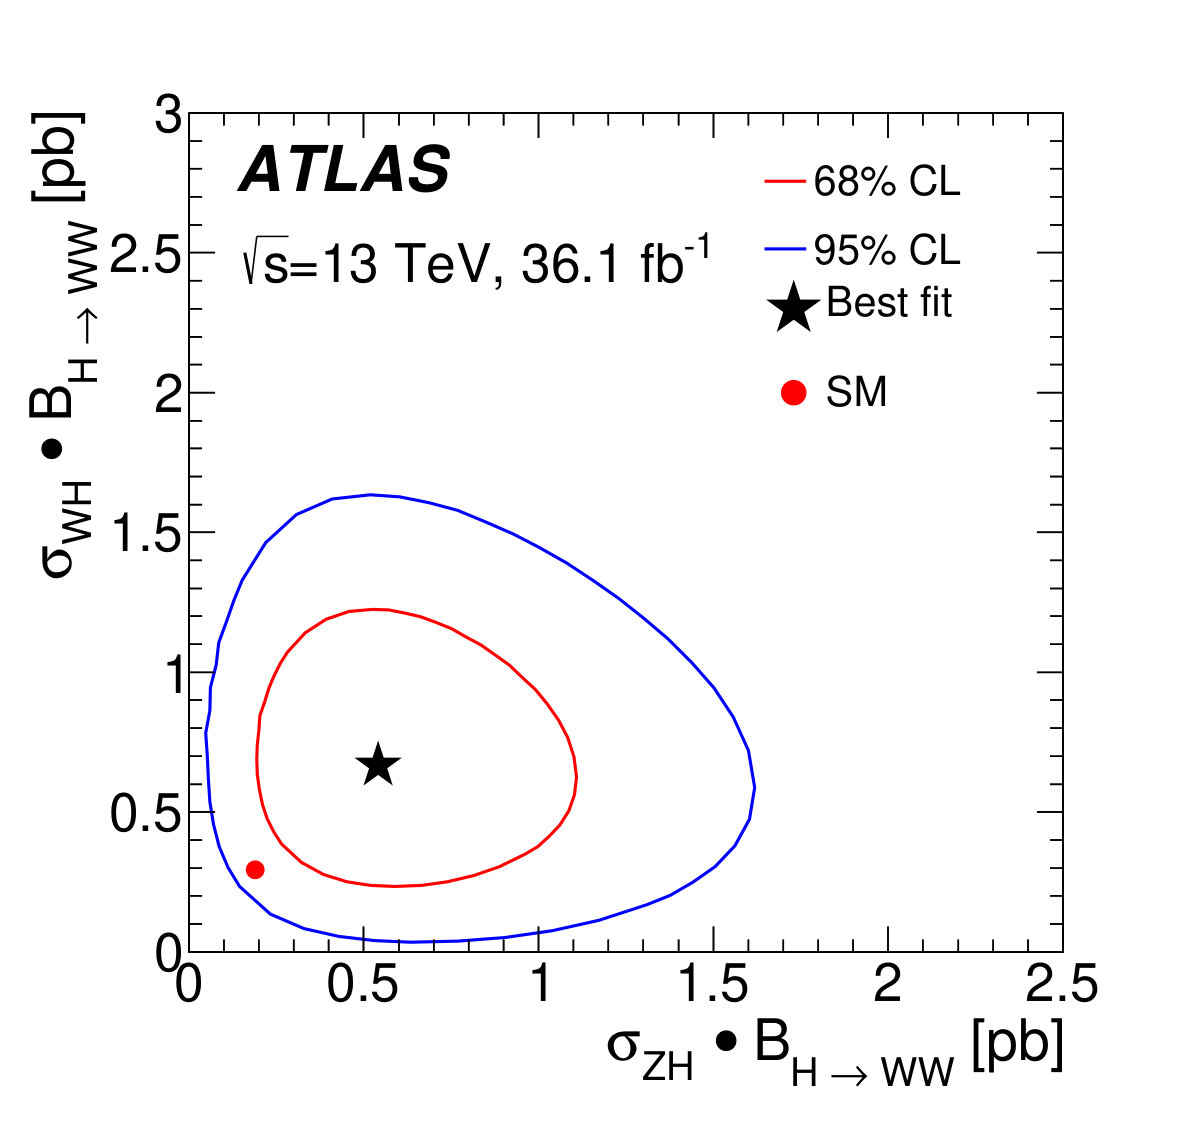 Figure 8
| Process | Generator | UEPS model | Prediction order |
| (alternative) | (alternative) | for total cross section | |
| Powheg-Box v2 MiNLO | Pythia8 | NNLO QCD + NLO EW [16, 17, 18] | |
| (Herwig 7) | |||
| Powheg-Box v2 MiNLO | Pythia8 | NNLO QCD + NLO EW [16, 17, 18] | |
| (Herwig 7) | |||
| Powheg-Box v2 | Pythia8 | NLO + NLL [19] | |
| (Herwig 7) | |||
| ggF | Powheg-Box v2 NNLOPS | Pythia8 | NNNLO QCD + NLO EW [20] |
| VBF | Powheg-Box v2 | Pythia8 | NNLO QCD + NLO EW [21] |
| Powheg-Box v2 | Pythia8 | NNLO+NNLL [22] | |
| (Herwig 7) | |||
| (Sherpa 2.2.1) | (Sherpa 2.2.1) | ||
| Powheg-Box v1 | Pythia6 | NLO [23] | |
| MG5_aMC@LO | Pythia8 | NLO [24, 25] | |
| MG5_aMC@LO | Pythia6 | LO [26] | |
| Sherpa 2.2.2 | Sherpa 2.2.2 | NLO [27] | |
| (Powheg-Box v2) | (Herwig++) | ||
| Sherpa 2.1/2.2.2 | Sherpa 2.1/2.2.2 | NLO [27] | |
| (Powheg-Box v2) | (Herwig++) | ||
| Sherpa 2.1.1 | Sherpa 2.1.1 | NLO [28] | |
| Sherpa 2.2.2 | Sherpa 2.2.2 | NLO [29] | |
| (MG5_aMC@NLO) | (Pythia8) |
| Preselection | 3 isolated leptons ( 15 GeV) | 4 isolated leptons ( 10 GeV) | ||
|---|---|---|---|---|
| total lepton charge | total lepton charge 0 | |||
| Category | -dominated | -depleted | 2-SFOS | 1-SFOS |
| Number of SFOS | 2 or 1 | 0 | 2 | 1 |
| Number of jets | — | |||
| Number of -jets | 0 | 0 | 0 | 0 |
| [GeV] | — | — | ||
| [GeV] | — | — | — | |
| [GeV] | (min. SFOS) | — | ||
| [GeV] | (SFOS) | — | ||
| [GeV] | — | — | ||
| — | — | |||
| [GeV] | — | — | — | |
| [rad] | — | — | — | |
| [GeV] | — | — | — | |
| BDT | BDT | — | — | |
| Bin 1 | Bin 2 | Bin 3 | Bin 4 | Bin 5 | Bin 6 |
|---|---|---|---|---|---|
| Channel (Category) | (-dominated and -depleted) | (2-SFOS) | |
|---|---|---|---|
| CR | Top-quark | ||
| Number of leptons | 3 | 3 | 4 |
| Total lepton charge | 0 | ||
| Number of SFOS | 2 or 1 | 2 | |
| Number of jets | |||
| Number of -jets | 0 | 0 | |
| [GeV] | (2 or 1 SFOS) | — | |
| [GeV] | (2 or 1 SFOS) | ||
| [GeV] | — | — | |
| (min. SFOS) [GeV] | (2 or 1 SFOS) | — | |
| Normalisation factors | 0.990.05 | 0.970.08 | 1.130.06 |
| Process | ||||||||
| -dominated | -depleted | 1-SFOS | 2-SFOS | |||||
| — | ||||||||
| — | ||||||||
| Other top-quark | — | |||||||
| Other Higgs | <0.01 | |||||||
| Misid. leptons | <0.1 | |||||||
| Total background | ||||||||
| Observed | 76 | 10 | 5 | 2 | ||||
| Source | |
|---|---|
| Data statistics in SR | |
| Data statistics in CR | |
| Theoretical uncertainties | |
| (*) | |
| Top-quark(*) | |
| signal(*) | |
| Experimental uncertainties | |
| Impact parameter mismodelling | |
| Misidentified leptons | |
| -tagging | |
| MC statistics | |
| Luminosity | |
| TOTAL |
Peer Reviews
No public reviews on file for this paper yet. If you reviewed it on a platform where reviews are public (OpenReview, ICLR, NeurIPS, ICML), you can paste yours below so the community can read it here.
Videos
No videos yet. Explain this paper in a talk, walkthrough, or lecture? Add one.
\LEcontact
Pat Ward [email protected]
\AtlasTitleMeasurement of the production cross section for a Higgs boson in association with a vector boson in the channel in collisions at = 13 TeV with the ATLAS detector \AtlasAbstract A measurement of the Higgs boson production cross sections via associated and production using decays, where stands for either an electron or a muon, is presented. Results for combined and production are also presented. The analysis uses events produced in proton–proton collisions collected with the ATLAS detector at the Large Hadron Collider in 2015 and 2016. The data correspond to an integrated luminosity of recorded at a centre-of-mass energy of 13 TeV. The products of the branching fraction times the and cross sections are measured to be (stat.)(syst.) pb and (stat.)(syst.) pb respectively, in agreement with the Standard Model predictions.
\AtlasRefCodeHIGG-2017-14 \PreprintIdNumberCERN-EP-2019-038 \AtlasJournalPhys. Lett. B. \AtlasJournalRefPhys. Lett. B 798 (2019) 134949 \AtlasDOI10.1016/j.physletb.2019.134949 \AtlasCoverSupportingNoteSupporting Notehttps://cds.cern.ch/record/2295764 \AtlasCoverCommentsDeadline??? \AtlasCoverAnalysisTeamAntonio Baroncelli, Kathrin Becker, Claudia Bertella, Michela Biglietti, Carsten Burgard, Dominik Duda, Ada Farilla, Frank Fiedler, Frank Filthaut, Ralf Gugel, Yesenia Hernandez Jimenez, Sana Ketabchi, Karsten Koeneke, Peter Krieger, Aaron Liblong, Bruce Mellado, Sophio Pataraia, Christian Schmitt, Marco Sessa, Jonas Strandberg, Marcel Weirich, Natalie Wieseotte \AtlasCoverEdBoardMemberZhiqing Zhang (chair), Aaron Armbruster, Andrea Bocci \[email protected] \AtlasCoverEgroupEdBoardatlas-HIGG-2017-14-editorial-board@cern.ch
1 Introduction
Higgs boson production in association with a or boson, which is respectively denoted by and , and collectively referred to as associated production in the following, provides direct access to the Higgs boson couplings to weak bosons. In particular, in the mode with subsequent decay, the Higgs boson couples only to W bosons, at both the production and decay vertices.
This paper presents a measurement of the corresponding production cross sections through the decay , using proton–proton collisions at a centre-of-mass energy of 13 TeV. The data correspond to an integrated luminosity of fb*-1* and were recorded by the ATLAS detector at the Large Hadron Collider (LHC). Previous measurements at TeV were performed by the ATLAS [1] and CMS [2] Collaborations and recently at TeV with of data by the CMS Collaboration [3]. Recent results at TeV on production in other decay modes can be found in Refs. [4, 5, 6, 7, 8, 9].
The analysis is performed using events with three () or four () charged leptons (electrons or muons) in the final state, targeting the and channels respectively. Leptonic decays of leptons, from or or from the associated vector bosons, are considered as signal, while no specific selection is performed for events with hadronically decaying leptons in the final state. Events from production with are considered as background. The leading-order Feynman diagrams for the and production processes are depicted in Figure 1.
In the channel, multivariate discriminants are used to maximise the sensitivity to the Higgs boson signal, while in the channel the analysis is performed through selection requirements. The distribution of these discriminants, together with event counts in background control regions and the signal regions in the channel, are combined in a binned maximum-likelihood fit to extract the signal yield and the background normalisations. The maximum-likelihood fit provides results for the and the channels separately and for their combination , assuming the Standard Model (SM) prediction for the relative cross sections of the two production processes.
2 ATLAS detector
The ATLAS experiment [10, 11, 12] is a multi-purpose particle detector with a forward–backward symmetric cylindrical geometry and a near coverage in solid angle.111 ATLAS uses a right-handed coordinate system with its origin at the nominal interaction point (IP) in the centre of the detector and the -axis along the beam pipe. The -axis points from the IP to the centre of the LHC ring, and the -axis points upwards. Cylindrical coordinates are used in the transverse plane, being the azimuthal angle around the -axis. The pseudorapidity is defined in terms of the polar angle as . Angular distance is measured in units of . Transverse momentum and energy are defined as and respectively. It consists of an inner tracking detector (ID) surrounded by a thin superconducting solenoid providing a axial magnetic field, electromagnetic (EM) and hadronic calorimeters, and a muon spectrometer (MS). The inner tracking detector covers the pseudorapidity range . It consists of silicon pixel, silicon micro-strip, and transition-radiation tracking detectors. Lead/liquid-argon (LAr) sampling calorimeters provide electromagnetic energy measurements with high granularity. A hadronic (steel/scintillator-tile) calorimeter covers the central pseudorapidity range (). The endcap and forward regions are instrumented with LAr calorimeters for both EM and hadronic energy measurements up to . The muon spectrometer surrounds the calorimeters and is based on three large air-core toroidal superconducting magnet systems that provide a field integral between and across most of the detector. The muon spectrometer includes a system of precision tracking chambers covering the region and fast detectors for triggering within the range . A two-level trigger system is used to select events [13].
3 Signal and background Monte Carlo simulation
Monte Carlo (MC) event generators are used to model signal and background processes. All signal samples were generated with a Higgs boson mass of 125 GeV [14, 15]. For most processes, separate programs were used to generate the hard scattering process and to model the underlying event and the parton showering (UEPS). A description of the MC samples is given in Table 1. They are normalised to cross-section predictions calculated with the QCD and electroweak (EW) orders specified in the last column of Table 1.
The and processes were generated with Powheg-Box v2 [30] MiNLO interfaced to Pythia8 [31], with the AZNLO set of tuned parameters (tune) [32] for underlying event, showering and hadronisation. The process was simulated with Powheg-Box v2 + Pythia8 with the AZNLO tune for underlying event, showering and hadronisation. For the samples, the PDF4LHC15 parton distribution function (PDF) set [33] was used for the hard scattering process in Powheg-Box v2 and the CTEQ6L1 PDF set [34] was used for the parton showering in Pythia8. Herwig 7 [35], with the MMHT2014lo68cl PDF set [36], was used as an alternative parton-showering model for . The uncertainty due to the PDF choice is smaller than the uncertainty obtained by using Herwig as an alternative parton shower model (Section 7).
The gluon–gluon fusion (ggF) events were generated with Powheg-Box v2 NNLOPS [37] interfaced to Pythia8 with the AZNLO tune. The vector-boson fusion (VBF) events were generated with Powheg-Box v2, interfaced to Pythia8. For the ggF and VBF samples, the PDF4LHC15 PDF set was used for the hard scattering process in Powheg-Box v2 and the CTEQ6L1 PDF set was used for the parton showering in Pythia8. The contribution from the and production modes is negligible.
The top-quark pair production () was simulated with Powheg-Box v2 [38] using the NNPDF 3.0 NNLO PDF set [39] and interfaced to Pythia8 using the NNPDF 2.3 PDF set [40] for parton showering, with the A14 tune [41]. For production, Sherpa [42] 2.2.1, with the NNPDF 3.0 PDF set, was used as an alternative generator while Herwig 7, with the MMHT2014lo68cl PDF set, was used as an alternative UEPS model. The single-top-quark production was generated with Powheg-Box v1 [23] interfaced to Pythia6 [43] for parton showering with the Perugia2012 tune [44]. EvtGen 1.2.0 [45] was used for the simulation of b-quark and c-quark decays. The and processes were generated at leading order (LO) with MG5_aMC@LO [25] version 2.2.2 () and 2.2.1 () interfaced to Pythia8 () and Pythia6 (), using the NNPDF2.3 LO PDF set.
The samples with final states and [46] were generated with Sherpa 2.2.2, with the exception of the sample in the analysis for which Sherpa 2.1 was used; the CT10 PDF set [47] and the NNPDF 3.0 PDF set were used for versions 2.1 and 2.2.2, respectively. Powheg-Box v2 [48] was used as an alternative generator for , with Herwig++, using the CTEQ6L1 PDF set, for parton showering. Among the loop-induced -initiated diboson processes, the only relevant process in this analysis is , for which a -factor of 1.55 was used [28]. This process was simulated with Sherpa 2.1.1, using the CT10 PDF set.
The triboson samples were generated with Sherpa 2.2.2 and the NNPDF 3.0 PDF set. MG5_aMC@NLO was used as an alternative generator for , with Pythia8, using the NNPDF2.3 LO PDF set. The same PDF sets were used for the hard scattering and the parton showering in all the Sherpa samples described above.
All simulated samples include the effect of pile-up from multiple interactions in the same and neighbouring bunch crossings. This was achieved by overlaying minimum-bias events, simulated using Pythia8 with the A2 tune [49] and MSTW2008LO PDF set [50]. All samples were processed through the Geant 4 [51] ATLAS detector simulation [52].
4 Event reconstruction
Candidate signal events are selected using triggers that require a single isolated lepton with minimum transverse momentum () thresholds between 24 GeV and 26 GeV for electrons and between 20 GeV and 26 GeV for muons, depending on the data-taking period. At least one of the leptons reconstructed offline is required to have triggered the event and to have a higher than the nominal trigger threshold by at least 1 GeV. The single-lepton trigger efficiencies on the plateau are approximately 70% for single muons with , 90% for single muons in the range and greater than 90% for single electrons in the range . The trigger efficiency for the signal events, estimated after the preselection, is 94% for and 98.5% for .
Selected events are required to have at least one primary vertex reconstructed from at least two associated tracks, each with transverse momentum , as described in Ref. [53]. If an event has more than one reconstructed primary vertex, the vertex with the largest track is selected for the analysis.
Electrons are reconstructed from clusters of energy deposits in the EM calorimeter matched to ID tracks, and are identified using criteria based on the calorimeter shower shape, the quality of the match between the track and the cluster and the amount of transition radiation emitted in the ID, as described in Ref. [54]. Electrons are required to satisfy , excluding , which corresponds to the transition region between the barrel and the endcap EM calorimeters. The efficiency for electron identification ranges from 88% to 94%, depending on electron and . Muons are reconstructed by combining ID and MS tracks with consistent trajectories and curvatures. An overall fit of hits from the ID track, energy loss in the calorimeter and the hits of the track in the muon system is used to form muon candidates, as described in Ref. [55]. The efficiency for muon identification is close to 95% over the full instrumented range. To suppress particles misidentified as leptons, several identification requirements as well as impact parameter, calorimeter and track isolation criteria [54, 55] are applied.
Jets are reconstructed using the anti- algorithm with radius parameter [56, 57]. The four-momenta of jets are corrected for the effects of calorimeter non-compensation, energy loss in non-instrumented regions, and contributions from pile-up [58]. Jets are required to have , with GeV for the region and GeV for the region . A multivariate selection [59] is used to suppress jets with GeV and originated from pile-up. Furthermore, to suppress pile-up jets in the forward region, jet shapes and topological jet correlations in pile-up interactions are exploited [60]. Jets with > 20 GeV and containing -hadrons (-jets) are identified using a multivariate technique [61] with an efficiency of 85%, estimated from simulated events. The multivariate technique gives rejection factors against jets originating from a light quark or gluon and jets containing -hadrons of 33 and 3, respectively.
The missing transverse momentum with magnitude in each event is calculated from the negative vectorial sum of the transverse momenta of electrons, muons, and jets. It uses both track-based and calorimeter-based measurements [62].
5 Event selection
In the channel, exactly three isolated leptons with are required with a total charge of . The lepton with unique charge is labelled , the lepton closest to in angular distance is labelled , and the remaining lepton is labelled . In signal events leptons and are most likely to originate from the decay, with probabilities of and respectively.
The most prominent background processes to the channel are production and top-quark processes with either three prompt leptons, e.g. , or two prompt leptons and one non-prompt lepton from a -hadron decay, e.g. . Other important background processes are (including ), and +jets production; they may satisfy the signal selection requirements if a lepton is undetected, in the case of , or if they contain a misidentified or non-prompt lepton, in the case of and +jets production. Processes with three prompt leptons in the final state such as tribosons, in particular , also contribute to the background. Contributions from background processes that include more than one misidentified lepton, such as +jets production and inclusive pair production, are negligible. The background from top-quark production is suppressed by vetoing events if they contain any -tagged jet.
The analysis of the channel separates events with at least one same-flavour opposite-sign charge (SFOS) lepton pair from events with zero SFOS lepton pairs, which have different signal-to-background ratios. Due to the presence of decays as a dominant background, the former is hereafter referred to as the -dominated category, while the latter is referred to as the -depleted category. In the -dominated category, the major background processes are those involving bosons. Events are vetoed if they contain more than one jet. This requirement further suppresses top-quark events with an additional non-prompt lepton from -hadron decays. In order to select final states with neutrinos, is required to be above 30 GeV. The invariant masses of all SFOS pairs are required to satisfy a -veto selection: . The last two requirements suppress and events, and improve the +jets rejection. In order to suppress background events from heavy-flavour quarkonia, the smallest invariant mass of SFOS pairs is required to be greater than 12 GeV. The signal efficiency of this selection with respect to the preselection is . A discriminant based on a boosted decision tree (BDT) [63, 64] is used to achieve a further separation between signal and background processes. The main purpose of the multivariate classifier, named BDT, is to distinguish between signal and the dominant and background processes, and hence it is trained against these two background processes. The BDT uses seven input variables. They are the magnitude of the vectorial sum of lepton transverse momenta (), the invariant masses of the first lepton pair () and of the three leptons (), the angular distance , and the pseudorapidity separation between the leptons with the same charge (). Moreover the BDT uses the transverse mass of the boson, , built from the and the lepton which is the lepton not belonging to the SFOS lepton pair with invariant mass closer to the boson mass, and could be either or . Figure 2 shows the distribution of , which is the most powerful variable in the BDT training, and the BDT distribution in the -dominated category, before applying any selection requirement on the BDT score.
The -dominated signal region (SR), defined as the events with high-ranking BDT score (BDT{}_{\textrm{Zdom}}$$>0.3), is divided into three bins with increasing sensitivity: , and . This binning is the result of an optimisation to find the minimal number of BDT bins that gives the highest sensitivity. The expected signal-to-background ratio in these bins is about 0.05, 0.09 and 0.19, respectively. The full -dominated event selection is summarised in Table 2.
In the -depleted category, the two major background processes are with and , where has the same signature of the signal, namely three prompt leptons, while contains a misidentified or non-prompt lepton from a jet. Two separate BDTs, named and \text{BDT}_{\text{t\bar{t}}}, are trained to allow an optimal background rejection. The uses 11 input variables, of which three common to the BDT are , and ; the other variables are the transverse momenta of the three leptons (, , ), the transverse mass () built from , and , the invariant mass of the electrons with same-sign charge (), the transverse impact parameter significances of the lepton with lowest (), the transverse impact parameter significances of the lepton with second-lowest and opposite charge with respect to the lepton with lowest () and the compatibility of the event with the hypothesis .222Given the reconstructed charged-lepton momenta and the , the event kinematics can be calculated under the with hypothesis and using the collinear approximation for the decays with one remaining unknown, e.g. the ratio of one energy to the energy of the lepton from this decay. This unknown is varied and the number of physical kinematic solutions is taken as a measure of the compatibility with the hypothesis.
A definition of the most likely lepton from heavy-flavour decays () is crucial for an optimal performance of the \text{BDT}_{\text{t\bar{t}}}. For this purpose, a is trained purely on data using track and calorimeter isolation as well as impact-parameter variables as input. The lepton with the minimal output is selected as . The \text{BDT}_{\text{t\bar{t}}} uses nine input variables, of which two common to the BDT and are and , one common to the BDT is , and the other input variables are the number of jets (), the transverse momentum of the leading jet (), the invariant mass of the leptons with same-sign charge (), and three -related variables: its output, its transverse momentum, , and the invariant mass built from it together with the closest opposite-charge lepton (). Figure 3 shows the outputs of and \text{BDT}_{\text{t\bar{t}}} in the -depleted category, before applying any selection requirements on the BDT scores.
The choice of input variables for the different BDTs was the result of an optimisation study where several thousand different BDTs using different set of input variables have been compared and the best performing BDTs have been selected for the final analysis.
The full -depleted event selection is summarised in Table 2. The events with high-ranking BDT scores (\text{BDT}_{\text{t\bar{t}}} > 0.2 and > 0.15) are used to define the -depleted SR. In this region, the BDT scores are used as discriminant variables in the statistical analysis, with three bins in \text{BDT}_{\text{t\bar{t}}}, each being subdivided into two bins in as shown in Table 3. The expected signal-to-background ratio in these bins ranges from about in the first bin up to about in the last bin. The signal efficiency with respect to the preselection, before any cut on the BDT scores, is .
The channel requires events to contain four isolated leptons with GeV and total electric charge of zero. Events that contain a SFOS lepton pair with GeV are rejected to suppress the contamination from heavy-flavour quarkonia. Following this preselection, events are classified according to the number of SFOS lepton pairs: 1-SFOS and 2-SFOS. Events with no SFOS lepton pairs are not considered.
The reconstruction of the process proceeds through the identification of the leptons from the boson, called and , as the SFOS lepton pair with invariant mass closest to the boson mass, . Then, the remaining two leptons, labelled and , are candidates for originating from the Higgs boson decay. The background in the channel is almost exclusively due to production. This constitutes 92% of the total background after the preselection is applied. Processes with four prompt leptons in the final state such as triboson production, in particular , which has the same signature as the signal, and also contribute to the background. Other background processes such as , +jets and may contribute when at least one jet, hadron or a converted photon is misidentified as a lepton.
In order to suppress the process, events containing -tagged jets are rejected and at most one and two jets are allowed in 2-SFOS and 1-SFOS classes, respectively. To reduce the background process in events with two SFOS lepton pairs, a threshold of 45 GeV is applied to the and to the vector sum of the lepton transverse momenta, . The invariant mass of and , , is required to satisfy GeV, and the invariant mass of and , , is required to be between 10 GeV and 60 GeV (55 GeV) in 1-SFOS (2-SFOS) events. The variable denotes the difference in azimuthal angle between the leptons from the Higgs boson candidate in the frame where the Higgs boson is zero. The Higgs boson transverse momentum is approximated with , or if at least one jet is present in the event. Events are required to satisfy rad in the 1-SFOS (2-SFOS) class. In 1-SFOS events the process contributes through the decay, therefore the reconstructed mass of the pair, is required to be below 50 GeV; is computed using the collinear approximation method [65]. In addition, the azimuthal separation between the Higgs-candidate lepton pair and the , , is required to be above 0.4 rad. The final selection of these variables is optimised in order to maximise the signal significance. Figure 4(a) illustrates the discriminating power of the variable for 1-SFOS events after the preselection. This variable reduces the ZZ* contribution which becomes the dominant background source after the -tagged jet veto and selection are applied. Figure 4(b) shows the distribution for 2-SFOS events after the preselection. In order to be orthogonal to the analysis of Ref. [66], 2-SFOS events are required to have an invariant mass of the four-lepton system, , above 140 GeV. The full event selection for is summarised in Table 2.
The total efficiency times acceptance of this selection for the process with subsequent decay is about while for it is about . These numbers are given with respect to all and decays.
6 Background estimation
The main background contamination originates from processes with the same final state as the signal, namely diboson production (, ), top-quark processes with three or four prompt leptons such as , and triboson production. Other relevant background contributions arise from processes, such as or jets, where the reconstructed leptons either originate from non-prompt decays of heavy-flavour hadrons or from jets misidentified as leptons.
Two dedicated regions, hereafter named control regions (CRs), are used to estimate the normalisation factors (NFs) of the main prompt background processes by fitting the expected yields from simulation to data: for the channel and for the channel in the 2-SFOS SR. In the 1-SFOS SR, is estimated purely from simulation.
The CRs are made orthogonal to the corresponding SRs by inverting various selection criteria with respect to the SR definitions. The CR is defined by reversing the -veto in the -dominated signal region. To improve the purity of the CR, the minimum is increased from 30 GeV to 50 GeV. The CR is defined by inverting the requirement defined in the 2-SFOS SR. In order to increase the number of events, the , , , and requirements are removed. Table 4 summarises the event selection for the and CRs and the NFs for the background processes, obtained from the fit described in Section 8. The NFs are hereby completely dominated by the CR statistics and their values do not change when only the control regions are used in the fit.
Figures 5(a) and 5(b) show the distributions of in the CR and the invariant mass of the four leptons in the CR, as obtained from the final fit in the statistical analysis (post-fit) described in Section 8.
The background contributions with misidentified leptons are estimated using different techniques. The top-quark background in the channels is normalised using a CR (top-quark CR) defined by requiring at least one -tagged jet. To improve the purity of the top-quark CR, the minimum is increased from 30 GeV to 50 GeV if at least one SFOS pair is present in the event. Processes with one misidentified lepton ( and ) constitute 94 of the top-quark CR, the remaining events contain three prompt leptons from decays. The full selection requirements applied to define the top-quark CR and the measured NF are also summarised in Table 4. Figure 5(c) shows the distribution in the top-quark CR as obtained from the final fit.
A data-driven technique is used to estimate the +jets and contribution in both the and channels and the contributions from and top-quark processes in the channel. These contributions typically have one misidentified lepton (+jets and in the channel, and and in the channel) or two misidentified leptons (+jets and in the channel). A control sample where one or two of the lepton candidates fail to meet the nominal identification or isolation criteria but satisfy looser identification criteria, referred to as anti-identified leptons, is used. The contribution from misidentified leptons in the SR is then obtained by scaling the number of events in the control sample by extrapolation factors measured in a data sample enriched in +jets events. The latter is obtained by selecting events with two prompt leptons from a boson decay and a loosely identified lepton considered to be the misidentified lepton candidate. The extrapolation factors are defined as the ratio of the number of misidentified lepton candidates that pass the nominal identification criteria to the number that pass the anti-identification criteria. In both the control sample and the data samples enriched in +jets events, the contribution from background events not estimated with this method is subtracted using MC expectations. Details of this method can be found in Ref. [67]. The uncertainty in the data-driven background processes described in this section includes the statistical uncertainty in the +jets enriched sample, the uncertainty from +jets MC modelling, and the theory uncertainty from the subtraction of other processes. For the channel, which can have events with two prompt leptons and two misidentified leptons, the uncertainty in the extrapolation from the control sample to the SRs is also included.
7 Systematic uncertainties
The systematic uncertainties can be categorised into those arising from experimental sources and those from theoretical sources. The dominant experimental uncertainties come from the misidentification of leptons (see Section 6), the mismodelling of the impact-parameter significance, the b-tagging efficiency [61] and the jet energy scale and resolution [58]. Other sources of uncertainty are due to the modelling of pile-up, the calibration of the missing transverse momentum measurement [62], and the luminosity measurement. The uncertainty in the combined 2015+2016 integrated luminosity is 2.1%. It is derived from the calibration of the luminosity scale using - beam-separation scans, following a methodology similar to that detailed in Ref. [68], and using the LUCID-2 detector for the baseline luminosity measurements [69].
The impact of the uncertainties on lepton energy (momentum) scale and resolution, and identification and isolation criteria [70, 54, 55] is negligible. The experimental uncertainties are varied in a correlated way across all background processes and all signal- and control-region bins, so that uncertainties in the extrapolation from control to signal regions are correctly propagated. The luminosity uncertainty is only applied to background processes that are normalised to theoretical predictions, and to the Higgs boson signal. The theoretical uncertainties are evaluated by comparing nominal and alternative event generators and UEPS models as described in Section 3 and by varying PDF sets and the QCD renormalisation and factorisation scales. The uncertainty due to the PDF choice for the signal process is while the uncertainty obtained by using Herwig as an alternative parton shower model is , depending on the signal region. All uncertainties are propagated through the full analysis chain and treated as being bin-dependent and region-dependent, i.e. potentially modifying not only the normalisation but also the shape of the BDT output distributions. Whenever the influence on the shape is found to be negligible, as in the case of the PDF and scale variations, only the normalisation uncertainties are used. A list of the systematic uncertainty sources and their impact on the cross-section measurement are shown later in Section 8.
8 Results
A binned likelihood function is constructed as a product of Poisson probability terms over the eleven bins of the different SRs defined in Section 5. The function has two independent scaling parameters: the signal strength parameter , defined as the ratio of the measured signal yield to that predicted by the SM, for each of the and the processes. Additionally, one Poisson probability term is added for each CR to determine simultaneously the normalisation of the corresponding background processes. Systematic uncertainties enter as nuisance parameters in the likelihood function and their correlations are taken into account. The final results are obtained using the profile likelihood method [71]. The resulting post-fit prediction and data yields in the four SRs are shown in Table 5.
Figure 6 shows the post-fit distribution of BDT scores in the -dominated and -depleted SRs. The post-fit event yields in the 1-SFOS and 2-SFOS SRs are shown in Figure 7.
The measured signal strengths for the and production modes in the decay channel are simultaneously determined to be
[TABLE]
compared to the expected results of and . The observed (expected) significances of and production modes are 2.6 (1.3) standard deviations and 2.8 (1.2) standard deviations above the SM background, including other Higgs-boson processes, respectively. When determining the significance for production, the signal-strength parameter is left floating in the fit, and vice versa. The combination of the and channels leads to an observed (expected) significance for the combined production mode of 4.1 (1.9) standard deviations above the SM background, including other Higgs-boson processes. The -value with respect to the value predicted by the SM corresponds to about two standard deviations. The validity of the asymptotic approximation used in deriving these results was tested using pseudo-experiments. The combined signal strength for is measured to be
[TABLE]
with an expected signal strength of .
The cross-section times branching-fraction values, and , are simultaneously determined to be:
[TABLE]
The main contributions to the uncertainties in and are summarised in Table 6. The predicted cross-section times branching-fraction values are pb and pb for and [72], respectively. The 68% and 95% confidence level two-dimensional contours of and are shown in Figure 8. The corresponding one-dimensional results, where the other parameter is left floating in the fit, are consistent with the SM predictions within for and for .
9 Conclusion
Measurements of the inclusive production of a Higgs boson in association with a or boson are presented. Results of the and production cross section times branching fraction for are obtained selecting the leptonic decays and , with , in proton–proton collisions recorded with the ATLAS detector at the LHC in a data sample corresponding to an integrated luminosity of . The products of the branching fraction times the and cross sections are measured to be (stat.)(syst.) pb and (stat.)(syst.) pb, respectively, compatible with the Standard Model predictions of pb for and pb for within up to . The channel with is purely sensitive to the coupling and this measurement is to date the most precise measurement of this channel.
Acknowledgements
We thank CERN for the very successful operation of the LHC, as well as the support staff from our institutions without whom ATLAS could not be operated efficiently.
We acknowledge the support of ANPCyT, Argentina; YerPhI, Armenia; ARC, Australia; BMWFW and FWF, Austria; ANAS, Azerbaijan; SSTC, Belarus; CNPq and FAPESP, Brazil; NSERC, NRC and CFI, Canada; CERN; CONICYT, Chile; CAS, MOST and NSFC, China; COLCIENCIAS, Colombia; MSMT CR, MPO CR and VSC CR, Czech Republic; DNRF and DNSRC, Denmark; IN2P3-CNRS, CEA-DRF/IRFU, France; SRNSFG, Georgia; BMBF, HGF, and MPG, Germany; GSRT, Greece; RGC, Hong Kong SAR, China; ISF and Benoziyo Center, Israel; INFN, Italy; MEXT and JSPS, Japan; CNRST, Morocco; NWO, Netherlands; RCN, Norway; MNiSW and NCN, Poland; FCT, Portugal; MNE/IFA, Romania; MES of Russia and NRC KI, Russian Federation; JINR; MESTD, Serbia; MSSR, Slovakia; ARRS and MIZŠ, Slovenia; DST/NRF, South Africa; MINECO, Spain; SRC and Wallenberg Foundation, Sweden; SERI, SNSF and Cantons of Bern and Geneva, Switzerland; MOST, Taiwan; TAEK, Turkey; STFC, United Kingdom; DOE and NSF, United States of America. In addition, individual groups and members have received support from BCKDF, CANARIE, CRC and Compute Canada, Canada; COST, ERC, ERDF, Horizon 2020, and Marie Skłodowska-Curie Actions, European Union; Investissements d’ Avenir Labex and Idex, ANR, France; DFG and AvH Foundation, Germany; Herakleitos, Thales and Aristeia programmes co-financed by EU-ESF and the Greek NSRF, Greece; BSF-NSF and GIF, Israel; CERCA Programme Generalitat de Catalunya, Spain; The Royal Society and Leverhulme Trust, United Kingdom.
The crucial computing support from all WLCG partners is acknowledged gratefully, in particular from CERN, the ATLAS Tier-1 facilities at TRIUMF (Canada), NDGF (Denmark, Norway, Sweden), CC-IN2P3 (France), KIT/GridKA (Germany), INFN-CNAF (Italy), NL-T1 (Netherlands), PIC (Spain), ASGC (Taiwan), RAL (UK) and BNL (USA), the Tier-2 facilities worldwide and large non-WLCG resource providers. Major contributors of computing resources are listed in Ref. [73].
The reference list from the paper itself. Each links out to its DOI / PubMed record.
- 1[1] ATLAS Collaboration “Study of ( W / Z ) H 𝑊 𝑍 𝐻 (W/Z)H production and Higgs boson couplings using H → W W ∗ → 𝐻 𝑊 superscript 𝑊 ∗ H\rightarrow WW^{\ast} decays with the ATLAS detector” In JHEP 08 , 2015, pp. 137 DOI: 10.1007/JHEP 08(2015)137 · doi ↗
- 2[2] CMS Collaboration “Measurement of Higgs boson production and properties in the W W 𝑊 𝑊 WW decay channel with leptonic final states” In JHEP 01 , 2014, pp. 096 DOI: 10.1007/JHEP 01(2014)096 · doi ↗
- 3[3] CMS Collaboration “Measurements of properties of the Higgs boson decaying to a W 𝑊 W boson pair in p p 𝑝 𝑝 pp collisions at s = 13 Te V 𝑠 13 Te V \sqrt{s}=13\,\text{Te V} ” In Phys. Lett. B 791 , 2019, pp. 96 DOI: 10.1016/j.physletb.2018.12.073 · doi ↗
- 4[4] ATLAS Collaboration “Measurements of Higgs boson properties in the diphoton decay channel with 36 fb − 1 36 superscript fb 1 36\,\text{fb}^{-1} of p p 𝑝 𝑝 pp collision data at s = 13 Te V 𝑠 13 Te V \sqrt{s}=13\,\text{Te V} with the ATLAS detector” In Phys. Rev. D 98 , 2018, pp. 052005 DOI: 10.1103/Phys Rev D.98.052005 · doi ↗
- 5[5] ATLAS Collaboration “Measurement of the Higgs boson coupling properties in the H → Z Z ∗ → 4 ℓ → 𝐻 𝑍 superscript 𝑍 → 4 ℓ H\rightarrow ZZ^{*}\rightarrow 4\ell decay channel at s = 13 Te V 𝑠 13 Te V \sqrt{s}=13\,\text{Te V} with the ATLAS detector” In JHEP 03 , 2018, pp. 095 DOI: 10.1007/JHEP 03(2018)095 · doi ↗
- 6[6] ATLAS Collaboration “Observation of H → b b ¯ → 𝐻 𝑏 ¯ 𝑏 H\rightarrow b\bar{b} decays and V H 𝑉 𝐻 VH production with the ATLAS detector” In Phys. Lett. B 786 , 2018, pp. 59 DOI: 10.1016/j.physletb.2018.09.013 · doi ↗
- 7[7] ATLAS Collaboration “Search for the Decay of the Higgs Boson to Charm Quarks with the ATLAS Experiment” In Phys. Rev. Lett. 120 , 2018, pp. 211802 DOI: 10.1103/Phys Rev Lett.120.211802 · doi ↗
- 8[8] CMS Collaboration “Observation of Higgs Boson Decay to Bottom Quarks” In Phys. Rev. Lett. 121 , 2018, pp. 121801 DOI: 10.1103/Phys Rev Lett.121.121801 · doi ↗