readPTU: a Python Library to Analyse Time Tagged Time Resolved Data
Guillem Ballesteros, Raphael Proux, Cristian Bonato, Brian D. Gerardot

TL;DR
readPTU is a Python library that enables detailed analysis of time-tagged photon data, supporting various algorithms for time-resolved and autocorrelation analysis with high performance and extensibility.
Contribution
The paper introduces readPTU, a flexible, efficient Python package for analyzing time-correlated single-photon counting data, with support for multiple algorithms and easy extensibility.
Findings
Demonstrated analysis of quantum dot fluorescence autocorrelation
Showed performance benefits of different algorithms
Validated the library's flexibility for various data types
Abstract
readPTU is a python package designed to analyze time-correlated single-photon counting data. The use of the library promotes the storage of the complete time arrival information of the photons and full flexibility in post-processing data for analysis. The library supports the computation of time resolved signal with external triggers and second order autocorrelation function analysis can be performed using multiple algorithms that provide the user with different trade-offs with regards to speed and accuracy. Additionally, a thresholding algorithm to perform time post-selection is also available. The library has been designed with performance and extensibility in mind to allow future users to implement support for additional file extensions and algorithms without having to deal with low level details. We demonstrate the performance of readPTU by analyzing the second-order autocorrelation…
Click any figure to enlarge with its caption.
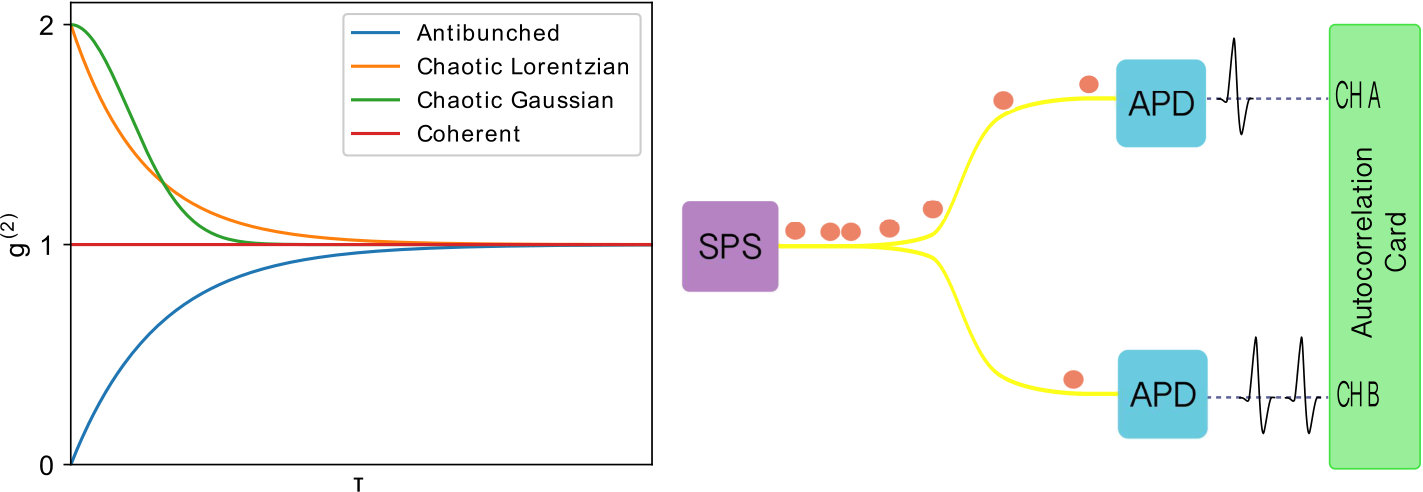 Figure 1
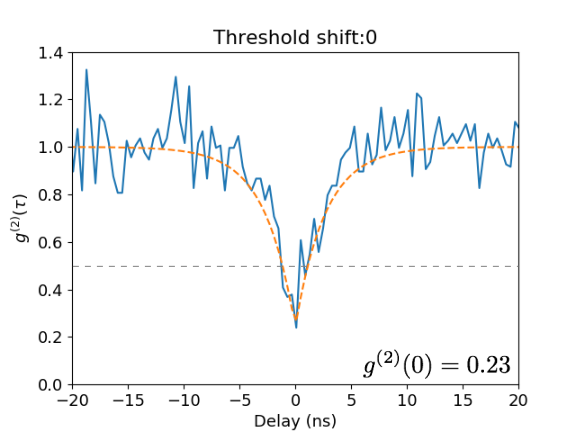 Figure 2
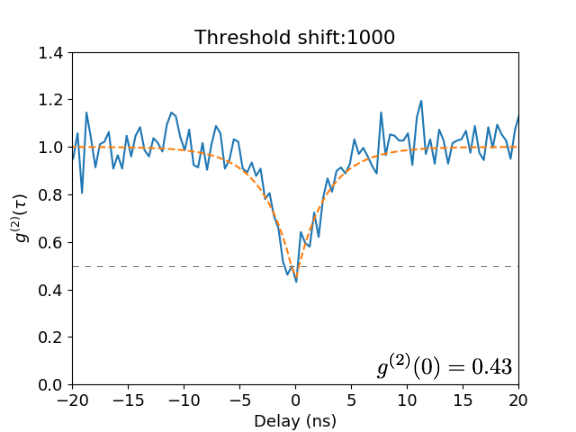 Figure 3
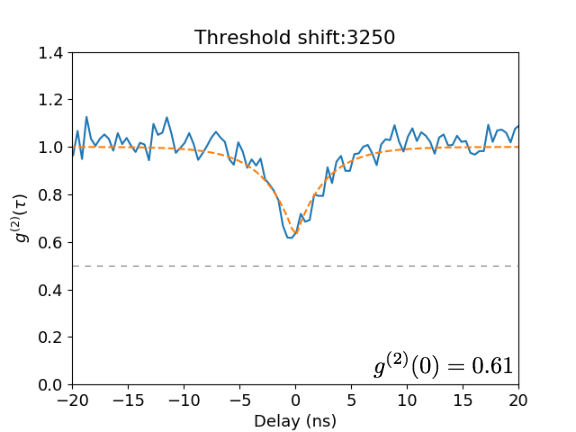 Figure 4
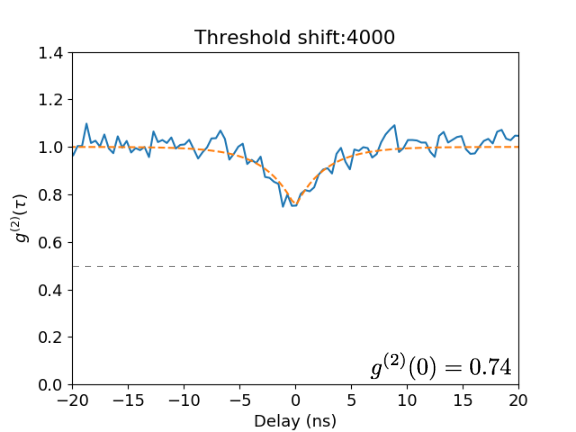 Figure 5
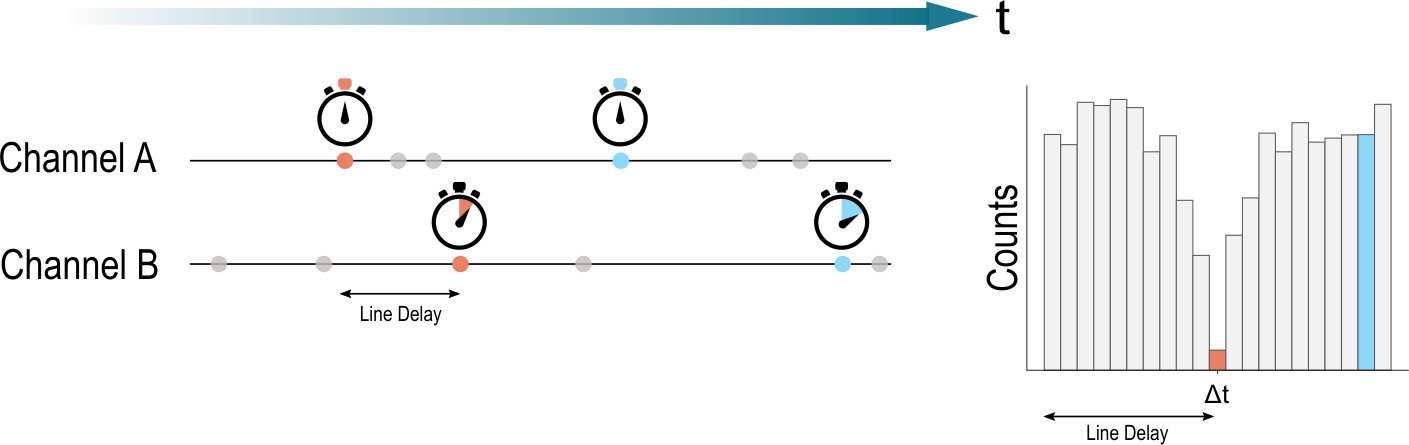 Figure 6
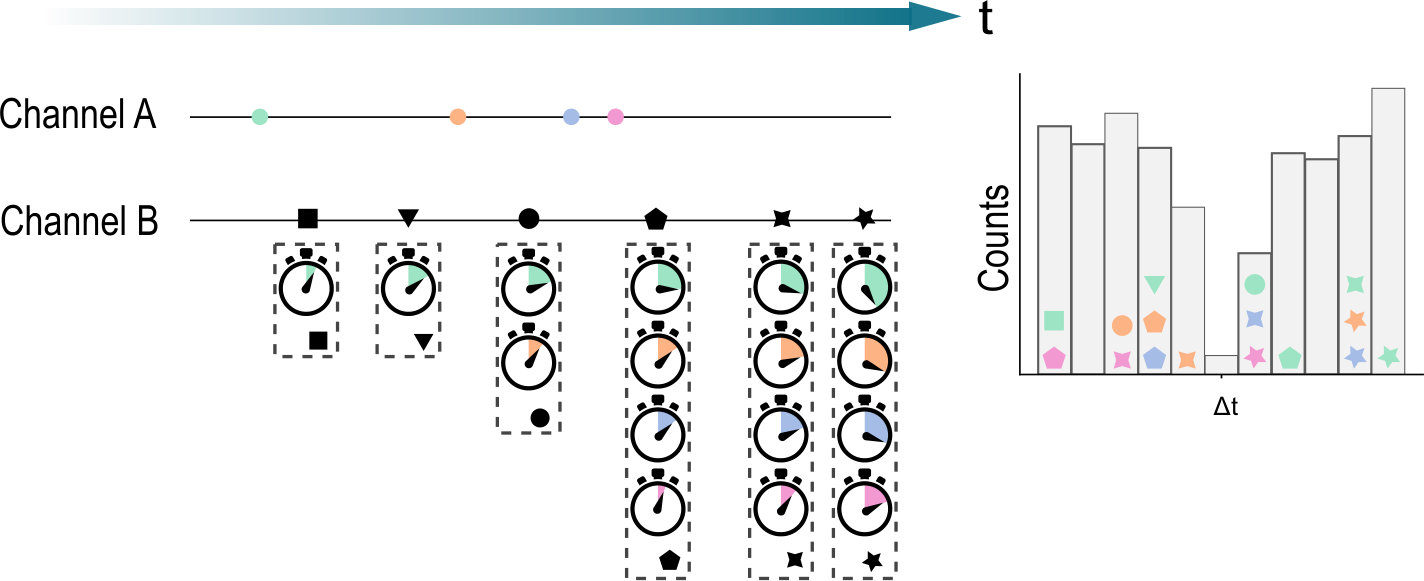 Figure 7
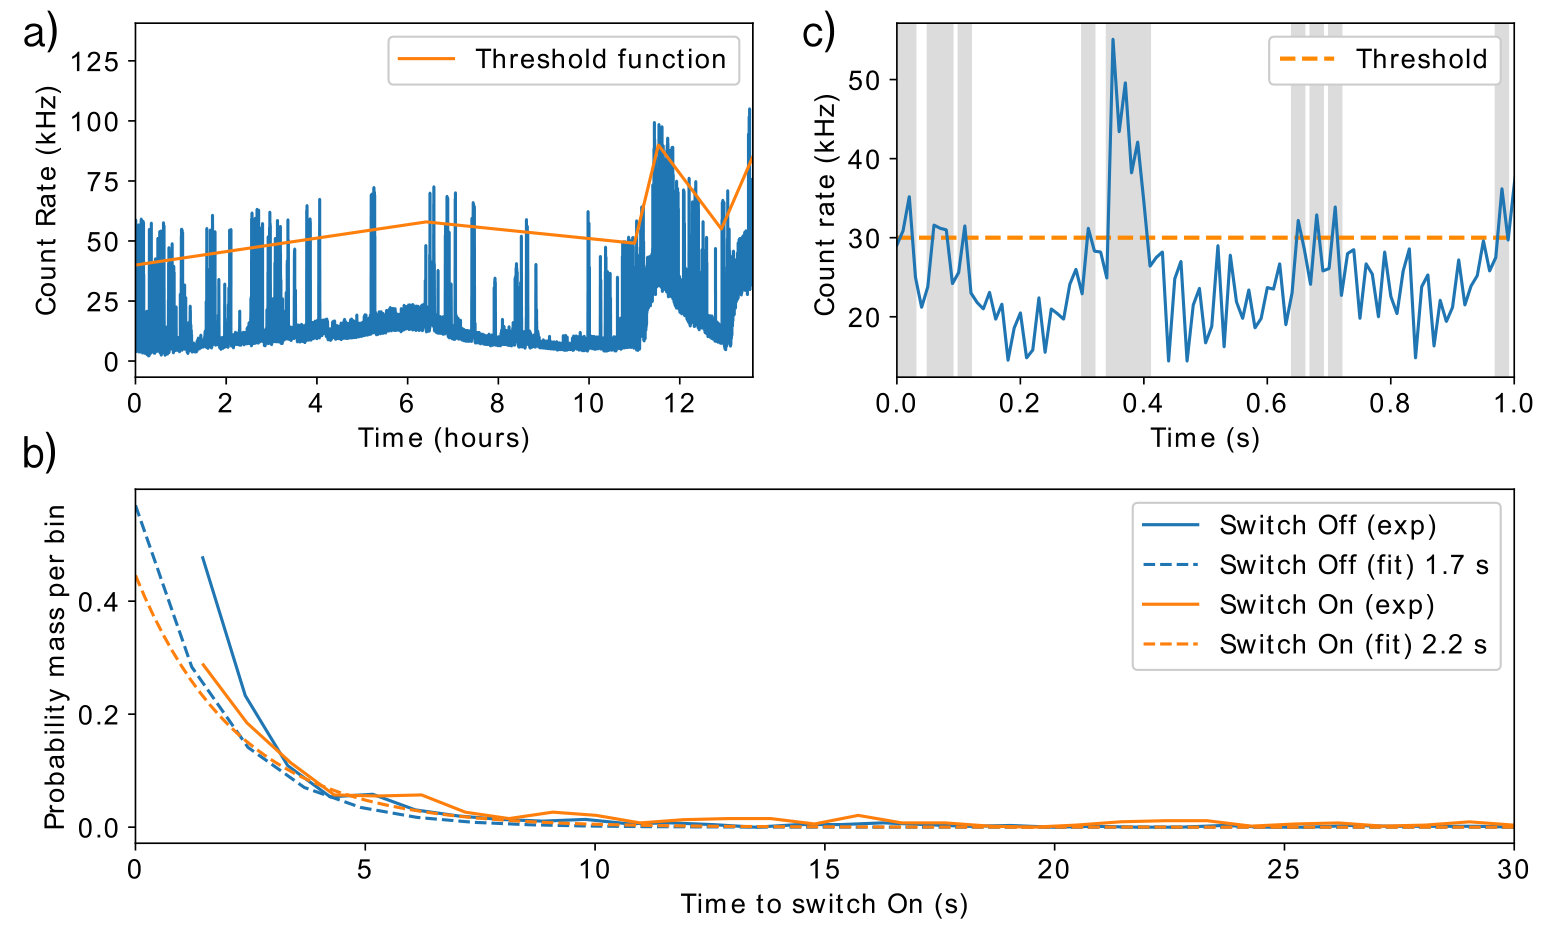 Figure 8
Peer Reviews
No public reviews on file for this paper yet. If you reviewed it on a platform where reviews are public (OpenReview, ICLR, NeurIPS, ICML), you can paste yours below so the community can read it here.
Videos
No videos yet. Explain this paper in a talk, walkthrough, or lecture? Add one.
readPTU: a Python Library to Analyse Time Tagged Time Resolved Data
G. C. Ballesteros
R. Proux
C. Bonator
B. D. Gerardot
Institute of Photonics and Quantum Sciences (IPaQS), Heriot-Watt University, Edinburgh, EH14 4AS, UK http://qpl.eps.hw.ac.uk/
Abstract
readPTU is a python package designed to analyze time-correlated single-photon counting data. The use of the library promotes the storage of the complete time arrival information of the photons and full flexibility in post-processing data for analysis. The library supports the computation of time resolved signal with external triggers and second order autocorrelation function analysis can be performed using multiple algorithms that provide the user with different trade-offs with regards to speed and accuracy. Additionally, a thresholding algorithm to perform time post-selection is also available. The library has been designed with performance and extensibility in mind to allow future users to implement support for additional file extensions and algorithms without having to deal with low level details. We demonstrate the performance of readPTU by analyzing the second-order autocorrelation function of the resonance fluorescence from a single quantum dot in a two-dimensional semiconductor.
I Motivation and significance
Time-correlated single-photon counting (TCSPC) experiments have found widespread applications in different disciplines, including the characterization of individual optical emitters lounis2000single ; PhysRevLett.116.020401 , advanced microscopy niehorster2016multi ; pian2017compressive , Bell’s inequalities verification using astronomical sources PhysRevLett.118.060401 , or the real time tracking of physiochemical reactions suhling2005time . This technique is also a major tool for the characterization of single photon emission PhysRevLett.116.020401 ; dada2016indistinguishable ; PhysRevLett.113.113602 , relevant for quantum technologies such as linear optics quantum computing ladd2010quantum and spin-photon interfaces for quantum communication networks gao2012observation ; togan_quantum_2010 . TCSPC measurements can be used to characterize the statistical properties of the emitted light fox2006quantum and it is thus a tool to prove the single-photon nature of a source and provide useful information about its internal dynamics.
When recording TCSPC data, one usually only directly computes the quantities of interest, such as a histogram of the delays between photon clicks at two channels, since storing the timing information for all detector clicks can easily grow above gigabyte sizes. On the other hand, storing this information can be advantageous to perform more sophisticated data analysis. For example, time traces of the detected detector click rates can reveal intensity spikes and the emitters’ dynamics, or enable post selection of specific time intervals. The readPTU111The repository for the readPTU is hosted at: https://github.com/qpl-public/readPTU library presented here enables the researcher to achieve this, providing added flexibility in their experiments.
The library has been written as a Python module that interfaces with a C library that handles the most computing-intensive aspects. This combination provides a user-friendly interface to a high performance set of underlying routines. The underlying C library provides functionalities to efficiently read a stream of detector click records, with no required knowledge about the low level details of how the information is encoded on the binary files, making the library of algorithms easy to extend.
Our hope is that the work presented here will allow researchers across a variety of disciplines to analyze raw TCSPC data more efficiently.
II Autocorrelation measurements using TCSPC
One of the main applications of TCSPC is the characterization of the statistical properties of a light source, such as the anti-bunched nature of single photon sources, through the second order autocorrelation of the field. The right panel of Fig. 1 shows a simplified setup of such an experiment. The emitted photon field is split by a 50/50 beam splitter and directed to two single photon detectors, such as avalanche photo diodes (APS) or super conducting nanowire single photon detectors (SNSPD). Upon photon detection, detector clicks are recorded by channels A and B of time-Correlated single photon counting system (TCSPC). Since a single photon source cannot produce a click on both channels simultaneously, a dip is observed in the coincidence rate when the delay between the channels is equal (Fig. 1, left panel). This result is only possible under the assumption that the electromagnetic field is quantized fox2006quantum . These results can be extended to the n-th order correlation functions and provide a full characterization of the coherence properties of an electromagnetic field.
In this section we will introduce the basic theory behind the second order autocorrelation function and how it can be experimentally measured using TCSPC. To compute the second order autocorrelation function, , we need to consider first what is the probability amplitude for measuring a photon with a delay of in detector B after a having measured one in detector . This is given by glauber1963coherence :
[TABLE]
where is the photon annihilation operator and and are the initial and final states respectively. Similarly we can define the probability of detecting two photons in different detectors . We will show in Sect. II.1 how considering all final states and averaging over the ensemble of initial states leads to the definition of the second order autocorrelation function :
[TABLE]
In the latter expressions we have fixed under the assumption that we are dealing with a stationary process, in that the value of the autocorrelation function will only depend on time differences.
II.1 From photon statistics to
We show now how building a histogram of time delays between photons in channel A and channel B of the TCSPC system gives us access to the second order autocorrelation function of a stream of photons. Put another way, this histogram gives an approximation to the joint probability distribution of measuring a photon in the first detector in between times and on the second detector proux:tel-01278553 . The probability per unit time to obtain the final state after the detection of a photon at in channel A and at in channel B from the initial state is proportional to:
[TABLE]
If we sum over all possible final states and introduce the density operator () to consider the mixture of initial states we conclude that:
[TABLE]
II.2 Algorithms
readPTU provides multiple algorithms to postprocess TCSPC data, each featuring different trade-offs.
II.3 Intensity time trace
The first algorithm provided by readPTU enables user to obtain a time-trace of the photon count. Its pseudo-code is shown in Alg. 1. The algorithm goes through the recorded photon events and assigns them to the current time bin as long as its time-tag falls within it. Once the time tag is larger than the end time of the current time bin, CurrBin is updated and the next time bin starts to be filled. The length of each time bin sets the trade-off between time resolution and the error in the photon count due to Poissonian statistics. The intensity time-trace can be used to study emitter dynamics as will be demonstrated in Sect. III.
II.4 Algorithms
II.4.1 Naive Algorithm
The derivation in section II.1 shows how can be approximated by a histogram of the delays between photon clicks in channels A and B of the autocorrelation card. The simplest implementation of this idea is described in Fig. 2 and Algorithm 2.
When a photon is detected in channel A, a stopwatch is started. When, after a time delay a second photon is recorded at channel B, is assigned to the histogram in the call to UpdateHistogram and the process repeated. The UpdateHistogram function additionally checks if the measured delay is within a user defined interval (the autocorrelation window) that establishes the longest delay that will be stored in the output histogram.
An artificial delay between the two channels is typically added to shift from the origin, so that can be see when running the autocorrelator in histogram mode. Reversing start and stop channels brings the autocorrelation out of the histogram: readPTU library has an operation mode that removes this issue by running an algorithm symmetric on the assignment of start and stop channels. Although this algorithm is extremely fast and good enough for quickly exploring the data it has two major shortcomings. First, the time delay between two consecutive photons follows an exponential distribution. Since the algorithm described above only looks at consecutive pairs, an exponential decay artifact is introduced. Second, photons in channel A are ignored while waiting for a click in channel B, wasting available information (see the photons greyed out in Fig. 2).
II.4.2 Ring Algorithm
The ring algorithm presented here (pseudo-code in Algorithm 3) fixes both shortcomings highlighted in the previous section in a numerically efficient way. Click times for channel A are stored in a buffer. Whenever detector B clicks, the algorithm loops over the click times stored in the buffer and generates a list of time delays, which are then stored in the histogram. Each time a photon clikcs at channel A, if the buffer is full, the oldest photon click is replaced for the newly detected, hence the ring (buffer) name. Even though this greatly mitigates the exponential artifacts shown by the naive algorithm, a situation may occur where a time delay is larger than the correlation window. This situation is corrected by keeping track of the longest seen delay on a loop over the start photon buffer. If a delay bigger than the correlation window is encountered the buffer is doubled in size.
II.5 readPTU
readPTU is distributed as a Python library with a compiled C component, running under Windows, MacOS and Linux. Its main goal is to provide a user-friendly interface via Python to users wanting to postprocess multi-gigabyte files of TCSPC data. It currently supports calculation of intensity time traces and autocorrelations (with/without post-selection).
The main C file acts as a template for (currently) 3 dynamically linked libraries. Each of the libraries provides support for a different input file format. Currently T2 mode files for the HydrapHarp, TimeHarp, PicoHarp and HydraHarp2 devices from PicoQuant are supported. Instructions on how to add new files formats is explained in the package documentation. Each file format requires a parser to be defined in parsers.c. Through using different libraries, the overhead from dynamically selecting (via function pointers or switch statements) what specific file format parser to use is completely removed, while keeping a single codebase and an easily extensible system for future file formats. The whole library has been designed to primarily target performance: to this end, buffered input and output is used by reading multiple records from the TCSPC files simultaneously. This optimization reduces by three orders of magnitude the number of file read operations required to process the input. Memory locality was taken into account by substituting the use of linked lists for contiguous memory arrays. Additionally, all the functions provided by the library offer multithread support to take advantage of modern multi-core CPUs. The parallelization strategy is based on analyzing different ranges of records in the TCSPC files separately and the combining the results together. This means that there are no shared variables among the different threads and the algorithms don’t require the use of synchronization primitives. Detector click times are time-ordered in the buffers used by Alg. 3; this allows one to introduce a check to break out of the histogram updating loop as soon as a time delay longer than the one that can fit in the histogram is detected.
II.5.1 Sample usage
readPTU is designed to be as user-friendly as possible. The code listing below presents an example of how to use the library to obtain a timetrace and compute the from TCSPC data.
Files are opened within With block to make sure that the file is appropriately closed when no longer needed. The timetrace function has only one mandatory argument, the size of the time bins over which the clicks are averaged to compute the intensity trace. Smaller bins provide a greater time resolution at the expense of less accuracy due to the stochastic nature of the emission and detection process. Additionally, one can specify which autocorrelator channel should be used to build the time trace if the user wants to separate the counts from the different channels. Options are available to limit the range of records. Finally, the computation of the time trace can be parallelized by specifying the number of threads to be used.
The computation of the second order autocorrelation is available via the calculate_g2 function. In this case, the only mandatory argument is the length of the correlation window. The optional arguments allow the user to specify the time resolution of the histogram. The default value in this case is to split the histogram into 1024 bins if a time in seconds is not specified. The argument post_selec_ranges takes a list of pairs of values with start and stop records. Only clicks belonging to records within one of those ranges are used to compute . As discussed above, this option allows users, for example, to exclude time ranges where they suspect photons likely only correspond to laser background. readPTU provides the function construct_postselect_vector to automatically generate ranges based on a hard threshold. The script used to analyze and produce the plots in Fig. 5 is available on the code repository together with instructions on how to extend the library to manipulate other file formats.
III Example: resonance fluorescence of a quantum emitter with spectral fluctuations
One application of the functionalities offered by readPTU is to study the dynamics of single photon emitters. For solid-state emitters, fluctuations in the surrounding environment result in randoms shifts of the absorption/emission wavelength PhysRevLett.108.107401 . When exciting narrow absorption lines with a narrowband lasers, these random shift bring the emitter in and out of resonance with the laser, resulting in intermittent optical emission santana2017generating ; Kumar:16 . When the emitter is not resonant with the laser, only background light is collected, degrading the Signal to Background Ratio (SBR), an important parameter for antibunching experiments. In resonance fluorescence, the background laser can be filtered by polarization from the signal kuhlmann2013dark , but it remains challenging to completely remove it. This problem can be solved by post-selecting such that only the photons detected in time intervals when the emitter was resonant with the laser, i.e. when the emission rate is above a given threshold, contribute to the measurement.
Here we show how readPTU can be used to analyze TCSPC data from a single photon emitter in an atomically-thin monolayer of WSe2 Kumar:16 , at cryogenic temperature. The emitters were addressed by resonance fluorescence in a confocal microscope. The laser linewidth is 10 kHz, while the emitter (typical linewidth MHz) wavelength fluctuates on 10 GHz scale. While the timescales of the spectral fluctuations vary, they are relatively slow with dynamics longer than a second which can be easily post-selected for.
First, we extract an intensity timetrace. To this end, the user only has to specify the size of time bin over which the number of photons will be averaged, optionally the channel number. The timetrace helps us identify problems during the experiment, such as drifts of the experimental setup or blinking, as can be observed in Fig. 4. When the emitter goes out of resonance, the count number falls drastically to the level of the background produced by the uncancelled excitation laser. It can also be observed how the background laser cancellation fidelity drifts throughout the experiment. We use this information to design a piece-wise linear post-selection thresholding function adapted to our data.
Once a threshold has been established, we can look at the distribution of the duration of periods for which the emitter has been in/out of resonance. This shows that the emitter was above threshold for just 0.5% of the duration of the experiment, due to the presence of charge traps that perturb the emitter’s electrical environment. The dynamics of the short lived charge trap states are shown in Fig. 4. As expected the distribution of time intervals for which the emitter is in the on (off) state follow approximately an exponential distribution with a mean lifetime of 1.75 s (2.24 s).
Since only laser light is detected most of the time, the mininmum achieavable is limited by the SBR averaged over the whole duration of the experiment, which is much smaller than the peak SBR. By post-selecting with the threshold function shown in Fig. 4, the minimum is improved from 0.74 to 0.23 which demonstrates that the observed system is really a single emitter, since fox2006quantum .
IV Conclusions
Here we present the implementation of multiple algorithms to compute the second order autocorrelation function from TCSPC data. Lifetime measurements can also be performed by choosing the appropiate parameters. The use of raw TCSPC data allows us to perform time post-selection of the data based on the intensity. This can be used to significantly improve experimental results in the resence of emitter blinking or spectral fluctuations Kumar:16 . Thanks to the focus on performance and extensibility multi-GB files can be analyzed in a few seconds and new algorithms can be implemented without having to worry about low levels details. More importantly, we have found that keeping raw TCSPC data has helped us improve our experimental setups and data analysis routines and having a library capable of efficiently analyzing it has promoted that it is always stored.
V Funding Information
This work has been supported by the Engineering and Physical Sciences Research Council (EPSRC) under the grants: EP/I023186/1, EP/L015110/1, EP/S000550/1 and by the European Research Counil (ERC) under grant number 725920. B.D.G. thanks the Royal Society for a Wolfson Merit Award and the Royal Academy of Engineering for a chair in Emergent Technologies.
The reference list from the paper itself. Each links out to its DOI / PubMed record.
- 1(1) Brahim Lounis and William E Moerner. Single photons on demand from a single molecule at room temperature. Nature , 407(6803):491, 2000.
- 2(2) Xing Ding, Yu He, Z.-C. Duan, Niels Gregersen, M.-C. Chen, S. Unsleber, S. Maier, Christian Schneider, Martin Kamp, Sven Höfling, Chao-Yang Lu, and Jian-Wei Pan. On-demand single photons with high extraction efficiency and near-unity indistinguishability from a resonantly driven quantum dot in a micropillar. Phys. Rev. Lett. , 116:020401, Jan 2016.
- 3(3) Thomas Niehörster, Anna Löschberger, Ingo Gregor, Benedikt Krämer, Hans-Jürgen Rahn, Matthias Patting, Felix Koberling, Jörg Enderlein, and Markus Sauer. Multi-target spectrally resolved fluorescence lifetime imaging microscopy. Nature Methods , 13(3):257, 2016.
- 4(4) Qi Pian, Ruoyang Yao, Nattawut Sinsuebphon, and Xavier Intes. Compressive hyperspectral time-resolved wide-field fluorescence lifetime imaging. Nature Photonics , 11(7):411, 2017.
- 5(5) Johannes Handsteiner, Andrew S. Friedman, Dominik Rauch, Jason Gallicchio, Bo Liu, Hannes Hosp, Johannes Kofler, David Bricher, Matthias Fink, Calvin Leung, Anthony Mark, Hien T. Nguyen, Isabella Sanders, Fabian Steinlechner, Rupert Ursin, Sören Wengerowsky, Alan H. Guth, David I. Kaiser, Thomas Scheidl, and Anton Zeilinger. Cosmic bell test: Measurement settings from milky way stars. Phys. Rev. Lett. , 118:060401, Feb 2017.
- 6(6) Klaus Suhling, Paul MW French, and David Phillips. Time-resolved fluorescence microscopy. Photochemical & Photobiological Sciences , 4(1):13–22, 2005.
- 7(7) Adetunmise C Dada, Ted S Santana, Ralph NE Malein, Antonios Koutroumanis, Yong Ma, Joanna M Zajac, Ju Y Lim, Jin D Song, and Brian D Gerardot. Indistinguishable single photons with flexible electronic triggering. Optica , 3(5):493–498, 2016.
- 8(8) A. Sipahigil, K. D. Jahnke, L. J. Rogers, T. Teraji, J. Isoya, A. S. Zibrov, F. Jelezko, and M. D. Lukin. Indistinguishable photons from separated silicon-vacancy centers in diamond. Phys. Rev. Lett. , 113:113602, Sep 2014.