Evidence of interacting elongated filaments in the star-forming site AFGL 5142
Lokesh K. Dewangan, Devendra K. Ojha, Tapas Baug, R. Devaraj

TL;DR
This study reveals interacting elongated filaments in AFGL 5142, showing how their collision likely triggers star formation, supported by multi-wavelength observations and YSO distribution analysis.
Contribution
It provides new evidence of filament interaction and collision as a mechanism for star formation in AFGL 5142, using comprehensive multi-wavelength data.
Findings
Identification of a massive inverted Y-like structure with overlapping filaments.
Detection of two intertwined cloud components in velocity space.
Correlation between filament interaction zones and high YSO density.
Abstract
To probe the ongoing physical mechanism, we studied a wide-scale environment around AFGL 5142 (area ~25 pc x 20 pc) using a multi-wavelength approach. The Herschel column density (N(H_2)) map reveals a massive inverted Y-like structure (mass ~6280 M_sun), which hosts a pair of elongated filaments (lengths >10 pc). The Herschel temperature map depicts the filaments in a temperature range of ~12.5-13.5 K. These elongated filaments overlap each other at several places, where N(H_2) > 4.5 x 10^{21}cm^{-2}. The 12CO and 13CO line data also show two elongated cloud components (around -1.5 and -4.5 km/s) toward the inverted Y-like structure, which are connected in the velocity space. First moment maps of CO confirm the presence of two intertwined filamentary clouds along the line of sight. These results explain the morphology of the inverted Y-like structure through a combination of two…
Click any figure to enlarge with its caption.
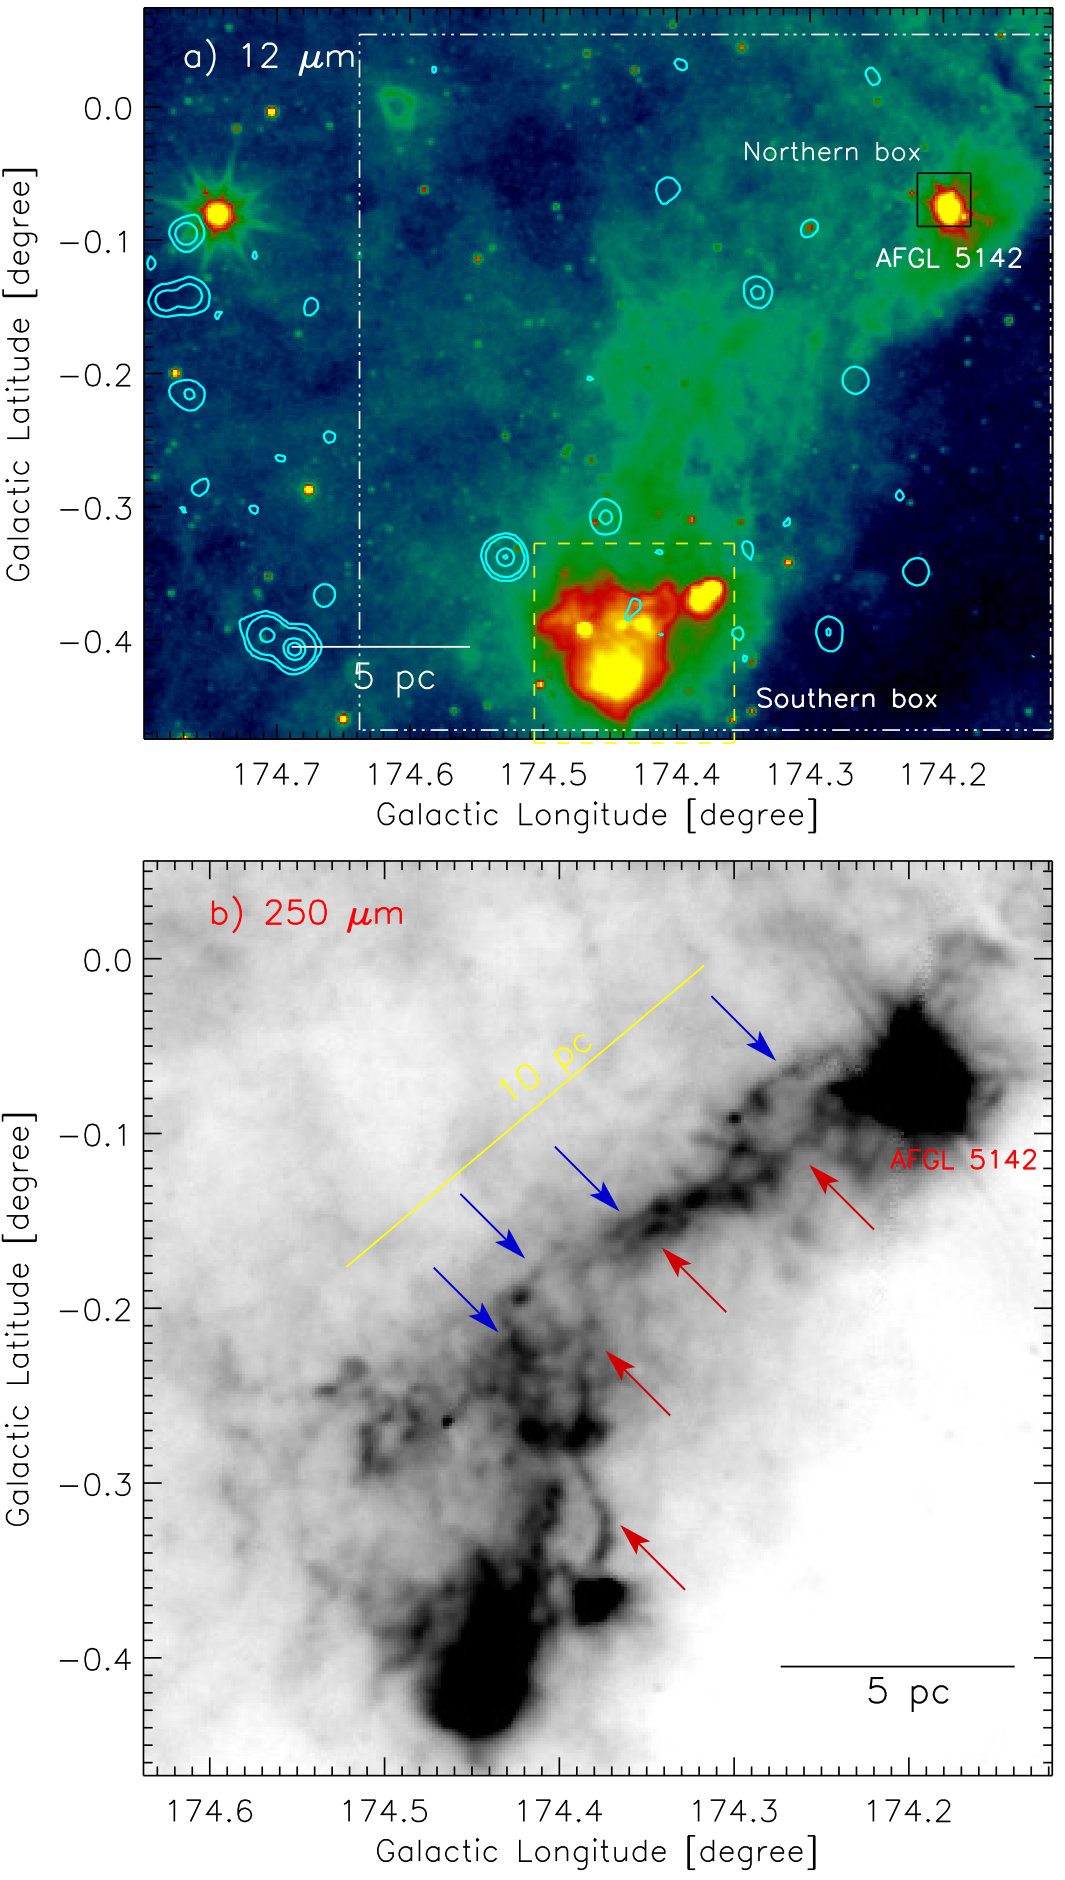 Figure 1
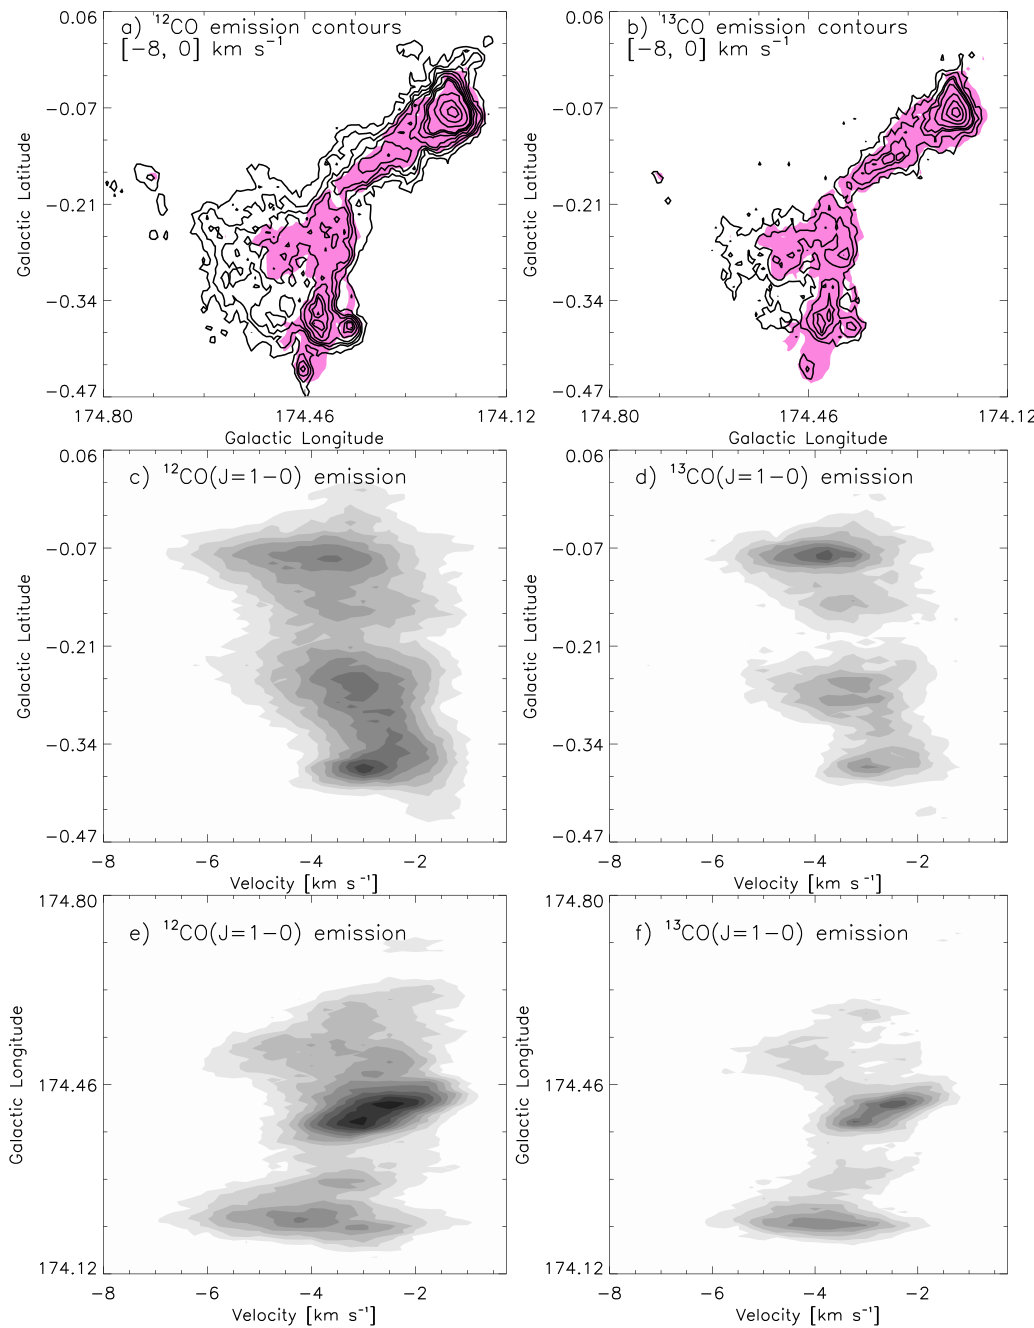 Figure 2
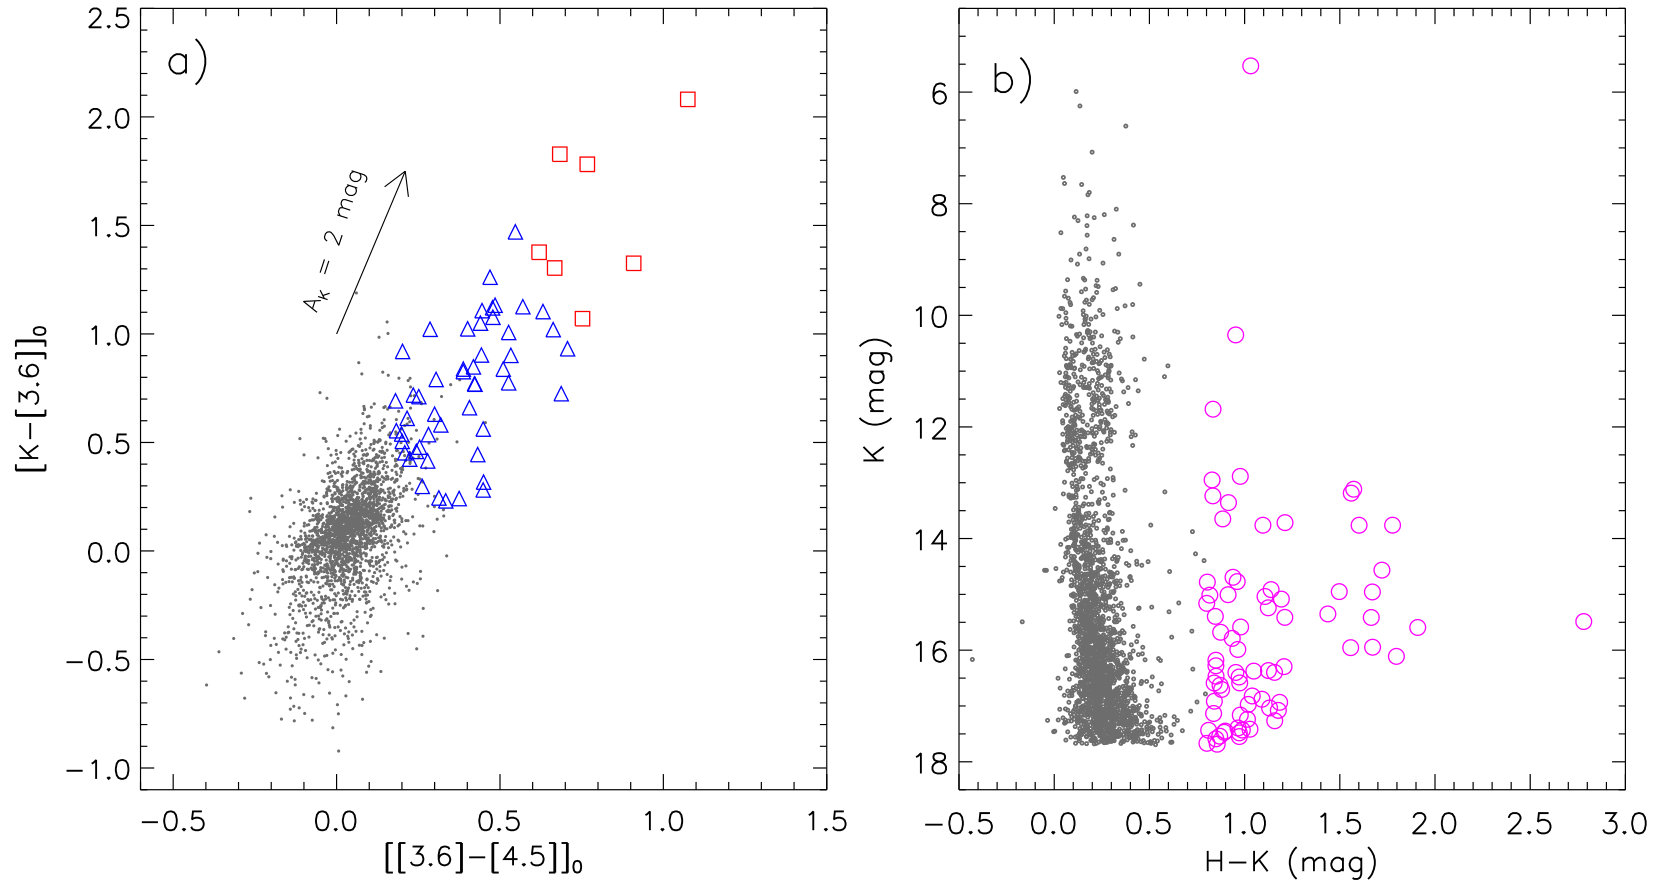 Figure 3
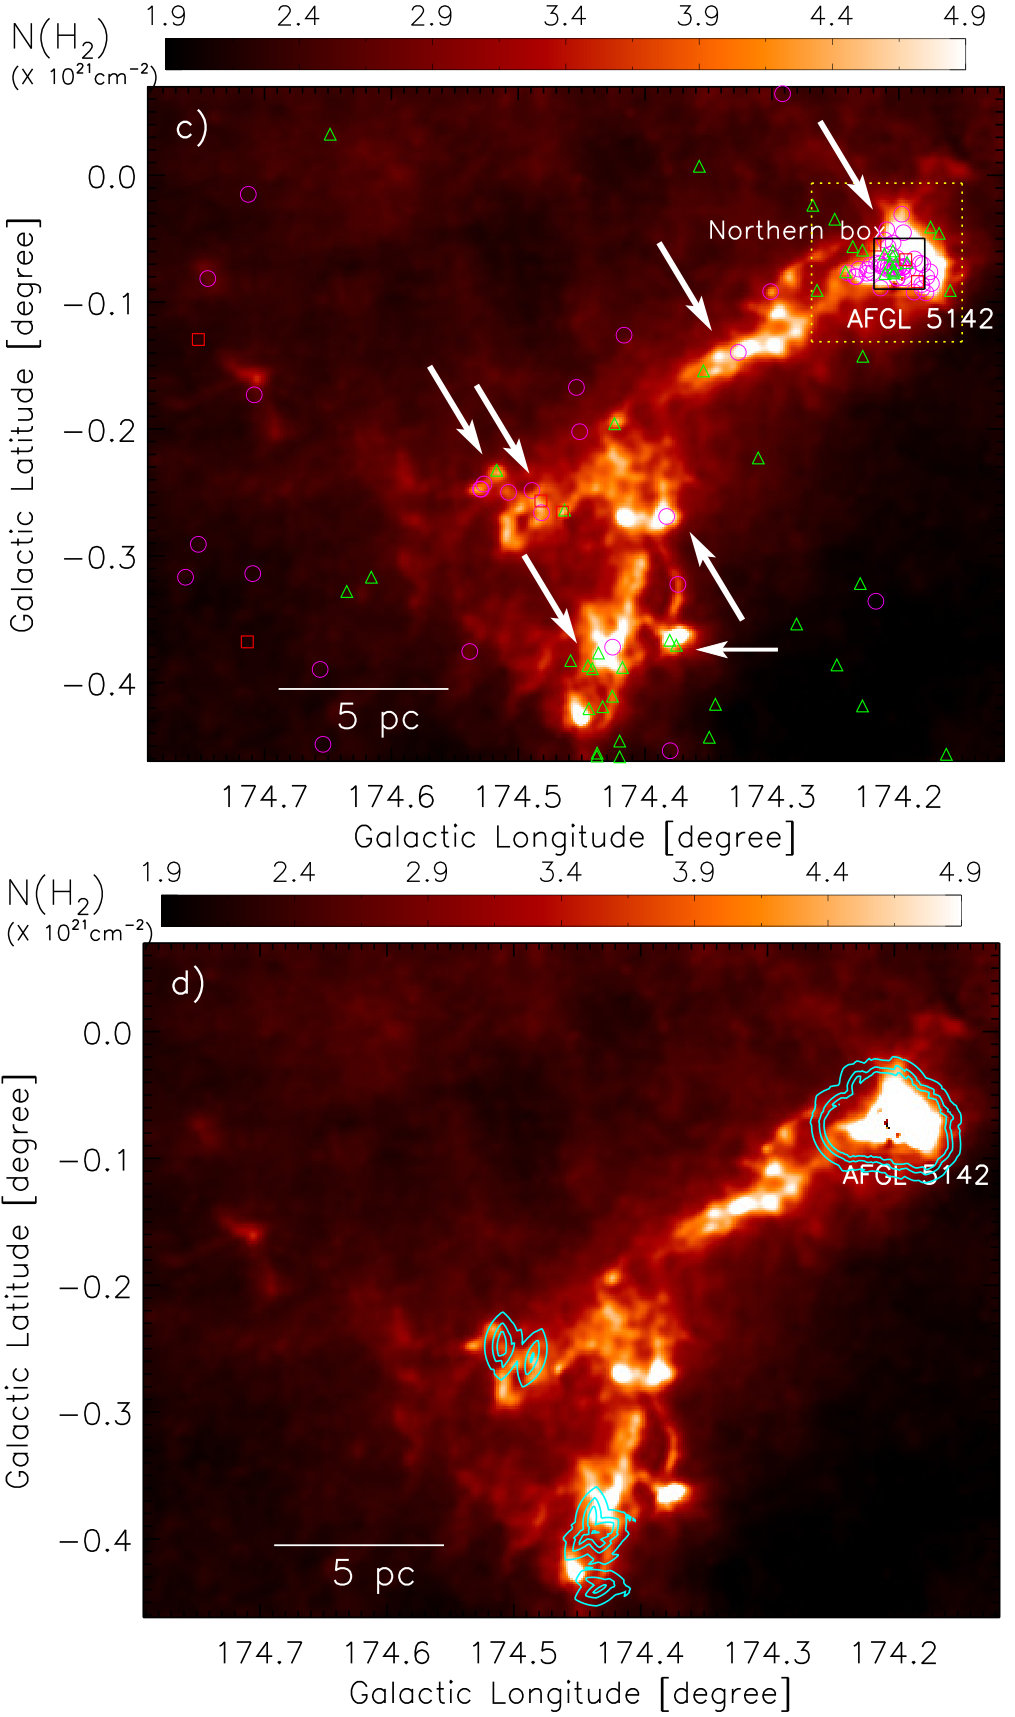 Figure 4
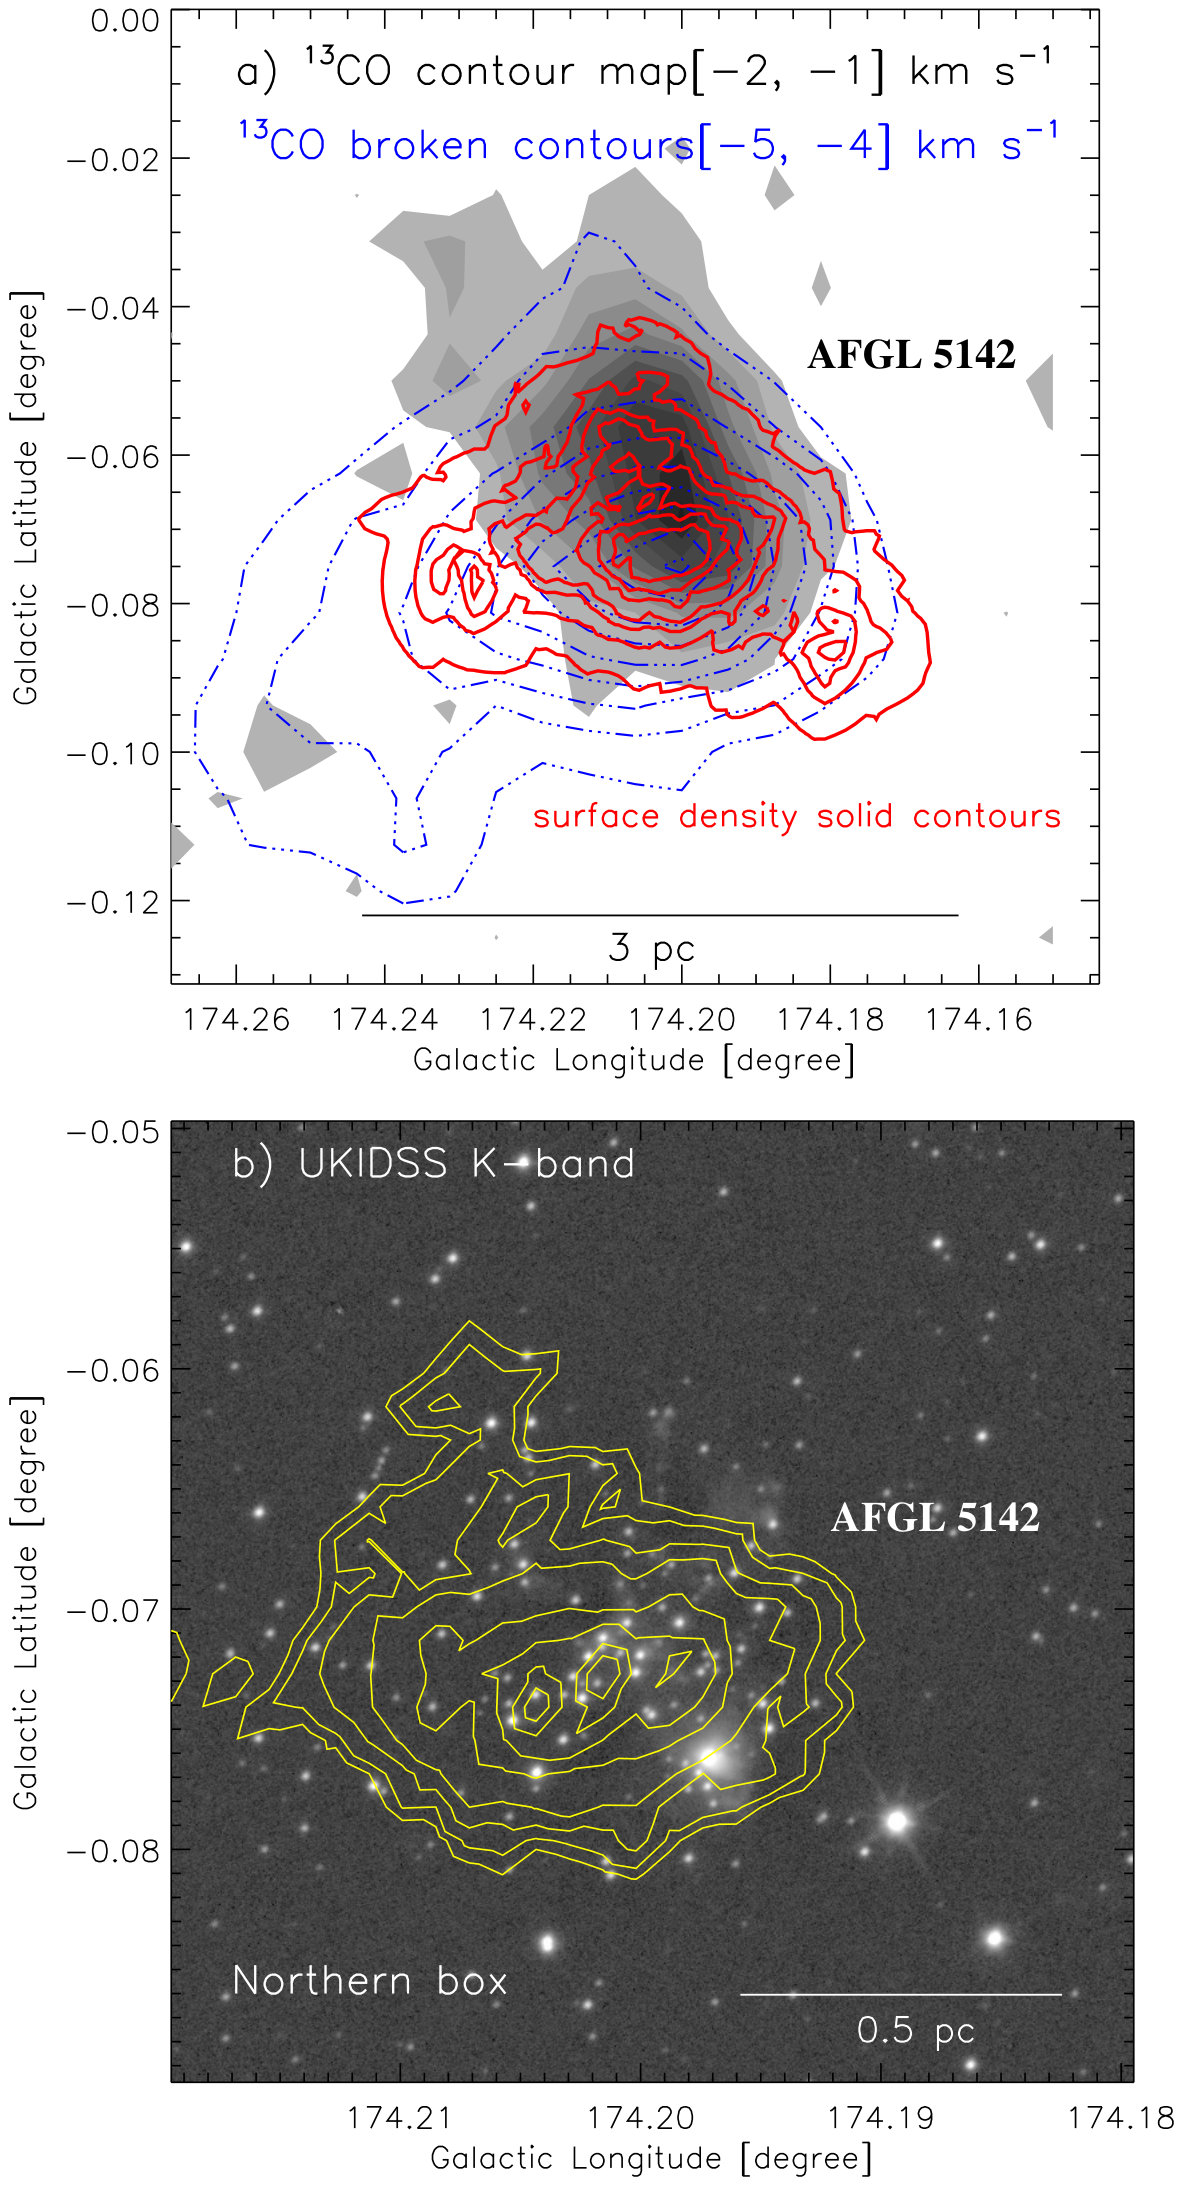 Figure 5
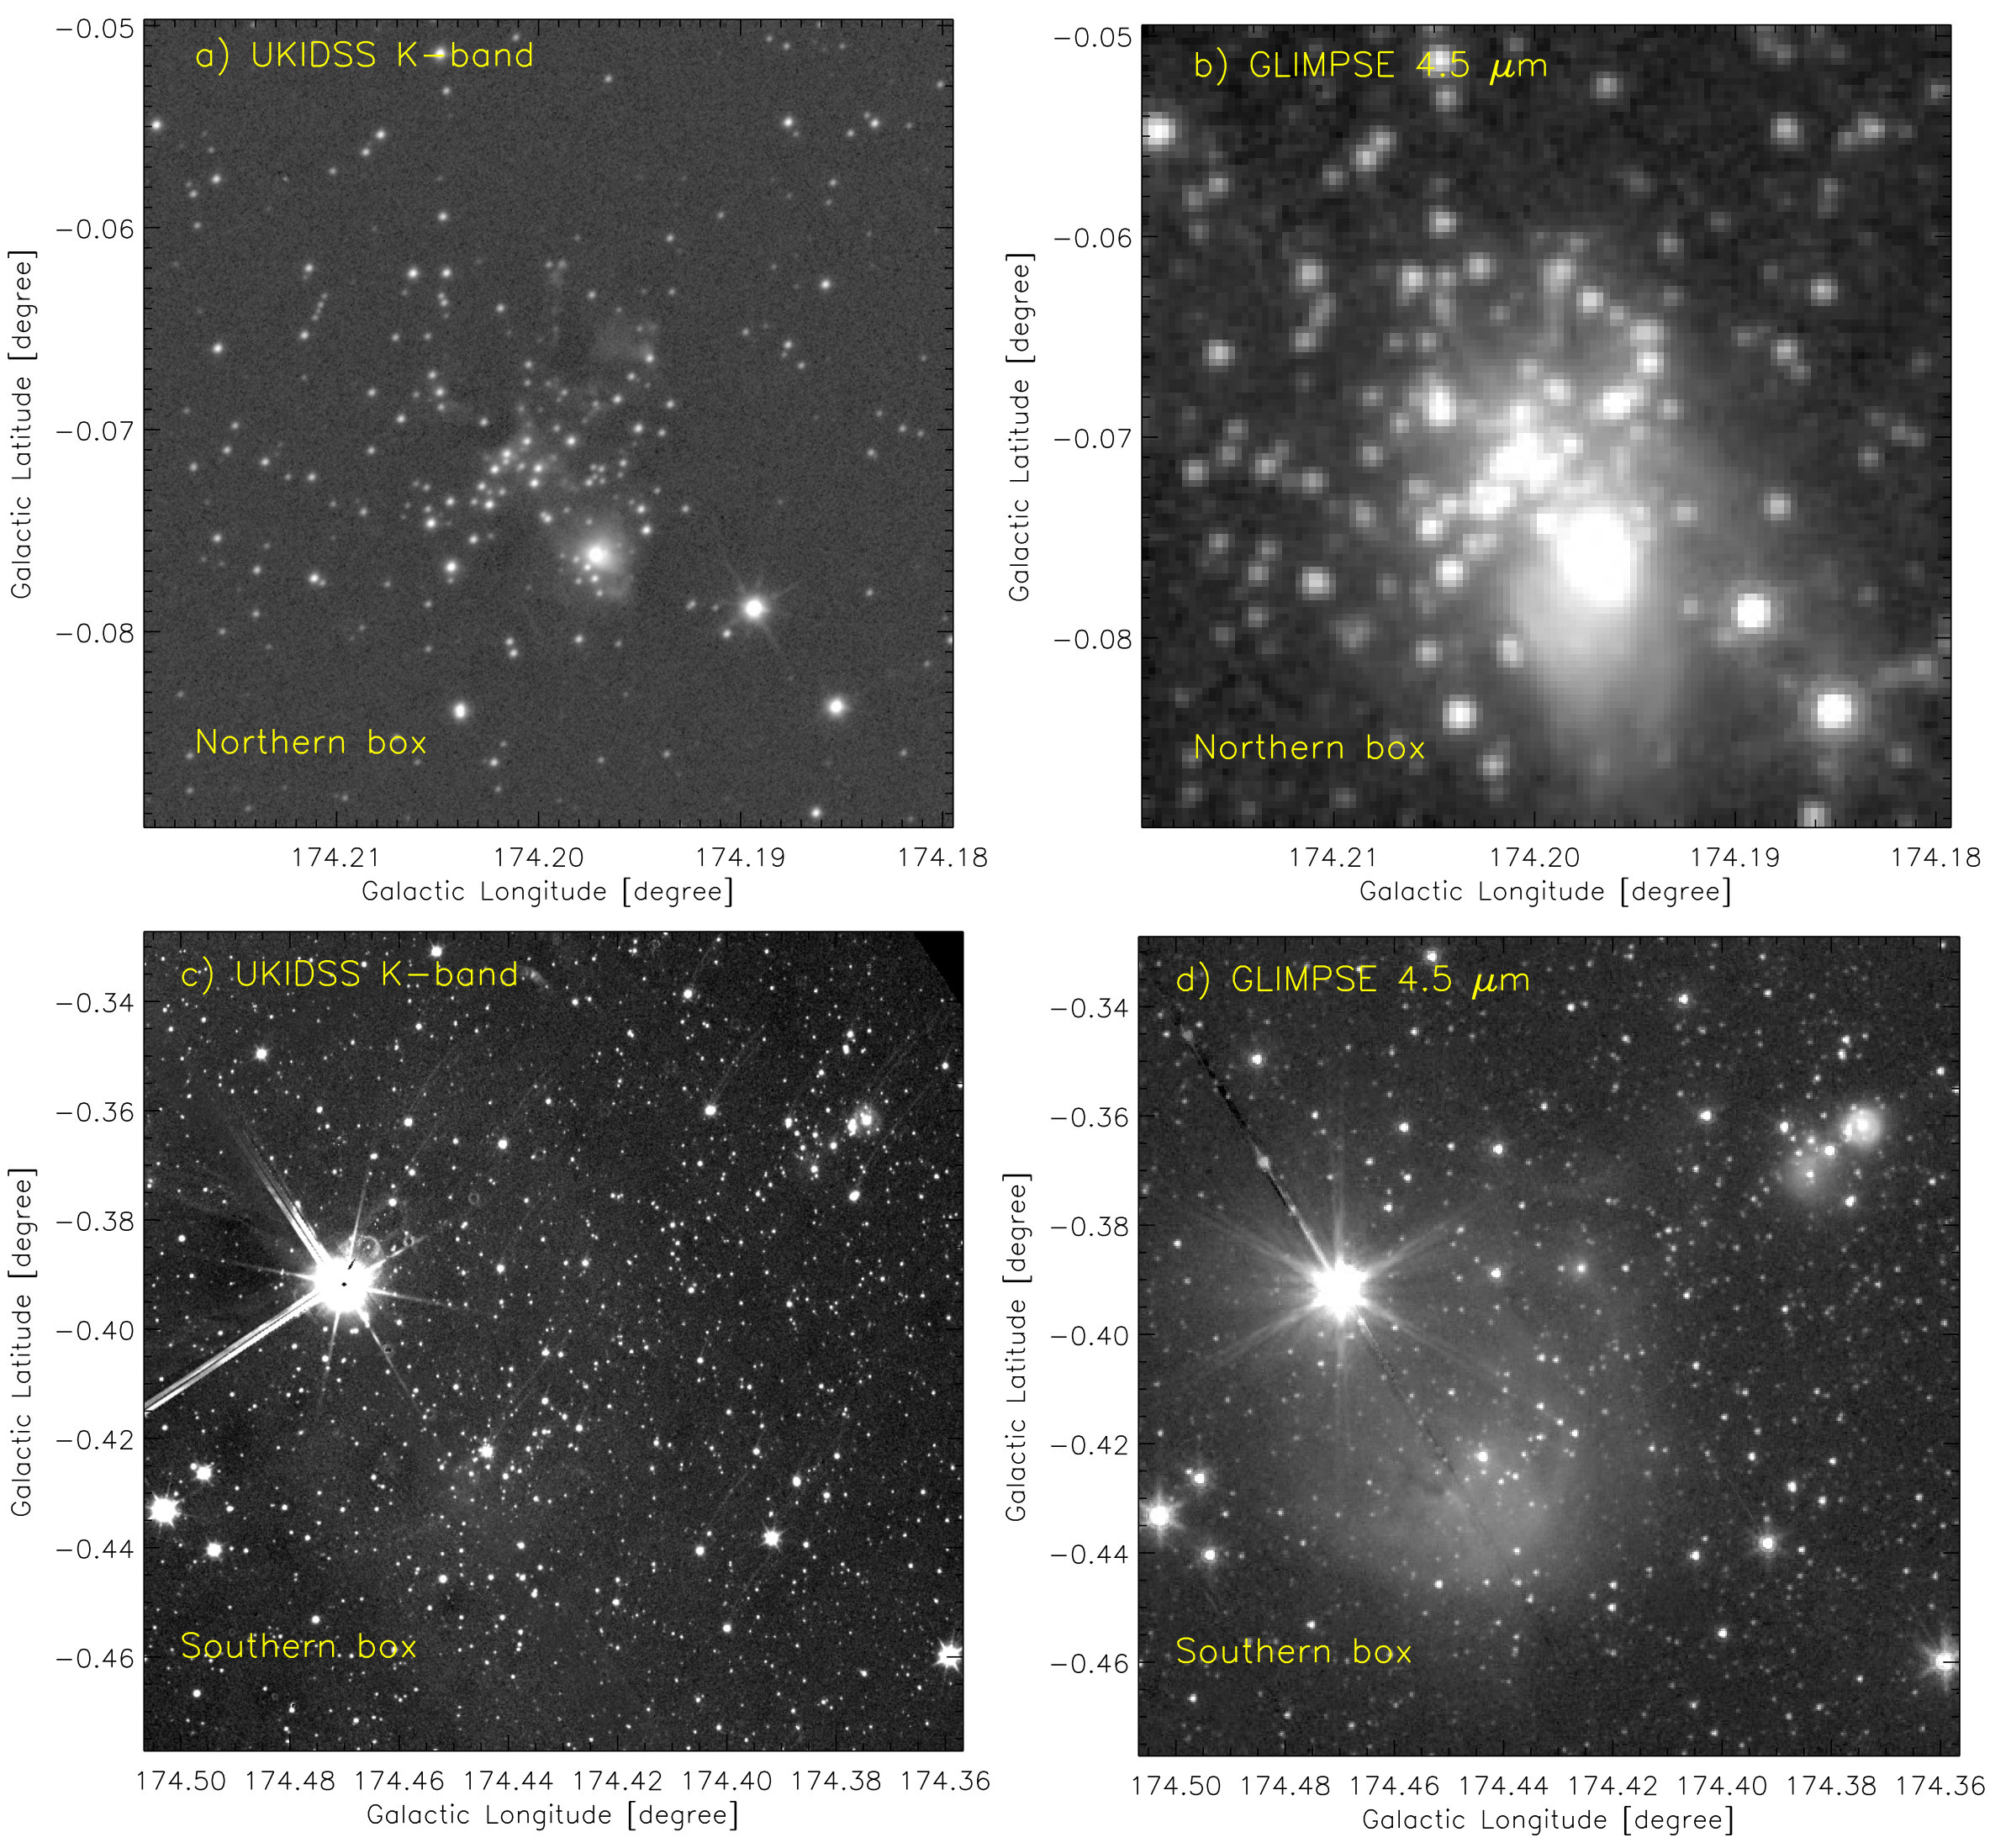 Figure 6
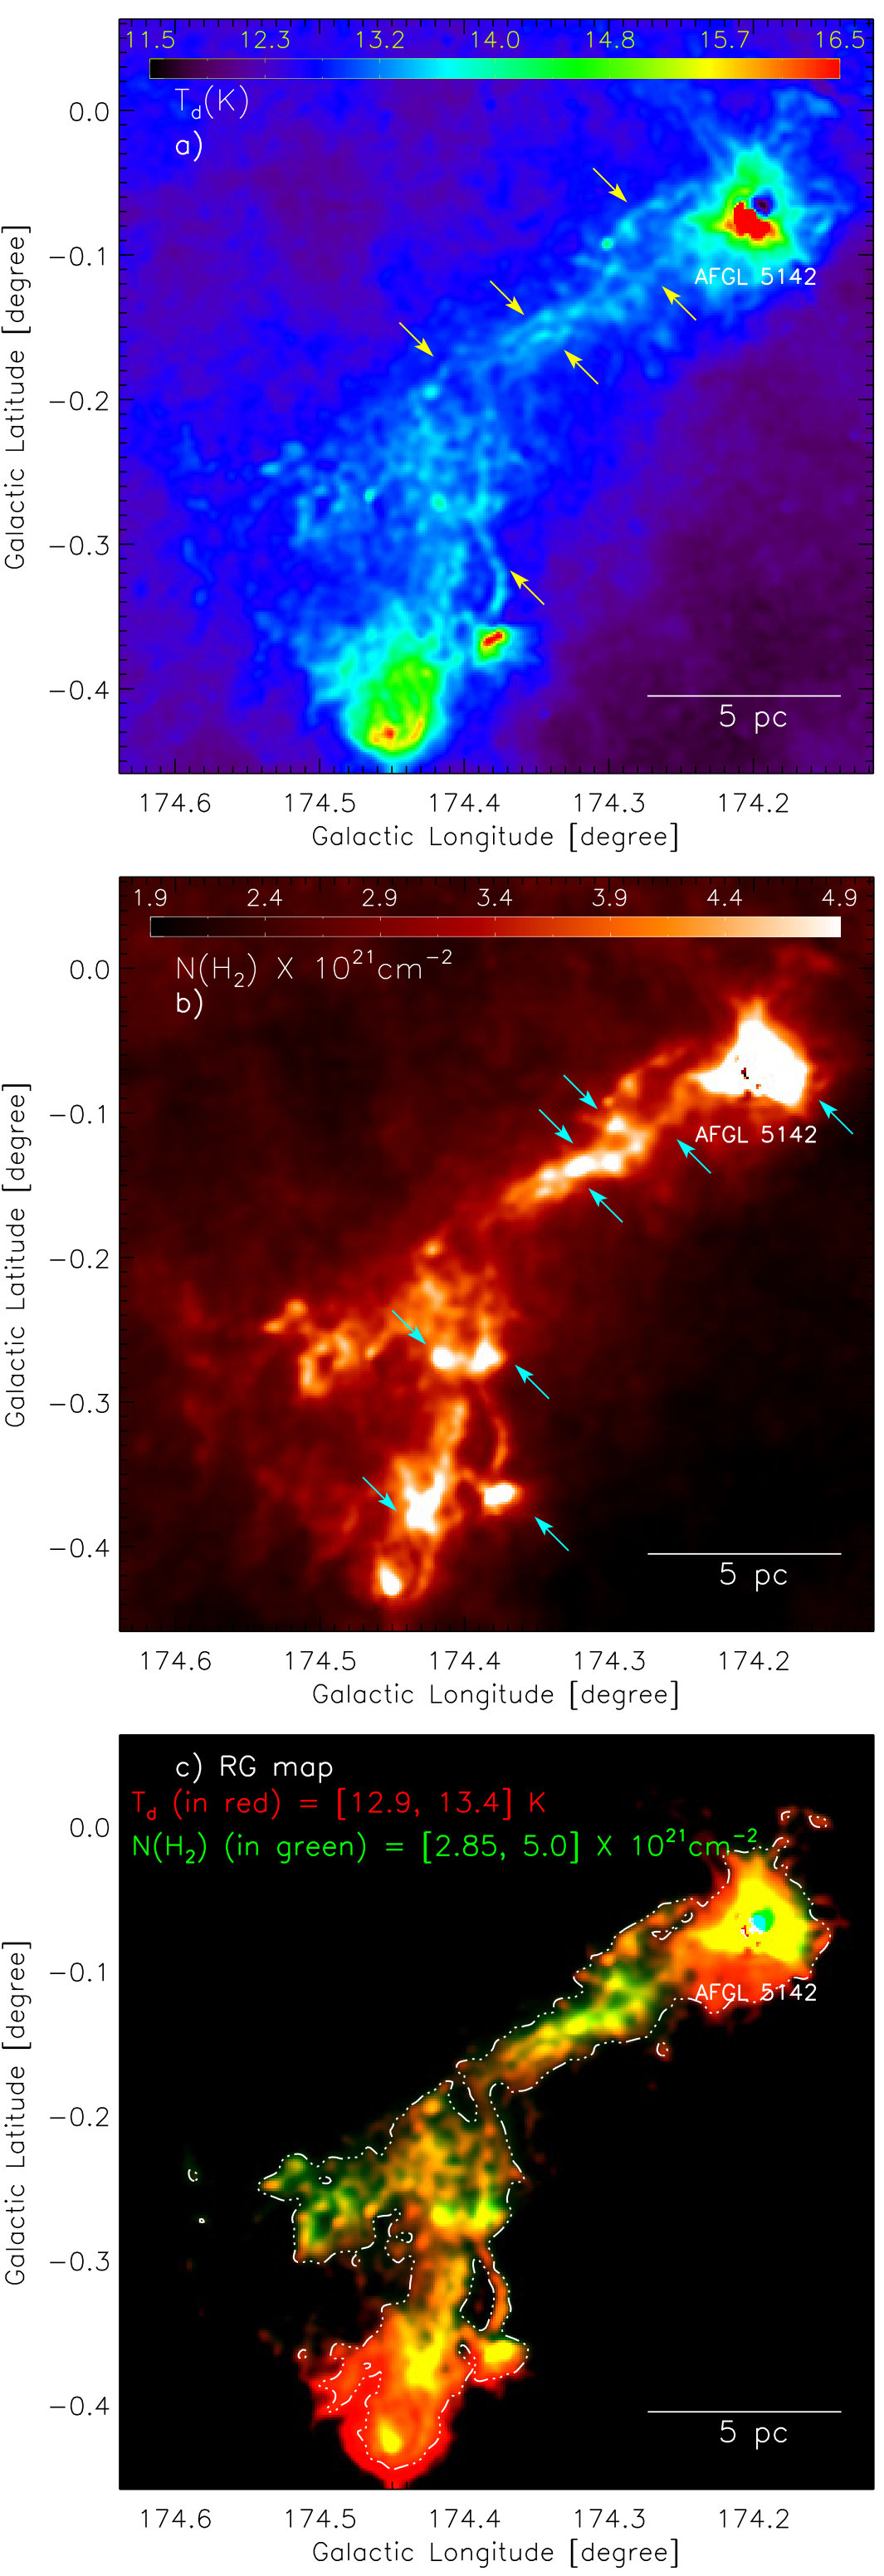 Figure 7
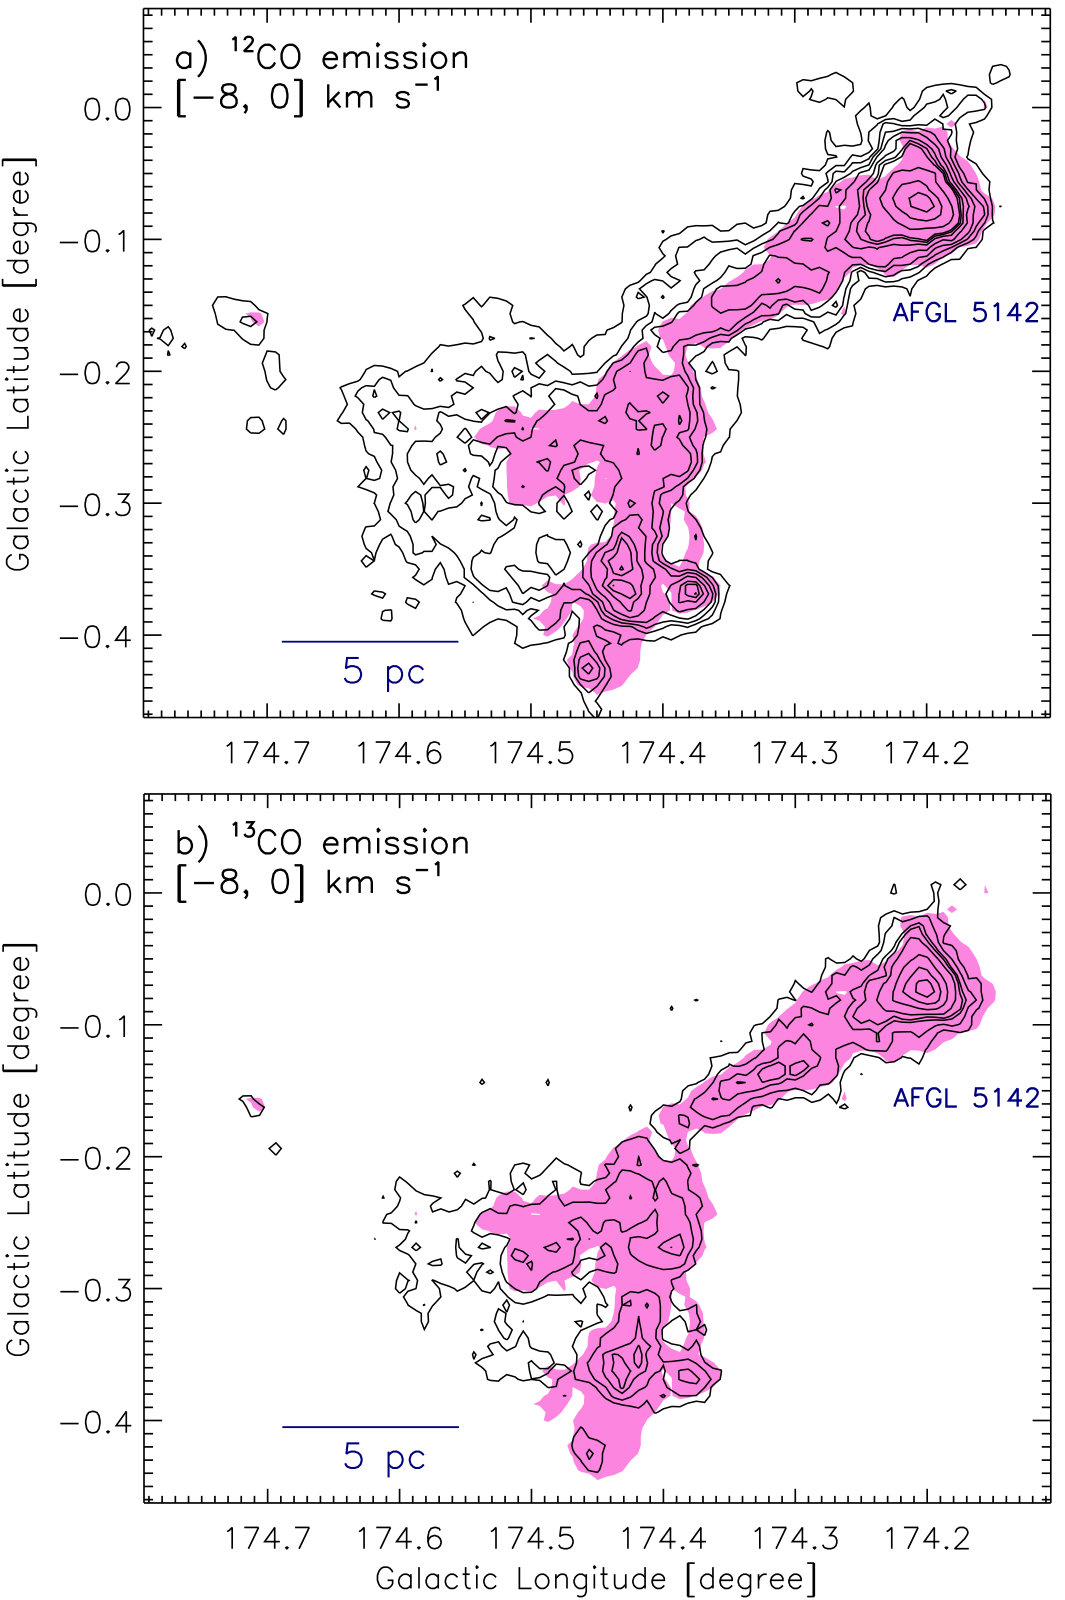 Figure 8
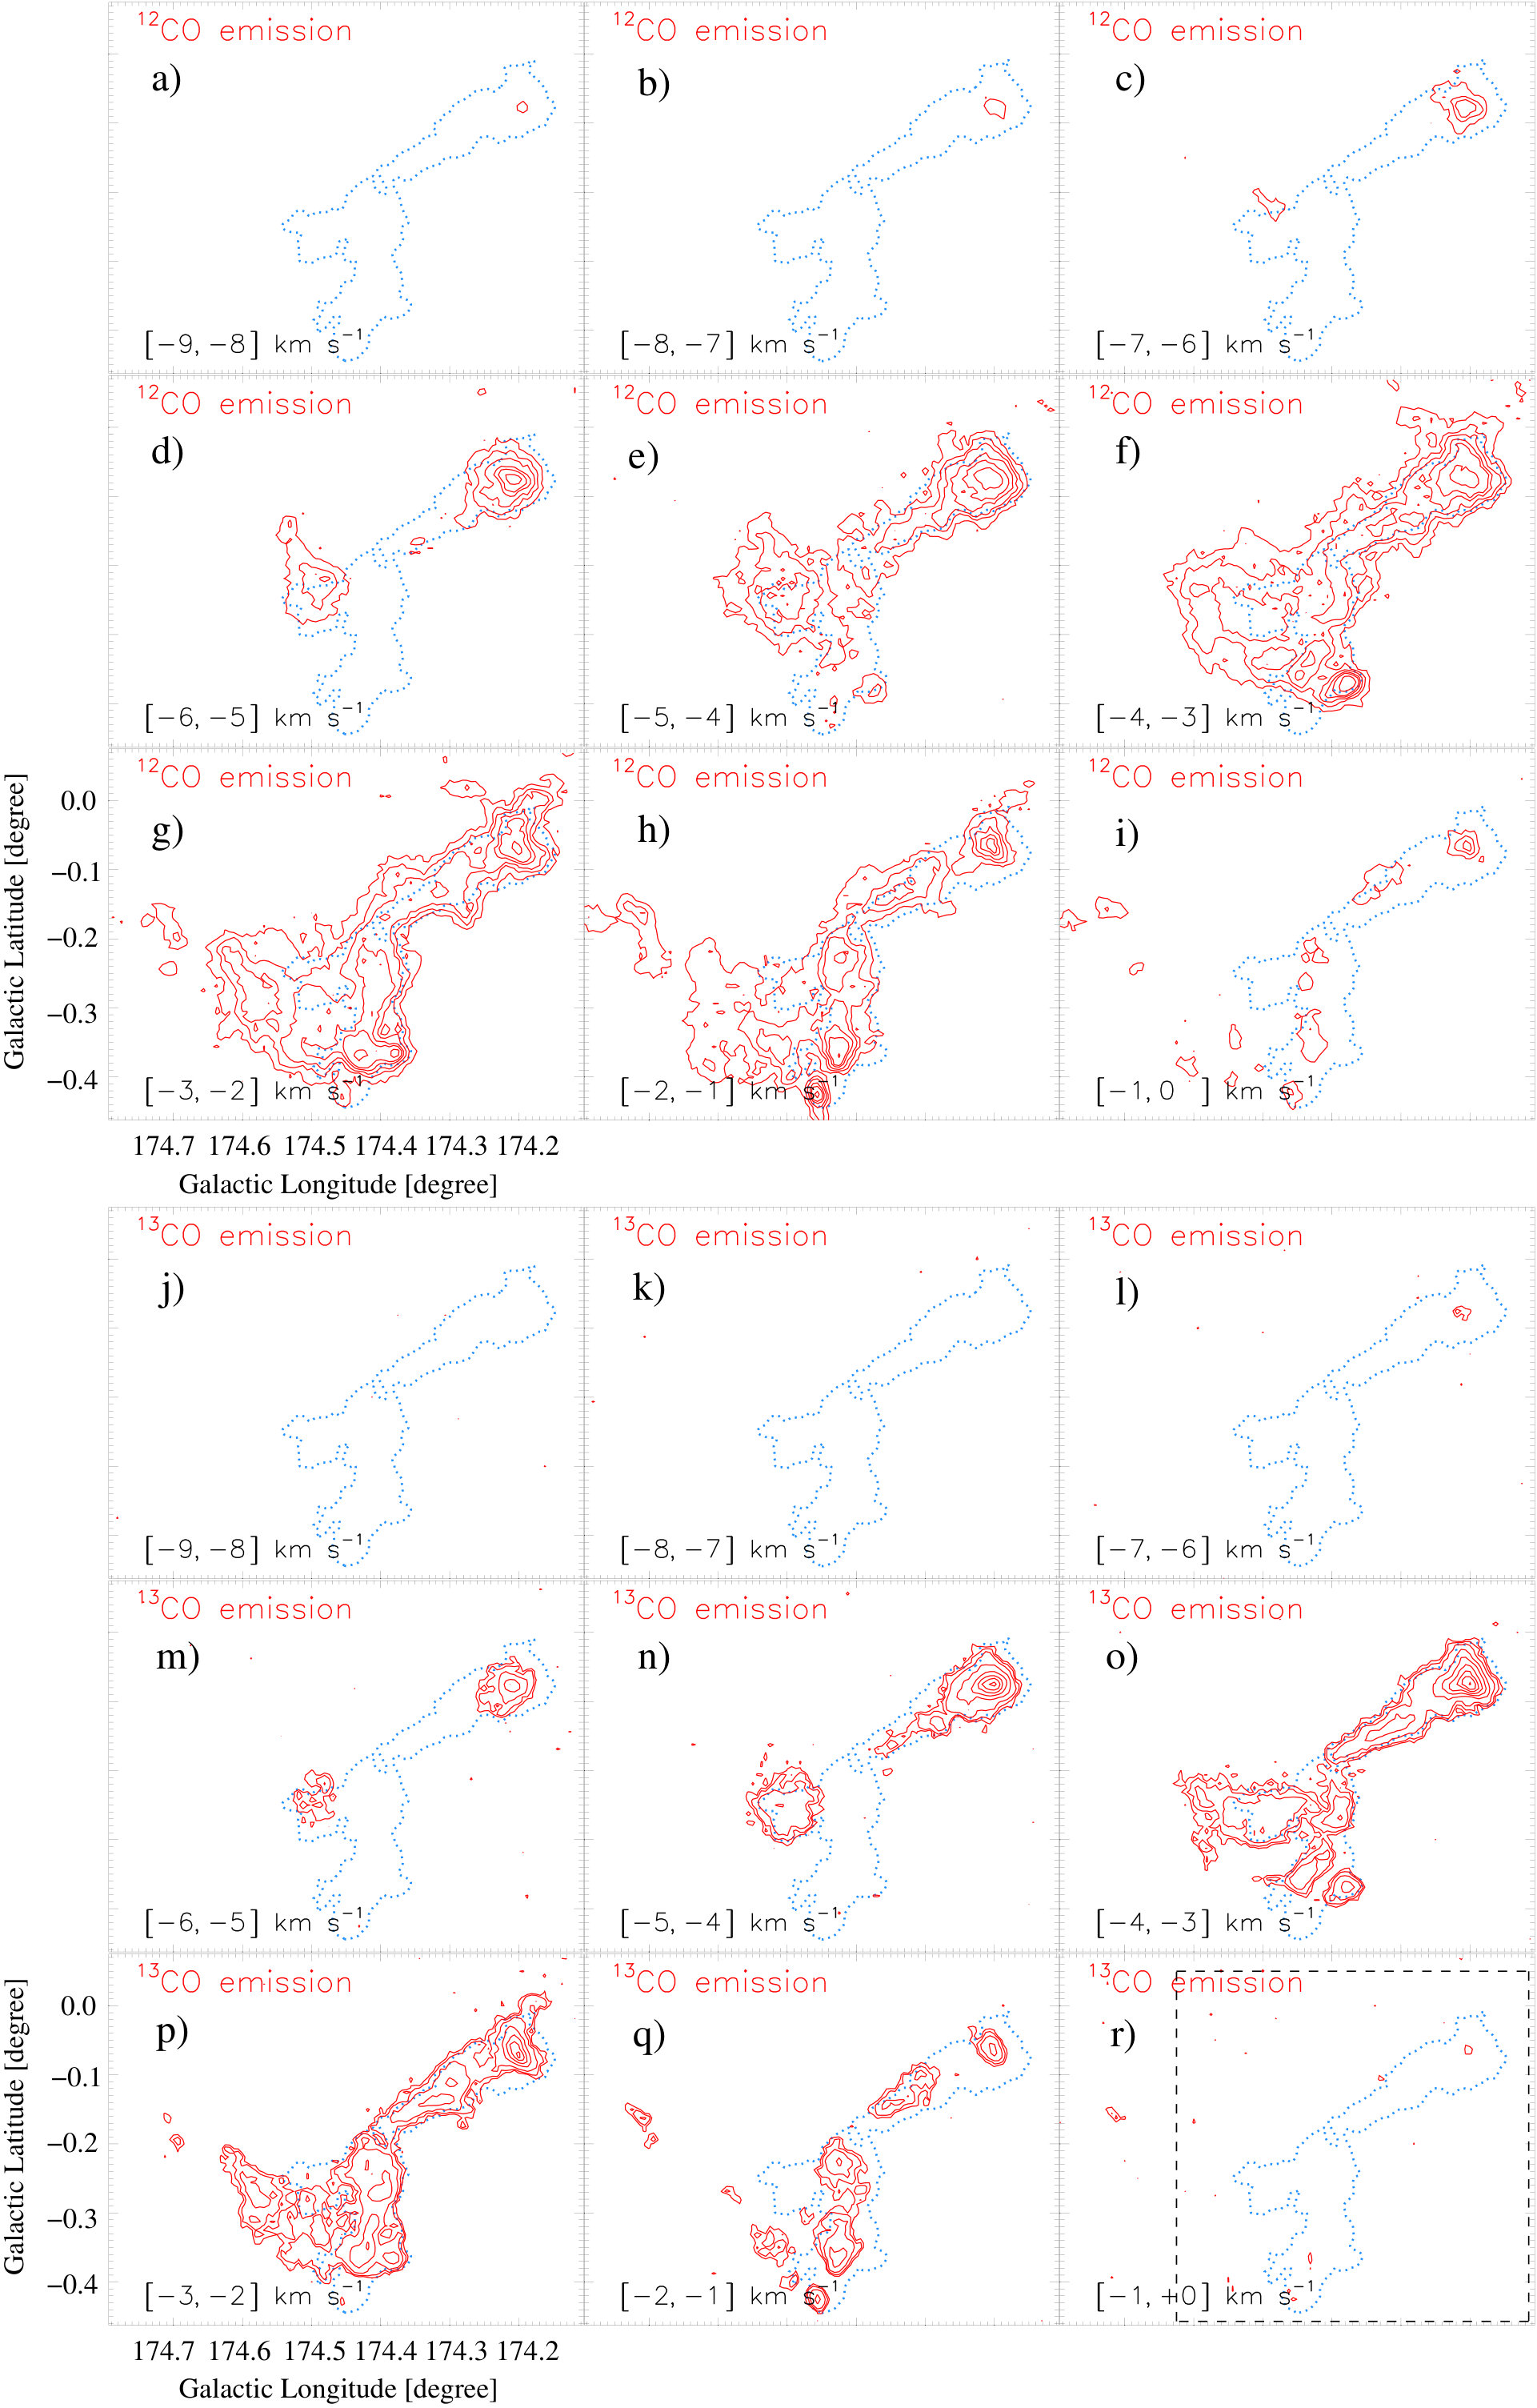 Figure 9
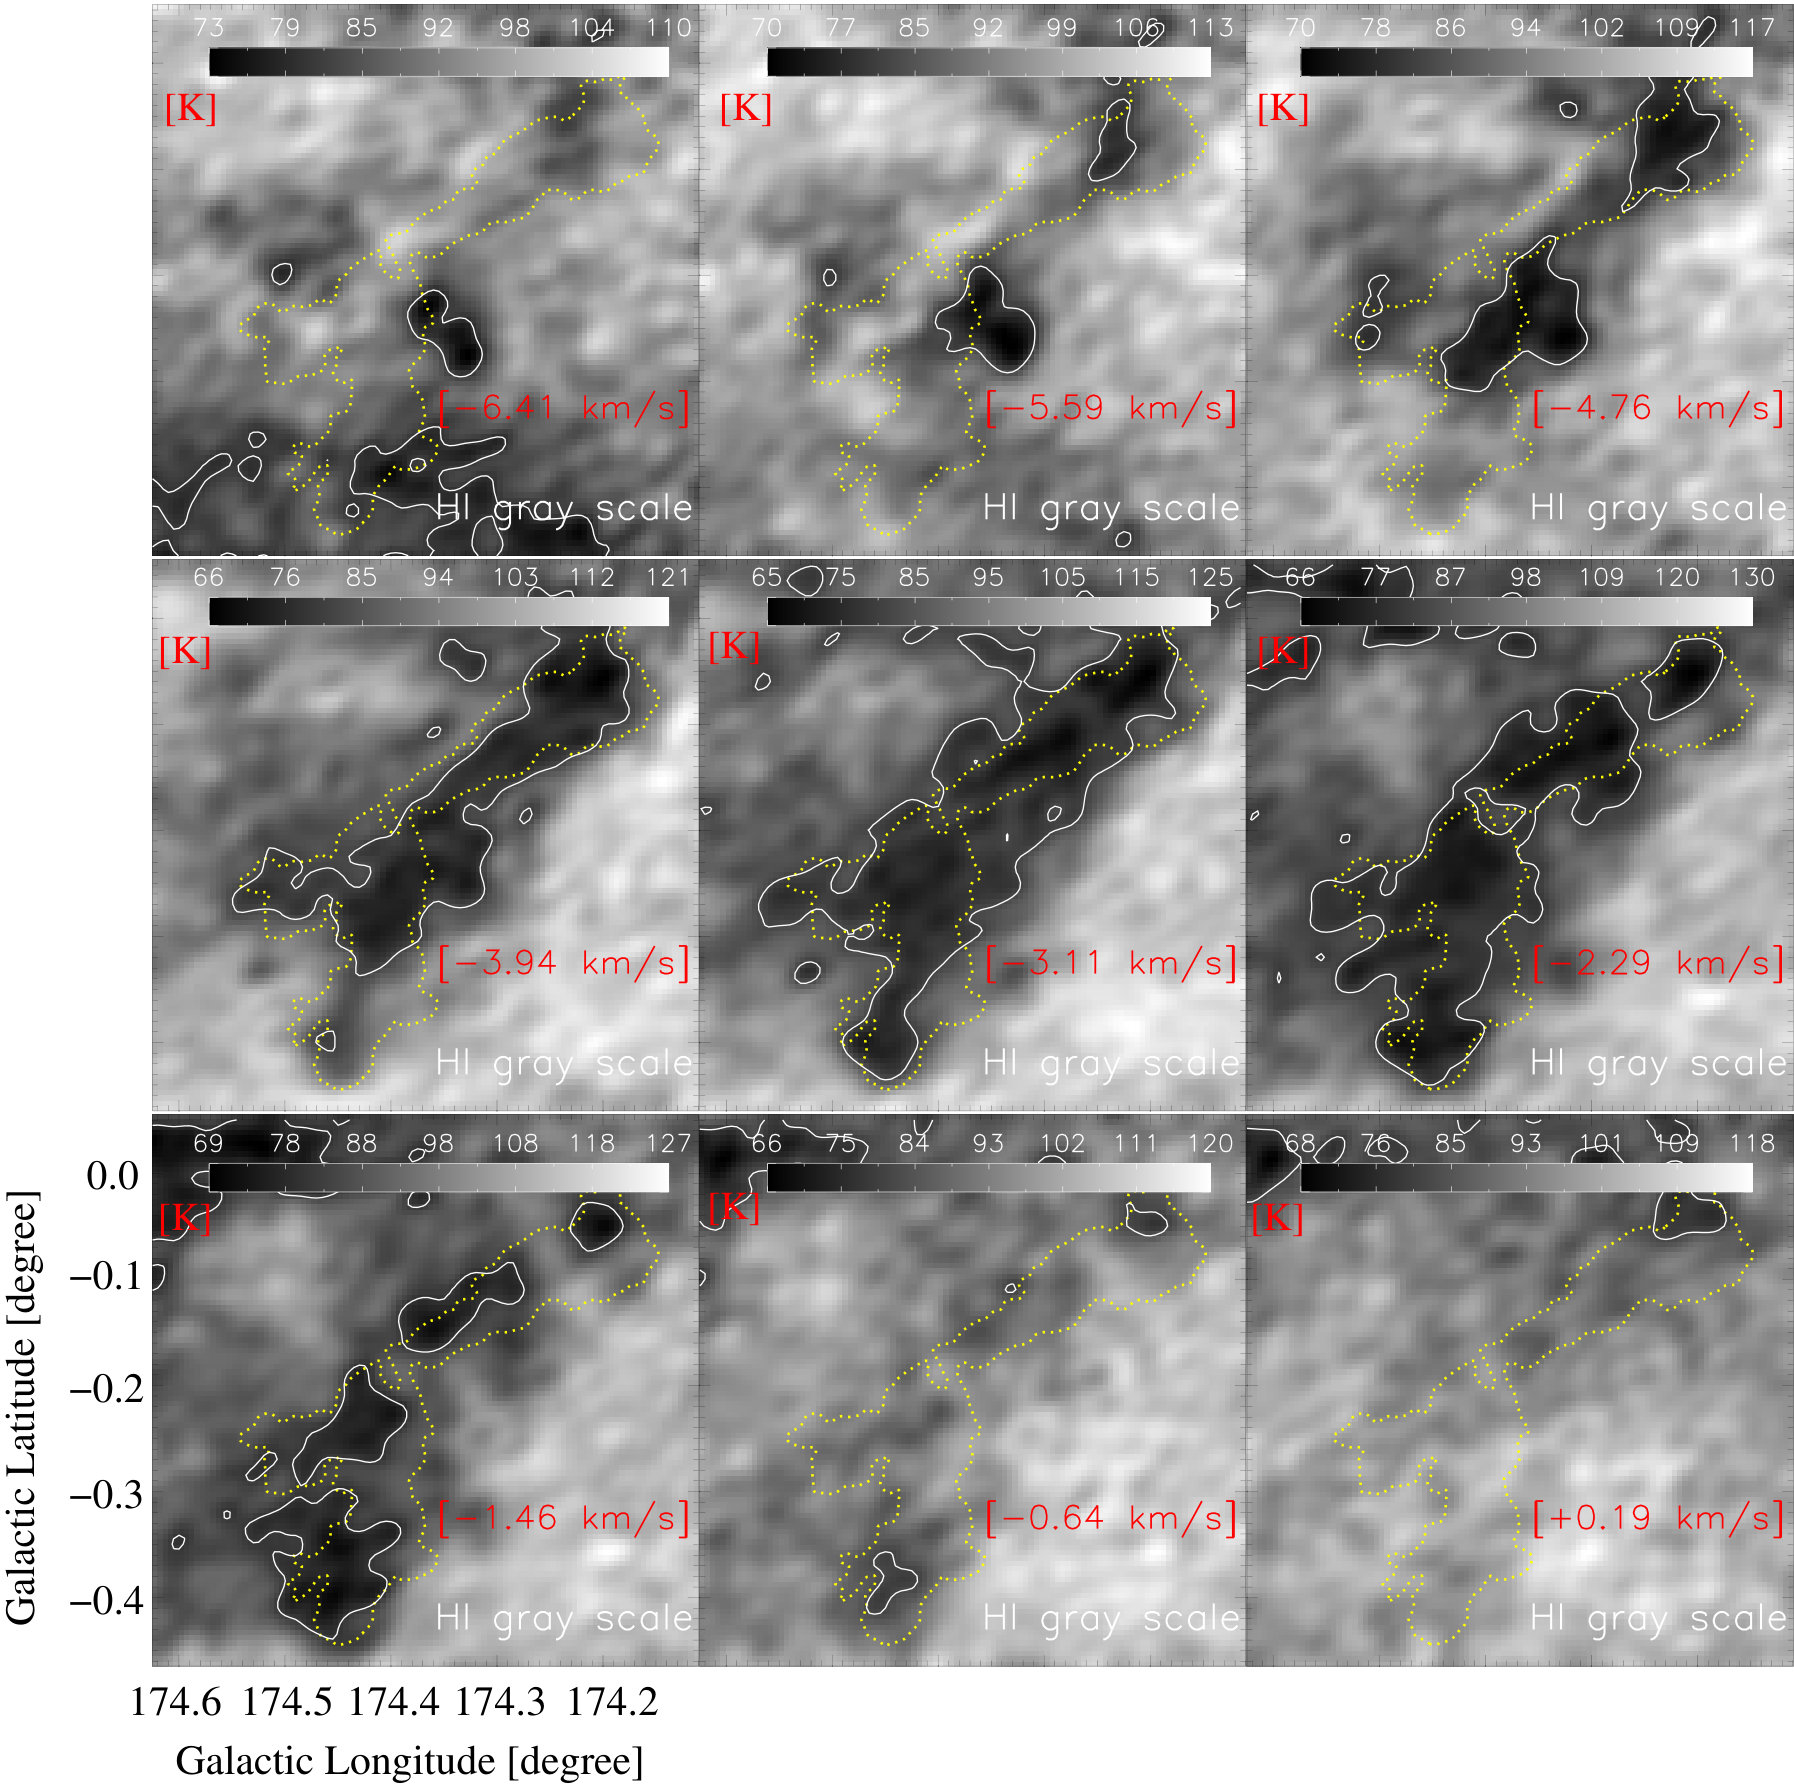 Figure 10
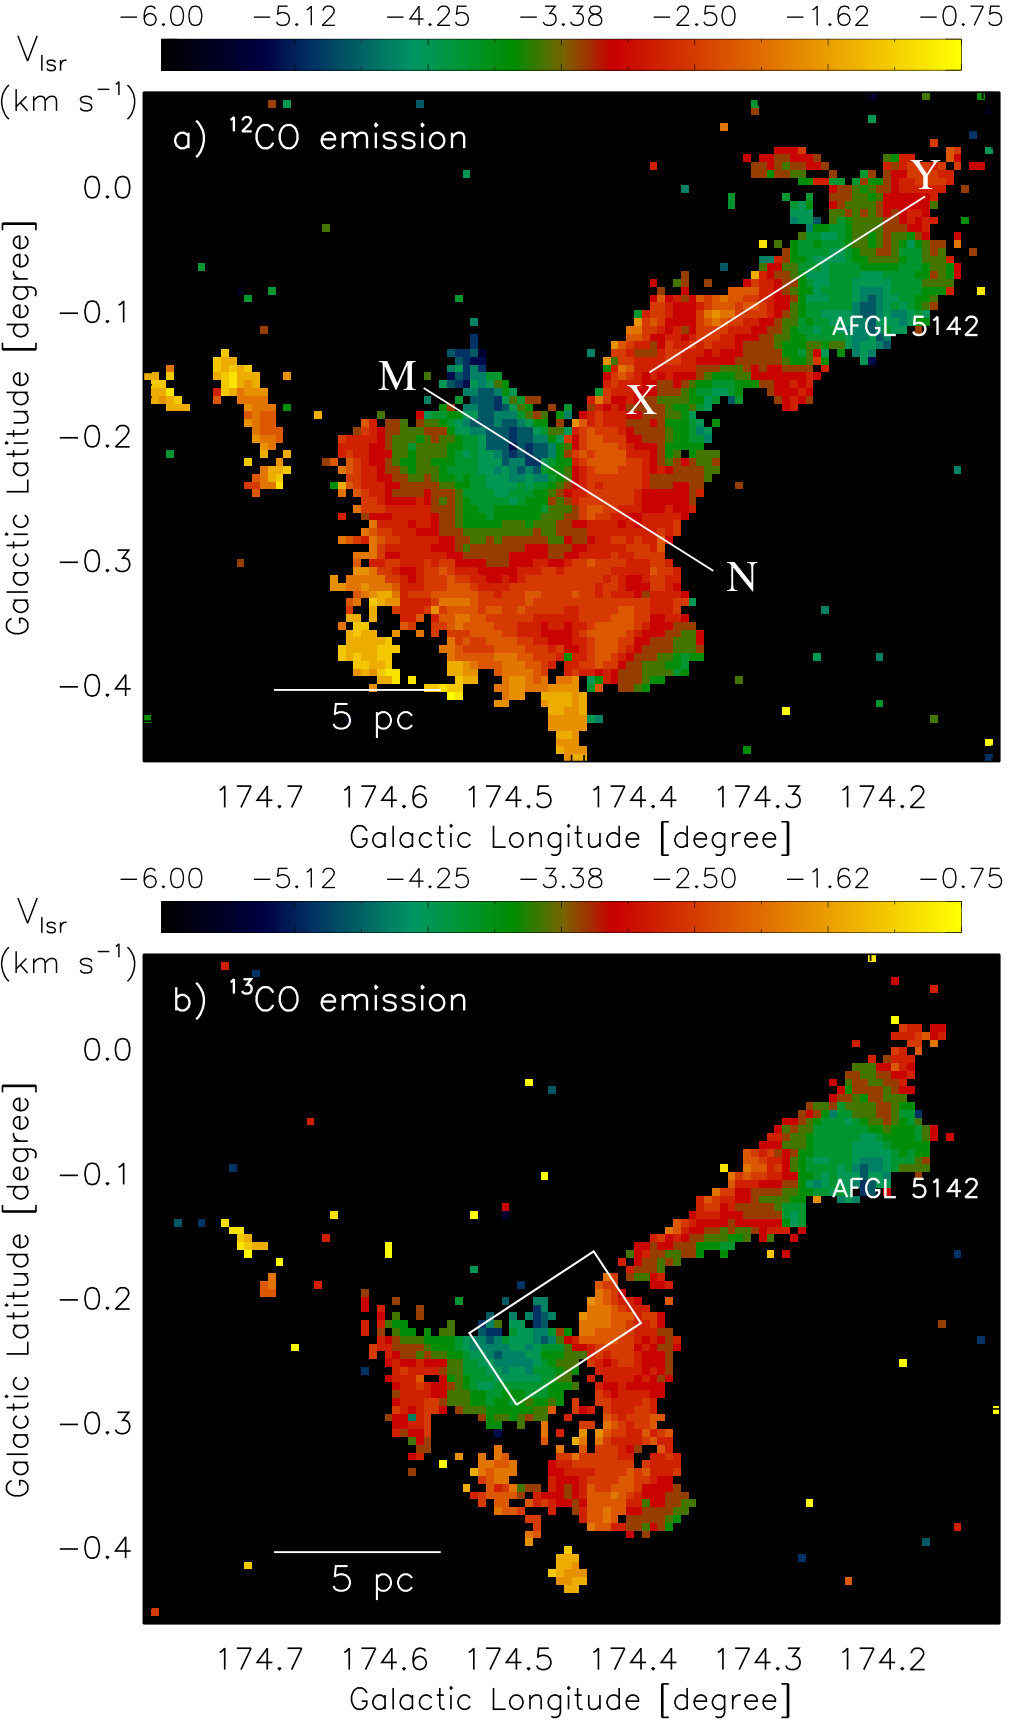 Figure 11
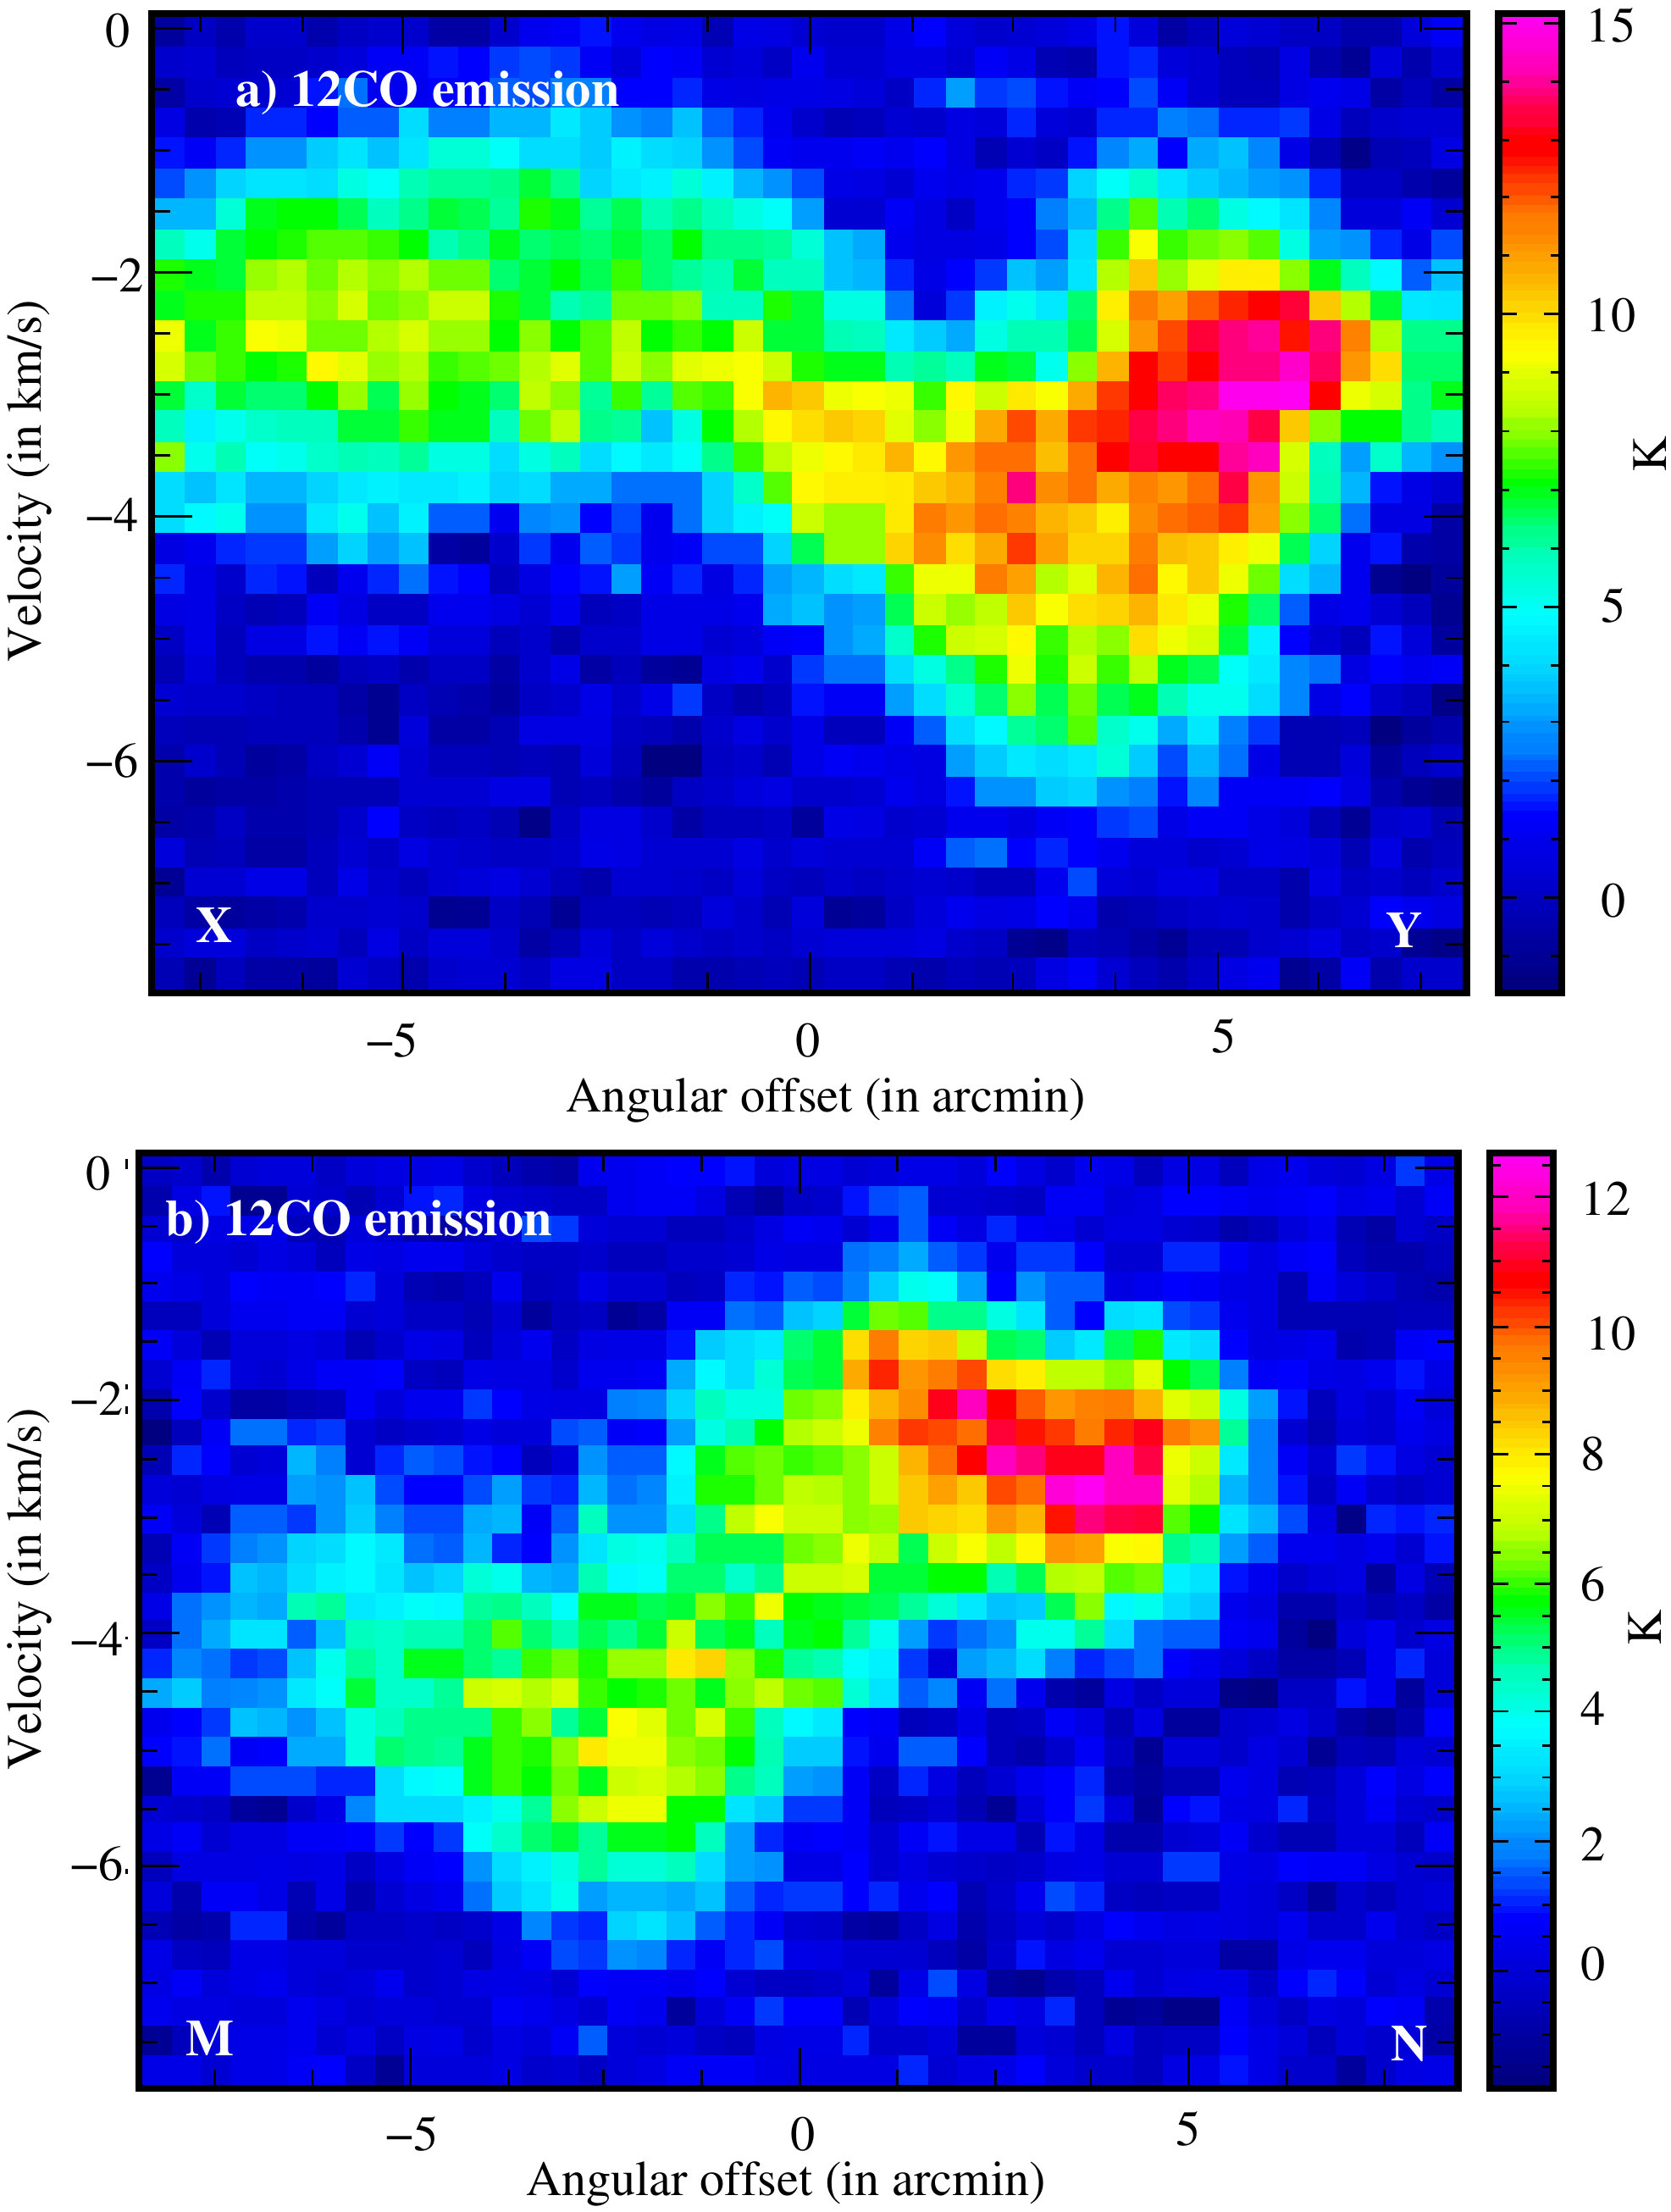 Figure 12
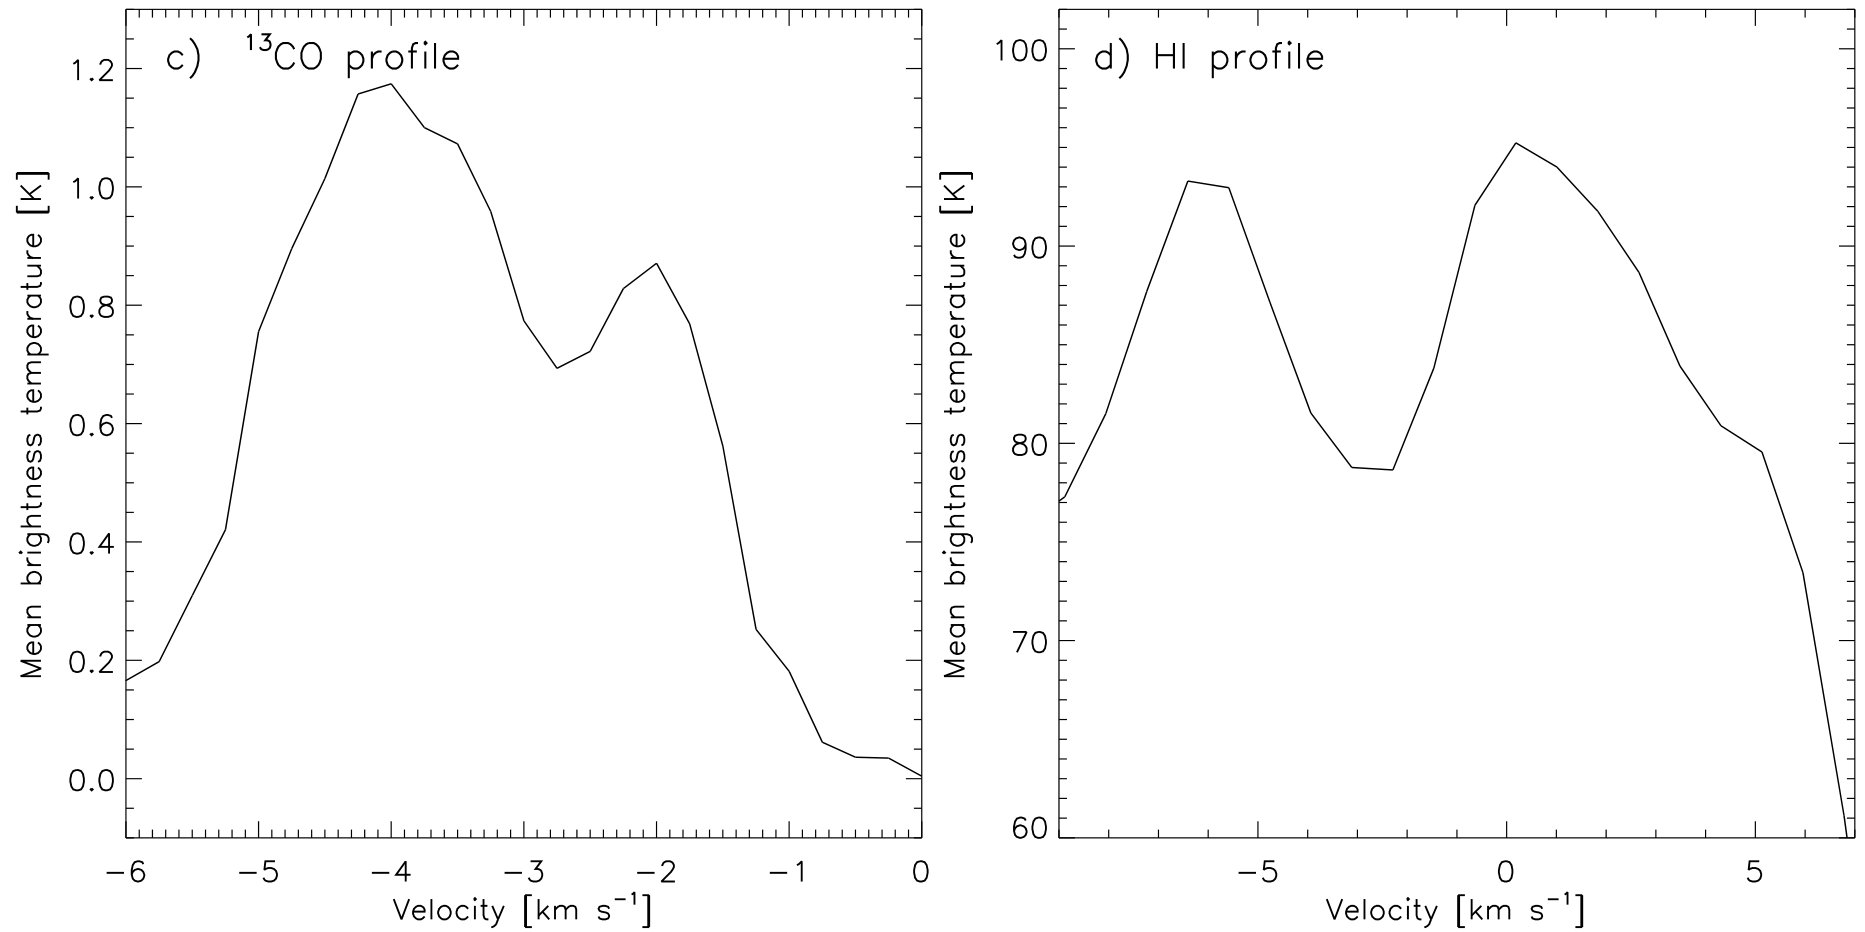 Figure 13
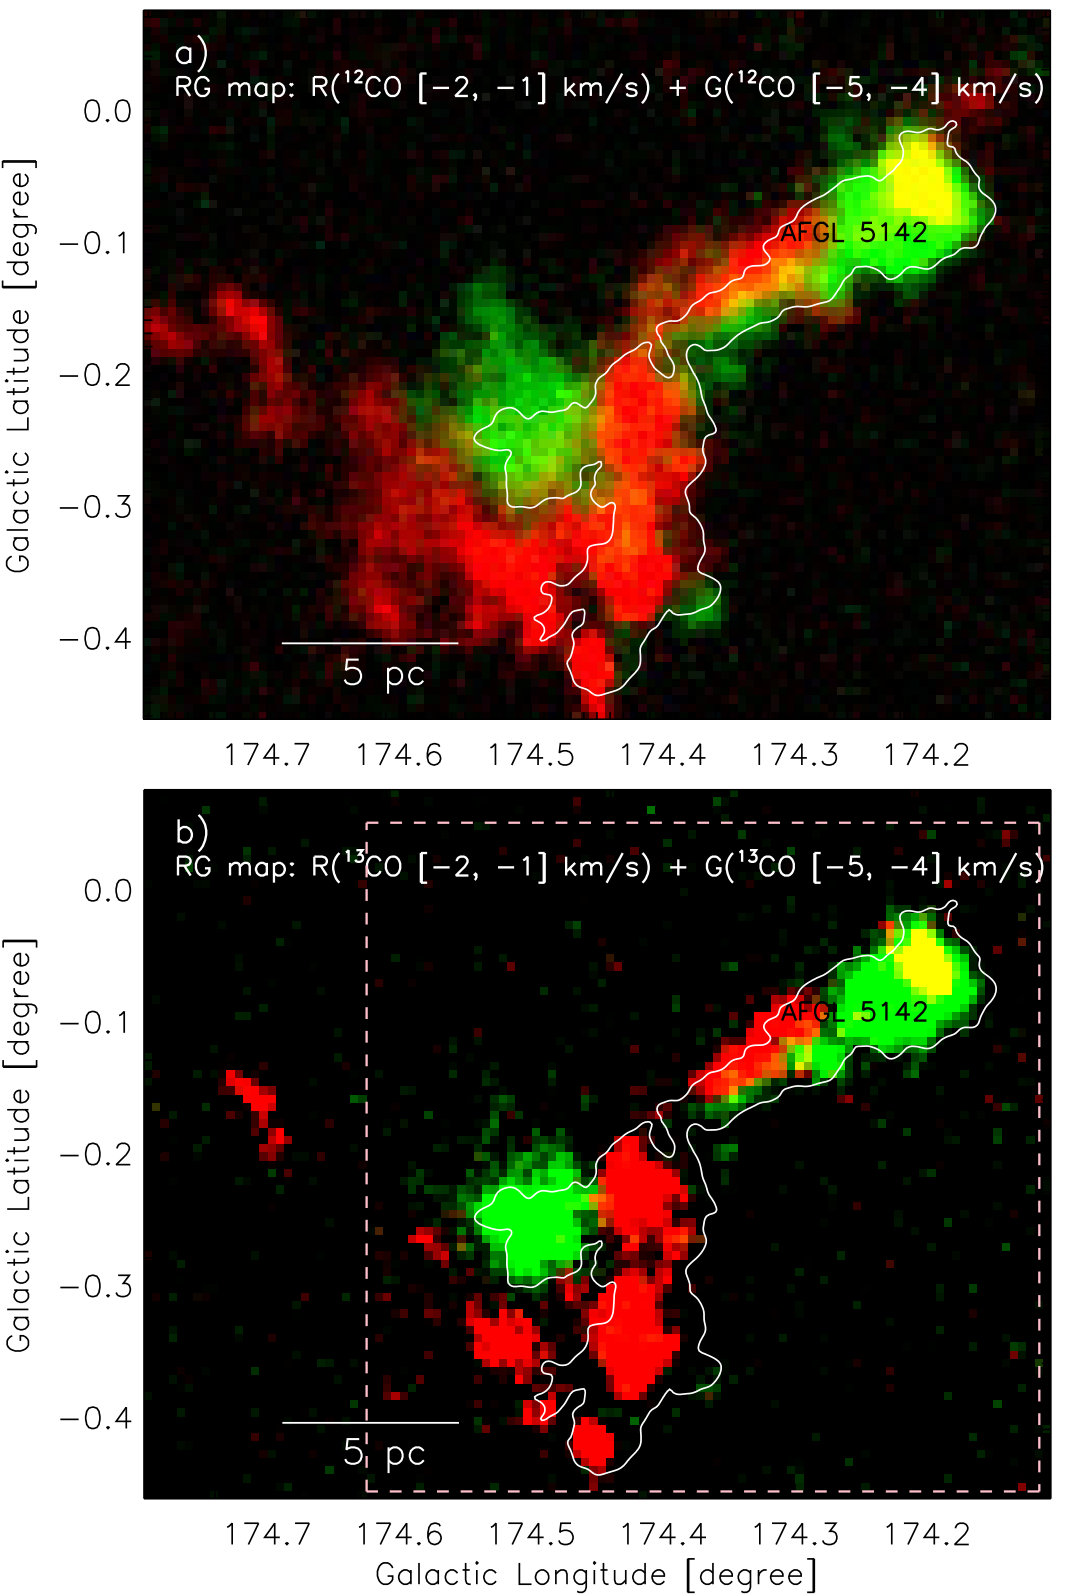 Figure 14
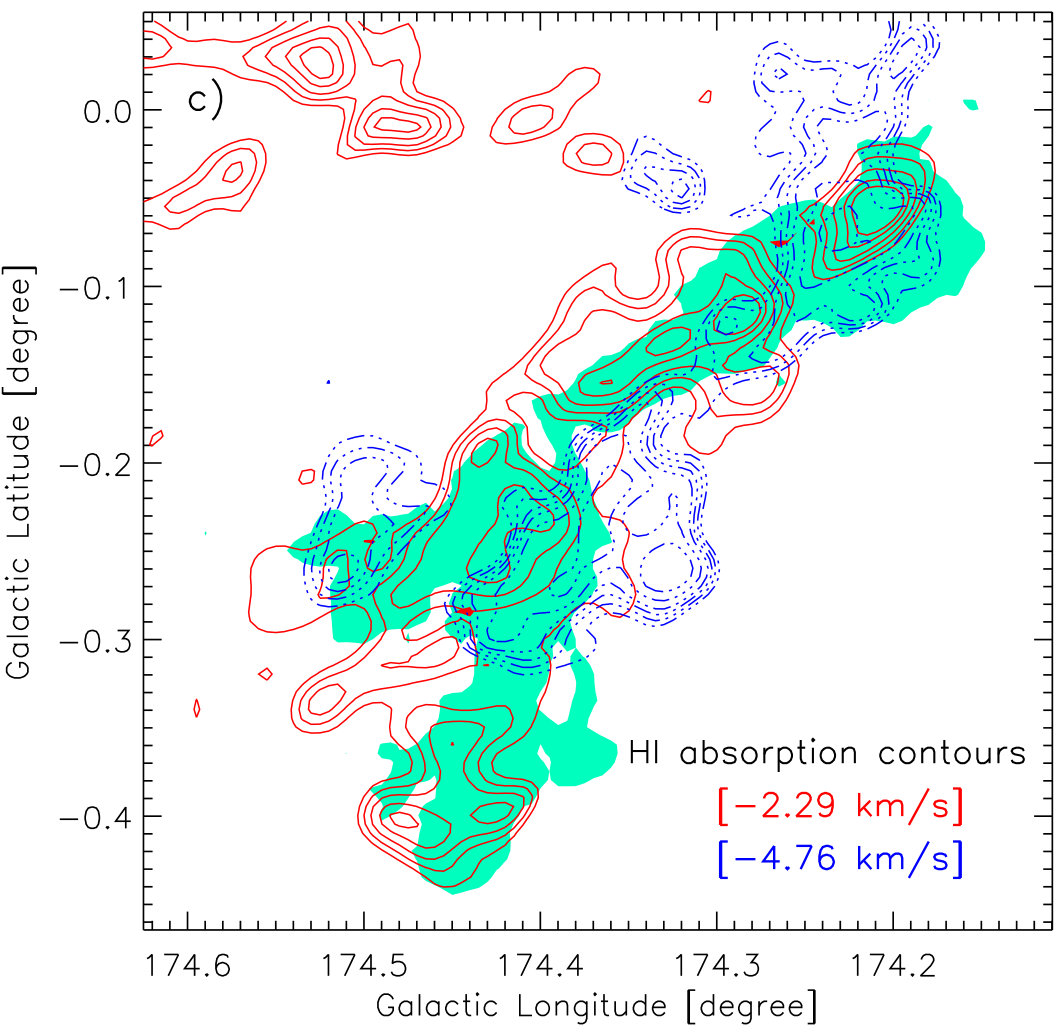 Figure 15
Peer Reviews
No public reviews on file for this paper yet. If you reviewed it on a platform where reviews are public (OpenReview, ICLR, NeurIPS, ICML), you can paste yours below so the community can read it here.
Videos
No videos yet. Explain this paper in a talk, walkthrough, or lecture? Add one.
Evidence of interacting elongated filaments in the star-forming site AFGL 5142
L. K. Dewangan11affiliation: Physical Research Laboratory, Navrangpura, Ahmedabad - 380 009, India. , D. K. Ojha22affiliation: Department of Astronomy and Astrophysics, Tata Institute of Fundamental Research, Homi Bhabha Road, Mumbai 400 005, India. , T. Baug33affiliation: Kavli Institute for Astronomy and Astrophysics, Peking University, 5 Yiheyuan Road, Haidian District, Beijing 100871, P. R. China. , and R. Devaraj44affiliation: Instituto Nacional de Astrofísica, Óptica y Electrónica, Luis Enrique Erro # 1, Tonantzintla, Puebla, México C.P. 72840.
Abstract
To probe the ongoing physical mechanism, we studied a wide-scale environment around AFGL 5142 (area 25 pc 20 pc) using a multi-wavelength approach. The Herschel column density () map reveals a massive inverted Y-like structure (mass 6280 M*⊙), which hosts a pair of elongated filaments (lengths 10 pc). The Herschel temperature map depicts the filaments in a temperature range of 12.5–13.5 K. These elongated filaments overlap each other at several places, where 4.5 1021* cm*-2*. The 12CO and 13CO line data also show two elongated cloud components (around 1.5 and 4.5 km s*-1*) toward the inverted Y-like structure, which are connected in the velocity space. First moment maps of CO confirm the presence of two intertwined filamentary clouds along the line of sight. These results explain the morphology of the inverted Y-like structure through a combination of two different filamentary clouds, which are also supported by the distribution of the cold H i gas. Based on the distribution of young stellar objects (YSOs), star formation (SF) activities are investigated toward the inverted Y-like structure. The northern end of the structure hosts AFGL 5142 and tracers of massive SF, where high surface density of YSOs (i.e., 5–240 YSOs pc*-2*) reveals strong SF activity. Furthermore, noticeable YSOs are found toward the overlapping zones of the clouds. All these observational evidences support a scenario of collision/interaction of two elongated filamentary clouds/flows, which appears to explain SF history in the site AFGL 5142.
Subject headings:
dust, extinction – ISM: clouds – ISM: kinematics and dynamics – ISM: individual object (AFGL 5142) – stars: formation – stars: pre-main sequence
1. Introduction
Numerous observational investigations, using the infrared and sub-millimeter (sub-mm) data, have revealed the existence of filamentary structures at different length scales in star-forming sites (e.g., André et al., 2014), which are very important ingredients in the formation process of young stellar clusters and massive stars. Currently, the investigation of the role of filaments in the birth of dense massive star-forming clumps and young stellar clusters is one of the ongoing research topics in the area of star formation (SF) (e.g., Myers, 2009; André et al., 2010, 2014; Schneider et al., 2012; Nakamura et al., 2014; Baug et al., 2015; Dewangan et al., 2015, 2016a, 2016b, 2017a, 2017b, 2017c, 2017d, 2017e; Contreras et al., 2016; Liu et al., 2016; Williams et al., 2018).
AFGL 5142 is an active site of SF inferred by the presence of multiple outflows on multiple scales (Hunter et al., 1999; Zhang et al., 2007; Palau et al., 2011, 2013), and the detection of various masers (Hunter et al., 1995; Goddi & Moscadelli, 2006; Qiu et al., 2008; Goddi et al., 2011; Liu et al., 2016). The site is located at a distance of 2.14 kpc (Burns et al., 2017), and hosts a group of millimeter (mm) cores (Zhang et al., 2007; Palau et al., 2011, 2013). One of the mm cores (i.e., MM1; Mcore 6.5 M*⊙; Liu et al., 2016) contains the 6.7-GHz methanol masers, favouring the presence of at least one embedded massive star in the AFGL 5142 MM1 system (Goddi et al., 2011). Goddi et al. (2011) reported that the core AFGL 5142 MM1 shows radio continuum emission from ionized gas, and excites the 22-GHz water maser and the 6.7-GHz methanol maser. Furthermore, another mm core, MM2 (Mcore* 6.2 M*⊙; Liu et al., 2016) is investigated, where no radio continuum/centimeter emission or 6.7-GHz methanol maser is detected. However, the presence of the 22-GHz water maser in the direction of the AFGL 5142 MM2 system (Hunter et al., 1995; Goddi & Moscadelli, 2006) indicates the onset of SF. Using the Spitzer infrared observations, Qiu et al. (2008) examined the infrared counterpart of the detected mm core, and found an embedded object, which was detected only in the image at 24 m (see Table 5 in their paper). With the knowledge of chemical compositions, previous observations revealed the signatures of hot molecular core toward the MM1 and MM2 (Zhang et al., 2007; Palau et al., 2011). Hunter et al. (1999) presented the HCO+(1–0) spectrum of AFGL 5142, which showed at least two velocity peaks around 4.5 and 1.5 km s-1* (see also Liu et al., 2016). In a velocity range of [10, 0] km s*-1*, Colzi et al. (2018) also observed two peaks toward AFGL 5142-MM using the H13CN profile. Using the HCN (3–2) and HCO*+* (3–2) line data sets, Liu et al. (2016) also reported an extremely wide-angle bipolar outflow (EWBO) with an opening angle of 180*∘, which was found to be powered from the MM1–MM2 region. Using the NH3* (1, 1) line data, they also found a hierarchical network of filaments, and reported the signatures of gas inflow along the filaments. These authors suggested the importance of both filamentary inflow and outflow feedback in cluster formation in AFGL 5142. However, no attempt is made to examine the filaments and different velocity components on a large-scale, which is important to help in understanding the exact ongoing physical process in the site AFGL 5142. Hence, in this paper, we carry out a detailed study of a large-scale environment (more than 20 pc) around AFGL 5142 using a multi-wavelength approach. To understand the physical process in the site AFGL 5142, the present work is focused to examine the distribution of dust (i.e., warm and cold), gas (i.e., neutral, molecular, and ionized), and young stellar objects (YSOs). On large-scales, the sub-mm images from the space-based Herschel telescope facility are employed to investigate the embedded filaments in the site AFGL 5142. The study of internal kinematics of the emitting 12CO and 13CO gas in a wide-scale environment of AFGL 5142 is also performed.
In Section 2, the details of the adopted observational datasets are provided. In Section 3, the identification of filaments and the distribution of dust and gas in the selected site are presented. Furthermore, the selection procedures of embedded YSOs in the site AFGL 5142 are also explained in the section. Section 4 is devoted to explain the possible SF scenario. Finally, Section 5 provides the main conclusions of this paper.
2. Data and analysis
In this work, the analysis of the observational data sets is carried out for an area of 0.676 0.534 (central coordinates: l = 174.455; b = 0.197) hosting the site AFGL 5142. The data sets in the infrared, sub-mm, and radio regimes were collected from different existing surveys (e.g., the Two Micron All Sky Survey (2MASS; = 1.25, 1.65, 2.2 m; resolution 2*′′; Skrutskie et al., 2006), the UKIRT NIR Galactic Plane Survey (GPS; = 1.25, 1.65, 2.2 m; resolution 0′′.8; Lawrence et al., 2007), the Warm-Spitzer Glimpse360111http://www.astro.wisc.edu/sirtf/glimpse360/ survey ( = 3.6, 4.5 m; resolution 2′′; Whitney et al., 2011; Benjamin et al., 2003), the Wide Field Infrared Survey Explorer222WISE is a joint project of the University of California and the JPL, Caltech, funded by the NASA (WISE; = 12, 22 m; resolution 6′′, 12′′; Wright et al., 2010), the Herschel Infrared Galactic Plane Survey (Hi-GAL; = 70, 160, 250, 350, 500 m; resolution 5′′.8, 12′′, 18′′, 25′′, 37′′; Molinari et al., 2010a, b), the NRAO VLA Sky Survey (NVSS; = 21 cm; resolution 45; Condon et al., 1998), and the Canadian Galactic Plane Survey (CGPS; = 21 cm; resolution 1′* 1*′* csc; Taylor et al., 2003)). The present work also uses the Five College Radio Astronomy Observatory (FCRAO) 12CO(1-0) and 13CO(1-0) line data (velocity resolution 0.25 km s*-1*). The FCRAO beam sizes are 45*′′* (with angular sampling of 225) and 46*′′* (with angular sampling of 225) for 12CO and 13CO, respectively. Typical rms values for the spectra are 0.25 K for 12CO and 0.2 K for 13CO (e.g., Heyer et al., 1996). The selected target field was observed as part of the Extended Outer Galaxy Survey (E-OGS, Brunt, 2004), that extends the coverage of the FCRAO Outer Galaxy Survey (OGS, Heyer et al., 1998).
3. Results
3.1. Wide-scale physical environment of AFGL 5142
With the help of the mid-infrared emission observed in the WISE 12 m image, a wide-scale environment of AFGL 5142 (area 25 pc 20 pc) is presented in Figure 1a. The WISE image is also superimposed with the NVSS 1.4 GHz emission to trace the ionized gas. An inverted gray-scale image at Herschel 250 m (resolution 12*′′) is shown in Figure 1b. At least two elongated filamentary features ( 10 pc) are visually seen in the Herschel image, and are highlighted by arrows. Two extended and bright regions traced in the image at 12 m are found toward the ends of the filaments (see “northern” and “southern” boxes in Figure 1a), which are also spatially extended in the sub-mm image at 250 m. Interestingly, the star-forming region AFGL 5142 is located at the “northern end” of the filaments. Figures 2a and 2b show a zoomed-in view of the “northern end” using the GPS K-band and the Spitzer 4.5 m images, respectively, revealing the presence of an embedded group of sources. In Figures 2c and 2d, the “southern end” is displayed using the GPS K-band and the Spitzer 4.5 m images, respectively, which also show several embedded point-like sources. A quantitative analysis of point-like sources is presented in Section 3.3. No radio continuum emission at NVSS 1.4 GHz (1 0.45 mJy beam-1*) is observed toward both the “northern” and “southern” ends.
The Herschel temperature and column density () maps (resolution 12*′′) are displayed in Figures 3a and 3b, respectively. These maps were produced as a part of the EU-funded ViaLactea project (Molinari et al., 2010b), and were obtained from the publicly available site333http://www.astro.cardiff.ac.uk/research/ViaLactea/. In order to generate these maps, Marsh et al. (2017) utilized the Bayesian PPMAP procedure (Marsh et al., 2015) to the Herschel continuum data, and also adopted the optically thin emission assumption in the procedure (see Marsh et al., 2017, for more details). Both these Herschel maps also reveal the elongated filaments as highlighted in Figure 1b, allowing to infer their physical parameters. These filaments also overlap each other at many locations (see arrows in Figure 3b). Figure 3c shows a two color-composite image (temperature map (red) and column density map (green)). The column density contour at 3.1 1021* cm*-2* is also overlaid on the color-composite image, revealing an inverted Y-like structure. The temperature map traces the filaments in a temperature range of about 12.5–13.5 K. We have determined the total mass of the materials distributed within the contour of 3.1 1021 cm*-2* (or the inverted Y-like structure), which comes out to be 6280 M*⊙. The total mass is computed using the expression, , where is the mean molecular weight per hydrogen molecule (i.e., 2.8), is the area subtended by one pixel (i.e., 6′′*/pixel), and is the total column density (see also Dewangan et al., 2017a).
Together, the analysis of the sub-mm data reveals the existence of two elongated filaments in a wide-scale environment of AFGL 5142 and several overlapping zones of these filaments (having 4.5 1021 cm*-2*).
3.2. Kinematics of molecular gas
Figures 4a and 4b display the distribution of 12CO (J=1–0) and 13CO (J=1–0) gas toward the selected target area around AFGL 5142, respectively. The molecular cloud associated with AFGL 5142 is studied in a velocity range of 8 to 0 km s*-1*. The Herschel column density contour at 3.1 1021 cm*-2* is also overlaid on the integrated maps. In general, the 12CO (1–0) line is typically optically thick compared to the 13CO (1–0) line. Hence, the 12CO emission can be used to trace the boundary of molecular cloud, while the 13CO emission (n(H2) 103 cm*-3*) allows us to investigate the denser and opaque regions in molecular clouds. As per the expectation, the cloud associated with AFGL 5142 appears more extended in the 12CO compared to the 13CO. The 13CO map also shows the inverted Y-like morphology, which is in agreement with the result derived using the Herschel column density map.
In order to further study the distribution of gas, we have examined the velocity channel maps of 12CO, 13CO, and H i. In Figure 5, we present 12CO velocity channel maps within the velocity range from 9 to 0 km s*-1* in steps of 1 km s*-1* (see panels “a–i”). The velocity channel maps of 13CO are also presented in the panels “j–r” (see Figure 5). The Herschel column density contour at 3.1 1021 cm*-2* is also overlaid on each velocity channel map. With help of these maps, one can trace two velocity components toward our selected field (see maps at [, ] and [, ] km s*-1*). In Figure 6, we show the 21 cm H i velocity channel maps of our selected field. The Herschel column density contour at 3.1 1021 cm*-2* is also overplotted on each H i map. In the H i maps, black or dark gray regions are found toward our selected target field, indicating the presence of the absorption features (e.g., Kerton, 2005). These features are also referred to as the H i self-absorption (HISA) features (e.g., Kerton, 2005), which indicate the residual amounts of very cold H i gas in molecular clouds (Burton et al., 1978; Baker & Burton, 1979; Burton & Liszt, 1981; Liszt et al., 1981). The H i line data also show the existence of two different cloud components (see maps at 2.29 and 4.76 km s*-1*).
In Figures 7a and 7b, we display the first moment maps of 12CO and 13CO, respectively. The moment map traces the intensity-weighted mean velocity of the emitting gas. The observed velocity structures in these maps suggest two possibilities. In one of the possibilities, there are two distinct filaments in the direction of the inverted Y-like structure. Alternatively, the other possibility suggests a single filament with internal velocity gradient toward the inverted Y-like structure. In Figure 8a, we present the position-velocity (pv) map of 12CO in the direction of an axis “X–Y” (see a solid line in Figure 7a). A velocity gradient is clearly seen toward the Y end of the axis “X–Y”, where AFGL 5142 is located. Figure 8b displays the pv map of 12CO along an axis “M–N” (see a solid line in Figure 7a). In Figure 8b, the pv map suggests the velocity connection of two velocity components (around 1.5 and 4.5 km s*-1*). The observed 13CO and H i profiles are shown in Figures 8c and 8d, respectively. Both the spectra show two velocity peaks, and are generated by averaging the area highlighted by a solid box in Figure 7b.
In Figures 9a and 9b, we show color-composite images of the site AFGL 5142 with the 12CO and 13CO maps at [, ] and [, ] km s*-1* in red and green, respectively. The inverted Y-like structure observed in the Herschel column density map is also indicated by a solid contour. We find that these color-composite maps can reproduce the observed velocity field as traced in the first moment maps of 12CO and 13CO. It also favours the existence of two intertwined filamentary clouds along the line of sight. Interestingly, the inverted Y-like structure can also be explained by the two elongated clouds (around 1.5 and 4.5 km s*-1*), which are also spatially overlapped. In other words, a complimentary distribution of molecular gas at [, ] and [, ] km s*-1* produces the observed inverted Y-like structure. Hence, it is unlikely the existence of a single filament with internal velocity gradient toward the inverted Y-like structure. Figure 9c shows the contours of the HISA features traced in the 21 cm H i velocity channel maps at 2.29 and 4.76 km s*-1*. All the observed results derived using the molecular line data are also supported by the distribution of the cold H i gas (see Figures 6 and 9c).
In Figure 10, we present the integrated 12CO and 13CO intensity maps and the Galactic pv maps. The integrated maps are similar as shown in Figure 4. In the pv maps, velocity gradients are observed in the direction of the both ends and the center of the cloud. A detailed discussions on these results are presented in Section 4.
3.3. Spatial distribution of YSOs in the site AFGL 5142
This section deals with the selection of infrared-excess sources embedded in the site AFGL 5142. In this connection, we have employed two selection schemes using the GLIMPSE360, UKIDSS-GPS, and 2MASS photometric data, which are the dereddened color-color (i.e. [K[3.6]]0 and [[3.6][4.5]]0) and the NIR color-magnitude (i.e. HK/K) schemes. One can find more detailed descriptions of these schemes in Dewangan et al. (2017a) (see also Gutermuth et al., 2009). In Figures 11a and 11b, we show the dereddened color-color plot (i.e. [K[3.6]]0 and [[3.6][4.5]]0) and the NIR color-magnitude plot (i.e. HK/K) of point-like objects, respectively. In the dereddened color-color scheme, we computed the dereddened colors using the color excess ratios listed in Flaherty et al. (2007), and separated YSOs against the possible dim extragalactic contaminants. This scheme gives 57 (7 Class I and 50 Class II) YSOs (see Figure 11a). In the NIR color-magnitude scheme, we have utilized a color criterion (i.e., HK 0.8 mag) to select infrared excess sources, which is determined based on the color-magnitude analysis of the nearby control field. We identify 76 additional YSO candidates using this scheme in our selected region (see Figure 11b). Using these classification schemes lead to select a total of 133 YSOs in our target field. In Figure 11c, the positions of all the selected YSOs are overlaid on the Herschel column density map. We find that the embedded YSOs are located to those points where filaments overlap (including the ends of filaments) (see thick arrows in Figure 11b).
Using the nearest-neighbour (NN) technique (e.g., Gutermuth et al., 2009) and following the procedures described in Dewangan et al. (2015), the surface density map of YSOs is also computed in this paper (also see equation in Dewangan et al., 2015). Figure 11d shows the surface density contours of YSOs overlaid on the Herschel column density map, indicating the presence of groups of YSOs in the northern and southern parts of the inverted Y-like structure. The surface density contours are shown with the levels of 1, 1.5, and 2 YSOs pc*-2*. In Figure 12a, a zoomed-in view of the northern part of the inverted Y-like structure is displayed using the 13CO maps at [, ] and [, ] km s*-1*, which hosts AFGL 5142. We have also overlaid the surface density contours of YSOs on the 13CO maps, and the contours are plotted with the levels of 5, 10, 15, 20, 35, 50, and 80 YSOs pc*-2*. In the direction of AFGL 5142, a cluster of YSOs is found to be spatially extended within a scale of 3 pc, and are located toward the common zone of two clouds around 1.5 and 4.5 km s*-1*. Based on the surface density value, the utility of the identification of a cluster of sources is discussed in Bressert et al. (2010) (see their paper for more details). Figure 12b further displays the surface density contours of YSOs superimposed on the UKIDSS K-band image toward AFGL 5142. The surface density contours are shown with the levels of 28, 32, 40, 50, 80, 120, 180, and 240 YSOs pc*-2*. It implies that SF activities are very intense toward the northern end of the inverted Y-like structure (i.e., AFGL 5142). Furthermore, at least two peaks of the surface density with the values of 170–240 YSOs pc*-2* are also observed within a scale of 0.3 pc (see Figure 12b), and are seen toward the SMA 1.1 mm continuum cores (see Figure 3 in Liu et al., 2016).
4. Discussion
Earlier, several signposts of SF (i.e., outflows, 22-GHz water maser, and 6.7-GHz methanol maser) have been reported toward AFGL 5142 (see Liu et al., 2016, and references therein). Based on the detection of the 6.7-GHz methanol maser and the radio continuum emission, AFGL 5142 is considered as an active site of massive SF (see Goddi et al., 2011; Liu et al., 2016, and references therein). Using the HCO*+(1–0) spectrum, two velocity peaks (around 1.5 and 4.5 km s-1*) have been observed toward AFGL 5142 (Hunter et al., 1999; Liu et al., 2016). Using the H13CN profile, Colzi et al. (2018) also found two peaks toward AFGL 5142-MM in a velocity range of [10, 0] km s*-1*. Liu et al. (2016) reported a hierarchical network of filaments using the NH3 (1, 1) line data. With the help of the pv diagrams of NH3 (1, 1), the existence of molecular gas in a velocity range of [5.5, 1.5] km s*-1* has been found by Liu et al. (2016) (see Figure 11 in their paper). They traced one filament in a velocity range of [5.5, 3.0] km s*-1*, while the other one was observed at [3.0, 1.5] km s*-1* (see Figure 11 in their paper). All these results favour the presence of at least two velocity components in the direction of the massive star-forming region AFGL 5142. However, in the literature, there is no information available concerning the filaments and different velocity components at a large-scale.
In Section 3.1, we have investigated an embedded structure in a wide-scale environment around AFGL 5142, which is the inverted Y-like morphology (mass 6280 M*⊙; major axis 19 pc). The Herschel map also enables us to identify at least two elongated filaments (lengths 10 pc), which are embedded within the the inverted Y-like morphology. In parallel to the outcomes derived from the Herschel data sets, the distribution of the 12CO, 13CO, and H i gas toward the structure is also examined in Section 3.2. In the direction of the structure, at least two different elongated filamentary molecular clouds (around 1.5 and 4.5 km s-1*) are traced using the CO line data, and are also linked spatially as well as in velocity (see Section 3.2, and also Figure 8). The first moment maps of CO show a pair of nearly twisted filamentary clouds at different positions and velocities, revealing their spatial overlapping (see Figures 7a and 7b). To our knowledge, such observational outcome is rare, and is also very promising. The overlapping zones include both the ends and the central part of the filamentary clouds, where 4.5 1021 cm*-2*. Interestingly, the spatial distribution of molecular gas at [, ] and [, ] km s*-1* produces the observed inverted Y-like structure. The analysis of the cold H i gas also supports these observational outcomes (see Figures 6a and 9c). All these results enable us to suggest the interaction between filamentary clouds along the line of sight. Hence, one can also expect SF activities at the shock-compressed layer of gas due to the collision of filamentary clouds (e.g., Habe & Ohta, 1992; Nakamura et al., 2014; Dewangan et al., 2018, and references therein). Furthermore, the collision of two clouds has been proposed as a possible triggering mechanism of massive SF (e.g., Inoue & Fukui, 2013; Fukui et al., 2014).
In Section 3.3, the spatial distribution of YSOs shows SF activities toward the inverted Y-like structure. Noticeable YSOs are found toward the common zones of the elongated clouds. Furthermore, very strong SF activities are found toward the northern end of the structure containing AFGL 5142, where the clustering of YSOs is spatially extended within a scale of 3 pc (see Section 3.3 and also Figure 12a). In the direction of AFGL 5142, the embedded cluster is identified at the overlapping area of the two clouds around 1.5 and 4.5 km s*-1* (see Figure 12a). The observed velocity separation of the two clouds is about 3 km s*-1*. With the existing data sets, it is not possible to know the exact viewing angle of the collision. Hence, the viewing angle of the collision to the line of sight is assumed to be 45 in this paper. We have found the collision length-scale (lfcs) to be 4.2 pc (= 3.0 pc/sin(45)), while the observed relative velocity () is estimated to be 4.2 km s*-1* (= 3 km s*-1*/cos(45)). Using the value of lfcs and , one can compute the time-scale of the accumulation of material at the collision points or the collision time-scale (see equation 2 in Henshaw et al. (2013) and also McKee & Ostriker (2007)), which is given by
[TABLE]
where, lfcs and are defined earlier, nprec is the mean density of pre-collision region, and npstc is the mean density of post-collision region. In this paper, the exact ratio of the mean densities of the pre- and post-collision regions is unknown. Hence, we adopt a range of the ratios of densities (i.e. 0.5–10) then a range of the typical collision timescales is computed to be 1–20 Myr. Previously observed 6.7-GHz methanol maser also indicates the presence of early phase of massive SF ( 0.1 Myr) in AFGL 5142 (e.g., Liu et al., 2016). Considering the mean ages of Class I and Class II YSOs of 0.44 Myr and 1–3 Myr, respectively (Evans et al., 2009), we find that the collision timescale is old enough to influence the formation of the youngest protostars and/or massive star(s) in our selected target field. The dynamical time of the high-velocity CO outflows and the EWBO was also computed to be 104 yr (e.g., Zhang et al., 2007; Liu et al., 2016). The results presented by Liu et al. (2016) accordingly indicate the existence of the earliest stages of SF in AFGL 5142. Hence, all these observational clues favour the onset of filament-filament collision in our target site, which seems to explain SF history in the site AFGL 5142. This process might have also influenced the formation of massive star(s) in the site AFGL 5142. In the literature, we have also found some other star-forming sites (such as, W33A (Galván-Madrid et al., 2010), Serpens (Duarte-Cabral et al., 2011; Nakamura et al., 2014), L1641-N (Nakamura et al., 2012), Rosette Nebula (Schneider et al., 2012), Infrared dark cloud G035.3900.33 (Henshaw et al., 2013), and Sh 2-237 (Dewangan et al., 2017a)), where the origin of young stellar cluster is explained by the collision/interaction of filaments.
In a wide-scale area around AFGL 5142, high-resolution molecular line data will be helpful to further examine the collision/interaction process of filaments.
5. Summary and Conclusions
In this paper, to understand the ongoing physical mechanism, we have examined a large-scale environment (area 25 pc 20 pc) around a star-forming site, AFGL 5142. The present work is carried out using the multi-wavelength data sets spanning radio to NIR wavelengths, which have allowed us to study the gas and dust in the direction of our target source. The major observational results derived in this paper are given below:
An inverted Y-like structure (major axis 19 pc) is investigated in the Herschel column density map, and the total of mass of this structure is determined to be 6280 M*⊙*. At least two elongated filaments (having lengths 10 pc) are identified in the direction of the inverted Y-like structure.
One elongated filament overlaps other one at many parts, where column densities are found to be larger than 4.5 1021 cm*-2*. In the Herschel temperature map, these filaments show a temperature range of 12.5–13.5 K.
Based on the analysis of the 12CO and 13CO line data, molecular gas toward the inverted Y-like structure is studied in a velocity range of [8, 0] km s*-1*. Two elongated cloud components (around 1.5 and 4.5 km s*-1*) are also found toward the inverted Y-like structure, and are also linked in the velocity space.
First moment maps of 12CO and 13CO also exhibit the spatial overlapping of the two elongated filamentary cloud components along the line of sight. The morphology of the inverted Y-like structure can be explained by a combination of two different elongated filamentary clouds having a velocity separation of 3 km s*-1*. These results are also supported by the distribution of the cold H i gas. In other words, the inverted Y-like structure seems to contain a pair of intertwined filaments.
With the knowledge of the infrared-excess sources, SF activities are found toward the inverted Y-like structure. The northern end of the structure contains AFGL 5142, where a cluster of YSOs is distributed within a scale of 3 pc. In the direction of this cluster, a very high value of surface density of YSOs (i.e., 5–240 YSOs pc*-2*) is found. It suggests very intense ongoing SF activities (including massive star(s)) toward AFGL 5142, which is also located at one of the common zones of the two elongated clouds. Furthermore, noticeable YSOs are also seen toward the overlapping zones of the two clouds within the inverted Y-like structure.
Based on these observational outcomes, we propose a scenario of collision/interaction of two elongated filamentary clouds or flows in the site AFGL 5142, which may have triggered SF (including massive star(s)) in the site.
We thank the anonymous reviewer for several useful comments and suggestions. The research work at Physical Research Laboratory is funded by the Department of Space, Government of India. This work is based on data obtained as part of the UKIRT Infrared Deep Sky Survey. This publication made use of data products from the Two Micron All Sky Survey (a joint project of the University of Massachusetts and the Infrared Processing and Analysis Center / California Institute of Technology, funded by NASA and NSF), archival data obtained with the Spitzer Space Telescope (operated by the Jet Propulsion Laboratory, California Institute of Technology under a contract with NASA). The Canadian Galactic Plane Survey (CGPS) is a Canadian project with international partners. The Dominion Radio Astrophysical Observatory is operated as a national facility by the National Research Council of Canada. The Five College Radio Astronomy Observatory CO Survey of the Outer Galaxy was supported by NSF grant AST 94-20159. The CGPS is supported by a grant from the Natural Sciences and Engineering Research Council of Canada (NSERC). TB acknowledges funding from the National Natural Science Foundation of China through grant 11633005 and, support from the China Postdoctoral Foundation through grant 2018M631241. RD acknowledges CONACyT(México) for SNI grant (CVU 555629).
The reference list from the paper itself. Each links out to its DOI / PubMed record.
- 1André et al. (2010) André, P., Men’shchikov, A., Bontemps, S., et al. 2010, A&A, 518, L 102
- 2André et al. (2014) André, P., Di Francesco, J., Ward-Thompson, D., et al. 2014, in Protostars and Planets VI, ed. H. Beuther et al. (Tucson, AZ; Univ. Arizona Press), 27
- 3Baker & Burton (1979) Baker, P., L., & Burton, W., B. 1979, A&AS, 35, 129
- 4Baug et al. (2015) Baug, T., Ojha, D. K., Dewangan, L. K., et al. 2015, MNRAS, 454, 4335
- 5Benjamin et al. (2003) Benjamin, R. A.,Churchwell, E., Babler, B. L., et al. 2003, PASP, 115, 953
- 6Bressert et al. (2010) Bressert, E., Bastian, N., Gutermuth, R., et al. 2010, MNRAS, 409, 54
- 7Burns et al. (2017) Burns, R. A., Handa, T., Imai, H., et al. 2017, MNRAS, 467, 2367
- 8Brunt (2004) Brunt C., 2004, in Clemens D., Shah R., Brainerd T., eds, Proc. of ASP Conference 317. Milky Way Surveys: The Structure and Evolution of our Galaxy, p. 79