TL;DR
This paper presents an exponential smoothing approach to accurately predict missing GPS-derived PWV measurements, effectively capturing seasonal patterns and achieving low error rates for short-term forecasts.
Contribution
The study introduces a novel application of exponential smoothing for filling missing PWV data, improving accuracy in atmospheric remote sensing applications.
Findings
Root mean square error of 0.1 mm at 15-minute lead time
Effective capture of seasonal variability in PWV data
Successful prediction with 30 hours of past data
Abstract
Global Positioning System (GPS) derived precipitable water vapor (PWV) is extensively being used in atmospheric remote sensing for applications like rainfall prediction. Many applications require PWV values with good resolution and without any missing values. In this paper, we implement an exponential smoothing method to accurately predict the missing PWV values. The method shows good performance in terms of capturing the seasonal variability of PWV values. We report a root mean square error of 0.1~mm for a lead time of 15 minutes, using past data of 30 hours measured at 5-minute intervals.
Click any figure to enlarge with its caption.
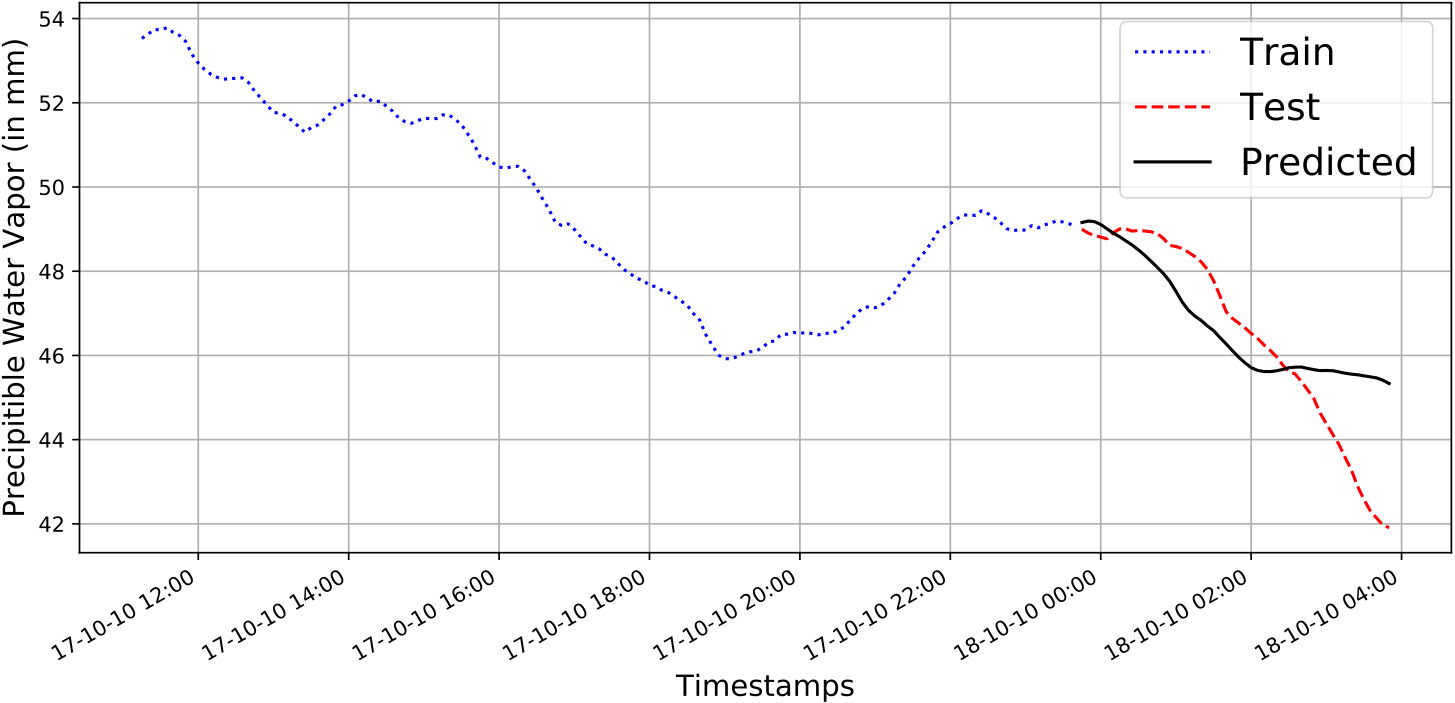 Figure 1
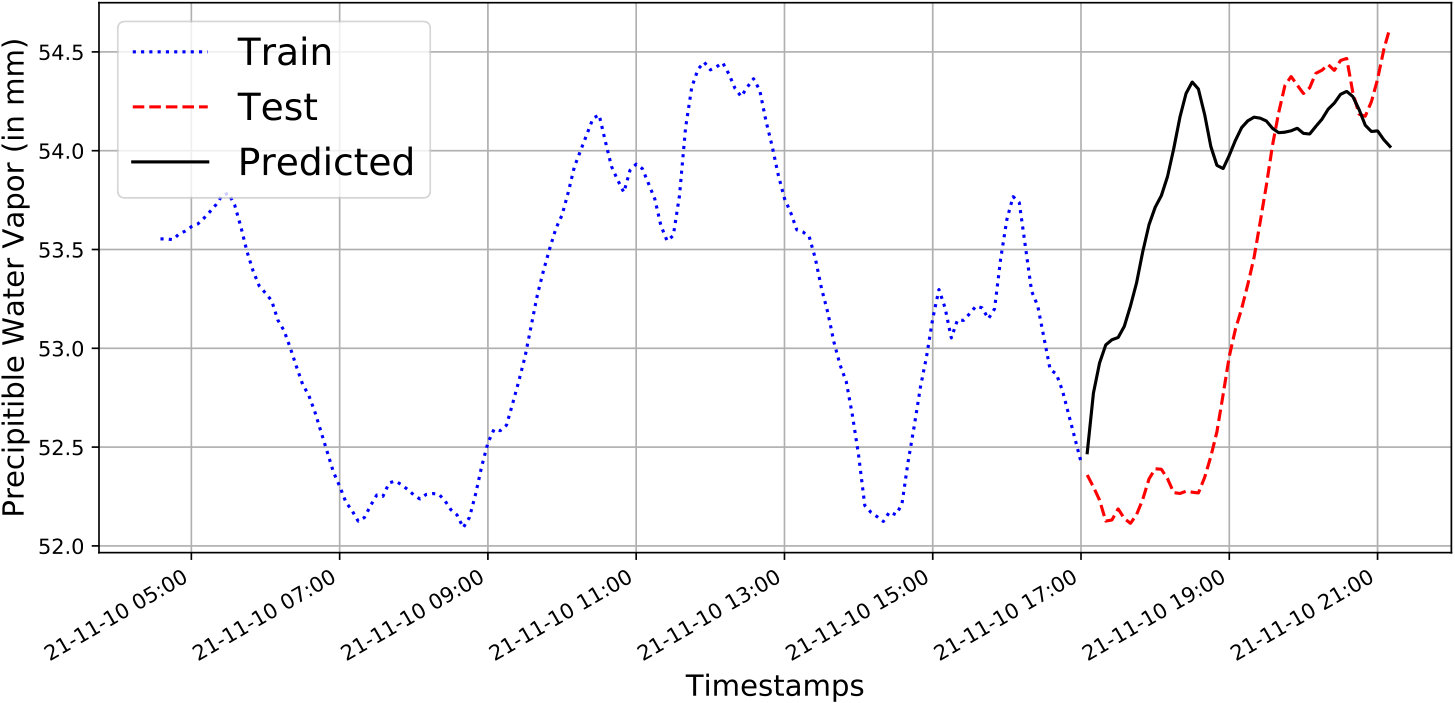 Figure 2
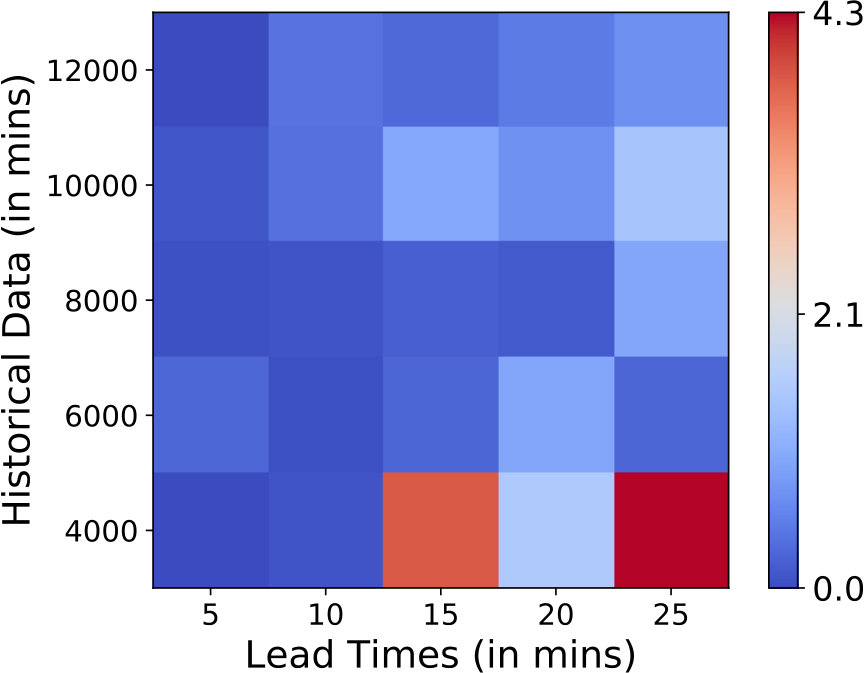 Figure 3
| Lead Time | Proposed | Persistence | Average |
|---|---|---|---|
| 5 min | 0.061 | 0.086 | 10.433 |
| 10 min | 0.078 | 0.144 | 9.525 |
| 15 min | 0.101 | 0.259 | 7.028 |
Peer Reviews
No public reviews on file for this paper yet. If you reviewed it on a platform where reviews are public (OpenReview, ICLR, NeurIPS, ICML), you can paste yours below so the community can read it here.
Code & Models
Videos
No videos yet. Explain this paper in a talk, walkthrough, or lecture? Add one.
Predicting GPS-based PWV Measurements
Using Exponential Smoothing
Shilpa Manandhar*†1, Soumyabrata Dev†*3, Yee Hui Lee1, and Stefan Winkler4 † Authors contributed equally.Send correspondence to Y. H. Lee, E-mail: [email protected]. 1 School of Electrical and Electronic Engineering, Nanyang Technological University (NTU), Singapore
3 ADAPT SFI Research Centre, Trinity College Dublin, Ireland
4 School of Computing, National University of Singapore (NUS)
Abstract
Global Positioning System (GPS) derived precipitable water vapor (PWV) is extensively being used in atmospheric remote sensing for applications like rainfall prediction. Many applications require PWV values with good resolution and without any missing values. In this paper, we implement an exponential smoothing method to accurately predict the missing PWV values. The method shows good performance in terms of capturing the seasonal variability of PWV values. We report a root mean square error of 0.1 mm for a lead time of 15 minutes, using past data of 30 hours measured at 5-minute intervals.
I Introduction
Precipitable water vapor (PWV) values are an indicator of moisture content in the atmosphere and exhibit good correlation with rainfall events. There is a growing trend of using the PWV values derived from Global Positioning System (GPS) in detection and/or prediction of a rainfall event [1, 2]. There are algorithms reported in the literature which predict rainfall events with lead times starting from minutes up to hours. The prediction window is affected by the resolution and availability of the GPS-PWV data. Generally, GPS-PWV values can be derived with a resolution of minutes [3]. However, there are missing PWV values at certain hours. In this paper, we address this issue of missing PWV values, by proposing a method to predict the PWV values based on the past PWV values.
II GPS-based PWV Measurements
II-A Computing PWV
In this section, we briefly mention the methods to calculate PWV values from GPS measurements. The GPS signals are effected by two main delays in the troposphere layer of the atmosphere. They are Zenith Hydrostatic Delay () and Zenith Wet Delay (). Out of these two delays, is due to the water vapor content of the atmosphere. Therefore, PWV is derived from the as shown by Eqs. (1,2) [4].
[TABLE]
[TABLE]
where is the latitude, is day-of-year, for stations from the northern hemisphere and for the southern hemisphere. , where H is the station height, which can be ignored for stations below m in altitude. In this paper, the values are processed using the GIPSY OASIS software for a tropical IGS GPS station, ID: NTUS (*∘N, ∘*E), with a temporal resolution of minutes.
II-B Predicting PWV Values
Suppose , , …, indicate the PWV values measured up to time . We use triple exponential smoothing (TES) [5] to model the seasonal variations of the PWV values. The principal idea behind triple exponential smoothing is to apply exponential weights on the observations, with more weightage on recent observations. The TES weights are assigned on the level, trend and seasonal components of the time series. We use the minute interval PWV values in the form of time series data, and use only the historical PWV values to predict the future PWV values after time . The future PWV values are modelled as:
[TABLE]
where is the length of a season, is the smoothed version of the constant part of observation, is the best estimate of the linear trend, and is the series of seasonal corrections. We benchmark our proposed method with two popular forecasting techniques – persistence model and average model. The persistence model assumes that the forecasted PWV value remains constant as the latest PWV value, and is modelled as . The average model works under the assumption that the future PWV values is the same as the average of the historical PWV values. It is modelled as .
III Results & Discussions
In this section, we provide a detailed analysis 111The code of all simulations in this paper is available online at https://github.com/Soumyabrata/predicting-pwv. of the forecasting of PWV values using exponential smoothing. The PWV values for the year are computed for our chosen station ID NTUS.
III-A Qualitative Evaluation
Our proposed method can efficiently capture the seasonal variation of the PWV values, and provide a foundation for short- and long- term forecasting. Figure 1 shows sample illustrations of the accuracy of PWV prediction. We use historical data of hours to predict the future PWV values. We observe that our proposed technique can capture the trend of the future PWV values accurately.
III-B Quantitative Evaluation
We use the Root Mean Square Error (RMSE) between the measured and predicted PWV values, in order to provide an objective evaluation of our proposed method. The performance of the prediction is dependent on two primary factors – the amount of historical data that is considered for training the time series model, and the length of lead times to the forecast data. We use a varying range of historical data and lead times, in order to understand the impact of these variables on the forecasting performance. Figure 2 shows the impact of these two independent variables.
The corresponding error is color coded for a particular value of historical data and lead time. We repeat this experiment times for a chosen value of the two variables, in order to reduce any sampling bias. We observe that the error gradually increases with a lower value of historical data, and larger value of lead time. This makes sense as high amount of training data is required to model the seasonality properly, and the error accumulates as we predict higher lead times.
As a final comparison, we benchmark our proposed method with two popular baseline models, namely persistence and average. Table I reports the average RMSE values (in mm) of the different methods in our dataset. We observe that the average model performs very poorly. Our proposed method shows a consistent improvement over the persistence model. This is due to the fact that PWV values remain fairly constant for shorter lead times. The forecasting performance can be further improved by incorporating other sensor data in addition to historical PWV values.
IV Conclusion & Future Work
This paper applies an exponential smoothing method for predicting future PWV values using past PWV data. The exponential method shows better performance compared to the two other techniques. The RMSE values increase with longer lead time and less historical data. In future work, other meteorological data [6] will be included for a better prediction of PWV values.
The reference list from the paper itself. Each links out to its DOI / PubMed record.
- 1[1] S. Manandhar, Y. H. Lee, Y. S. Meng, F. Yuan, and J. T. Ong, “GPS derived PWV for rainfall nowcasting in tropical region,” IEEE Trans. Geosci. Remote Sens. , vol. 56, no. 8, pp. 4835–4844, Aug 2018.
- 2[2] S. Manandhar, S. Dev, Y. H. Lee, Y. S. Meng, and S. Winkler, “A data-driven approach to detecting precipitation from meteorological sensor data,” in Proc. International Geoscience and Remote Sensing Symposium (IGARSS) , 2018.
- 3[3] S. Manandhar, S. Dev, Y. H. Lee, and Y. S. Meng, “On the importance of PWV in detecting precipitation,” in 2018 USNC-URSI Radio Science Meeting (Joint with AP-S Symposium) . IEEE, 2018, pp. 89–90.
- 4[4] S. Manandhar, Y. H. Lee, Y. S. Meng, and J. T. Ong, “A simplified model for the retrieval of precipitable water vapor from GPS signal,” IEEE Trans. Geosci. Remote Sens. , vol. 55, no. 11, pp. 6245–6253, Nov 2017.
- 5[5] E. S. Gardner, “Exponential smoothing: The state of the art,” Journal of forecasting , vol. 4, no. 1, pp. 1–28, 1985.
- 6[6] S. Dev, S. Manandhar, Y. H. Lee, and S. Winkler, “Multi-label cloud segmentation using a deep network,” in Proc. IEEE AP-S Symposium on Antennas and Propagation and USNC-URSI Radio Science Meeting , 2019.
