Amplitude Analysis and Branching Fraction Measurement of $D^0\rightarrow K^-\pi^+\pi^0\pi^0$
BESIII Collaboration: M. Ablikim, M. N. Achasov, P. Adlarson, S., Ahmed, M. Albrecht, M. Alekseev, A. Amoroso, F. F. An, Q. An, Y. Bai, O., Bakina, R. Baldini Ferroli, I. Balossino Balossino, Y. Ban, K. Begzsuren, J., V. Bennett, N. Berger, M. Bertani, D. Bettoni, F. Bianchi

TL;DR
This paper presents the first amplitude analysis and precise branching fraction measurement of the decay D^0→K^-π^+π^0π^0 using BESIII data, revealing sub-structures and intermediate process contributions.
Contribution
It introduces the first amplitude analysis of this decay mode and provides an accurate measurement of its branching fraction, enhancing understanding of D^0 decay dynamics.
Findings
Branching fraction measured as (8.86 ± 0.13(stat) ± 0.19(syst))%
Identified sub-structures and intermediate processes in the decay
Provided relative fractions and phases among decay components
Abstract
Utilizing the dataset corresponding to an integrated luminosity of fb at GeV collected by the BESIII detector, we report the first amplitude analysis and branching fraction measurement of the decay. We investigate the sub-structures and determine the relative fractions and the phases among the different intermediate processes. Our results are used to provide an accurate detection efficiency and allow measurement of .
Click any figure to enlarge with its caption.
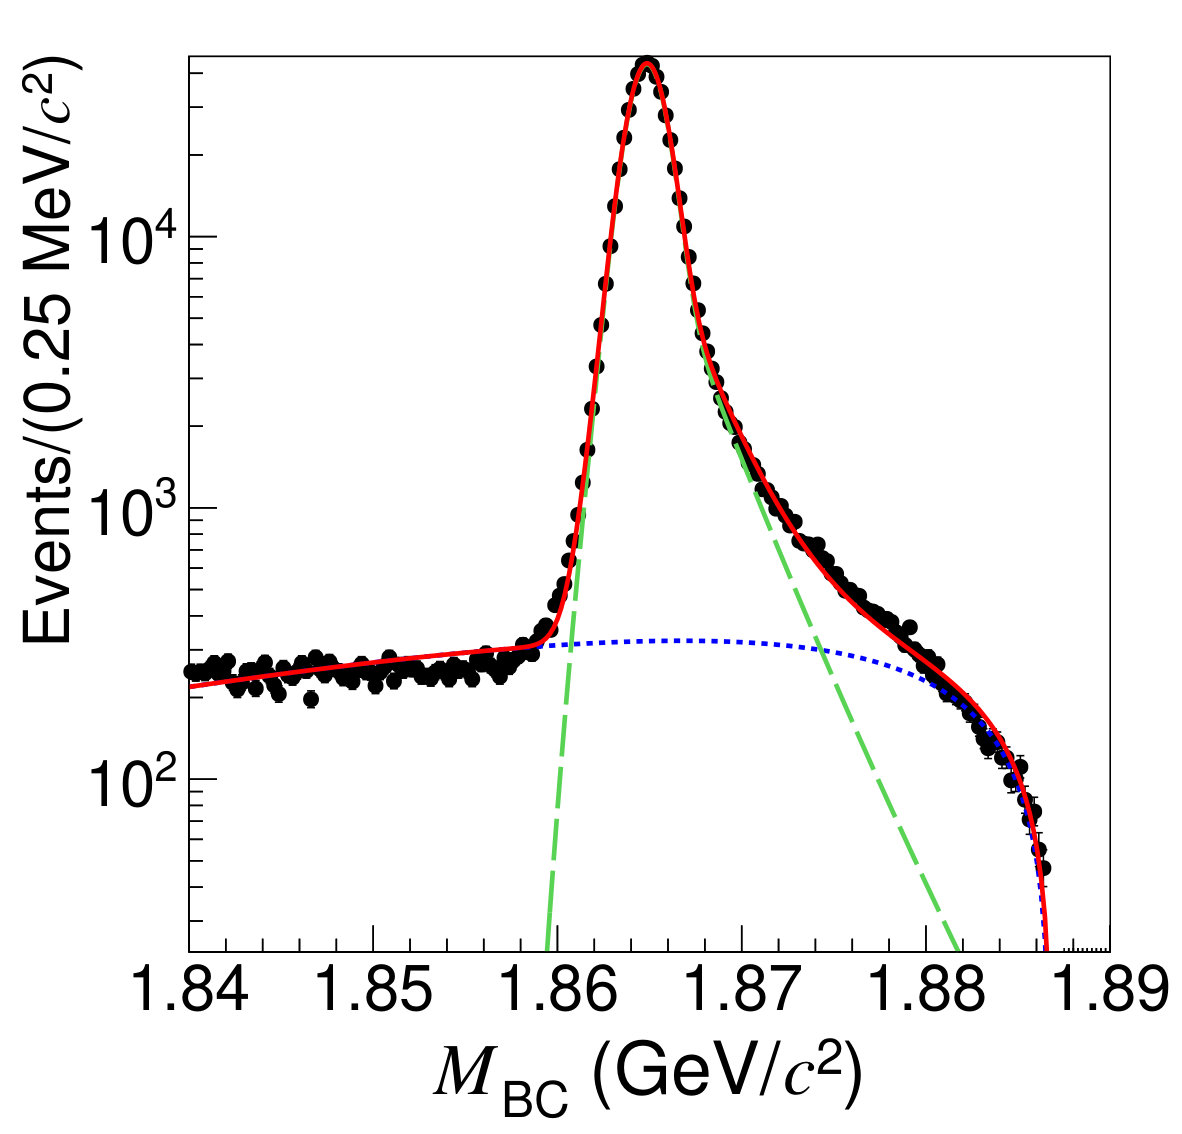 Figure 1
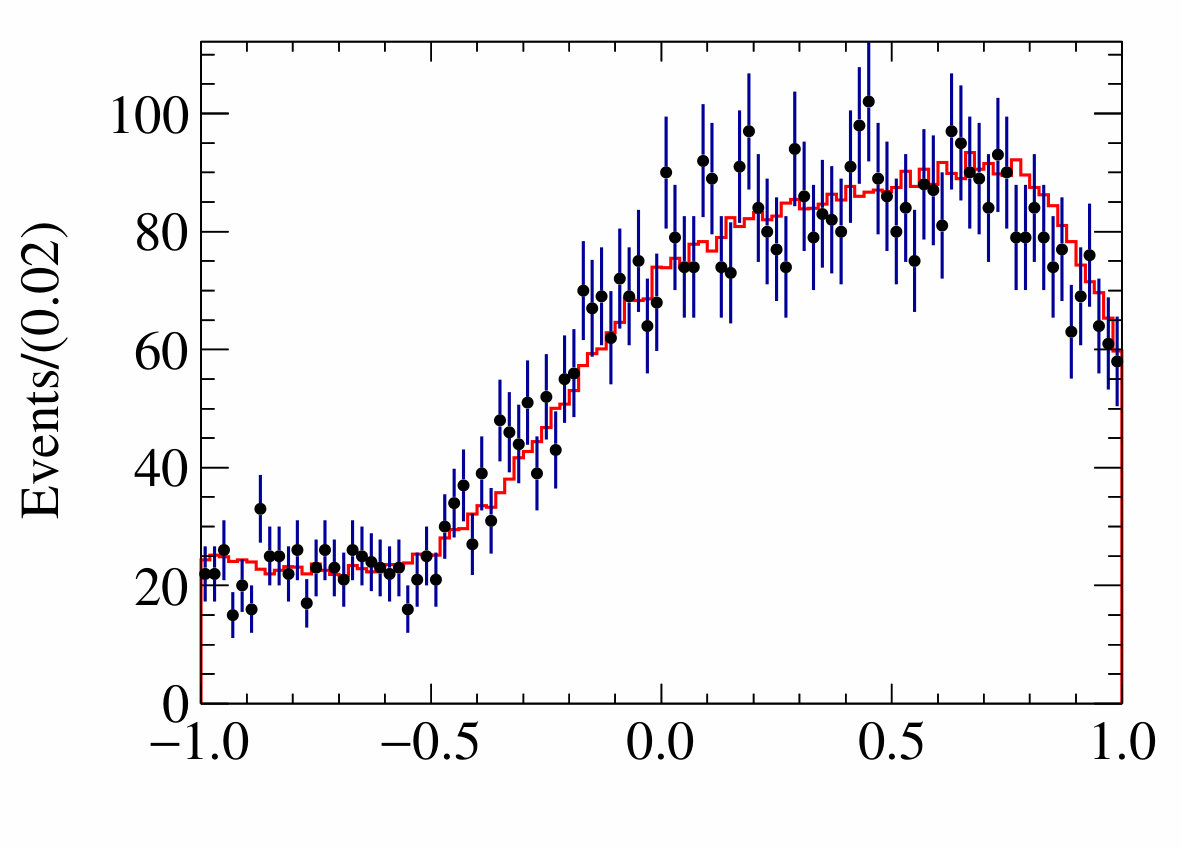 Figure 2
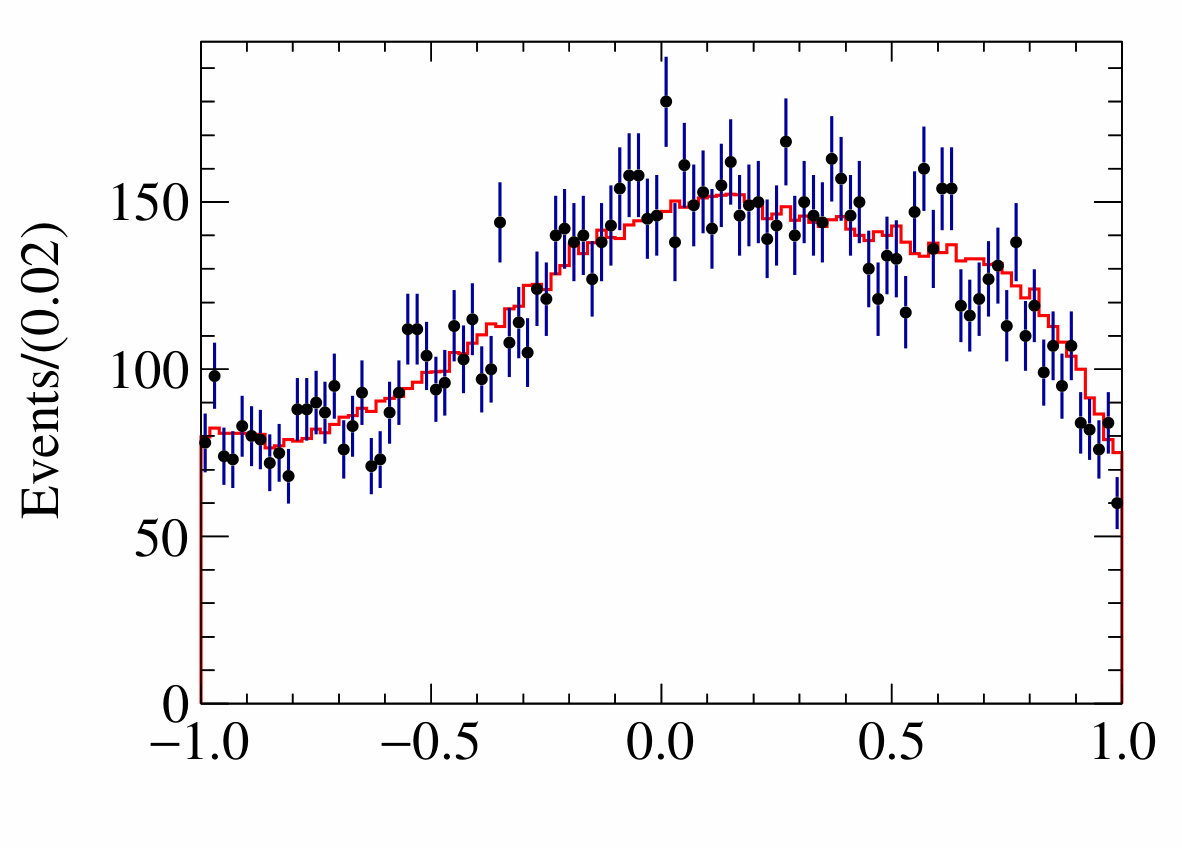 Figure 3
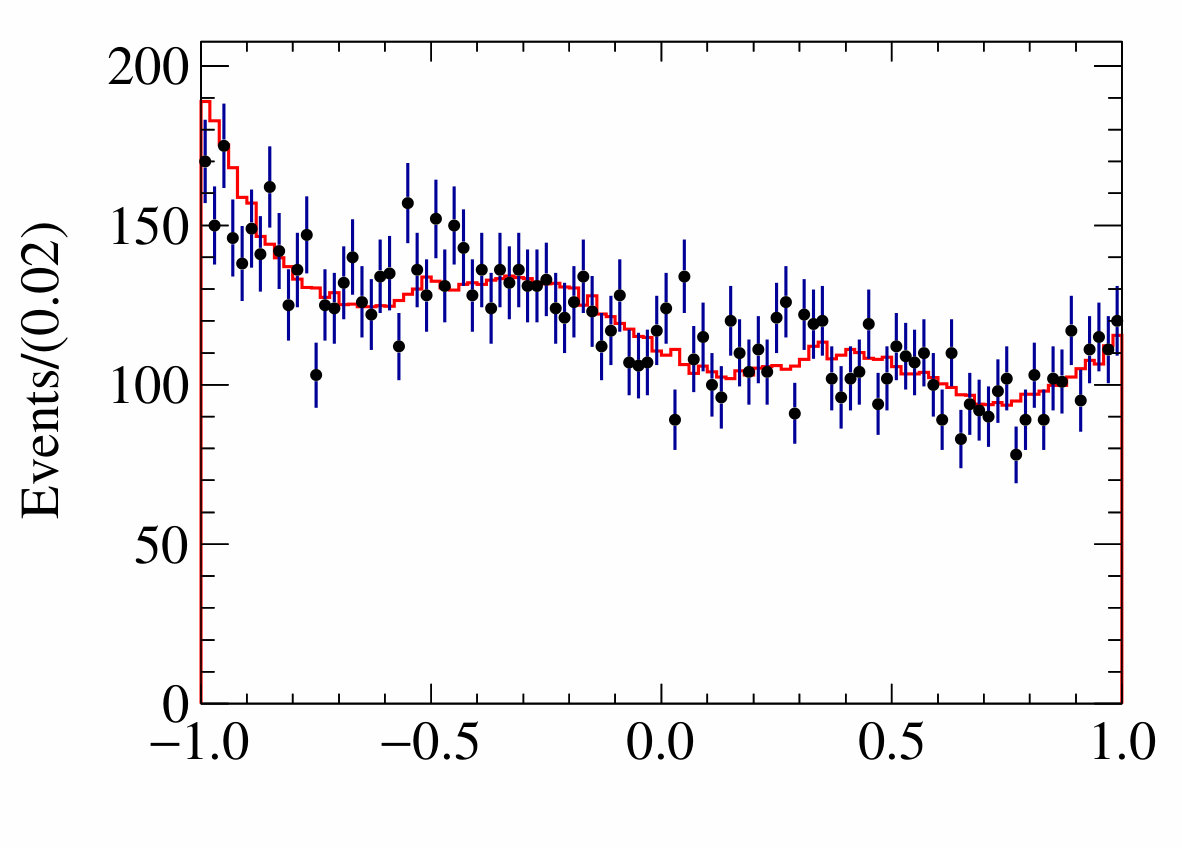 Figure 4
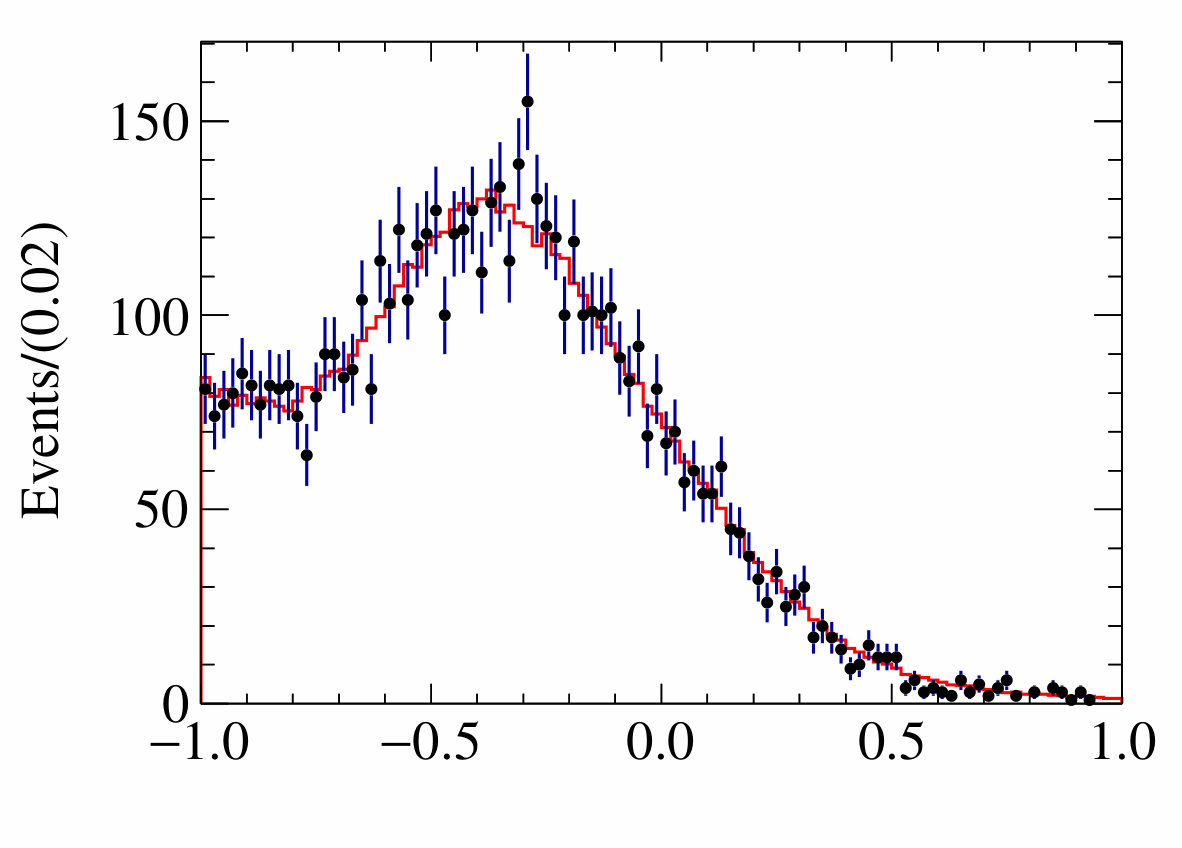 Figure 5
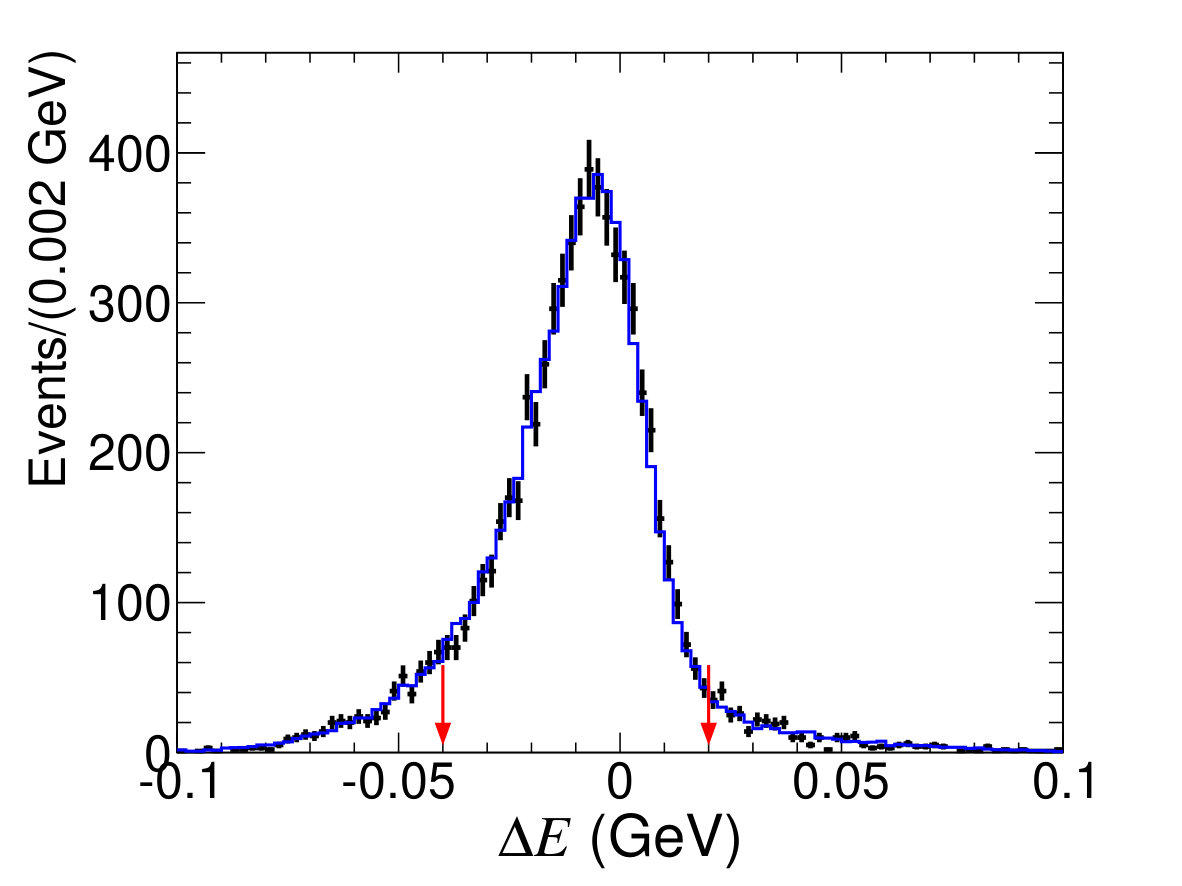 Figure 6
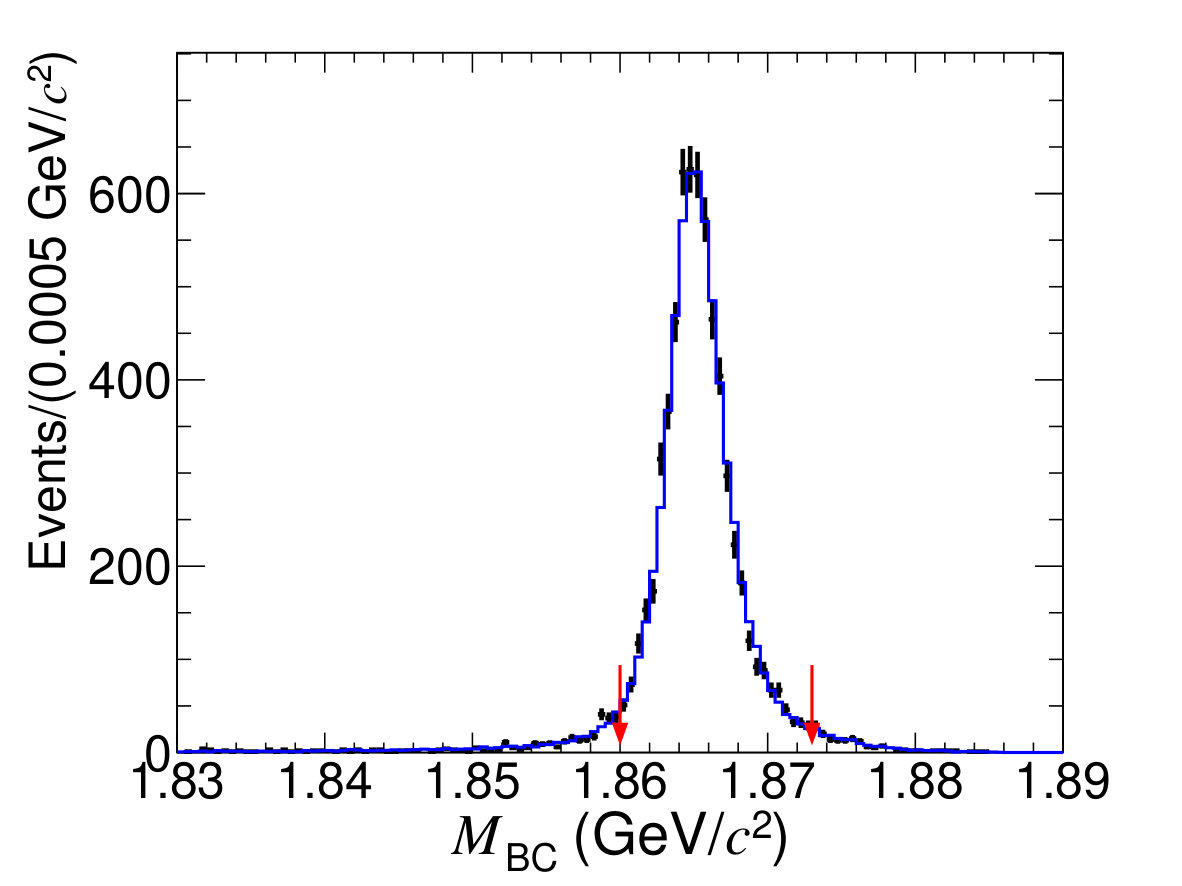 Figure 7
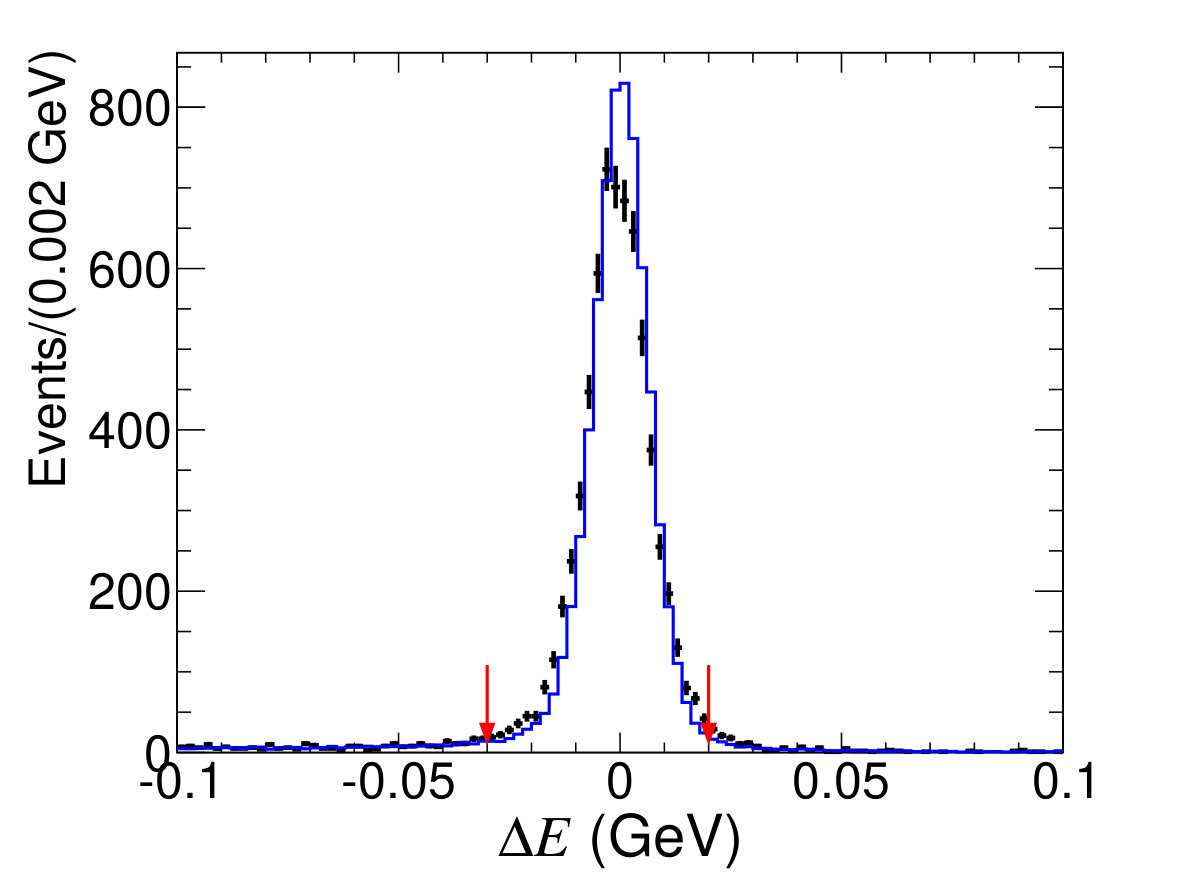 Figure 8
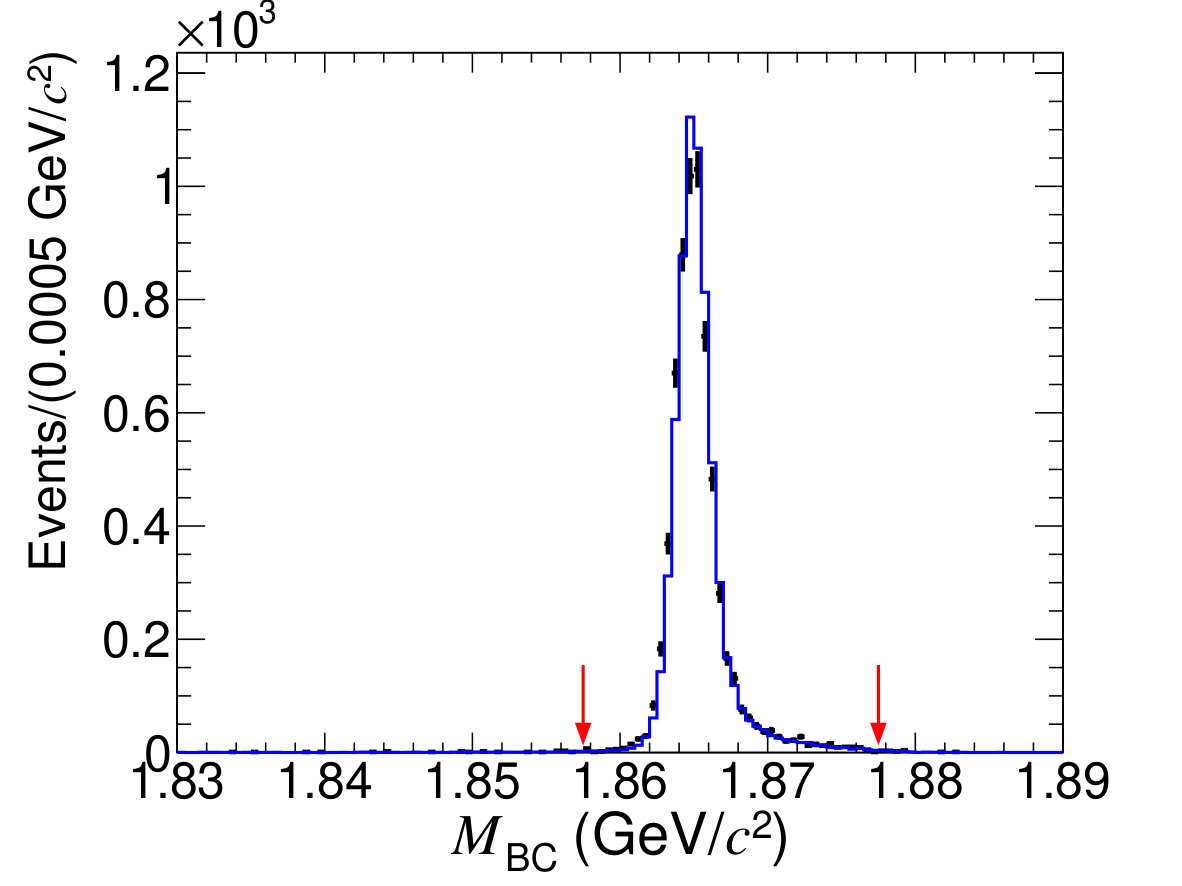 Figure 9
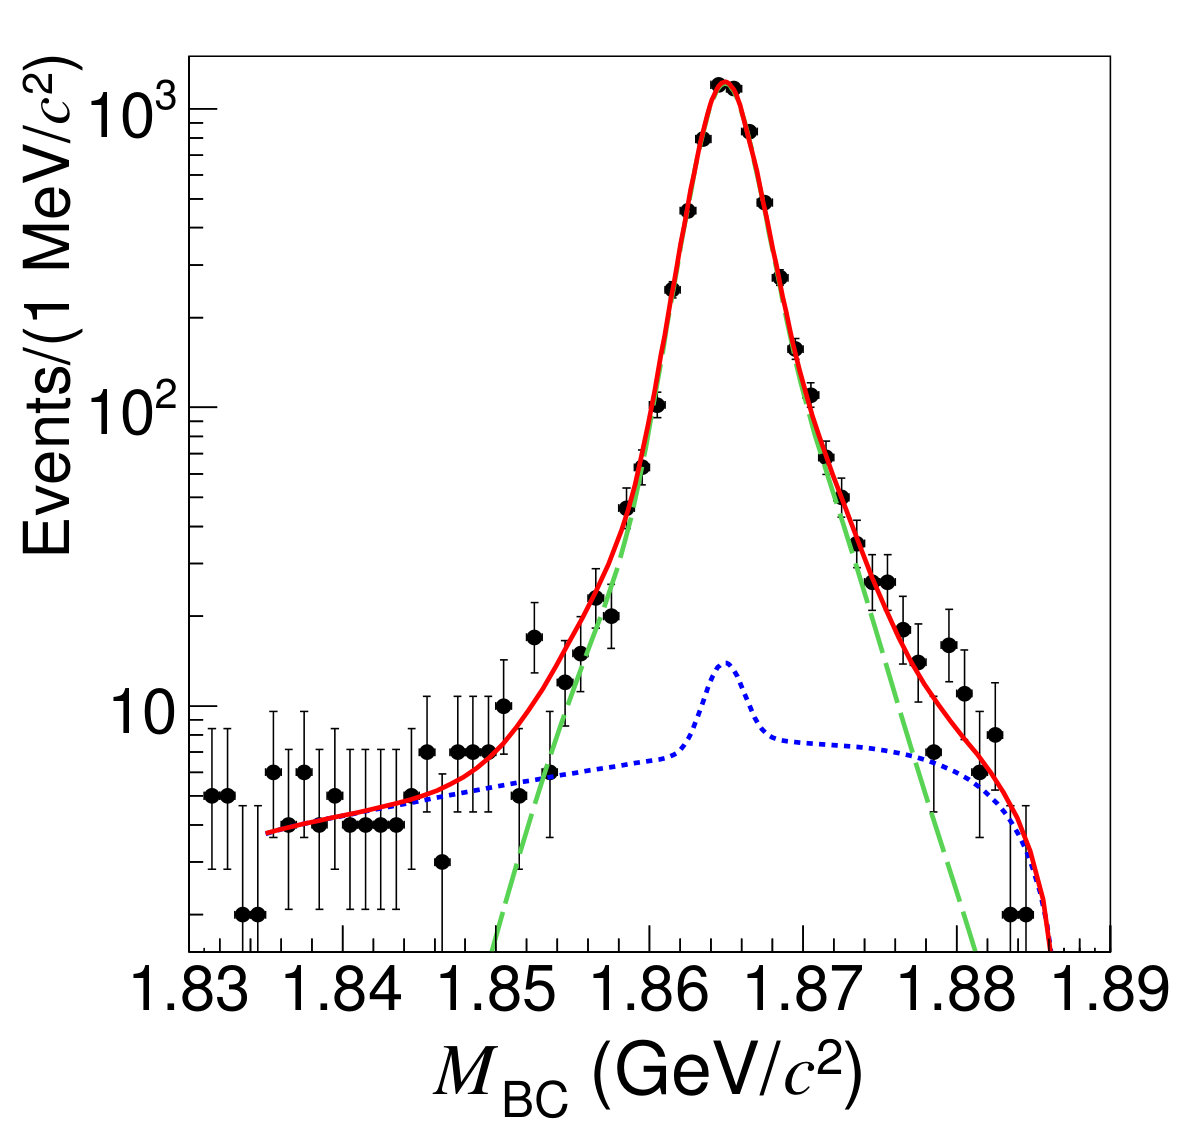 Figure 10
 Figure 11
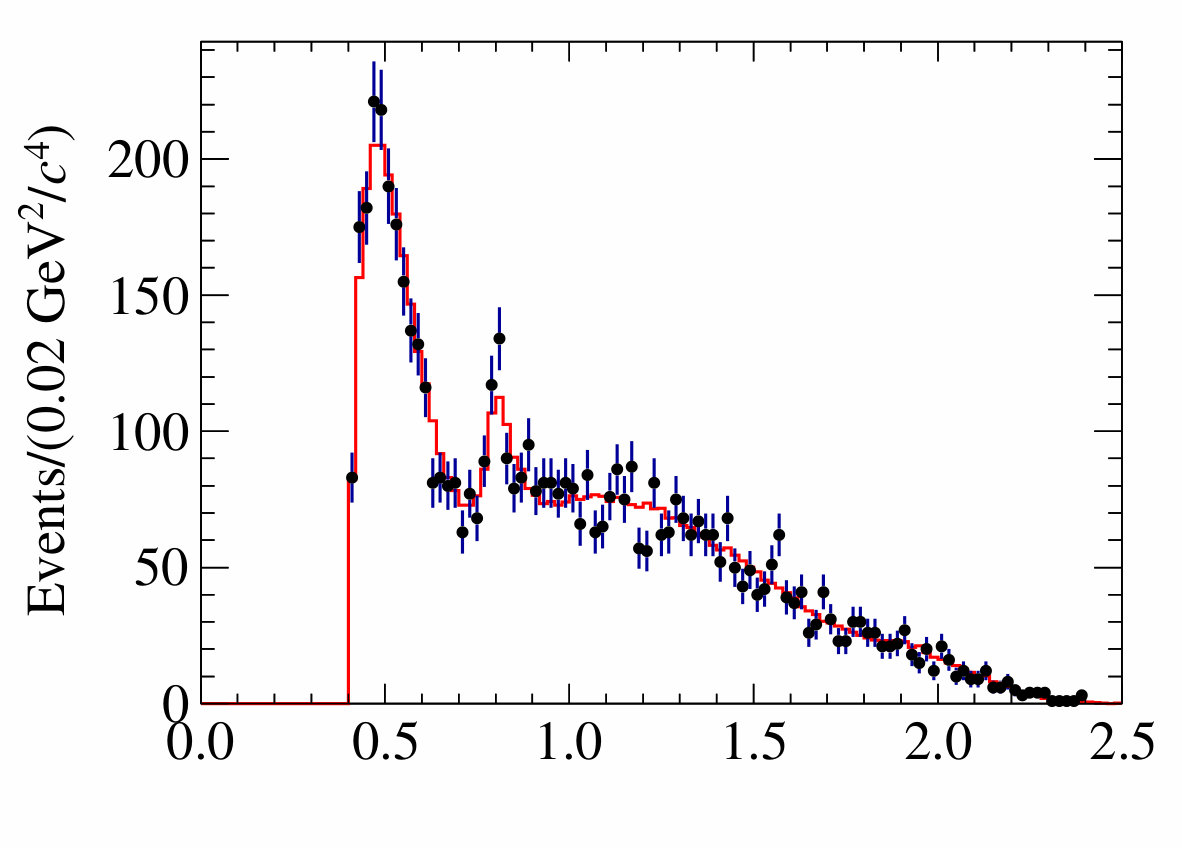 Figure 12
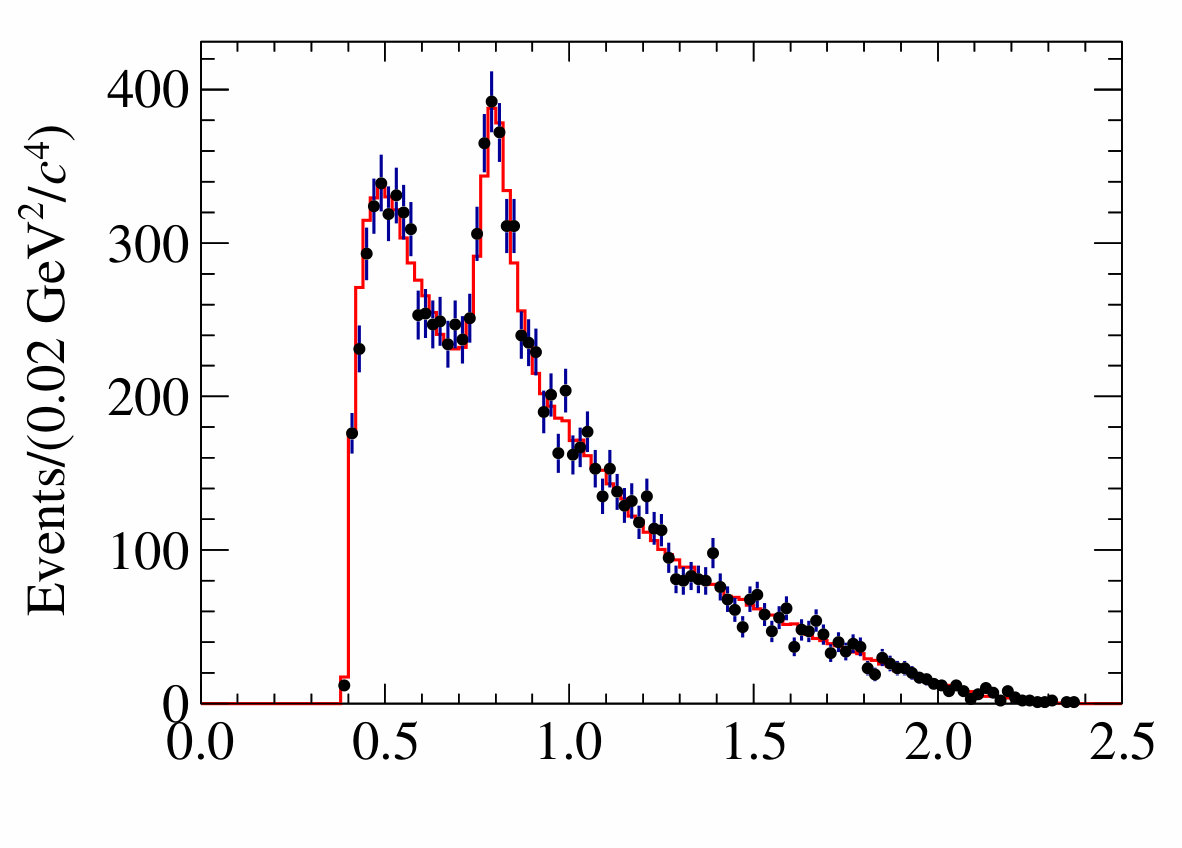 Figure 13
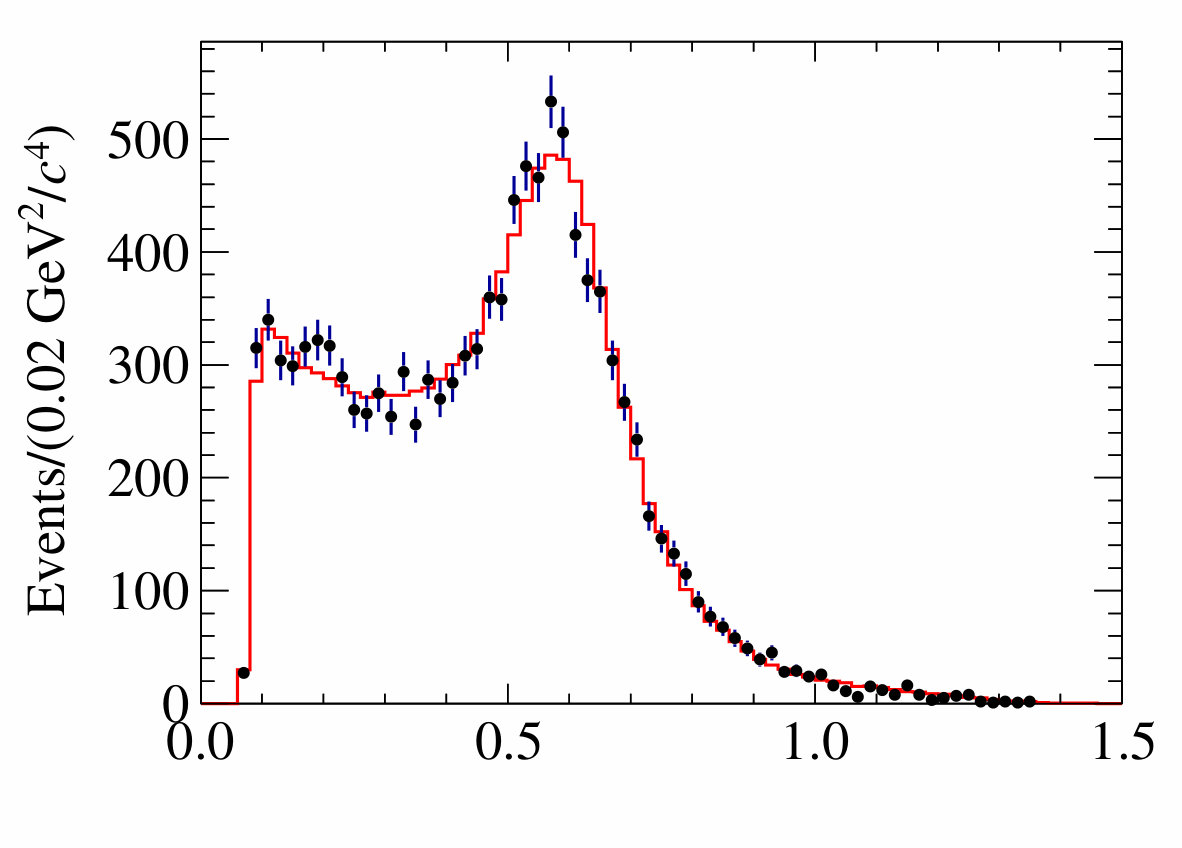 Figure 14
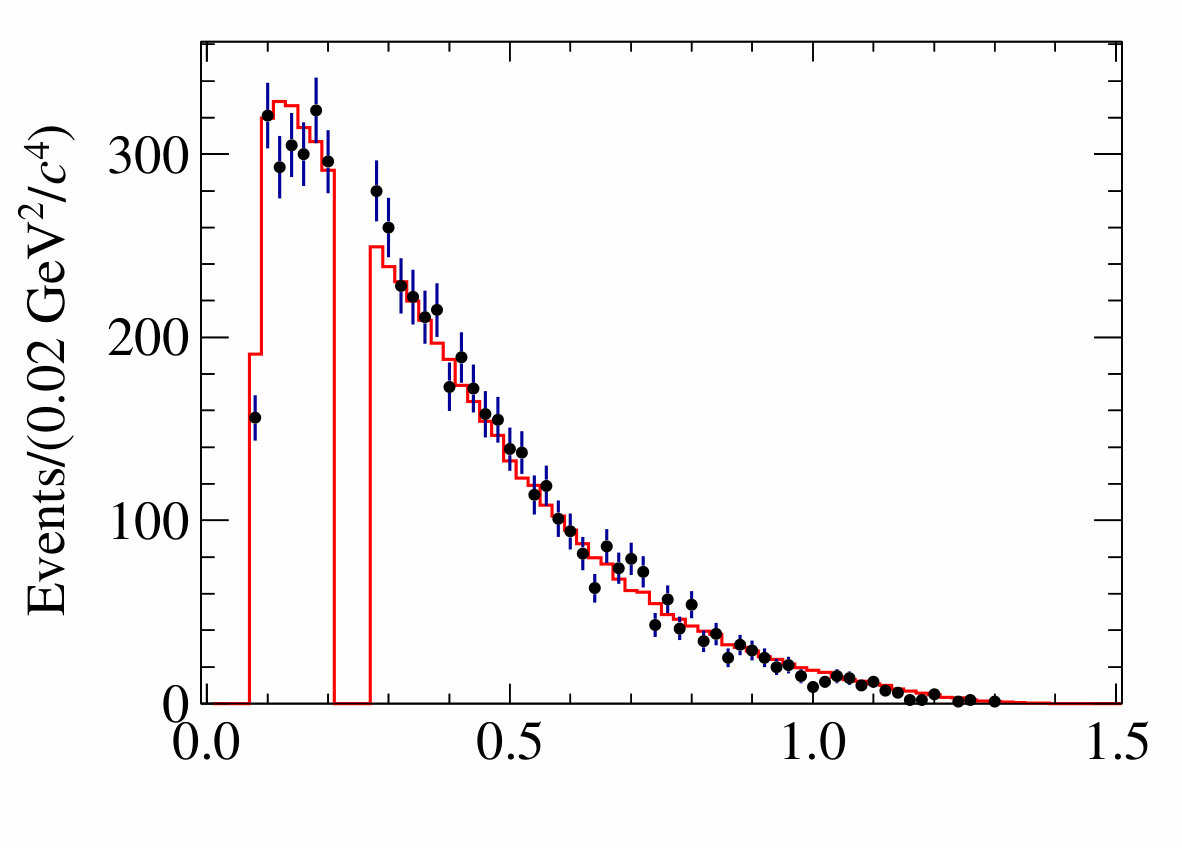 Figure 15
| Decay chain | |
|---|---|
| (GeV/) | |
|---|---|
| (GeV) | |
| 1(fixed) | |
| Amplitude mode | FF | Phase | Significance |
|---|---|---|---|
| (fixed) | |||
| TOTAL |
| Amplitude mode | I | II | III | IV | Total |
|---|---|---|---|---|---|
| 1.518 | 1.258 | 0.072 | 0.235 | 1.987 | |
| 1.524 | 0.835 | 0.078 | 0.004 | 1.740 | |
| 1.293 | 0.436 | 0.030 | 0.363 | 1.412 | |
| 0.938 | 0.368 | 0.024 | 0.284 | 1.046 | |
| 1.643 | 1.175 | 0.160 | 0.182 | 2.035 | |
| 1.562 | 0.567 | 0.034 | 0.036 | 1.662 | |
| 0.989 | 0.541 | 0.035 | 0.068 | 1.201 | |
| 0.713 | 0.221 | 0.098 | 0.172 | 0.772 | |
| 1.253 | 1.254 | 0.076 | 0.237 | 1.790 | |
| 1.145 | 0.524 | 0.022 | 0.162 | 1.278 | |
| 0.865 | 1.468 | 0.052 | 0.106 | 1.708 | |
| 1.249 | 0.812 | 0.084 | 0.186 | 1.504 | |
| 1.377 | 0.372 | 0.102 | 0.164 | 1.439 | |
| 1.308 | 0.252 | 0.070 | 0.476 | 1.416 | |
| 0.381 | 0.549 | 0.023 | 0.166 | 0.689 | |
| 0.880 | 0.417 | 0.078 | 0.232 | 1.005 | |
| 0.688 | 0.752 | 0.033 | 0.273 | 1.056 | |
| 0.980 | 1.354 | 0.059 | 0.371 | 1.713 | |
| 0.425 | 0.506 | 0.031 | 0.348 | 0.747 | |
| 1.365 | 0.598 | 0.049 | 0.398 | 1.543 | |
| 0.695 | 1.223 | 0.027 | 0.140 | 1.414 | |
| 1.335 | 0.848 | 0.237 | 0.401 | 1.649 | |
| 0.751 | 0.894 | 0.049 | 0.074 | 1.171 | |
| 0.818 | 0.443 | 0.046 | 0.211 | 0.955 | |
| 1.171 | 0.936 | 0.084 | 0.273 | 1.528 | |
| 0.803 | 0.188 | 0.068 | 0.018 | 0.828 |
| Amplitude mode | I | II | III | IV | Total |
|---|---|---|---|---|---|
| 3.137 | 0.093 | 0.043 | 0.030 | 3.139 | |
| 2.330 | 0.850 | 0.044 | 0.109 | 2.483 | |
| 0.000 | 0.000 | 0.000 | 0.000 | 0.000 | |
| 1.194 | 0.761 | 0.081 | 0.479 | 1.497 | |
| 0.953 | 0.820 | 0.054 | 0.124 | 1.264 | |
| 1.051 | 0.556 | 0.029 | 0.565 | 1.316 | |
| 1.002 | 0.483 | 0.045 | 0.121 | 1.120 | |
| 2.007 | 0.188 | 0.079 | 0.847 | 2.188 | |
| 1.208 | 0.706 | 0.048 | 0.455 | 1.472 | |
| 1.711 | 0.365 | 0.053 | 0.214 | 1.750 | |
| 1.501 | 0.605 | 0.051 | 0.187 | 1.630 | |
| 1.195 | 0.613 | 0.133 | 0.611 | 1.482 | |
| 2.039 | 0.410 | 0.045 | 0.446 | 2.127 | |
| 3.159 | 0.471 | 0.053 | 0.216 | 3.201 | |
| 1.207 | 0.258 | 0.045 | 0.156 | 1.245 | |
| 0.938 | 0.476 | 0.062 | 0.116 | 1.060 | |
| 1.260 | 0.471 | 0.032 | 0.490 | 1.432 | |
| 1.995 | 0.154 | 0.070 | 0.712 | 2.125 | |
| 1.612 | 0.214 | 0.035 | 0.864 | 1.842 | |
| 1.586 | 1.108 | 0.051 | 0.588 | 2.022 | |
| 1.429 | 0.324 | 0.023 | 0.128 | 1.471 | |
| 0.401 | 0.832 | 0.133 | 0.666 | 1.146 | |
| 1.445 | 1.313 | 0.040 | 0.190 | 1.962 | |
| 1.354 | 0.213 | 0.041 | 0.726 | 1.551 | |
| 2.544 | 0.724 | 0.057 | 0.189 | 2.653 | |
| 1.533 | 0.718 | 0.050 | 0.135 | 1.699 |
| Source | Systematic (%) |
|---|---|
| Tracking efficiency | 0.8 |
| PID efficiency | 0.4 |
| efficiency | 1.2 |
| Decay model | 0.5 |
| Yield fits (ST) | 0.6 |
| Yield fits (DT) | 1.2 |
| Peaking background | 0.2 |
| DCS decay correction | 0.6 |
| Total | 2.3 |
Peer Reviews
No public reviews on file for this paper yet. If you reviewed it on a platform where reviews are public (OpenReview, ICLR, NeurIPS, ICML), you can paste yours below so the community can read it here.
Videos
No videos yet. Explain this paper in a talk, walkthrough, or lecture? Add one.
Amplitude Analysis and Branching Fraction Measurement of
M. Ablikim1, M. N. Achasov10,d, S. Ahmed15, M. Albrecht4, M. Alekseev55A,55C, A. Amoroso55A,55C, F. F. An1, Q. An52,42, Y. Bai41, O. Bakina27, R. Baldini Ferroli23A, Y. Ban35, K. Begzsuren25, D. W. Bennett22, J. V. Bennett5, N. Berger26, M. Bertani23A, D. Bettoni24A, F. Bianchi55A,55C, E. Boger27,b, I. Boyko27, R. A. Briere5, H. Cai57, X. Cai1,42, A. Calcaterra23A, G. F. Cao1,46, S. A. Cetin45B, J. Chai55C, J. F. Chang1,42, W. L. Chang1,46, G. Chelkov27,b,c, G. Chen1, H. S. Chen1,46, J. C. Chen1, M. L. Chen1,42, P. L. Chen53, S. J. Chen33, X. R. Chen30, Y. B. Chen1,42, W. Cheng55C, X. K. Chu35, G. Cibinetto24A, F. Cossio55C, H. L. Dai1,42, J. P. Dai37,h, A. Dbeyssi15, D. Dedovich27, Z. Y. Deng1, A. Denig26, I. Denysenko27, M. Destefanis55A,55C, F. De Mori55A,55C, Y. Ding31, C. Dong34, J. Dong1,42, L. Y. Dong1,46, M. Y. Dong1,42,46, Z. L. Dou33, S. X. Du60, P. F. Duan1, J. Fang1,42, S. S. Fang1,46, Y. Fang1, R. Farinelli24A,24B, L. Fava55B,55C, F. Feldbauer4, G. Felici23A, C. Q. Feng52,42, M. Fritsch4, C. D. Fu1, Q. Gao1, X. L. Gao52,42, Y. Gao44, Y. G. Gao6, Z. Gao52,42, B. Garillon26, I. Garzia24A, A. Gilman49, K. Goetzen11, L. Gong34, W. X. Gong1,42, W. Gradl26, M. Greco55A,55C, L. M. Gu33, M. H. Gu1,42, Y. T. Gu13, A. Q. Guo1, L. B. Guo32, R. P. Guo1,46, Y. P. Guo26, A. Guskov27, Z. Haddadi29, S. Han57, X. Q. Hao16, F. A. Harris47, K. L. He1,46, X. Q. He51, F. H. Heinsius4, T. Held4, Y. K. Heng1,42,46, Z. L. Hou1, H. M. Hu1,46, J. F. Hu37,h, T. Hu1,42,46, Y. Hu1, G. S. Huang52,42, J. S. Huang16, X. T. Huang36, X. Z. Huang33, Z. L. Huang31, T. Hussain54, W. Ikegami Andersson56, M, Irshad52,42, Q. Ji1, Q. P. Ji16, X. B. Ji1,46, X. L. Ji1,42, H. L. Jiang36, X. S. Jiang1,42,46, X. Y. Jiang34, J. B. Jiao36, Z. Jiao18, D. P. Jin1,42,46, S. Jin33, Y. Jin48, T. Johansson56, A. Julin49, N. Kalantar-Nayestanaki29, X. S. Kang34, M. Kavatsyuk29, B. C. Ke1,5,k, I. K. Keshk4, T. Khan52,42, A. Khoukaz50, P. Kiese26, R. Kiuchi1, R. Kliemt11, L. Koch28, O. B. Kolcu45B,f, B. Kopf4, M. Kornicer47, M. Kuemmel4, M. Kuessner4, A. Kupsc56, M. Kurth1, W. Kühn28, J. S. Lange28, P. Larin15, L. Lavezzi55C, S. Leiber4, H. Leithoff26, C. Li56, Cheng Li52,42, D. M. Li60, F. Li1,42, F. Y. Li35, G. Li1, H. B. Li1,46, H. J. Li1,46, J. C. Li1, J. W. Li40, K. J. Li43, Kang Li14, Ke Li1, Lei Li3, P. L. Li52,42, P. R. Li46,7, Q. Y. Li36, T. Li36, W. D. Li1,46, W. G. Li1, X. L. Li36, X. N. Li1,42, X. Q. Li34, Z. B. Li43, H. Liang52,42, Y. F. Liang39, Y. T. Liang28, G. R. Liao12, L. Z. Liao1,46, J. Libby21, C. X. Lin43, D. X. Lin15, B. Liu37,h, B. J. Liu1, C. X. Liu1, D. Liu52,42, D. Y. Liu37,h, F. H. Liu38, Fang Liu1, Feng Liu6, H. B. Liu13, H. L Liu41, H. M. Liu1,46, Huanhuan Liu1, Huihui Liu17, J. B. Liu52,42, J. Y. Liu1,46, K. Y. Liu31, Ke Liu6, L. D. Liu35, Q. Liu46, S. B. Liu52,42, X. Liu30, Y. B. Liu34, Z. A. Liu1,42,46, Zhiqing Liu26, Y. F. Long35, X. C. Lou1,42,46, H. J. Lu18, J. G. Lu1,42, Y. Lu1, Y. P. Lu1,42, C. L. Luo32, M. X. Luo59, P. W. Luo43, T. Luo9,j, X. L. Luo1,42, S. Lusso55C, X. R. Lyu46, F. C. Ma31, H. L. Ma1, L. L. Ma36, M. M. Ma1,46, Q. M. Ma1, X. N. Ma34, X. Y. Ma1,42, Y. M. Ma36, F. E. Maas15, M. Maggiora55A,55C, S. Maldaner26, Q. A. Malik54, A. Mangoni23B, Y. J. Mao35, Z. P. Mao1, S. Marcello55A,55C, Z. X. Meng48, J. G. Messchendorp29, G. Mezzadri24A, J. Min1,42, T. J. Min33, R. E. Mitchell22, X. H. Mo1,42,46, Y. J. Mo6, C. Morales Morales15, N. Yu. Muchnoi10,d, H. Muramatsu49, A. Mustafa4, S. Nakhoul11,g, Y. Nefedov27, F. Nerling11,g, I. B. Nikolaev10,d, Z. Ning1,42, S. Nisar8, S. L. Niu1,42, X. Y. Niu1,46, S. L. Olsen46, Q. Ouyang1,42,46, S. Pacetti23B, Y. Pan52,42, M. Papenbrock56, P. Patteri23A, M. Pelizaeus4, J. Pellegrino55A,55C, H. P. Peng52,42, Z. Y. Peng13, K. Peters11,g, J. Pettersson56, J. L. Ping32, R. G. Ping1,46, A. Pitka4, R. Poling49, V. Prasad52,42, H. R. Qi2, M. Qi33, T. Y. Qi2, S. Qian1,42, C. F. Qiao46, N. Qin57, X. S. Qin4, Z. H. Qin1,42, J. F. Qiu1, S. Q. Qu34, K. H. Rashid54,i, C. F. Redmer26, M. Richter4, M. Ripka26, A. Rivetti55C, M. Rolo55C, G. Rong1,46, Ch. Rosner15, A. Sarantsev27,e, M. Savrié24B, K. Schoenning56, W. Shan19, X. Y. Shan52,42, M. Shao52,42, C. P. Shen2, P. X. Shen34, X. Y. Shen1,46, H. Y. Sheng1, X. Shi1,42, J. J. Song36, W. M. Song36, X. Y. Song1, S. Sosio55A,55C, C. Sowa4, S. Spataro55A,55C, F. F. Sui36, G. X. Sun1, J. F. Sun16, L. Sun57, S. S. Sun1,46, X. H. Sun1, Y. J. Sun52,42, Y. K Sun52,42, Y. Z. Sun1, Z. J. Sun1,42, Z. T. Sun1, Y. T Tan52,42, C. J. Tang39, G. Y. Tang1, X. Tang1, M. Tiemens29, B. Tsednee25, I. Uman45D, B. Wang1, B. L. Wang46, C. W. Wang33, D. Wang35, D. Y. Wang35, Dan Wang46, H. H. Wang36, K. Wang1,42, L. L. Wang1, L. S. Wang1, M. Wang36, Meng Wang1,46, P. Wang1, P. L. Wang1, W. P. Wang52,42, X. F. Wang1, Y. Wang52,42, Y. F. Wang1,42,46, Z. Wang1,42, Z. G. Wang1,42, Z. Y. Wang1, Zongyuan Wang1,46, T. Weber4, D. H. Wei12, P. Weidenkaff26, S. P. Wen1, U. Wiedner4, M. Wolke56, L. H. Wu1, L. J. Wu1,46, Z. Wu1,42, L. Xia52,42, X. Xia36, Y. Xia20, D. Xiao1, Y. J. Xiao1,46, Z. J. Xiao32, Y. G. Xie1,42, Y. H. Xie6, X. A. Xiong1,46, Q. L. Xiu1,42, G. F. Xu1, J. J. Xu1,46, L. Xu1, Q. J. Xu14, X. P. Xu40, F. Yan53, L. Yan55A,55C, W. B. Yan52,42, W. C. Yan2, Y. H. Yan20, H. J. Yang37,h, H. X. Yang1, L. Yang57, R. X. Yang52,42, S. L. Yang1,46, Y. H. Yang33, Y. X. Yang12, Yifan Yang1,46, Z. Q. Yang20, M. Ye1,42, M. H. Ye7, J. H. Yin1, Z. Y. You43, B. X. Yu1,42,46, C. X. Yu34, J. S. Yu20, J. S. Yu30, C. Z. Yuan1,46, Y. Yuan1, A. Yuncu45B,a, A. A. Zafar54, Y. Zeng20, B. X. Zhang1, B. Y. Zhang1,42, C. C. Zhang1, D. H. Zhang1, H. H. Zhang43, H. Y. Zhang1,42, J. Zhang1,46, J. L. Zhang58, J. Q. Zhang4, J. W. Zhang1,42,46, J. Y. Zhang1, J. Z. Zhang1,46, K. Zhang1,46, L. Zhang44, S. F. Zhang33, T. J. Zhang37,h, X. Y. Zhang36, Y. Zhang52,42, Y. H. Zhang1,42, Y. T. Zhang52,42, Yang Zhang1, Yao Zhang1, Yu Zhang46, Z. H. Zhang6, Z. P. Zhang52, Z. Y. Zhang57, G. Zhao1, J. W. Zhao1,42, J. Y. Zhao1,46, J. Z. Zhao1,42, Lei Zhao52,42, Ling Zhao1, M. G. Zhao34, Q. Zhao1, S. J. Zhao60, T. C. Zhao1, Y. B. Zhao1,42, Z. G. Zhao52,42, A. Zhemchugov27,b, B. Zheng53, J. P. Zheng1,42, W. J. Zheng36, Y. H. Zheng46, B. Zhong32, L. Zhou1,42, Q. Zhou1,46, X. Zhou57, X. K. Zhou52,42, X. R. Zhou52,42, X. Y. Zhou1, Xiaoyu Zhou20, Xu Zhou20, A. N. Zhu1,46, J. Zhu34, J. Zhu43, K. Zhu1, K. J. Zhu1,42,46, S. Zhu1, S. H. Zhu51, X. L. Zhu44, Y. C. Zhu52,42, Y. S. Zhu1,46, Z. A. Zhu1,46, J. Zhuang1,42, B. S. Zou1, J. H. Zou1
(BESIII Collaboration)
1* Institute of High Energy Physics, Beijing 100049, People’s Republic of China
2 Beihang University, Beijing 100191, People’s Republic of China
3 Beijing Institute of Petrochemical Technology, Beijing 102617, People’s Republic of China
4 Bochum Ruhr-University, D-44780 Bochum, Germany
5 Carnegie Mellon University, Pittsburgh, Pennsylvania 15213, USA
6 Central China Normal University, Wuhan 430079, People’s Republic of China
7 China Center of Advanced Science and Technology, Beijing 100190, People’s Republic of China
8 COMSATS Institute of Information Technology, Lahore, Defence Road, Off Raiwind Road, 54000 Lahore, Pakistan
9 Fudan University, Shanghai 200443, People’s Republic of China
10 G.I. Budker Institute of Nuclear Physics SB RAS (BINP), Novosibirsk 630090, Russia
11 GSI Helmholtzcentre for Heavy Ion Research GmbH, D-64291 Darmstadt, Germany
12 Guangxi Normal University, Guilin 541004, People’s Republic of China
13 Guangxi University, Nanning 530004, People’s Republic of China
14 Hangzhou Normal University, Hangzhou 310036, People’s Republic of China
15 Helmholtz Institute Mainz, Johann-Joachim-Becher-Weg 45, D-55099 Mainz, Germany
16 Henan Normal University, Xinxiang 453007, People’s Republic of China
17 Henan University of Science and Technology, Luoyang 471003, People’s Republic of China
18 Huangshan College, Huangshan 245000, People’s Republic of China
19 Hunan Normal University, Changsha 410081, People’s Republic of China
20 Hunan University, Changsha 410082, People’s Republic of China
21 Indian Institute of Technology Madras, Chennai 600036, India
22 Indiana University, Bloomington, Indiana 47405, USA
23 (A)INFN Laboratori Nazionali di Frascati, I-00044, Frascati, Italy; (B)INFN and University of Perugia, I-06100, Perugia, Italy
24 (A)INFN Sezione di Ferrara, I-44122, Ferrara, Italy; (B)University of Ferrara, I-44122, Ferrara, Italy
25 Institute of Physics and Technology, Peace Ave. 54B, Ulaanbaatar 13330, Mongolia
26 Johannes Gutenberg University of Mainz, Johann-Joachim-Becher-Weg 45, D-55099 Mainz, Germany
27 Joint Institute for Nuclear Research, 141980 Dubna, Moscow region, Russia
28 Justus-Liebig-Universitaet Giessen, II. Physikalisches Institut, Heinrich-Buff-Ring 16, D-35392 Giessen, Germany
29 KVI-CART, University of Groningen, NL-9747 AA Groningen, The Netherlands
30 Lanzhou University, Lanzhou 730000, People’s Republic of China
31 Liaoning University, Shenyang 110036, People’s Republic of China
32 Nanjing Normal University, Nanjing 210023, People’s Republic of China
33 Nanjing University, Nanjing 210093, People’s Republic of China
34 Nankai University, Tianjin 300071, People’s Republic of China
35 Peking University, Beijing 100871, People’s Republic of China
36 Shandong University, Jinan 250100, People’s Republic of China
37 Shanghai Jiao Tong University, Shanghai 200240, People’s Republic of China
38 Shanxi University, Taiyuan 030006, People’s Republic of China
39 Sichuan University, Chengdu 610064, People’s Republic of China
40 Soochow University, Suzhou 215006, People’s Republic of China
41 Southeast University, Nanjing 211100, People’s Republic of China
42 State Key Laboratory of Particle Detection and Electronics, Beijing 100049, Hefei 230026, People’s Republic of China
43 Sun Yat-Sen University, Guangzhou 510275, People’s Republic of China
44 Tsinghua University, Beijing 100084, People’s Republic of China
45 (A)Ankara University, 06100 Tandogan, Ankara, Turkey; (B)Istanbul Bilgi University, 34060 Eyup, Istanbul, Turkey; (C)Uludag University, 16059 Bursa, Turkey; (D)Near East University, Nicosia, North Cyprus, Mersin 10, Turkey
46 University of Chinese Academy of Sciences, Beijing 100049, People’s Republic of China
47 University of Hawaii, Honolulu, Hawaii 96822, USA
48 University of Jinan, Jinan 250022, People’s Republic of China
49 University of Minnesota, Minneapolis, Minnesota 55455, USA
50 University of Muenster, Wilhelm-Klemm-Str. 9, 48149 Muenster, Germany
51 University of Science and Technology Liaoning, Anshan 114051, People’s Republic of China
52 University of Science and Technology of China, Hefei 230026, People’s Republic of China
53 University of South China, Hengyang 421001, People’s Republic of China
54 University of the Punjab, Lahore-54590, Pakistan
55 (A)University of Turin, I-10125, Turin, Italy; (B)University of Eastern Piedmont, I-15121, Alessandria, Italy; (C)INFN, I-10125, Turin, Italy
56 Uppsala University, Box 516, SE-75120 Uppsala, Sweden
57 Wuhan University, Wuhan 430072, People’s Republic of China
58 Xinyang Normal University, Xinyang 464000, People’s Republic of China
59 Zhejiang University, Hangzhou 310027, People’s Republic of China
60 Zhengzhou University, Zhengzhou 450001, People’s Republic of China
a Also at Bogazici University, 34342 Istanbul, Turkey
b Also at the Moscow Institute of Physics and Technology, Moscow 141700, Russia
c Also at the Functional Electronics Laboratory, Tomsk State University, Tomsk, 634050, Russia
d Also at the Novosibirsk State University, Novosibirsk, 630090, Russia
e Also at the NRC “Kurchatov Institute”, PNPI, 188300, Gatchina, Russia
f Also at Istanbul Arel University, 34295 Istanbul, Turkey
g Also at Goethe University Frankfurt, 60323 Frankfurt am Main, Germany
h Also at Key Laboratory for Particle Physics, Astrophysics and Cosmology, Ministry of Education; Shanghai Key Laboratory for Particle Physics and Cosmology; Institute of Nuclear and Particle Physics, Shanghai 200240, People’s Republic of China
i Also at Government College Women University, Sialkot - 51310. Punjab, Pakistan.
j Also at Key Laboratory of Nuclear Physics and Ion-beam Application (MOE) and Institute of Modern Physics, Fudan University, Shanghai 200443, People’s Republic of China
k Also at Shanxi Normal University, Linfen 041004, People’s Republic of China
Abstract
Utilizing the dataset corresponding to an integrated luminosity of fb*-1* at GeV collected by the BESIII detector, we report the first amplitude analysis and branching fraction measurement of the decay. We investigate the sub-structures and determine the relative fractions and the phases among the different intermediate processes. Our results are used to provide an accurate detection efficiency and allow measurement of .
pacs:
13.20.Fc, 12.38.Qk, 14.40.Lb
I Introduction
Many measurements of meson decays have been performed since the mesons were discovered in 1976 by Mark I PhysRevLett.37.255 ; PhysRevLett.37.569 . Today, most of the low-multiplicity decay mode branching fractions (BFs) are well-measured. The largest decay modes are Cabibbo-favored (CF) hadronic (semileptonic) decay modes resulting from transitions, but some of these decays are still unmeasured, in which the decay should be the largest unmeasured mode. Charge-conjugate states are implied throughout this paper.
The meson is the lightest meson containing a single charm quark. No strong decays are allowed, which makes the meson a perfect place to study the weak decay of the charm quark. The CF , , and modes are the most common hadronic decay modes of mesons. All and branching fractions have been measured, but only four of the seven KLModes have been determined. The Mark III and The E691 collaboration performed amplitude analyses of all four decay modes, , , , and PhysRevD.45.2196 ; PhysRevD.46.1941 . Recently, BESIII has remeasured the structure of the decay with better precision PhysRevD.95.072010 . However, modes with two or more ’s remain unmeasured.
Furthermore, the decay has a large BF and is often used as a meson “tag mode” in experiment, such as in the CLEO and BESIII studies of semileptonic decays PhysRevD.79.052010 ; PhysRevD.92.072012 . This mode contributes up to of the total reconstructed tags. Therefore, the accurate measurement of its sub-structures and branching fraction is essential to reduce systematic uncertainties of such analyses. While it is true that tag-mode BFs and sub-structure effects cancel to first order, higher-order systematic effects are increasingly important as statistics and precision increase.
The BESIII detector collected a fb*-1* dataset in 2010 and 2011 at GeV 1674-1137-37-12-123001 ; Ablikim2016629 , which corresponds to the mass of the resonance. The decays predominantly to or without any additional hadrons. The excellent tracking, precision calorimetry, and a large threshold data sample at BESIII provide an excellent opportunity for study of the unmeasured decay mode. The knowledge of intermediate structure will be crucial for determining the detection efficiency and useful for future usage as a tagging mode. We report here the first partial wave analysis (PWA) and BF measurement of the decay.
II Detection and Data Sets
The BESIII detector is described in detail in Ref. ABLIKIM2010345 . The geometrical acceptance of the BESIII detector is 93% of the full solid angle. Starting from the interaction point (IP), it consists of a main drift chamber (MDC), a time-of-flight (TOF) system, a CsI(Tl) electromagnetic calorimeter (EMC) and a muon system (MUC) with layers of resistive plate chambers (RPC) in the iron return yoke of a 1.0 T superconducting solenoid. The momentum resolution for charged tracks in the MDC is 0.5% at a transverse momentum of 1 GeV/.
Monte Carlo (MC) simulations of the BESIII detector are based on geant4 sim . The production of is simulated with the kkmc KKMC package, taking into account the beam energy spread and the initial-state radiation (ISR). The photos FSR package is used to simulate the final-state radiation of charged particles. The evtgen EvtGen package is used to simulate the known decay modes with BFs taken from the Particle Data Group (PDG) PDG , and the remaining unknown decays are generated with the LundCharm model LundCharm . The MC sample referred to as “generic MC”, including the processes of decays to , non-, ISR production of low mass charmonium states and continuum (, , and ) processes, is used to study the background contribution. The effective luminosities of the generic MC sample correspond to at least 5 times the data luminosity. The signal MC sample includes versus events generated according to the results of the fit to data.
III Event Selection
Photons are reconstructed as energy clusters in the EMC. The shower time is required be less than 700 ns from the event start time in order to suppress fake photons due to electronic noise or beam background. Photon candidates within (barrel) are required to have larger than MeV energy deposition and those with (endcap) must have larger than MeV energy deposition. To suppress noise from hadronic shower splitoffs, the calorimeter positions of photon candidates must be at least away from all charged tracks.
Charged track candidates from the MDC must satisfy , where is the polar angle with respect to the direction of the positron beam. The closest approach to the interaction point is required to be less than 10 cm in the beam direction and less than 1 cm in the plane perpendicular to the beam.
Charged tracks are identified as pions or kaons with particle identification (PID), which is implemented by combining the information of in the MDC and the time-of-flight from the TOF system. For charged kaon candidates, the probability of the kaon hypothesis is required to be larger than that for a pion. For charged pion candidates, the probability for the pion hypothesis is required to be larger than that for a kaon.
The candidates are reconstructed through decays, with at least one barrel photon. The diphoton invariant mass is required to be in the range of GeV/.
Two variables, beam constrained mass and energy difference , are used to identify the meson,
[TABLE]
where and are the total reconstructed momentum and energy of the candidate in the center-of-mass frame of the , respectively, and is the calibrated beam energy. The signals will be consistent with the nominal mass in and with zero in .
After charged kaons and charged pions are identified, and neutral pions are reconstructed, hadronic decays can be reconstructed with a DTag technique. There are two types of samples used in the DTag technique: single tag (ST) and double tag (DT) samples. In the ST sample, only one or meson is reconstructed through a chosen hadronic decay without any requirement on the remaining measured tracks and showers. For multiple ST candidates, only the candidate with the smallest is kept. In the DT sample, both and are reconstructed, where the meson reconstructed through the hadronic decay of interest is called the “signal side”, and the other meson is called the “tag side”. For multiple DT candidates, only the candidate with the smallest summation of s in the signal side and the tag side is kept.
In this amplitude analysis, the DT candidates used are required to have the meson decaying to as the signal, and the meson decaying to as the tag. For charged tracks of the signal side, a vertex fit is performed and the must be less than 100. To improve the resolution and ensure that all events fall within the phase-space boundary, we perform a three-constraint kinematic fit in which the invariant masses of the signal candidate and the two ’s are constrained to their PDG values PDG . The events with kinematic fit 80 are discarded.
The tag side is required to satisfy GeV/ and GeV. The signal side is required to satisfy GeV/ and GeV. A mass veto, GeV/, is also applied on the signal side to remove the dominant peaking background, . The and distributions of the data and generic MC samples are given in Fig. 1, where the generic MC sample is normalized to the size of data. Note that we always apply the requirements before plotting , and vice-versa.
The generic MC sample is used to estimate the background of the DT candidates in the amplitude analysis. The dominant peaking background arises from , which is suppressed by the mass veto from to . The remaining non-peaking background is about 1.0. With all selection criteria applied, 5,950 candidate events are obtained with a purity of 98.9%.
IV Amplitude Analysis
This analysis aims to determine the intermediate-state composition of the decay. This four-body decay spans a five-dimensional space. The daughter particle momenta are used as inputs to the probability density function (PDF) which describes the distribution of signal events. This is then used in an unbinned maximum likelihood fit to determinate the intermediate-state composition.
IV.1 Likelihood Function Construction
The PDF is used to construct the likelihood of the amplitude mode and it is given by
[TABLE]
where is the set of the four daughter particles’ four momenta and is the set of the complex coefficients for amplitude modes. The is the efficiency parameterized in terms of the daughter particles’ four momenta. The four-body phase-space, , is defined as
[TABLE]
where indicates the four daughter particles. This analysis uses an isobar model formulation, where the signal decay amplitude, , is represented as a coherent sum of a number of two-body amplitude modes:
[TABLE]
where is written in the polar form as ( is the magnitude and is the phase), and is the amplitude for the amplitude mode modeled as
[TABLE]
where the indexes 1 and 2 correspond to the two intermediate resonances. Here, is the Blatt-Weisskopf barrier factor for the meson, while and are propagators and Blatt-Weisskopf barrier factors, respectively. The spin factor is constructed with the covariant tensor formalism Zou2003 . Finally, the likelihood is defined as
[TABLE]
where sums over the selected events and is the number of candidate events. Consequently, the log likelihood is given by
[TABLE]
Since the second term of Eq. (7) is independent of and the normalization integration in the denominator of the first term can be approximated by a phase-space MC integration, one can execute an amplitude analysis without knowing efficiency in advance. The phase-space MC integration is obtained by summing over a phase-space MC sample,
[TABLE]
where is the number of generated phase-space events and is the number of selected phase-space events. This holds since the generated sample is uniform in phase space, while the nonuniform distribution after selection reflects the efficiency.
For signal MC samples, the amplitude squared for each event should be normalized by the PDF which generates the sample. The normalization integration using signal MC samples is given by
[TABLE]
where is the number of the signal MC sample and is the set of the parameters used to generate the signal MC sample, which is obtained from the preliminary results using the phase-space MC integration. We allow for possible biases caused by tracking, PID, and data versus MC sample efficiency differences by introducing the correction factors ,
[TABLE]
where and are the reconstruction, the PID, or the tracking efficiencies as a function of for the data and the MC sample, respectively. By weighting each signal MC event with , the MC integration is given by
[TABLE]
IV.1.1 Spin Factor
For a decay process of the form , we use , , to denote the momenta of the particles , , , respectively, and . The spin projection operators Zou2003 are defined as
[TABLE]
The covariant tensors are given by
[TABLE]
We list the 10 kinds of spin factors used in this analysis in Table 1, where scalar, pseudo-scalar, vector, axial-vector, and tensor states are denoted by , , , , and , respectively.
IV.1.2 Blatt-Weisskopf Barrier Factors
The Blatt-Weisskopf barrier is a barrier function for a two-body decay process, . The Blatt-Weisskopf barrier depends on angular momenta and the magnitudes of the momenta of daughter particles in the rest system of the mother particle. The definition is given by
[TABLE]
where denotes the angular momenta, and with the magnitudes of the momenta of daughter particles in the rest system of the mother particle and the effective radius of the barrier. For a process , we define , , such that
[TABLE]
while the values of used in this analysis, GeV*-1* and GeV*-1* for intermediate resonances and the meson, respectively, are used in the BESIII MC generator (based on evtgen). However, these values will also be varied as a source of systematic uncertainties. The are given by
[TABLE]
IV.1.3 Propagators
We use the relativistic Breit-Wigner function as the propagator for the resonances , , and , and fix their widths and masses to their PDG values PDG . The relativistic Breit-Wigner function is given by
[TABLE]
where and is the rest mass of the resonance. is given by
[TABLE]
where indicates the value of when . Resonances and are also parameterized by the relativistic Breit-Wigner function but with constant width since these two resonances are very close to the threshold of and vary very rapidly as changes. We parameterize the with the Gounaris-Sakurai lineshape PhysRevLett.21.244 , which is given by
[TABLE]
The function is given by
[TABLE]
where
[TABLE]
and
[TABLE]
The normalization condition at fixes the parameter . It is found to be
[TABLE]
IV.1.4 -Wave
The kinematic modifications associated with the -wave are modeled by a parameterization from scattering data ASTON1988493 ; PhysRevD.78.034023 , which are described by a Breit-Wigner along with an effective range non-resonant component with a phase shift,
[TABLE]
with
[TABLE]
where and are the scattering length and effective interaction length, respectively. The parameters and are the magnitude (phase) for non-resonant state and resonance terms, respectively. The parameters , , , , , , are fixed to the results of the analysis by BABAR PhysRevD.78.034023 , given in Table 2.
Note that we have also tested different parametrizations of the -wave, but no significant improvement is observed. We decide to use phase-space for the -wave.
IV.2 Fit Fraction
The fit fraction (FF) is independent of the normalization and phase conventions in the amplitude formalism, and hence provides a more meaningful summary of amplitude strengths than the raw amplitudes, in Eq. (4), alone. The definition of the FF for the amplitude is
[TABLE]
where the integration is approximated by a MC integration with a phase-space MC sample. Since the FF does not involve efficiency, the MC sample used here is at the generator level instead of at the reconstruction level, as shown previously in Eq. (LABEL:eq:MCintegration).
As for the statistical uncertainty of the FF, it is not practical to analytically propagate the uncertainties of the FFs from that of the amplitudes and phases. Instead, we randomly perturb the variables determined in our fit (by a Gaussian-distributed amount controlled by the fit uncertainty and the covariance matrix) and calculate the FFs to determine the statistical uncertainties. We fit the distribution of each FF with a Gaussian function and the width is reported as the uncertainty of the FF.
IV.3 Results of Amplitude Analysis
We perform an unbinned likelihood fit using the likelihood described in Section IV.1, where only the complex are floating. Starting with amplitude modes with significant contribution, we add (remove) amplitude modes into (from) the fit one by one based on their statistical significances, which are obtained by the change of the log-likelihood value with or without the amplitude mode under study. There are 26 amplitudes each with a significance larger than chosen as the optimal set, listed in Table 3 and the uncertainties are discussed in Section VI.1. There are more than 40 amplitudes tested but not used in the optimal set ( significance), listed in Appendix A.
The amplitude , is expected to have the largest FF. Thus, we choose this amplitude as the reference (phase is fixed to 0) in the PWA. Other important amplitudes are , with , and with . The notation denotes a relative -wave between daughters in a decay, and similarly for . A MC sample is generated based on the PWA results, called the PWA signal MC sample. The projections of the data sample and the PWA signal MC sample on the invariant masses squared and the cosines of helicity angles for the , , and systems are shown in Fig. 2. The helicity angle ( or is , and ) is defined as the angle between the momentum vector of the particle in the rest frame and the direction of the system in the rest frame. There are clear and resonances around 0.796 GeV2 in the and projections, respectively, and a resonance around 0.593 GeV2 in the projection. The gap in the projection is due to the mass veto. A more detailed goodness-of-fit study is presented in the next section. The PWA signal MC sample improves the accuracy of the DT efficiency (needed to determine the BF), which is discussed in more detail in Section V.3.
IV.4 Goodness-of-Fit
While the one-dimensional projections of the data sample and the PWA signal MC sample shown in Fig. 2 look quite good, much information is lost in projecting down from the full five-dimensional phase space. It is thus desirable to have a more rigorous test of the fit quality. We have programmed a “mixed-sample method” for determining the goodness of our unbinned likelihood fit 1748-0221-5-09-P09004 . According to the method, we can calculate the “T” value of the mixing of two samples, the expectation mean, , and the variance, . From these values, we can calculate a “pull”, , which should distribute as a normal Gaussian function due to statistical fluctuations. The pull is expected to center at zero if the two samples come from the same parent PDF, and be biased toward larger values otherwise. In the case of our PWA fit, the pull is expected to be a little larger than zero because some amplitudes with small significance are dropped. In other words, adding more amplitudes into the model is expected to decrease the pull.
To check the goodness-of-fit of our PWA results, we calculate the pull of the T value of the mixing of the data sample and the PWA signal MC sample, and it is determined to be 0.97, which indicates good fit quality.
V Branching Fraction
We determinate the BF of using the efficiency based on the results of our amplitude analysis.
V.1 Tagging Technique and Branching Fraction
To extract the absolute BF of the decay, we obtain the ST sample by reconstructing the meson through the decay, and the DT sample by fully reconstructing both and through the decay and the decay as the signal side and the tag side, respectively. The ST yield is given by
[TABLE]
and the DT yield is given by
[TABLE]
where is the total number of produced pairs, is the BF of the tag (signal) side, and are the corresponding efficiencies.
The BF of the signal side is determined by isolating such that
[TABLE]
V.2 Fitting Model
The ST yield, , is obtained by a maximum-likelihood fit to the () distribution. A Crystal Ball (CB) function CBcitation , along with a Gaussian, is used to model the signal while an ARGUS function ARGUScitation is used to model the background. The signal shape is
[TABLE]
where is a fraction ranging from 0 to 1, and are the mean and the width of the Gaussian function, respectively. The CB function has a Gaussian core transitioning to a power-law tail at a certain point, and is given by
[TABLE]
where is the normalization and controls the start of the tail. The beam energy (end point of the ARGUS function) is fixed to be 1.8865 GeV, while all other parameters are floating.
The DT yield, , is obtained by a maximum-likelihood fit to the two dimensional (2-D) () versus () distribution for the signal and the tag side with a 2-D fitting technique introduced by CLEO PhysRevD.76.112001 . This technique analytically models the signal peak, and considers ISR and mispartition (i.e., where one or more daughter particles are associated with the incorrect or parent) effects, which are non-factorizable in the 2-D plane. In this fitting, the mass of is fixed to be 3.773 GeV and the beam energy is fixed to be 1.8865 GeV.
V.3 Efficiency and Data Yields
An updated MC sample based on our PWA results, called the PWA MC sample, is used to determine the efficiency. The PWA MC sample is the generic MC sample with the versus events replaced by the PWA signal MC sample. All event selection criteria mentioned in Section III are applied except the requirements. The projections to the signal and the tag side of the fit to the distributions of the DT of data are shown in Figs. 3(a) and (b), respectively. The background peak in the projection to the signal (tag) side axis is caused by events with a correct signal (tag) and a fake tag (signal). The fit to the distribution of the ST of data is shown in Fig. 3(c), where both the mean values of the Gaussian function and the CB function agree well with our expectation for the mass. The ST and DT data yields are determined to be and , respectively. The ST and DT efficiencies based on the PWA MC sample are and , respectively.
We further take the differences in efficiencies for reconstruction, tracking, and PID between the data and the PWA MC sample into account. For these differences, we obtain weighted-average efficiency differences of , , and for reconstruction, kaon tracking, and pion tracking, respectively, while that for PID is negligible. More details are discussed in Section VI.2. This correction is applied to obtain the corrected DT efficiency to be .
V.4 Result of Branching Fraction
Inserting the values of the DT and ST data yields, the ST efficiency, and the corrected DT efficiency into Eq. (28), we determine the BF of the decay, . The systematic uncertainties are discussed in Section VI.2.
VI Systematic Uncertainties
The systematic uncertainties of the PWA and BF measurement are discussed in Sections VI.1 and VI.2, respectively.
VI.1 Uncertainties for Amplitude Analysis
The systematic uncertainties for our amplitude analysis are studied in four categories: amplitude model, background, experimental effects, and fit bias. The contributions from the different categories to the systematic uncertainties for the FFs and phases are given in Tables 4 and 5, respectively. The uncertainties of these categories are added in quadrature to obtain the total systematic uncertainties.
The effects of the amplitude model arise from three possible sources: the -wave model, the effective barrier radii, and the masses and widths of intermediate particles. To determine the systematic uncertainties due to the -wave model, the fixed parameters of the model are varied according to the BABAR measurement uncertainties ASTON1988493 ; PhysRevD.78.034023 , listed in Table 2. The effective barrier radius is varied from to GeV*-1* for intermediate resonances, and from to GeV*-1* for the . The masses and widths of intermediate particles are perturbed according to their published uncertainties in the PDG. The consequent changes of fitting results are considered as the systematic uncertainties inherent in the amplitude model.
The effects of background estimation are separated into non-peaking background, and peaking background. The uncertainties associated with non-peaking background are studied by widening the and windows on the signal side to increase the non-peaking background. The peaking background can be mostly removed by the mass veto. However, this veto is also a source of uncertainties. Its uncertainty is studied by widening this veto from the nominal GeV/ to GeV/.
The experimental effects are related to the acceptance difference between data and MC sample caused by reconstruction, tracking, and PID efficiencies, which weight the normalization of the signal PDF, Eq. (10). To estimate the uncertainties associated with the experimental effects, the amplitude fit is performed varying reconstruction, tracking and PID efficiencies according to their uncertainties, and the changes of the nominal results are taken as the systematic uncertainties.
The fit bias is tested with 200 pseudoexperiment samples generated based on the PWA model. The distribution of each FF or phase is fitted with a Gaussian function. The difference of the mean and the nominal value is considered as the uncertainty associated with fit bias.
VI.2 Uncertainties for Branching Fraction
We examine the systematic uncertainties for the BF from the following sources: tag side efficiency, tracking, PID, and efficiencies for signal, decay (PWA) model, yield fits, peaking background and the mass veto, and doubly Cabibbo-suppressed (DCS) decay.
The efficiency for reconstructing the tag side, , should almost cancel, and any residual effects caused by the tag side are expected to be negligible. Unlike the case of the tag side, the reconstruction efficiency of the signal side does not cancel in the DT to ST ratio. This efficiency of the signal side is determined with the PWA signal MC sample. The mismatches of tracking, PID, and reconstruction between the data and MC samples, therefore, bring in systematic uncertainties.
One possible source of those uncertainties is that the momentum spectra simulated in the MC sample do not match those in data, if there are any variations in efficiency versus momentum. This effect, however, is expected to be small due to the PWA MC sample’s successful modeling of the momentum spectra in data, as shown in Fig. 2. The major possible source of the reconstruction, tracking, and PID systematic uncertainties is that, although the momentum spectra in the MC sample and data follow each other well, the efficiency of the MC sample disagrees with that of data as a function of momentum. This disagreement results in taking a correctly weighted average of incorrect efficiencies. We have performed an efficiency correction and choose , , , and as the systematic uncertainties for the reconstruction, kaon tracking, pion tracking, and kaon/pion PID, respectively. The uncertainty of the reconstruction efficiency is investigated with the control sample of decays and the uncertainties for charged tracks and PID are determined using the control sample of decays, decays, and decays.
To estimate the systematic uncertainty caused by the imperfections of the decay model, we compare our PWA model to another PWA model which only includes amplitudes with significance larger than . The relative shift on efficiency is less than . We therefore assign as the systematic for the effect of any remaining decay modeling imperfections on efficiency.
To get the uncertainty of the yield fit, we change the nominal window to a wider one, GeV, and the change of the BF is considered as the associated uncertainty.
The mass veto can veto most peaking background and reduce it to be only of the total events. However, the peaking background simulation is not perfect and the mass veto also removes about 13 of the signal events. Thus, we estimate the uncertainty by narrowing the veto from GeV/ to GeV/, while the peaking background increases from to and the BF change is 0.18 of itself. We take this full shift as the corresponding uncertainty.
The smooth ARGUS background level is about in the signal region. In addition, the 2-D () versus () fit works well for the background determination. Thus, we believe the uncertainty of the background with such small size will be very small and neglect it.
Our tag and signal sides are required to have opposite-sign kaons. This means that our DT decays are either both CF or both DCS. These contributions can interfere with each other, with amplitude ratios that are approximately known, but with a priori unknown phase. The fractional size of the interference term varies between approximately , where is the Cabibbo angle (the square in the first term arises as one power from each decay mode in the cross-term). The two amplitude ratios are not exactly equal to , due to differing structure in the CF and DCS decay modes, but nonetheless we believe is a conservative uncertainty to set as an approximate “” scale to combine with other uncertainties.
Systematic uncertainties on the BF are summarized in Table 6, where the total uncertainty is calculated by a quadrature sum of individual contributions.
VII Conclusion
Based on the fb*-1* sample of annihilation data near threshold collected by the BESIII detectors, we report the first amplitude analysis of the decay and the first measurement of its decay branching fraction. We find that the decay is the dominant amplitude occupying of total FF (98.54%) and other important amplitudes are , , and , which is similar, in general, with the results of the BESIII amplitude analysis PhysRevD.95.072010 . Our PWA results are given in Table 3. With these results in hand, which provide access to an accurate efficiency for the data sample, we obtain .
Acknowledgements.
The BESIII collaboration thanks the staff of BEPCII and the IHEP computing center for their strong support. This work is supported in part by National Key Basic Research Program of China under Contract No. 2015CB856700; National Natural Science Foundation of China (NSFC) under Contract No. 11835012; National Natural Science Foundation of China (NSFC) under Contracts Nos. 11475185, 11625523, 11635010, 11735014; the Chinese Academy of Sciences (CAS) Large-Scale Scientific Facility Program; Joint Large-Scale Scientific Facility Funds of the NSFC and CAS under Contracts Nos. U1532257, U1532258, U1732263, U1832207; CAS Key Research Program of Frontier Sciences under Contracts Nos. QYZDJ-SSW-SLH003, QYZDJ-SSW-SLH040; 100 Talents Program of CAS; INPAC and Shanghai Key Laboratory for Particle Physics and Cosmology; German Research Foundation DFG under Contract No. Collaborative Research Center CRC 1044; Istituto Nazionale di Fisica Nucleare, Italy; Koninklijke Nederlandse Akademie van Wetenschappen (KNAW) under Contract No. 530-4CDP03; Ministry of Development of Turkey under Contract No. DPT2006K-120470; National Science and Technology fund; The Knut and Alice Wallenberg Foundation (Sweden) under Contract No. 2016.0157; The Swedish Research Council; U. S. Department of Energy under Contracts Nos. DE-FG02-05ER41374, DE-SC-0010118, DE-SC-0012069; University of Groningen (RuG) and the Helmholtzzentrum fuer Schwerionenforschung GmbH (GSI), Darmstadt.
VIII Appendix A: Amplitudes Tested
The following is a list of all amplitude modes tested and found to have a significance smaller than . These are not included in the final fit set.
**Other
, , ,
, , ,
,
, ,
**
The reference list from the paper itself. Each links out to its DOI / PubMed record.
- 1(1) G. Goldhaber et al ., Phys. Rev. Lett. 37 , 255 (1976).
- 2(2) I. Peruzzi et al ., Phys. Rev. Lett. 37 , 569 (1976).
- 3(3) Observation of a K S 0 n π subscript superscript 𝐾 0 𝑆 𝑛 𝜋 K^{0}_{S}n\pi mode alone suffices to infer the corresponding K ¯ 0 n π superscript ¯ 𝐾 0 𝑛 𝜋 \bar{K}^{0}n\pi final state, even when the partner K L 0 n π subscript superscript 𝐾 0 𝐿 𝑛 𝜋 K^{0}_{L}n\pi mode is not yet measured.
- 4(4) D. Coffman et al . (Mark III Collaboration), Phys. Rev. D 45 , 2196 (1992).
- 5(5) J. C. Anjos et al . (E 691 Collaboration), Phys. Rev. D 46 , 1941 (1992).
- 6(6) M. Ablikim et al . (BESIII Collaboration), Phys. Rev. D 95 , 072010 (2017).
- 7(7) J. Y. Ge et al. (CLEO Collaboration), Phys. Rev. D 79 , 052010 (2009).
- 8(8) M. Ablikim et al . (BESIII Collaboration), Phys. Rev. D 92 , 072012 (2015).