Nanoscale Oxygen Defect Gradients in the Actinide Oxides
Steven R. Spurgeon, Michel Sassi, Colin Ophus, Joanne E. Stubbs,, Eugene S. Ilton, Edgar C. Buck

TL;DR
This study uses advanced microscopy and spectroscopy to reveal nanoscale oxygen defect gradients in UO₂, providing new insights into defect formation and oxidation processes relevant to nuclear fuel stability.
Contribution
First application of aberration-corrected STEM and EELS to resolve nanoscale oxygen defect variations in actinide oxides, combining experimental and computational analysis.
Findings
Detected large oxygen defect gradients at the nanoscale in UO₂ surfaces.
Quantified excess oxygen distribution using first principles calculations.
Revealed complex near-surface oxygen incorporation affecting oxidation pathways.
Abstract
Oxygen defects govern the behavior of a range of materials spanning catalysis, quantum computing, and nuclear energy. Understanding and controlling these defects is particularly important for the safe use, storage, and disposal of actinide oxides in the nuclear fuel cycle, since their oxidation state influences fuel lifetimes, stability, and the contamination of groundwater. However, poorly understood nanoscale fluctuations in these systems can lead to significant deviations from bulk oxidation behavior. Here we describe the first use of aberration-corrected scanning transmission electron microscopy and electron energy loss spectroscopy to resolve changes in the local oxygen defect environment in UO surfaces. We observe large image contrast and spectral changes that reflect the presence of sizable gradients in interstitial oxygen content at the nanoscale, which we quantify through…
Click any figure to enlarge with its caption.
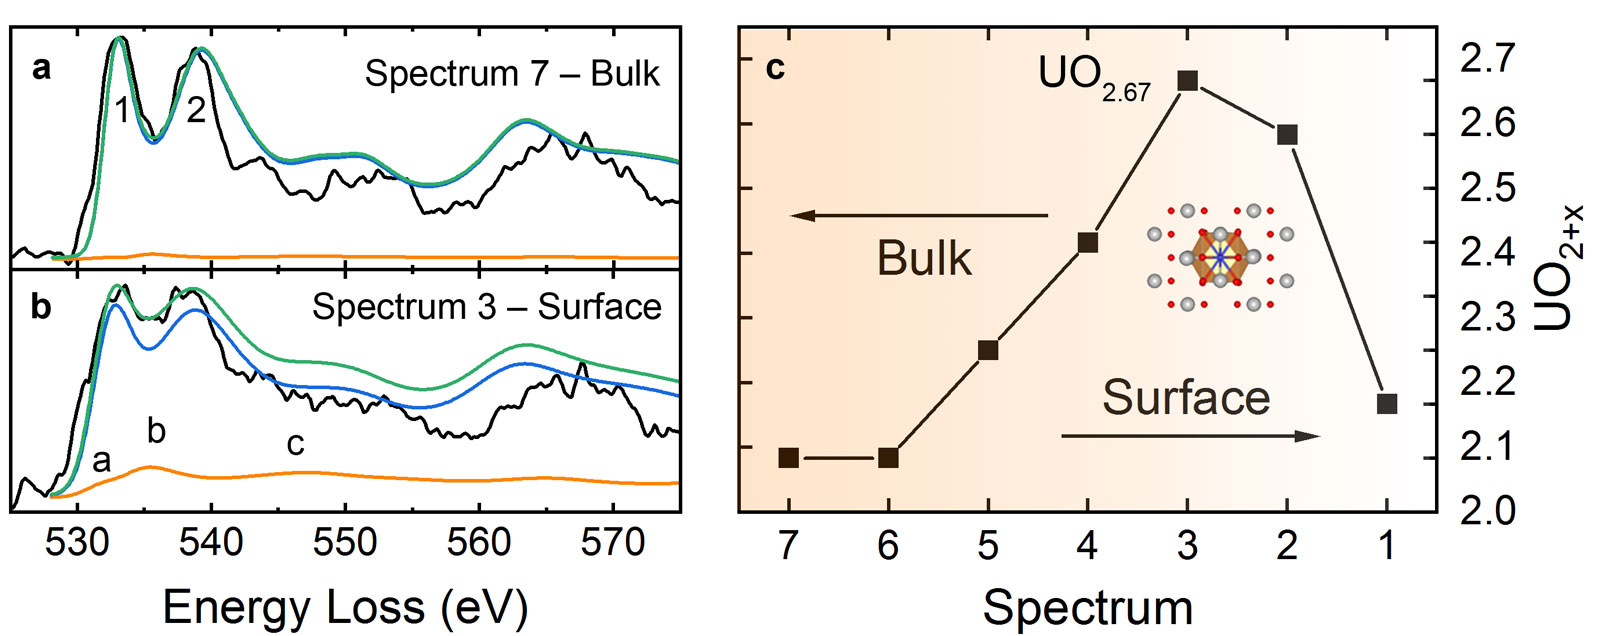 Figure 1
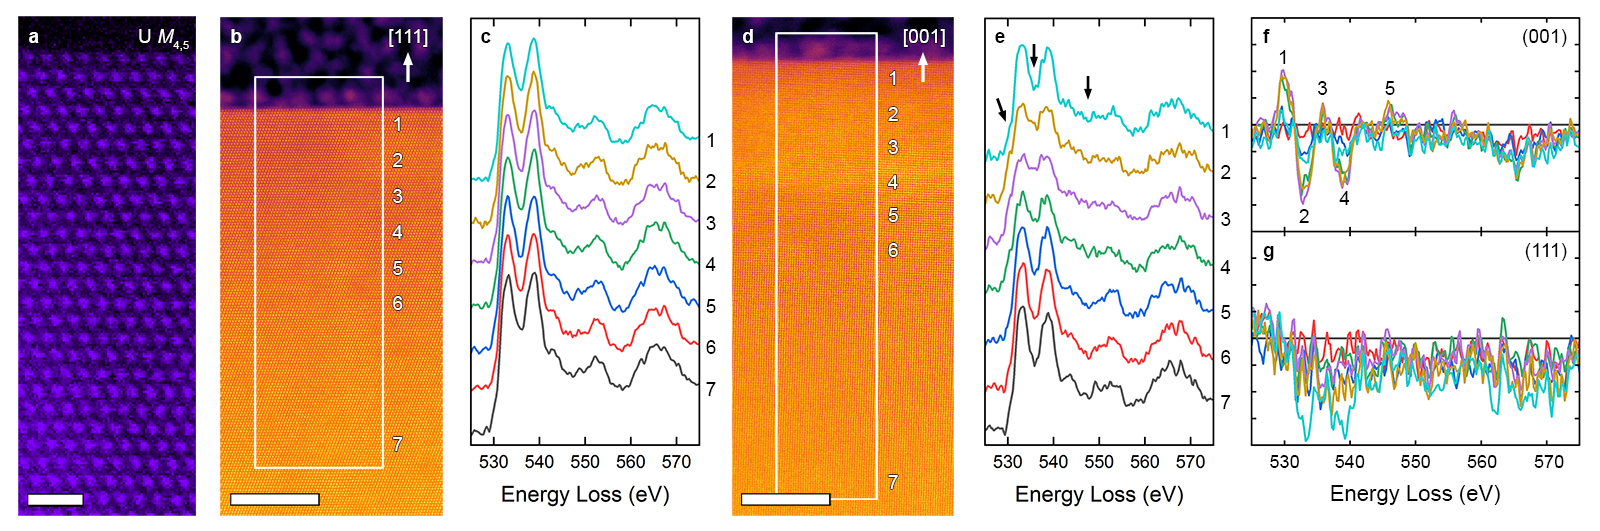 Figure 2
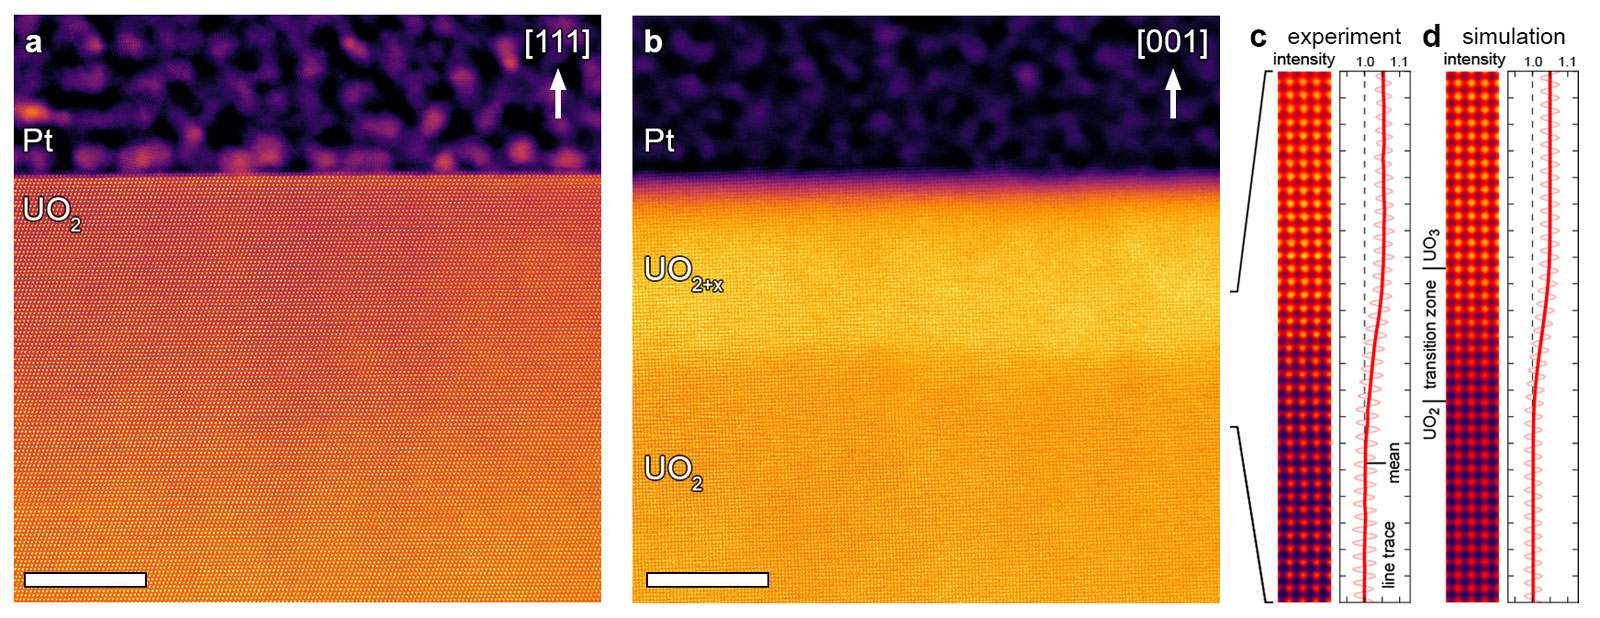 Figure 3
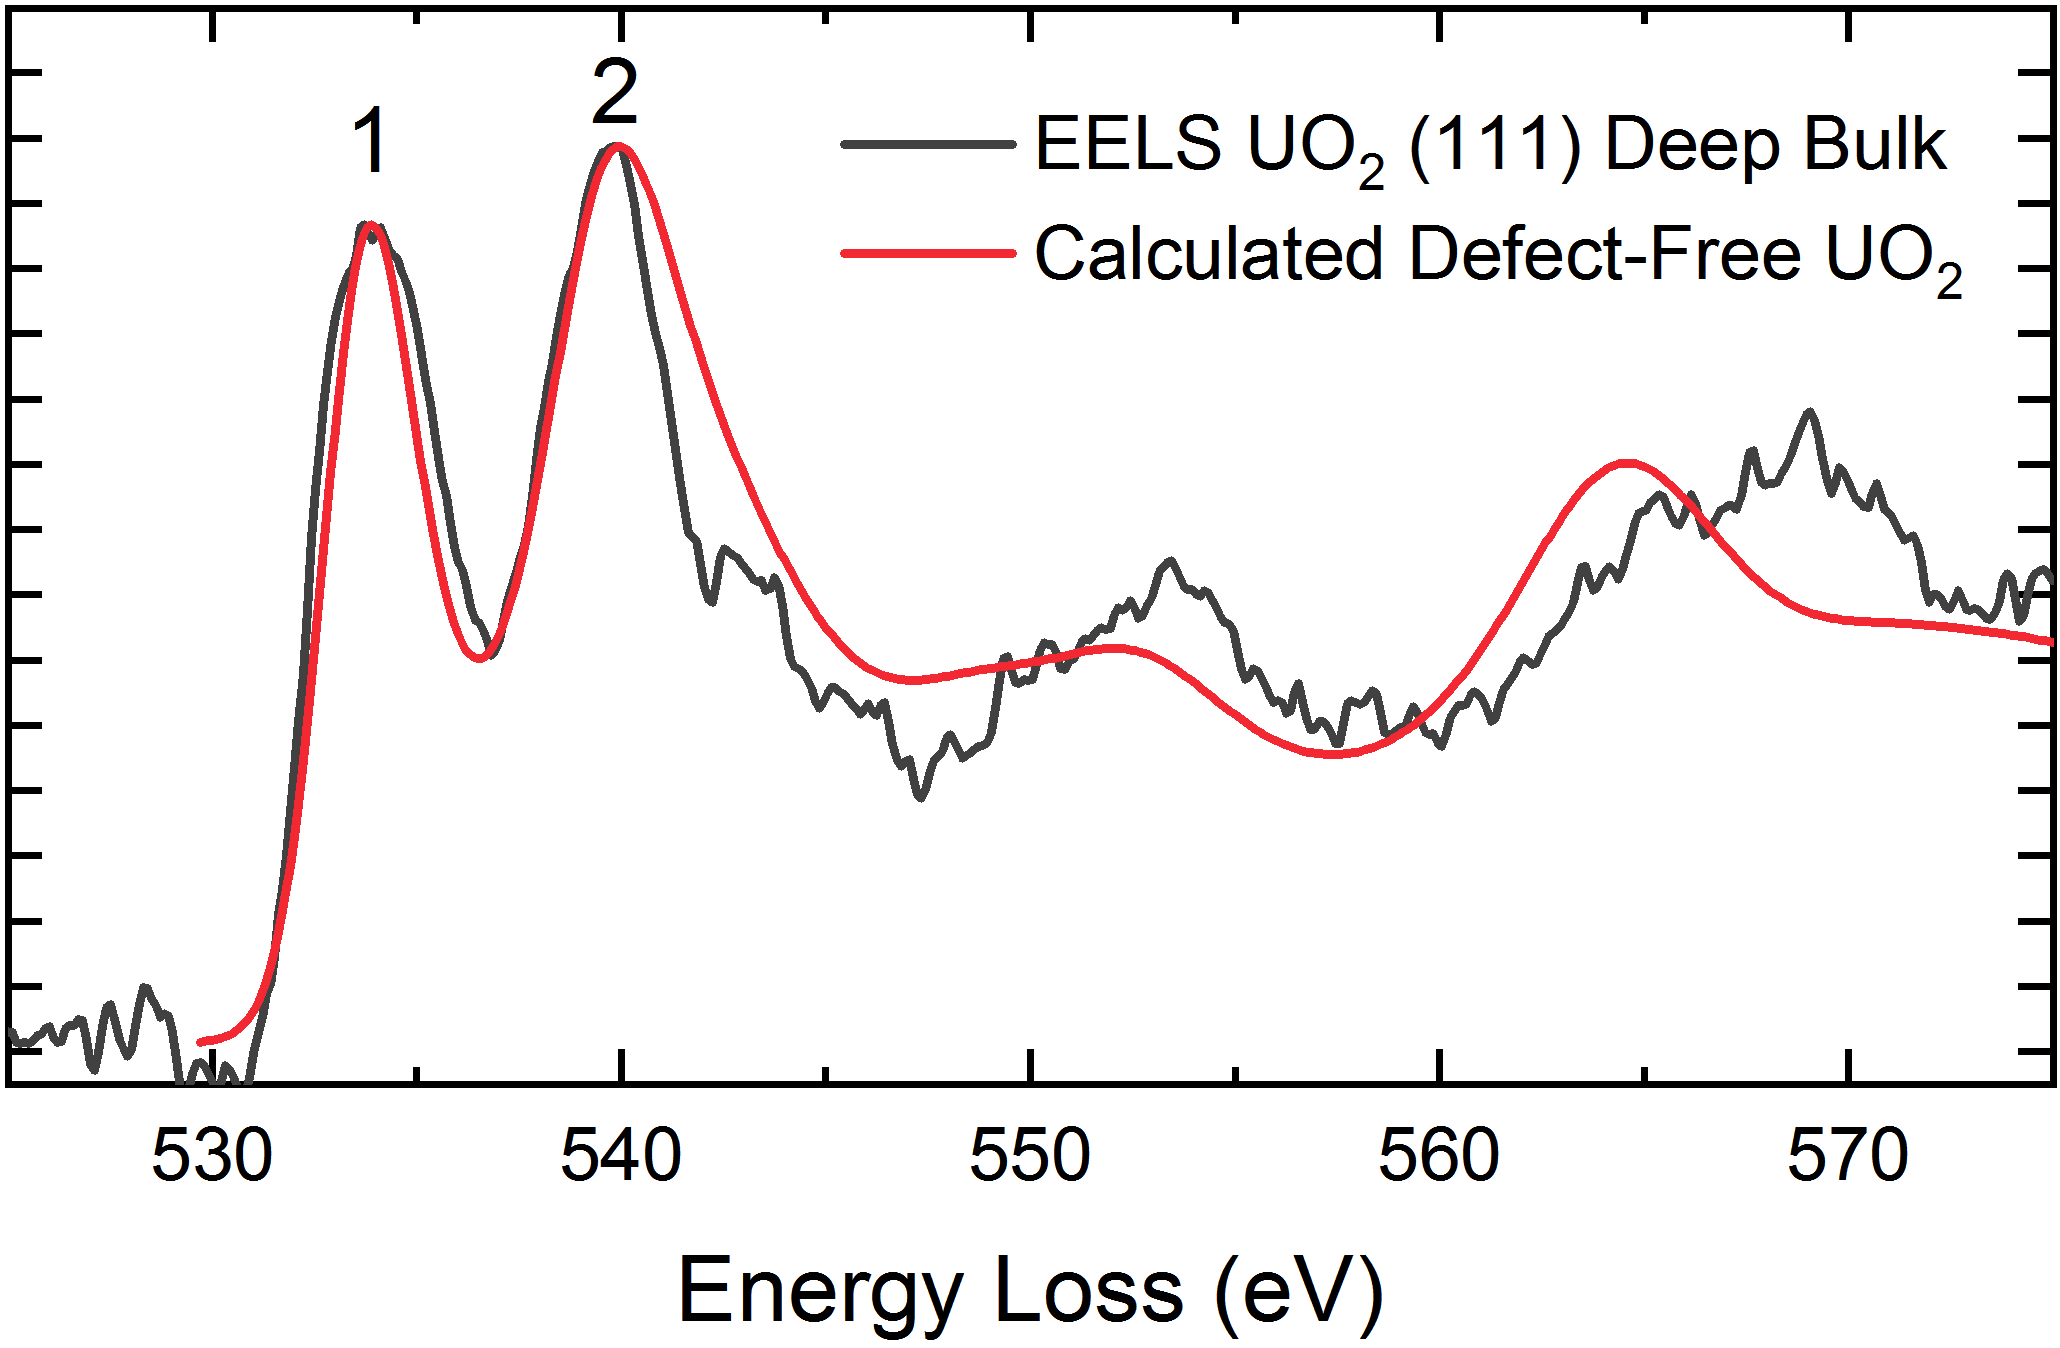 Figure 4
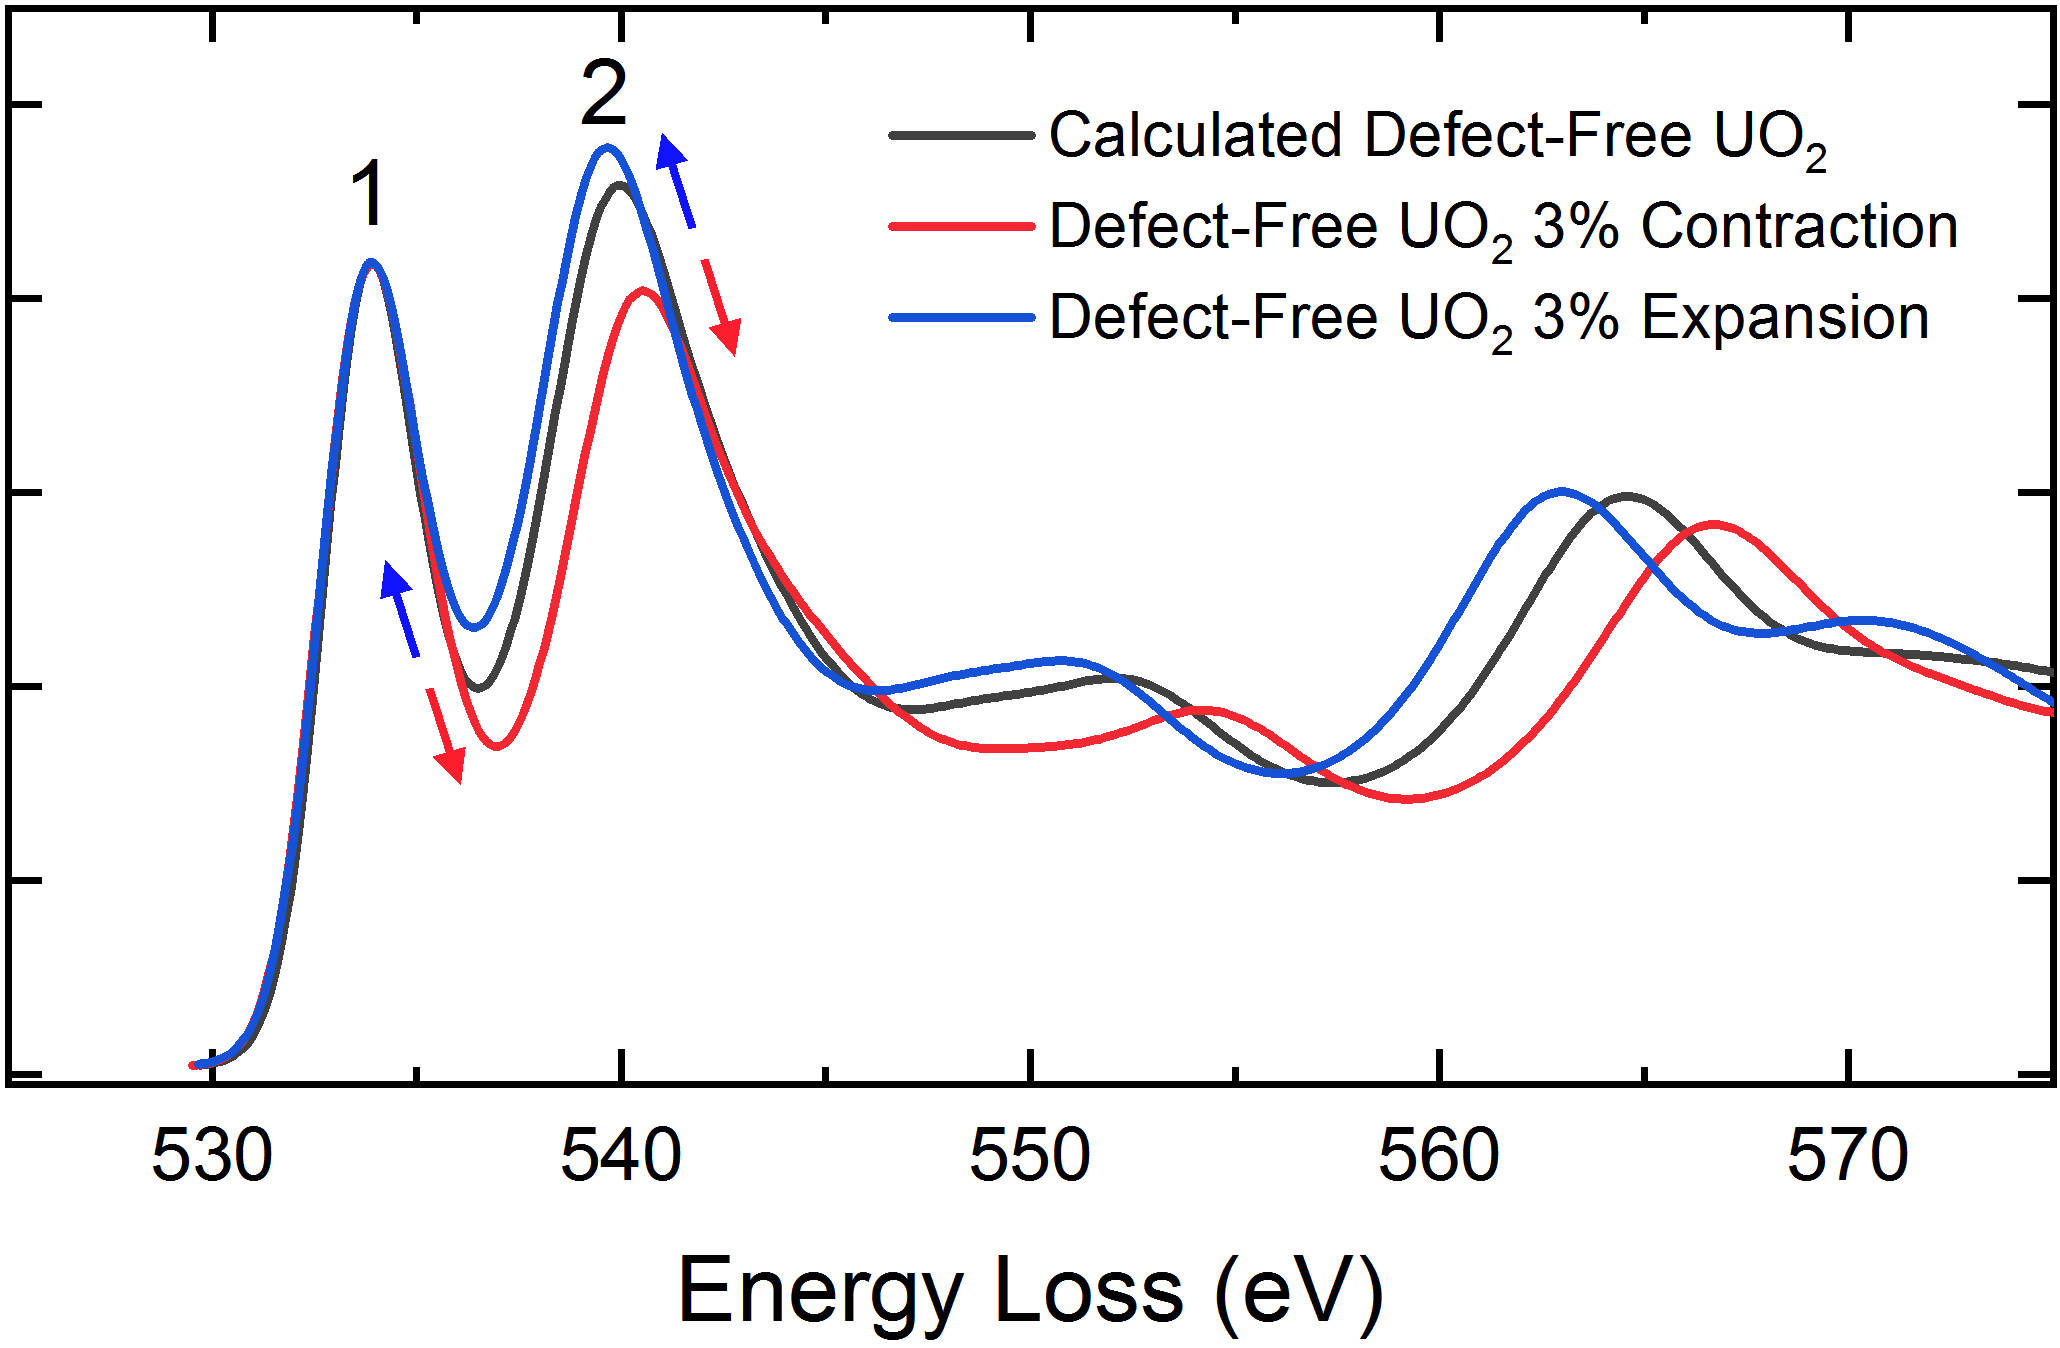 Figure 5
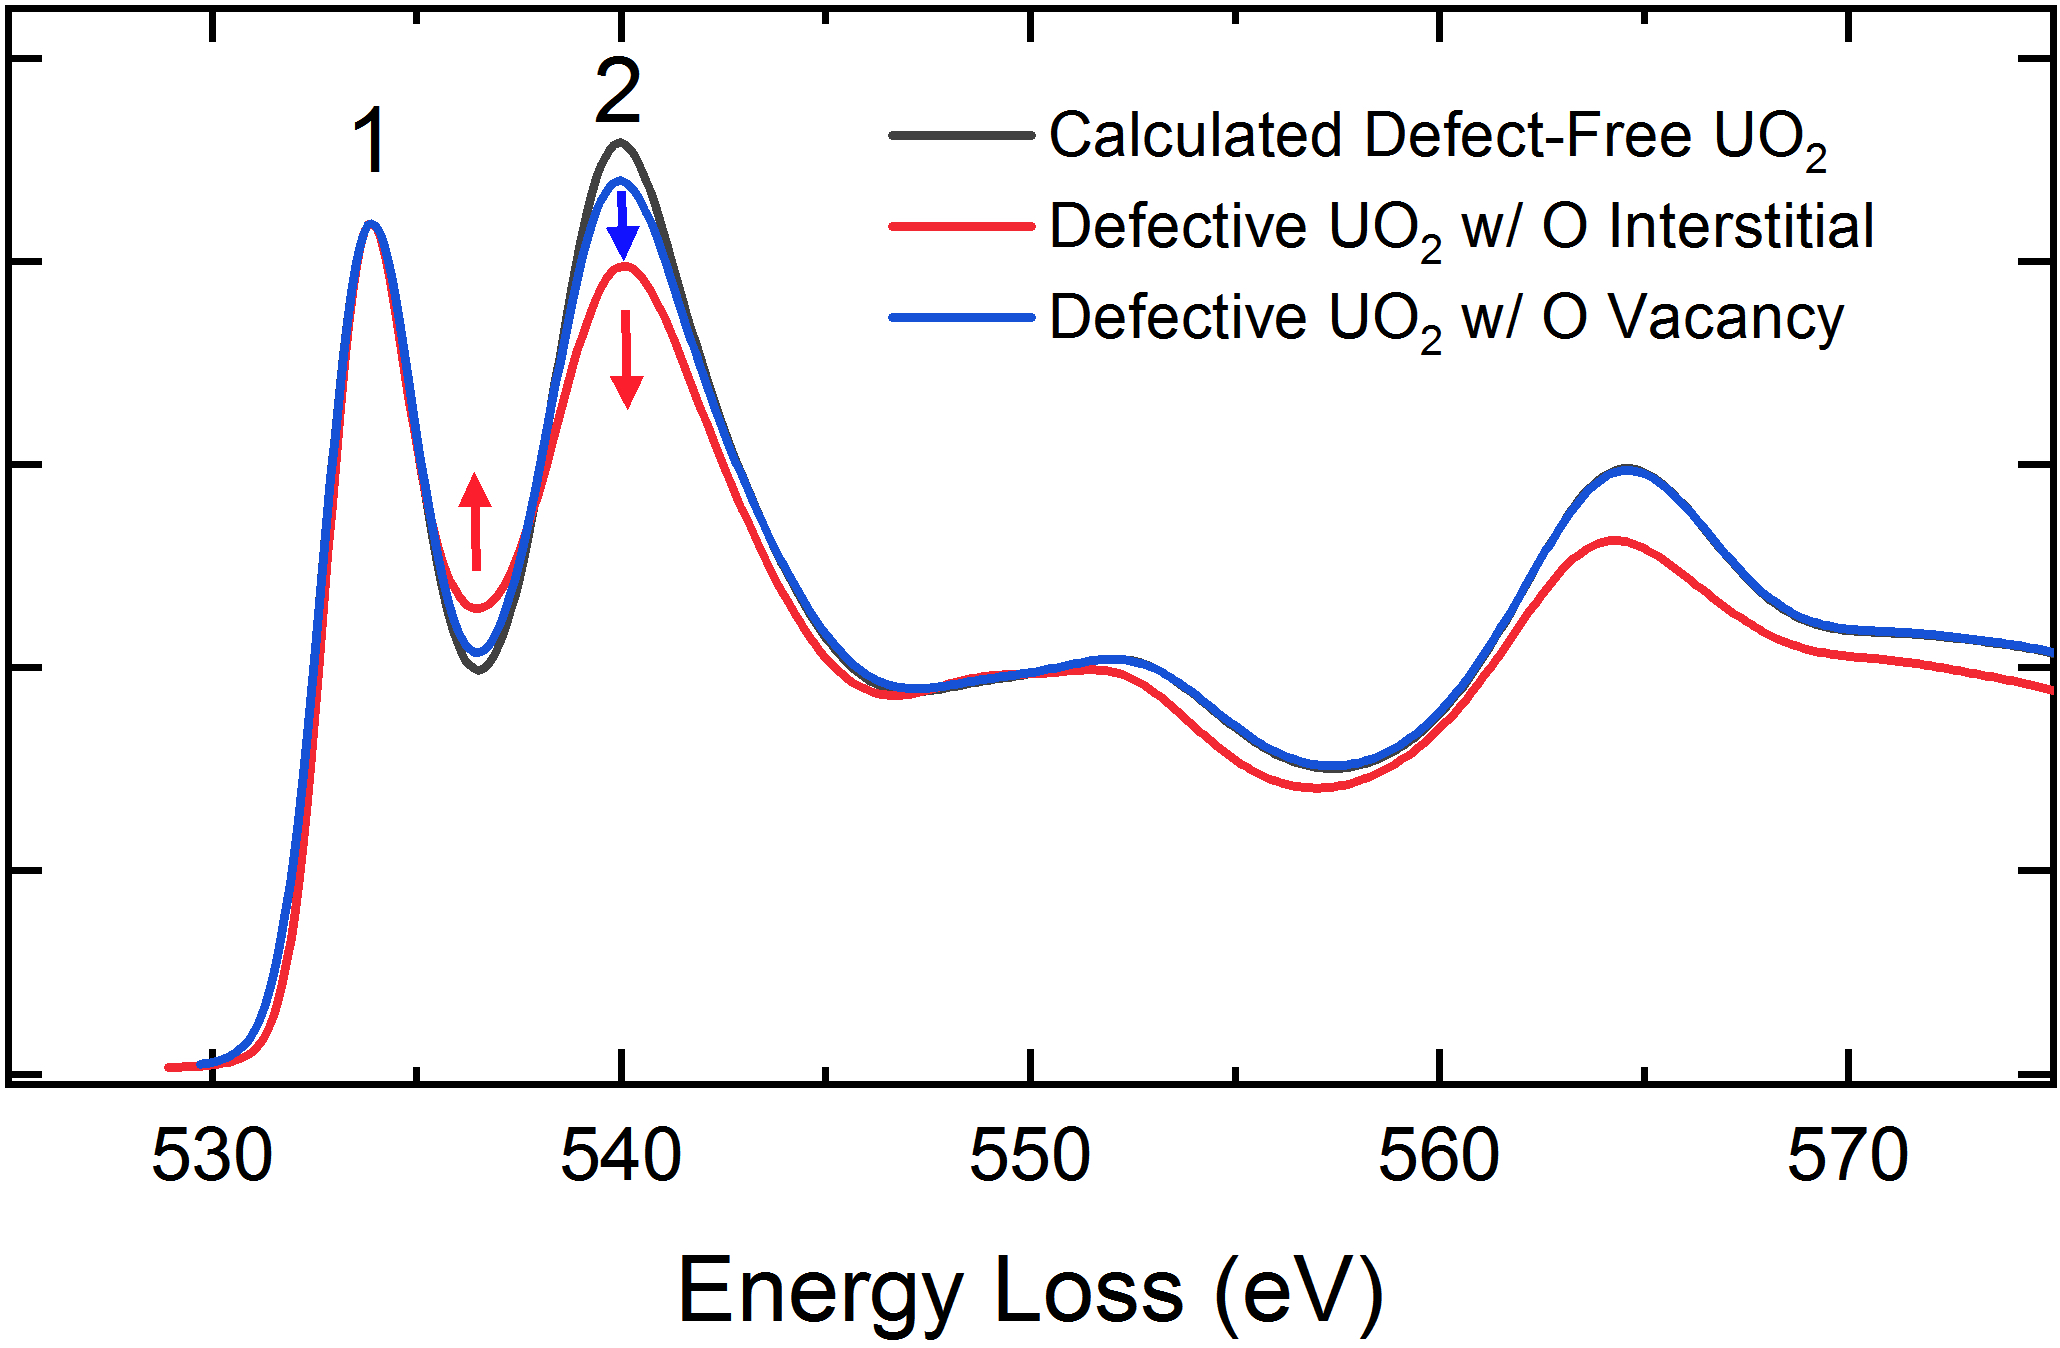 Figure 6
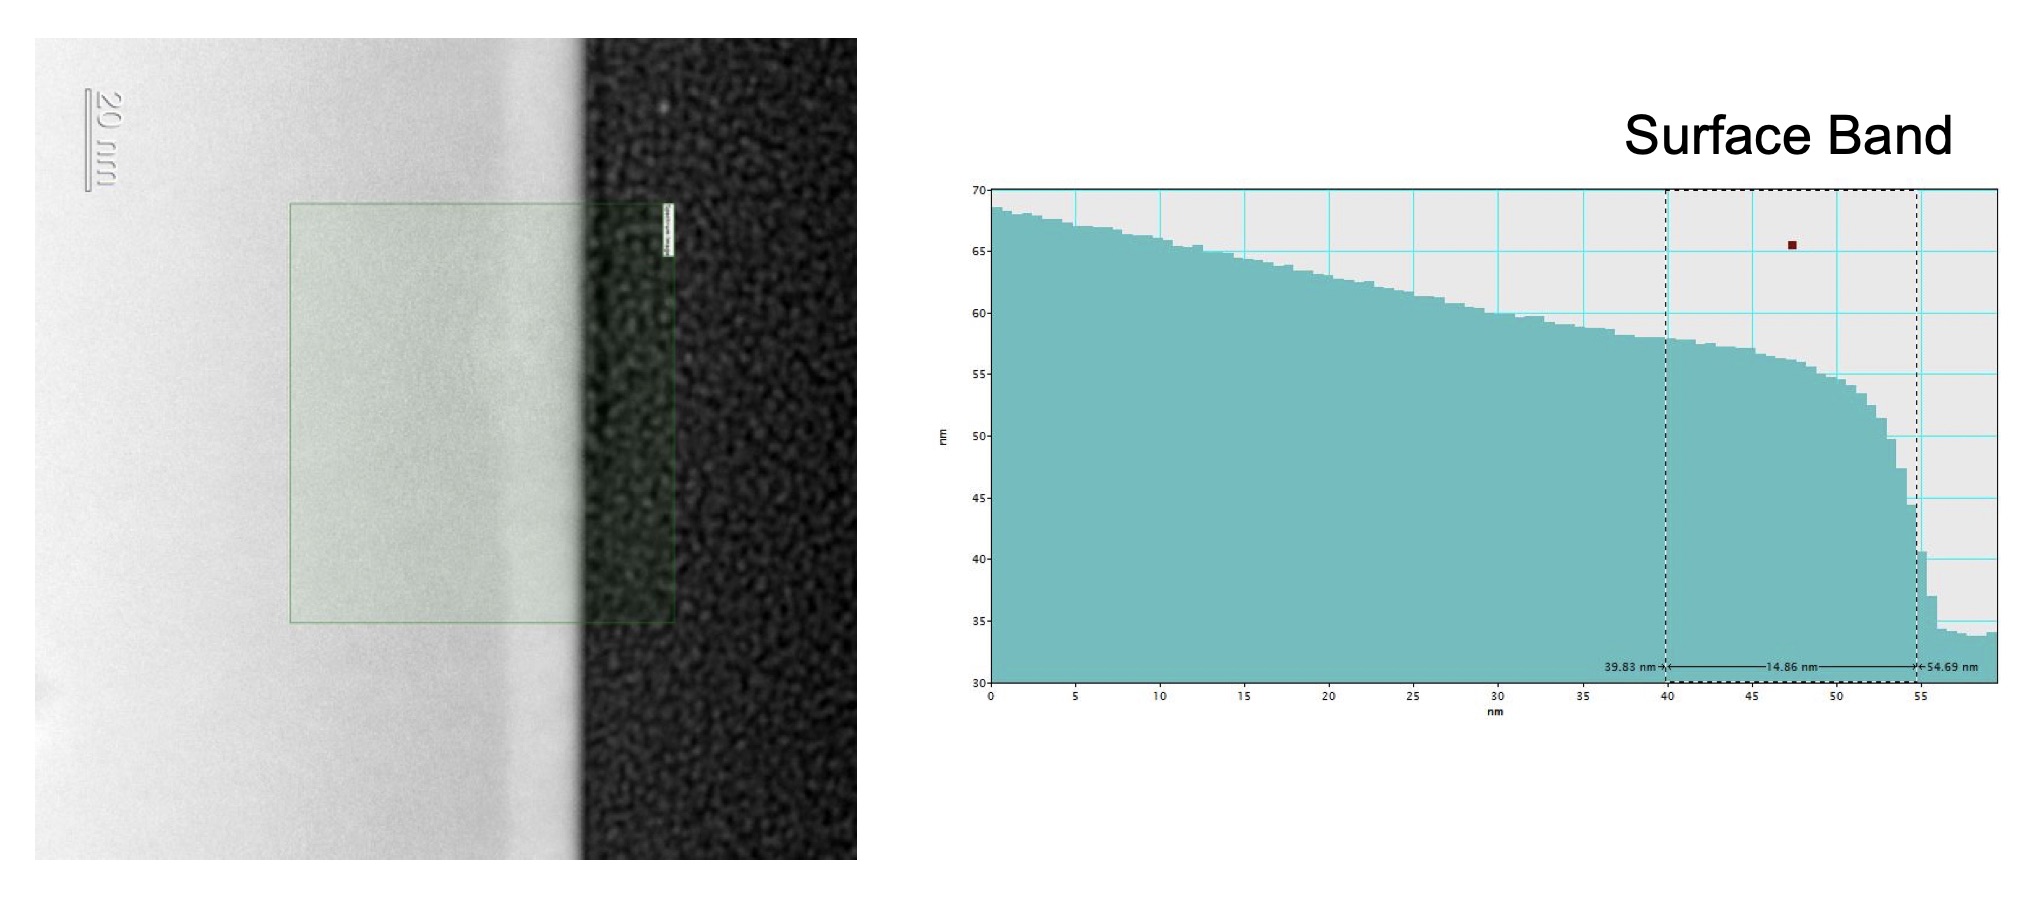 Figure 7
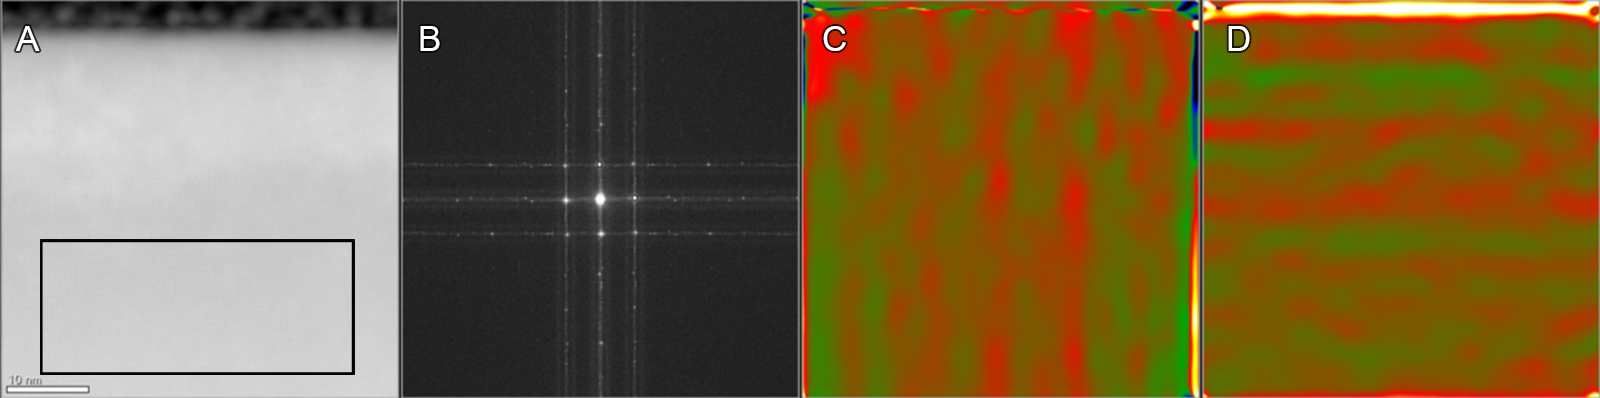 Figure 8
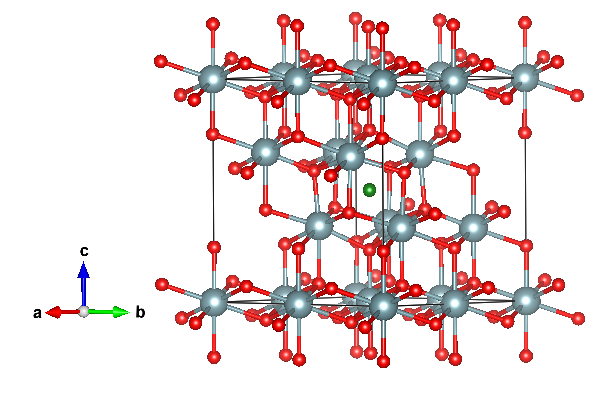 Figure 9
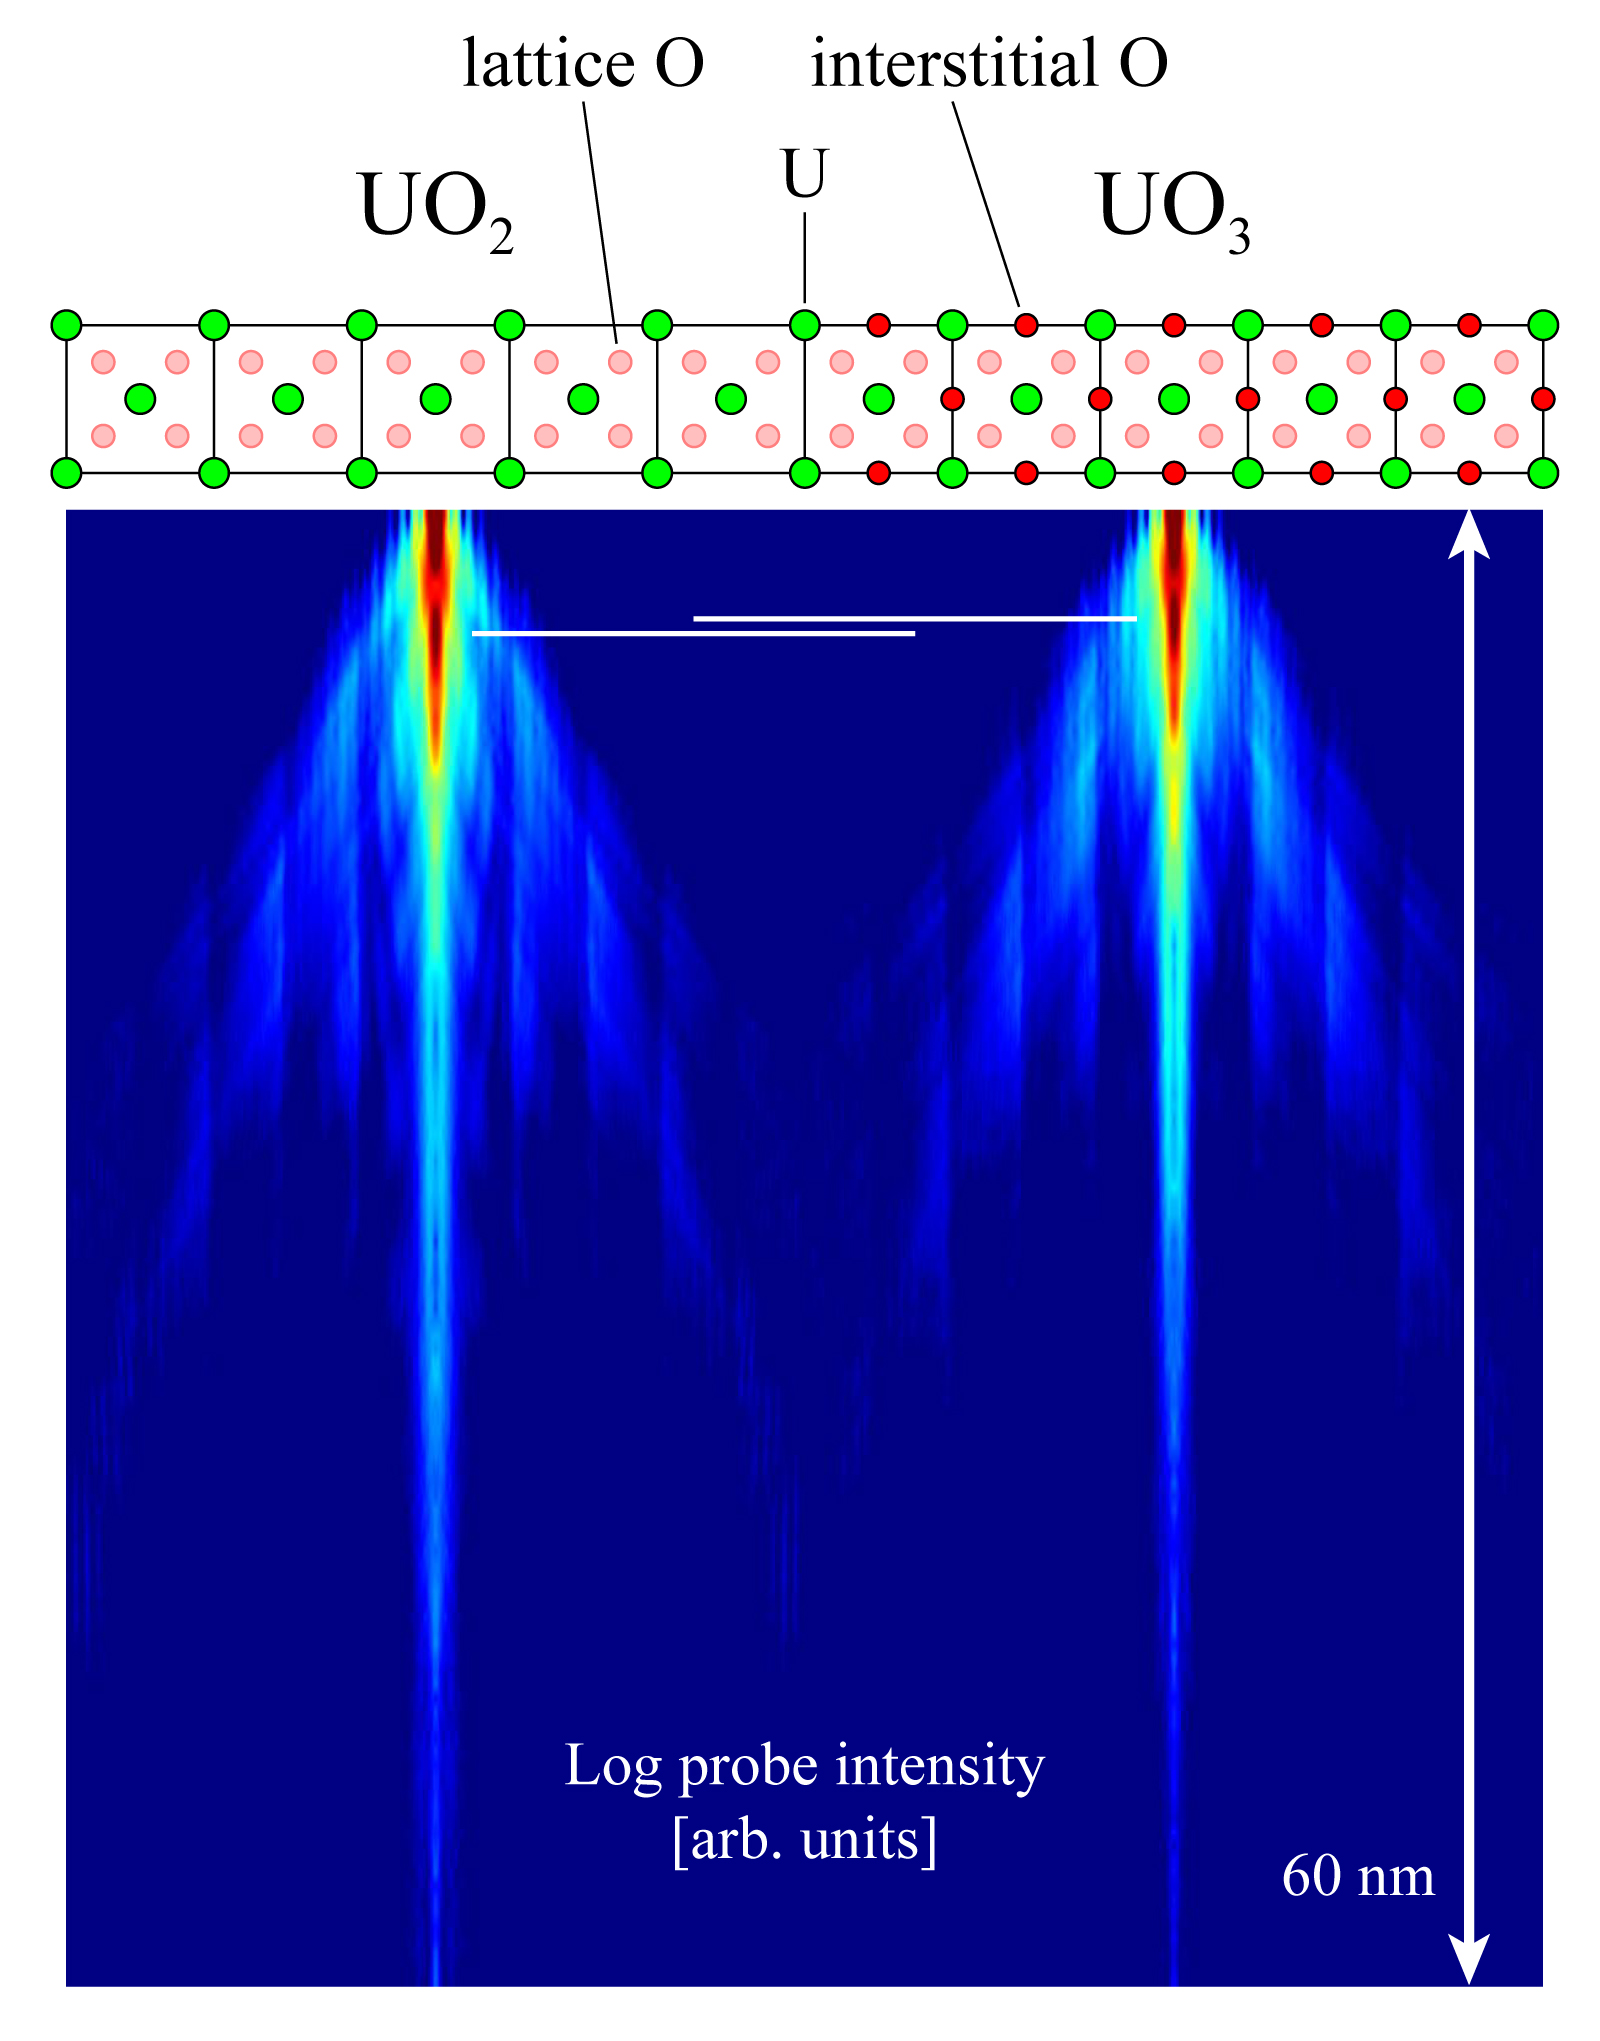 Figure 10
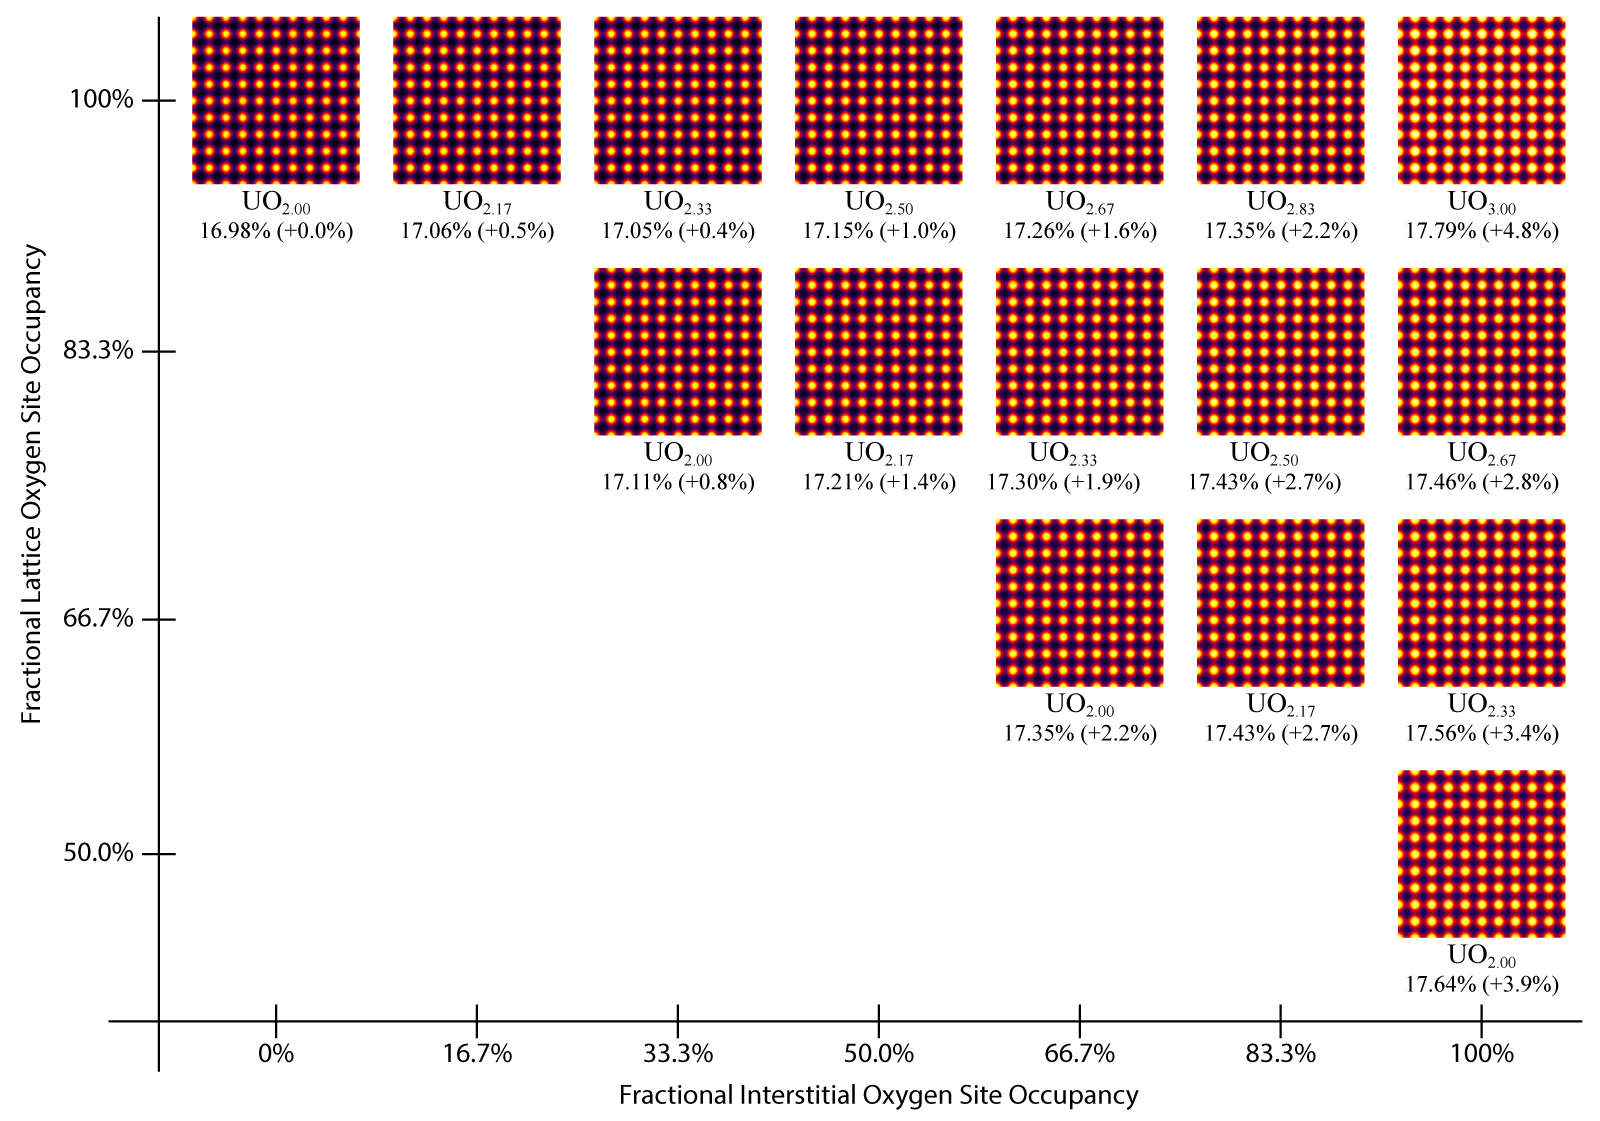 Figure 11
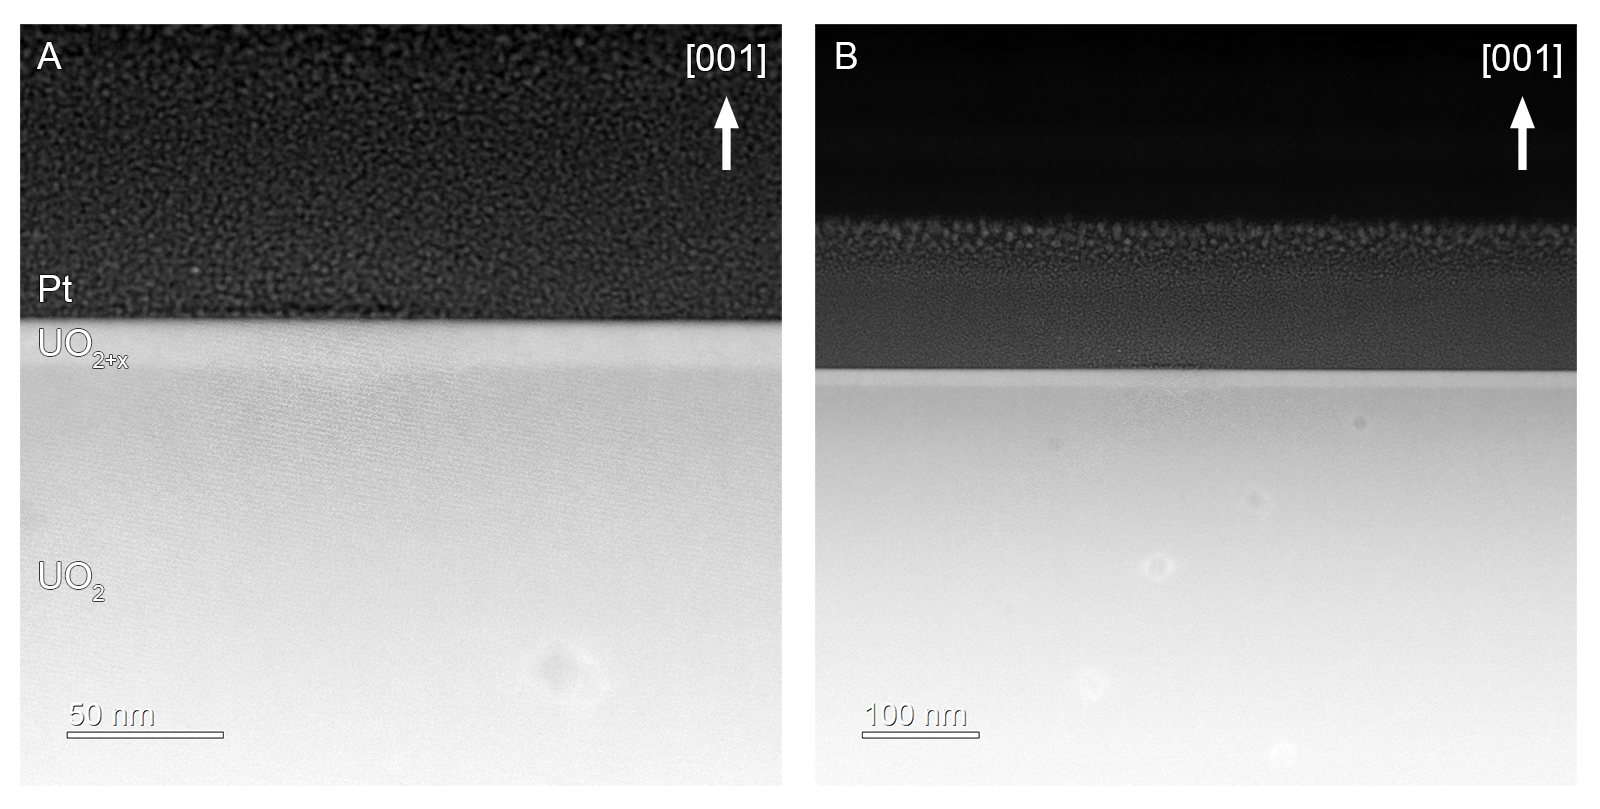 Figure 12
Peer Reviews
No public reviews on file for this paper yet. If you reviewed it on a platform where reviews are public (OpenReview, ICLR, NeurIPS, ICML), you can paste yours below so the community can read it here.
Videos
No videos yet. Explain this paper in a talk, walkthrough, or lecture? Add one.
Nanoscale Oxygen Defect Gradients in the Actinide Oxides
Steven R. Spurgeon
Energy and Environment Directorate, Pacific Northwest National Laboratory, Richland, Washington 99352
Michel Sassi
Physical and Computational Sciences Directorate, Pacific Northwest National Laboratory, Richland, Washington 99352
Colin Ophus
National Center for Electron Microscopy, Molecular Foundry, Lawrence Berkeley National Laboratory, Berkeley, California 94720
Joanne E. Stubbs
Center for Advanced Radiation Sources, University of Chicago, Chicago, Illinois 60439
Eugene S. Ilton
Physical and Computational Sciences Directorate, Pacific Northwest National Laboratory, Richland, Washington 99352
Edgar C. Buck
Energy and Environment Directorate, Pacific Northwest National Laboratory, Richland, Washington 99352
Abstract
Oxygen defects govern the behavior of a range of materials spanning catalysis, quantum computing, and nuclear energy. Understanding and controlling these defects is particularly important for the safe use, storage, and disposal of actinide oxides in the nuclear fuel cycle, since their oxidation state influences fuel lifetimes, stability, and the contamination of groundwater. However, poorly understood nanoscale fluctuations in these systems can lead to significant deviations from bulk oxidation behavior. Here we describe the first use of aberration-corrected scanning transmission electron microscopy and electron energy loss spectroscopy to resolve changes in the local oxygen defect environment in UO2 surfaces. We observe large image contrast and spectral changes that reflect the presence of sizable gradients in interstitial oxygen content at the nanoscale, which we quantify through first principles calculations and image simulations. These findings reveal an unprecedented level of excess oxygen incorporated in a complex near-surface spatial distribution, offering new insight into defect formation pathways and kinetics during UO2 oxidation.
The engineering of oxygen defects is a central focus of modern materials science. These defects influence the electronic, magnetic, optical, and radiation-response properties of materials in ways that are difficult to control and predict a priori.Tuller and Bishop (2011); Chambers (2010); Ganduglia-Pirovano, Hofmann, and Sauer (2007); Sickafus et al. (2000) In particular, the safe use and disposal of oxide-based nuclear fuels depends on comprehensive models for oxidative processes and defect formation, which can guide operation, long-term waste storage, and accident cleanup efforts.Burns, Ewing, and Navrotsky (2012) Because of their strategic importance and potential environmental impact,Coyte et al. (2018) the oxidative behavior of the actinides has attracted considerable attention.Colmenares (1984) These elements exist in multiple valence states in oxides, leading to complex electronic properties and magnetic phase transitions that are a sensitive function of oxygen defects.Moore and Van Der Laan (2009)
Among the actinides, hyper-stoichiometric UO2+x has been examined for over half a century because of its central role in fuel production, as well as its many interesting properties, including charge-density wave behavior and superconductivity.Cooper, Murphy, and Andersson (2018); Conradson et al. (2013); Moore and Van Der Laan (2009); Shoesmith (2000); McEachern and Taylor (1998); Fisher (1994); Wasserstein (1954) The system can adopt at least 14 known fluorite-derivative crystal structures, with oxidation states spanning U U6+, the latter of which is aqueous soluble and a risk-driver for environmental transport.Kvashnina et al. (2013); Shoesmith (2000); McEachern and Taylor (1998) The complex chemical landscape of this system has motivated longstanding questions about the nature of these phase transitions and the incorporation of excess oxygen. Prior work indicated that a stoichiometry of UO2.25 is readily attainable while preserving the nominal fluorite structure;Willis (1978) however, recent X-ray measurements uncovered a complex ordering of interstitial oxygen resulting from a nonclassical diffusion process.Stubbs et al. (2015) These results suggest that nanoscale deviations from predicted bulk behavior can radically change the oxidation process, calling for a more precise local understanding of the coupling between phase transitions and oxygen defect formation.
While a large body of experimental and computational work has attempted to elucidate defect formation kinetics and oxidation pathways of UO2, the task is hindered by a lack of well-controlled model systems and the difficulty of simulating strongly correlated electrons.Cooper, Murphy, and Andersson (2018); Vitova et al. (2017); Moore and Van Der Laan (2009); McEachern and Taylor (1998) Most studies have relied on volume-averaged techniques, such as X-ray absorption near-edge structure (XANES), extended X-ray absorption fine structure (EXAFS), and X-ray photoelectron spectroscopy (XPS), applied to polycrystalline samples.Ilton and Bagus (2011); Caciuffo et al. (2010) When these measurements are interpreted through first principles calculations, they can yield powerful insight into electronic structure, local coordination environment, and valence.Wu et al. (1999); Jollet et al. (1997) Recent work by Stubbs et al. has demonstrated the use of synchrotron X-ray crystal truncation rod (CTR) analysis to resolve surface distortions and subsurface oxygen interstitial profiles in single-crystal UO2, albeit over a millimeter-sized region of a sample.Stubbs et al. (2017, 2015) Through fitting the CTR data and computational modeling, the authors inferred the development of oscillatory interstitial O profiles under the (001)- and (111)-oriented surfaces of UO2. However, the large atomic number contrast between U and O, as well as the large lateral area over which the measurements were averaged, precluded the direct observation of interstitial geometries and localized atomic environments.
A major strength of scanning transmission electron microscopy (STEM) and electron energy loss spectroscopy (STEM-EELS) approaches is that they provide high-resolution, simultaneous information about local structure, chemistry, and defects. Past studies have shown that STEM-EELS is capable of detecting minor changes in oxidation state and composition, and that it compares favorably to X-ray results on similar uranium compounds.Jiang et al. (2018); Tobin and Shuh (2015); Caciuffo et al. (2010); Moore and Van Der Laan (2009); Moore et al. (2004) Within the dipole approximation, these results can also be modeled using first principles methods, offering a means to quantify defect configurations and density.Jiang et al. (2018); Spurgeon et al. (2015); Aguiar et al. (2012) However, much of the pioneering STEM-EELS work on the actinides was performed several decades agoBuck, Douglas, and Wittman (2010); Colella et al. (2005); Rice et al. (1999); Xu and Wang (1999); Buck and Fortner (1997); Fortner et al. (1997) and few studiesOchiai et al. (2018) have leveraged the advanced instrumentation or the supporting first principles computing power developed in recent years. Modern aberration-corrected microscopes, equipped with bright, sub-Ångstrom electron probes and high-speed EELS spectrometers, now permit true atomic-scale spectroscopy with exceptional energy resolution.Spurgeon and Chambers (2017); Krivanek et al. (2008) Studies of complex oxides have shown that it is possible to examine image contrastJohnston-Peck et al. (2016) and spectral changesSpurgeon et al. (2017); Mundy et al. (2012) associated with oxygen defects at interfaces and around local inhomogeneitiesSpurgeon et al. (2016) that lead to significant deviations from bulk properties, but are difficult to access via other means. These as-yet-untapped techniques may inform atomistic mechanisms for actinide oxidation.
Here we compare the behavior of model oxidized (001)- and unoxidized (111)-oriented single-crystal UO2 surfaces using a combination of aberration-corrected STEM imaging and spectroscopy supported by first principles theory and image simulations. Previous X-ray CTR resultsStubbs et al. (2017, 2015) have indicated that the former surface exhibits a two-layer periodicity in surface-normal lattice contraction, but current methods are unable to directly probe local oxygen defect configurations. We present the first atomically-resolved STEM-EELS mapping of the U edge, as well as a detailed examination of the O edge fine structure in the vicinity of the crystal surface. This combination of techniques provides unique insight into the basis for image contrast and the emergence of key spectral features that result from the incorporation of excess oxygen in the near-surface region. We quantify the local interstitial content at the nanoscale, finding a large amount of excess oxygen distributed across a gradient near the sample surface; however, we see no evidence for a large-scale phase transition from the fluorite structure even at stoichiometries approaching UO*∼2.67*. Finally, we identify how these gradients impact the prior understanding of UO2 oxidation and discuss how they might also inform the analysis of other actinides. Our results illustrate how direct, real-space imaging approaches can reshape our understanding of oxygen defect formation in actinides with far-reaching societal impact.
As described in the methods, we prepared two model UO2 single crystal surfaces: an unoxidized (111)-oriented control sample stored in an inert gas environment and a heavily oxidized (001) sample exposed to pure O2 for 21 days, followed by storage in ambient conditions for several months. The former has been predicted to be the most stable UO2 surface when dry.Stubbs et al. (2017) We examined the cross-sectional structure of the near-surface region for each sample at atomic-resolution, as shown in Fig. 1. These images were acquired in the incoherent high-angle annular dark field (STEM-HAADF) imaging mode, whose contrast is approximately proportional to atomic number ; this mode is insensitive to the thickness-dependent contrast reversals that complicate the interpretation of typical high-resolution transmission electron micrographs.Williams and Carter (2009) Both samples, shown in Figs. 1.a–b, exhibited a single-crystalline structure free of extended defects or impurities and we confirmed a nominal cubic fluorite structure throughout, as described in the supplementary information. However, there is a striking difference in the contrast of the (001) crystal surface, which exhibited a nm band of increased intensity. This band was present in all the oxidized samples prepared and was not the result of carbon contamination or thickness variation, as confirmed by imaging and low-loss EELS shown in supplementary Figs. 1–2. We also performed geometric phase analysis (GPA) to assess possible strain variations at the nanoscale, as shown in supplementary Fig. S3. These results suggest that no large-scale phase transformation has occurred at the sample surface and that lattice bending is not responsible for the contrast band.
Interestingly, a study of CeO2 nanoparticlesJohnston-Peck et al. (2016) found that changes in ionic radius upon oxidation from Ce Ce4+ can impart static lattice displacements to the crystal; this, in turn, can influence electron channeling and induce sizable changes in STEM image contrast. A simple estimate using Shannon ionic radiiShannon (1976) shows that a transition from eight-fold-coordinated U4+ (1 Å) U6+ (0.86 Å) amounts to a 14% ion size reduction, in line with the change from Ce3+ (1.14 Å) Ce4+ (0.97 Å) of 17.5%. While CeO2 possesses a fluorite structure very similar to UO2 and is often used as a proxy to simulate radiation damage effects,Jiang et al. (2017); Tracy et al. (2015) we expect even greater channeling behavior due to the higher atomic scattering factor of U () versus Ce ().Peng (1999) As shown in supplementary Fig. S4, we performed an array of multislice image simulations for different UO2+x chemistries to explore the effect of the configuration and density of oxygen defects on the resulting STEM-HAADF image contrast. Fig. 1.c shows an experimental mean unit cell taken from panel b, highlighting the intense contrast of the near-surface region. This experimental cell is compared to a simulation where the stoichiometry is varied from UO2 to UO3 over 10 lattice planes in Figs. 1.c–d. The simulated image intensity shows good qualitative agreement with the experimental contrast gradient of 3–5%. A precise amount of excess interstitial oxygen cannot be determined from this comparison due to the relatively large sample thickness (55–60 nm) and computational limitations. However, our simulations combined with low loss EELS thickness measurements (see supplementary Fig. S2) indicate that the most likely explanation for the higher intensity near the surface is a large amount of interstitial oxygen, which is consistent with prior CTR analysis.Stubbs et al. (2017, 2015) These findings strongly suggest that the contrast gradient arises from changes in the local electron channeling, pointing to underlying changes in defect environment that can be probed spectroscopically.
Accordingly, we performed atomic-scale STEM-EELS mapping of the U and O ionization edges for the two samples, as shown in Fig. 2. The U edge results from white-line transitions from the U states;Degueldre et al. (2013) its higher ionization energy compared to the () and () edges makes it an excellent candidate for localized composition mapping. The O edge results from transitions from the O U and states;Wu et al. (1999); Jollet et al. (1997) while more complex, this edge encodes detailed information about the U coordination environment and therefore offers a window into defects formed during oxidation. Although previous studies have examined trends in the U white-line ratio in EELS,Colella et al. (2005); Fortner et al. (1997) hardware limitations made it difficult to perform atomic-resolution mapping needed to understand local fluctuations in composition and chemistry at surfaces and interfaces. With the development of modern aberration correctors, the large probe convergence angles, high currents, and small probe sizes needed for atomic-scale spectroscopy are now available.
We focused our spectroscopic mapping on the problem of identifying signatures of interstitial oxygen defects, which required supporting first principles calculations. Fig. 2.a shows a composition map of the U edge collected at the unoxidized (111) surface, illustrating the excellent compositional uniformity and crystallinity of the sample up to its top monolayer. Figs. 2.b–c show O edge spectra extracted from a map of the (111) surface region, progressing from the topmost layer of the crystal to its bulk. The edge displays two sharp peaks at 533 and 538.75 eV, followed by a shoulder at 543.25 eV and two broader features at 553 and 566 eV. We note that the overall line shape is in good agreement with prior workAguiar et al. (2012) and that there is little variation upon moving from the surface (spectrum 1) to the bulk (spectrum 7).
In comparison, O edge measurements of the oxidized (001) surface, shown in Figs. 2.d–e, exhibit markedly different behavior. The overall bulk spectrum 7 is quite similar to the (111) sample, with a minor change in the ratio of the two sharp peaks at lower energy loss. However, moving closer to the sample surface, there is a striking redistribution of spectral features that coincides with the presence of the surface contrast band (spectra 1–4). These features are highlighted in the difference spectra in Figs. 2.f–g. Notably, we observe the emergence of a distinct shoulder at 530.5 eV (feature 1), changes in the ratio of the two main peaks (features 2 and 4), an increase in the minimum at 535.5 eV (feature 3), as well as the emergence of a broad peak at 548 eV (feature 5). Collectively these results suggest the possibility of distinct local structures giving rise to these spectral features in the oxidized (001) surface.
We therefore turned to first principles theory calculations using the density functional theory (DFT) framework to explore possible defect structures that could give rise to the measured spectral features. Within the dipole approximation, calculated XANES spectra can be compared to measured EELS spectra, since they probe the same electronic states; these comparisons provide valuable insight and are commonly used to rationalize observed trends and fine structure features in oxides.Spurgeon et al. (2015) While a ground state approach cannot account for excited core-hole effects, they have been shown to have little influence on the predicted energy loss near-edge structure (ELNES) in the fluorites.Aguiar et al. (2010) Using the FDMNES code,Bunău and Joly (2009) we calculated O edge XANES spectra for both pristine and defective UO2 containing either an oxygen interstitial or vacancy (see supplementary information).
The calculated spectrum for bulk defect-free UO2 is in good agreement with experimental measurements deep in the bulk of the sample; as shown in supplementary Fig. S6, all the spectral features and relative intensity of the two sharp experimental peaks at 533 and 538.75 eV are well reproduced. The introduction of an interstitial O in the lattice deforms the surrounding environment, breaking the high cubic symmetry of UO2 and inducing a degeneracy in U–O bonding. Accordingly, two component spectra were calculated: one is the average of all the lattice site O atoms, and the other is for the interstitial O atom, shown by the blue and orange curves in Fig. 3, respectively. These two component spectra show differences compared to the one calculated for a defect-free high cubic symmetry UO2 (see supplementary Fig. S7); in particular, for the lattice O sites we find that the relative intensity of the two first peaks, labelled 1 and 2 in Fig. 3.a, is reversed, with peak 2 being less intense than peak 1. Especially interesting is the calculated spectrum for the interstitial O atom in UO2, which exhibits completely different spectral features compared to the one from lattice O sites. Three features—labeled a, b, and c—emerge that correspond to the positions of the experimentally observed changes, as shown in Fig. 3.b. These features are positioned such that the two minima of the interstitial O spectra, located between a and b, and b and c, overlap with peaks 1 and 2 of the lattice O site spectra, while the peak b is aligned with the minimum in-between peak 1 and 2. Another interesting characteristic in the spectra of interstitial O is that the minimum between b and c has a higher intensity than the minimum between a and b. Therefore, performing a linear combination of the calculated lattice and interstitial O edge component spectra leads to an increase of the intensity of peak 2 greater than that of peak 1, and fills the minimum between those peaks, as seen by the green linear combination fit curves shown in Fig. 3.
To compare and qualitatively reproduce the changes observed in the oxidized (001) sample, we varied the contribution of the O interstitial component in the linear combination and varied the broadening of the calculated spectra to best match the experimental one for each case. As shown in Figs. 3.a–b, the best fit—considering the relative intensity between peaks 1 and 2, as well as the minimum in-between—yields a much larger amount of interstitials for the near-surface (spectrum 3) than for the bulk (spectrum 7). The fits suggest that the stoichiometry of the material in the region of spectrum 3 is closer to UO2.6667, while it is less than UO2.0833 for the bulk region of spectrum 7 (nominally UO2), as shown in Fig. 3.c. Recognizing that the overall trend is certainly more reliable than absolute compositional values, it is nonetheless clear that there is a gradient in the interstitial distribution in the (001) sample and that the region near spectra 3 contains significantly more interstitial O atoms compared to the bulk region.
These findings are consistent with our imaging and multislice simulations, which show that a sizable interstitial O content is needed to reproduce the experimental contrast. While a combination of other defects may be involved in the change of spectral features, we note that neither O vacancies nor a homogeneous lattice expansion or contraction can effectively reproduce the spectral changes. As shown in supplementary Fig. S7, the filling of the minimum in-between peaks 1 and 2, as well as the overall intensity increase of the post-peak 2 shoulder, cannot be reproduced in these scenarios. Rather, we find that the unique spectral features observed in the sample can best be described by interstitial oxygen defects that affect the U coordination environment.
In summary, we observe an unprecedented large amount of interstitial oxygen distributed across a nanoscale gradient in the (001) surface. Importantly, we find no evidence for large-scale phase transformations, suggesting that a stoichiometry of nearly UO2.67 is attained in the fluorite structure; this value is far in excess of the UO2.25 expected from prior reports and represents a significant departure from bulk behavior. Considering the non-equilibrium nature of the oxidative process, we emphasize the competition of the bulk and surface states of the crystal. Analogous to substrate-induced “clamping” in multiferroic oxide heterostructures,Bichurin, Petrov, and Srinivasan (2003) it is likely that structural distortions of the surface are constrained by the underlying bulk, limiting associated phase transitions. The competition between transport of oxygen into the bulk and reduction of the surface may also give rise to the observed gradient in oxygen interstitial content. These new nanoscale insights can help refine our understanding of oxygen transport and defect formation kinetics in this system. More broadly, our study shows how a combination of STEM, EELS, and first principles calculations may be used to fingerprint the local chemical environment of actinide surfaces. Substantial excess oxygen manifests in image contrast changes that are accompanied by unique spectral signatures in the O edge fine structure. Our simulations are able to disentangle key contributors to these signatures, identifying likely oxygen configurations that can be examined in other related systems. Using this approach, it is now possible to examine defect generation at surfaces and interfaces, such as grain boundaries in fuel assemblies and waste forms, paving the way for more comprehensive atomistic models for oxidation of the actinides.
Acknowledgements
S.R.S. thanks Drs. Kevin Rosso, Demie Kepaptsoglou, and Lewys Jones for helpful discussions. Pacific Northwest National Laboratory (PNNL) is a multiprogram national laboratory operated for DOE by Battelle. This work was supported by the Nuclear Process Science Initiative (NPSI) at PNNL. A portion of the microscopy was performed in the Radiological Microscopy Suite (RMS), located in the Radiochemical Processing Laboratory (RPL) at PNNL. Work at the Molecular Foundry was supported by the Office of Science, Office of Basic Energy Sciences, of the U.S. Department of Energy under Contract No. DE-AC02-05CH11231. C.O. acknowledges support from the DOE Early Career Research Program. J.E.S. is supported by the National Science Foundation - Earth Sciences (EAR - 1634415) and Department of Energy- GeoSciences (DE-FG02-94ER14466 and DE-SC0019108). We thank R. Caciuffo (Institute for Transuranium Elements) and M. Paffett (Los Alamos National Laboratory) for providing the UO2 crystals.
Author Contributions
S.R.S., M.S., C.O., E.S.I., and E.B. planned the experiments. S.R.S. conducted imaging and EELS analysis. M.S. performed first principles calculations. C.O. performed multislice simulations. J.E.S. prepared the samples. All authors contributed to the data interpretation and manuscript preparation.
Additional Information
Supplementary information detailing the methods used, imaging, thickness measurements, strain analysis, multislice simulation, and first principles calculations is available in the online version of the paper. Reprints and permissions information is available online at www.nature.com/reprints. Correspondence and requests for materials should be addressed to S.R.S.
Competing Financial Interests
The authors declare no competing financial interests.
The reference list from the paper itself. Each links out to its DOI / PubMed record.
- 1Tuller and Bishop (2011) H. L. Tuller and S. R. Bishop, “Point Defects in Oxides: Tailoring Materials Through Defect Engineering,” Annu. Rev. Mater. Res. 41 , 369–398 (2011) . · doi ↗
- 2Chambers (2010) S. A. Chambers, “Epitaxial growth and properties of doped transition metal and complex oxide films,” Adv. Mater. 22 , 219–248 (2010) . · doi ↗
- 3Ganduglia-Pirovano, Hofmann, and Sauer (2007) M. V. Ganduglia-Pirovano, A. Hofmann, and J. Sauer, “Oxygen vacancies in transition metal and rare earth oxides: Current state of understanding and remaining challenges,” Surf. Sci. Rep. 62 , 219–270 (2007) . · doi ↗
- 4Sickafus et al. (2000) K. E. Sickafus, L. Minervini, R. W. Grimes, J. A. Valdez, M. Ishimaru, F. Li, K. J. Mc Clellan, and T. Hartmann, “Radiation tolerance of complex oxides,” Science (80-. ). 289 , 748–751 (2000) . · doi ↗
- 5Burns, Ewing, and Navrotsky (2012) P. C. Burns, R. C. Ewing, and A. Navrotsky, “Nuclear fuel in a reactor accident,” Science (80-. ). 335 , 1184–1188 (2012) , ar Xiv:ar Xiv:1011.1669 v 3 . · doi ↗
- 6Coyte et al. (2018) R. M. Coyte, R. C. Jain, S. K. Srivastava, K. C. Sharma, A. Khalil, L. Ma, and A. Vengosh, “Large-Scale Uranium Contamination of Groundwater Resources in India,” Environ. Sci. Technol. Lett. 5 , 341–347 (2018) . · doi ↗
- 7Colmenares (1984) C. A. Colmenares, “Oxidation mechanisms and catalytic properties of the actinides,” Prog. Solid State Chem. 15 , 257–364 (1984) . · doi ↗
- 8Moore and Van Der Laan (2009) K. T. Moore and G. Van Der Laan, “Nature of the 5f states in actinide metals,” Rev. Mod. Phys. 81 , 235–298 (2009) , ar Xiv:0807.0416 . · doi ↗