A multinomial Asymptotic Representation of Zenga's Discrete Index, its Influence Function and Data-driven Applications
Tchilabalo Abozou Kpanzou, Diam Ba, Cherif Moctar Mamadou Traor\'e,, Gane Samb Lo

TL;DR
This paper develops an asymptotic normality framework for Zenga's inequality index using multinomial representation, providing influence functions and demonstrating applications with real data.
Contribution
It introduces a multinomial asymptotic representation for Zenga's index, along with influence functions and data-driven applications, advancing the theoretical understanding of this inequality measure.
Findings
Asymptotic normality of Zenga's index established
Influence function derived for the index
Applications demonstrated with Senegalese data
Abstract
In this paper, we consider the Zenga index, one of the most recent inequality index. We keep the finite-valued original form and address the asymptotic theory. The asymptotic normality is established through a multinomial representation. The Influence function is also given. Th results are simulated and applied to Senegalese data.
Click any figure to enlarge with its caption.
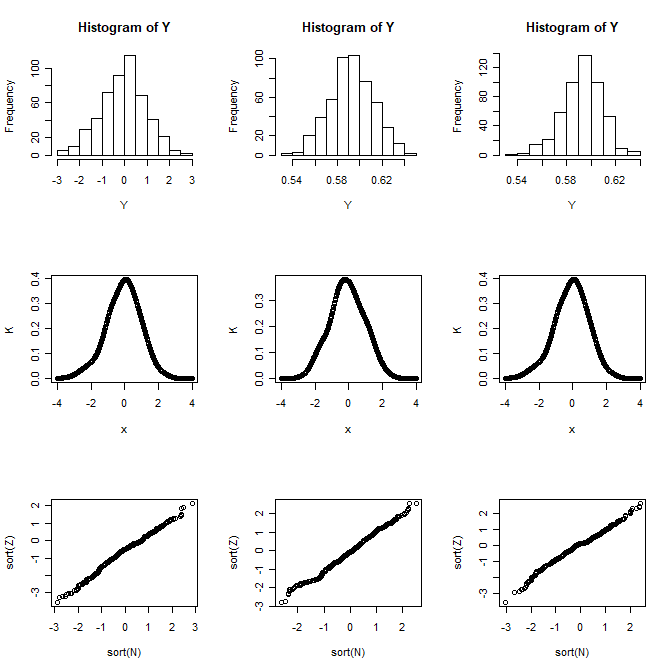 Figure 1
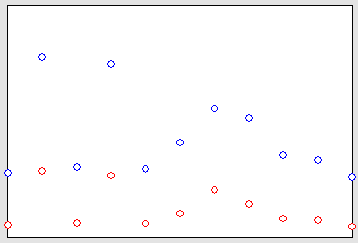 Figure 2
| classes | Represents | frequencies |
| frequencies | ||
| frequencies | ||
| ⋮ | ||
| frequencies | ||
| Total |
| values | … | |||||
|---|---|---|---|---|---|---|
| 4.515.000 | 13.485.000 | 22.455.000 | 31.425.000 | 40.395.000 | … | |
| 0.05 | 0.05 | 0.05 | 0.05 | 0.1 | … |
| values | … | |||||
|---|---|---|---|---|---|---|
| … | 49.365.000 | 58.335.000 | 67.305.000 | 76.275.000 | 85.245.000 | |
| … | 0.1 | 0.2 | 0.2 | 0.1 | 0.1 |
| Size | 100 | 200 | 500 | 750 | 1000 | 750 |
|---|---|---|---|---|---|---|
| ERM | ||||||
| MSE |
| Index | Senegal | Dakar | Diourbel | Fatick | Kaolack | Louga | .. |
|---|---|---|---|---|---|---|---|
| Zenga | 80.65 | 93.33 | 81.34 | 92.54 | 81.11 | 84.00 | .. |
| Gini | 75.00 | 80.90 | 75.26 | 80.39 | 75.16 | 16.25 | … |
| Index | … | Saint-Louis | Tamba | Thies | Ziguinchor | Kolda |
|---|---|---|---|---|---|---|
| Zenga | … | 87.69 | 86.64 | 82.61 | 82.11 | 80.24 |
| Gini | … | 78.83 | 77.26 | 75.72 | 75.52 | 47.86 |
Peer Reviews
No public reviews on file for this paper yet. If you reviewed it on a platform where reviews are public (OpenReview, ICLR, NeurIPS, ICML), you can paste yours below so the community can read it here.
Videos
No videos yet. Explain this paper in a talk, walkthrough, or lecture? Add one.
Taxonomy
TopicsFinancial Risk and Volatility Modeling · Graph theory and applications · Complex Systems and Time Series Analysis
A multinomial Asymptotic Representation of Zenga’s Discrete Index, its Influence Function and Data-driven Applications
† Tchilabalo Atozou Kpanzou
,
†† Diam Ba
,
††† Pape Djiby Mergane
and
†††† Gane Samb Lo
Abstract.
In this paper, we consider the Zenga index, one of the most recent inequality index. We keep the finite-valued original form and address the asymptotic theory. The asymptotic normality is established through a multinomial representation. The Influence function is also given. Th results are simulated and applied to Senegalese data.
† Tchilabalo Abozou Kpanzou (corresponding author).
Kara University, Kara, Togo.
Email : [email protected]
†† Diam Ba
LERSTAD, Gaston Berger University, Saint-Louis, Sénégal.
Email : [email protected].
††† Pape Djiby Mergane
LERSTAD, Gaston Berger University, Saint-Louis, Sénégal.
Email : [email protected].
†††† Gane Samb Lo.
LERSTAD, Gaston Berger University, Saint-Louis, Sénégal (main affiliation).
LSTA, Pierre and Marie Curie University, Paris VI, France.
AUST - African University of Sciences and Technology, Abuja, Nigeria
[email protected], [email protected], [email protected]
Permanent address : 1178 Evanston Dr NW T3P 0J9,Calgary, Alberta, Canada.
**keywords and phrases. Inequality measures; Asymptotic behaviour; Asymptotic representations; functional empirical proces.
**
AMS 2010 Mathematics Subject Classification : 62G05; 62G20; 62G07; 91B82; 62P20.
1. Introduction
Over the years, a number of measures of inequality have been developed. Examples include the generalized entropy, the Atkinson, the Gini, the quintile share ratio and the Zenga measures (see e.g. Zenga (1984) and Zenga (1990)), Cowell and Flachaire (2007); Cowell et al. (2009); Hulliger and Schoch (2009). Recently, Mergane and Lo (2013) gathered a significant number of inequality measures under the name of Theil-like family. Such inequality measures are very important in capturing inequality in income distributions. They also have applications in many other branches of Science, e.g. in ecology (see e.g. Magurran (1991)), sociology (see e.g. Allison (1978)), demography (see e.g. White (1986)) and information science (see e.g. Rousseau (1993)).
The inequality measure of Zenga (2006) is one of the most recent one. It is receiving a considerable attention from researchers for its novelty indeed, but for its interesting properties. Papers dealing with that measure cover theoretical aspects including asymptotic theory and statistical inference (Greselin et al. (2010b), Eldin and Marilou (1999)) and applied works to income data (Greselin et al. (2010a)), etc.
In this paper, we focus on the discrete form as introduced by Zenga (2006). We justify the asymptotic study of the discrete and finite form by a number of reasons. In some situations, only aggregated data exists. Although this is hardly conceivable today, it is still possible and it is highly probable that the researcher does not have access to the original data and has in hand only data in form of frequency tables. Some other times, frequency tables may be available while the full data is destroyed or lost. Right now, in Gambia, health data collected from the health centers are stored in daily books and the national health direction extract frequency tables from those books and this type of data is the only one available in their computerized system. So one of the main reason to work on the finite discrete data is the lack of accessibility to the full data for one reason or another. The second main is that an asymptotic theory on such king of data will give the structure of the limit results with also no severe conditions. By replacing the discrete finite probability law of the aggregated data by a general probability law, we get the precise general asymptotic case. From that simplified study, we see what might be expected in general theory before we proceed it.
Here, we suppose that the full data has been summarized into a frequencies table of the form
Each class in Table 1 is represented by a single point , usually taken as the middle of class (other possible choices are the mean of the median of observation falling in the class). So we may adopt approximatively reconstitute the data as follows
[TABLE]
In the sequel, we suppose that the data itself is discrete and takes a pre-determined number of value. First, we will give an asymptotic theory which will be given in the form of representation in multinomial laws, in opposite to representation in Brownian Bridges in the general case. Next, the influence function will be derived by direct computations and this usually allows to find again the asymptotic variance and some times as in our case, to find a different but equivalent expression of that variance.
The works presented here will be applied to incomes available in an aggregated form. At the same time, they serve as a paving way to a more general approach.
Let us suppose that the income variable is discrete and takes the () ordered values with the probabilities , with . If the income continuously observed, we have a sequence of random replications defined on the same probability space . For each the empirical distribution of on the sample is characterized by the empirical frequencies
[TABLE]
and their normalized and cumulative forms respectively
[TABLE]
and
[TABLE]
with
[TABLE]
We also define
[TABLE]
The empirical and discrete Zenga (2006)’s index is given by
[TABLE]
which is obtained by summing Formula (3.1) in Zenga (2006) over and presented as a synthetic measure of inequality. The empirical cumulative distribution function (cdf) based on the sample of size is
[TABLE]
and is the non-parametric estimator of the true (cdf)
[TABLE]
We also have the empirical probability generated by the sample is given by
[TABLE]
We may express in terms of the empirical probability measure by
[TABLE]
Finally by considering the discrete measure , where is the Dirac measure concentrated at with mass one, we may also write
[TABLE]
It is clear, by the convergence in law of the sequence of probability measures to the (the probability law of ), we see that converges to
[TABLE]
In this simple setting, the convergence are easily justified because of the finiteness of the summations and of the functions. In terms of cdf and on mathematical expectation, we have
[TABLE]
The integral in the last expression should be read as
[TABLE]
so that neither nor never vanishes on the integration domain.
On one side, we are going to draw an asymptotic normality theory of using the -multivariate binomial laws. On an other side, the sensitivity of a statistic and the impact of extreme observations on it are also two recurrent questions in the research in the field (see Cowell and Flachaire (2007))
In that context, the asymptotic variance of the plug-in estimator of statistic is of the form . From this, we may say that the influence function behaves in nonparametric estimation as the score function does in the parametric setting (See Wasserman (2006), page 19). To define the notion of IF, Let us consider the contaminated probability law of at with mass by
[TABLE]
and a functional of , namely . The influence function of the functional at , if it exists, is given by
[TABLE]
The previous remarks motivate us to derive the IF function of and to compare it with the asymptotic variance the plug-in Zenga’s estimator.
Before we proceed to our a task, we point out that asymptotic normality results for Zenga’s index are available in the literature, among them those of Greselin et al. (2010b) and Eldin and Marilou (1999). We will come back to these results in the coming paper where we deal with other version of asymptotic versions in the general case.
Here is how is organized the paper, we give our asymptotic results as described above in Section 2 in Theorems 1 and 2. Section 3 is devoted to simulation studies and data-driven application to Senegalese Data. A conclusion and perspectives section ends the paper.
2. Asymptotic Theory for the discrete Zenga measure
(A) - Asymptotic normality.
Let begin by the following reminder. For each , the random vector follows a -dimensional multimonial law of parameters and . In such a case a classical result of weak convergence (See Lo et al. (2016), for example,, as , is the following
[TABLE]
the variance-covariance matrix of is defined, for , , by
[TABLE]
We invoke the Skorohod-Wichura Theorem (See Wichura (1970)) to suppose that is defined on the same probability space and that
[TABLE]
Let us give some notation. Define vectors such that
[TABLE]
for , , such that
[TABLE]
[TABLE]
and let be the vector defined by its components as follows
[TABLE]
Finally, let us defined
[TABLE]
Theorem 1**.**
Under the notation given above, we have, as ,
[TABLE]
Proof of Theorem 1. Let us fix . We have
[TABLE]
We define
[TABLE]
and for
[TABLE]
We have
[TABLE]
Then
[TABLE]
We also have
[TABLE]
This leads to
[TABLE]
Finally, we have
[TABLE]
It is clear that
[TABLE]
We finally get
[TABLE]
By using the convergence (strong and weak) on binomial probabilities, we get
[TABLE]
Next
[TABLE]
and finally
[TABLE]
By combining Developments (A1), (A2) and (A3), we get
[TABLE]
We conclude that
[TABLE]
(B) - Influence Function of .
Theorem 2**.**
Under the notations given below, the Influence function of is given, for , by
[TABLE]
Proof of Theorem 2. Let us write, for ,
[TABLE]
and
[TABLE]
We have
[TABLE]
By using Formula (1.1), we have
[TABLE]
For short, we write
[TABLE]
We have
[TABLE]
Le us apply the definition of the IF as in Formula (1.2). Since as (The convergence being meant as a convergence in law), we have no problem to see that
[TABLE]
So we have to find the influence function of . By formally representing the differentiation of a functional by
[TABLE]
we have that the influence function of is given by
[TABLE]
But
[TABLE]
We get
[TABLE]
We get
[TABLE]
By treating in the same manner we have (We should not forget that we differentiate in the probability)
[TABLE]
Thus
[TABLE]
By replacing this limit with its expression in the equation (2.1) we get.
[TABLE]
From this, the proof is directed concluded.
3. Data-driven Applications
Simulation Study.
Quality of the convergence. We choose a Probability distribution of yearly income supported by points with lower endpoint XOF (9.030 nearly) and upper endpoint XOF(170.490 nearly) , characterized as in Table 2.
Table 2 shows the good performance of estimation the Zenga’s discrete for size samples from to . Such sizes are comparable with those of sample survey from population counted in dozen of millions.
Figure 2 shows the pretty good asymptotic normality approximation of the centered and normalized empirical Zenga’s estimator.
(B) Data-driven Applications.
We use the income Data in Senegal (2001-2002) from the database related to ANSD : Senegalese Survey from Households (2001-2202) . The incomes are given by households. We should use an adult-equivalence scale to consider to be able to compare households. The notion of adult-equivalence has already been described in Lo (2016) and implemented on different sets of data, among them the data just described above. The data are available for the whole country (Senegal) and for the 10 areas given in the following order :
(OA) : Dakar, Diourbel, Fatik, Kaolack, Louga, Saint-Louis, Tamba, Thies, Ziguinchor, Kolda.
Dakar in the most urbanized area of Senegal and includes the capital of the country, named also after Dakar. It concentrated almost 23.1% of the population.
The Zenga and the Gini index have been computed for the 11 areas from the aggregate data, and are display in Table 5 (continued in Table 6).
Through the values in theses tables, the 11 areas are ordered from the least inequality index to the greatest as follows :
Ordering by Zenga’s index : Kolda (1), Senegal (2), Kaolack (3), Diourbel (4), Ziguinchor (5), Thies (6), Louga (7), Tamba (8), Saint-Louis (9), Fatick (10), Dakar (11).
Ordering by Gini’s index : Louga (1), Kolda (2), Senegal (3), Kaolack (4), Diourbel (5), Ziguinchor (6), Thies (7), Tamba (8), Saint-Louis (9), Fatick (10), Dakar (11).
These orderings are illustrated in Figure 2.
The most striking fact is that the two index do not order the areas in an exact similar way. The most unfair areas (with the greatest values of the inequality index) are the same with the same ordering, form areas 8 to 11. From areas 1 to 7, the ordering is slightly changed but the case of Louga is remarkable. It is ranked first by Gini and seventh by Zenga.
One may think that the inequality should be greater in urban areas than in rural zone. Indeed we see that with the areas of Thies, Saint-Louis, Dakar. But Factik and Tamba are so urbanized areas. Investigating why the inequality indices (Both Zenga and Gini) are high should be investigated in accordance with local realities.
In this simple study, we are concerned with a large scale comparison studies between Zenga’s and Gini’s either but simulation studies or by theoretical investigations. This would be certainly in coming papers.
4. Conclusion and perspectives
The reference list from the paper itself. Each links out to its DOI / PubMed record.
- 1Allison (1978) Allison, P. D. (1978). Measures of inequality. American Sociological Review , vol. 43, pp. 478-484.
- 2ANSD : Senegalese Survey from Households (2001-2202) Agence Nationale de la Statistique et de la Démographie (ANSD) (2001-202) Enquête Sénégalaise Auprès des Ménages 2 (ESAM II). Website : http://anads.ansd.sn/index.php/catalog/47/study-description. etodi Quantitativi per le Scienze Economiche ed Aziendali - Universita degli Studi di Milano-Bicocca.
- 3Cowell and Flachaire (2007) Cowell, F. A. and Flachaire, E. (2007). Income Distribution and Inequality Measurement: The Problem of Extreme Values. Journal of Econometrics , vol. 141, pp. 1044-1072.
- 4Cowell et al. (2009) Cowell, F.A., Flachaire, E. and Bandyopadhyay, S. (2009). Goodness-of-Fit: An Economic Approach. Distributional Analysis Research Programme (DARP 101). Discussion Paper. Department of Economics (University of Oxford).
- 5Eldin and Marilou (1999) Emad-Eldin, A.A.A. and Marilou, O.H. (1999). Nonparametric inference for Zenga’s measure of income inequality. Metron - International Journal of Statistics , vol. LVII, issue 1-2, pp.69-84.
- 6Greselin et al. (2010 a) Greselin, F., Pasquazzi, L. and Zitikis, R. (2010 a). Zenga’s new index of economic inequality, its estimation, and analysis of incomes in Italy. Journal of Probability and Statistics , vol. 2010, pp. 1-26.
- 7Greselin et al. (2010 b) Greselin, F., Pasquazzi, L. and Zitikis, R. (20XX). Asymptotic Theory for Zenga’s New Index of Economic Inequality. Proceedings of the 45th Scientific Meeting of the Italian Statistical Society.
- 8Hulliger and Schoch (2009) Hulliger, B. and Schoch, T. (2009). Robust estimation of the quintile share ratio with bias reduction. Presented at the Swiss Statistics Meeting, October 30, 2009, Geneva.