CO, H2O, H2O+ line and dust emission in a z = 3.63 strongly lensed starburst merger at sub-kiloparsec scales
C. Yang (1), R. Gavazzi (2), A. Beelen (3), P. Cox (2), A. Omont (2),, M. D. Lehnert (2), Y. Gao (4), R. J. Ivison (5, 6), A. M. Swinbank (7), L., Barcos-Mu\~noz (8, 9), R. Neri (10), A. Cooray (11), S. Dye (12), S. Eales, (13), H. Fu (14), E. Gonz\'alez-Alfonso (15)

TL;DR
This study uses high-resolution ALMA observations to analyze a strongly lensed, starburst galaxy at z=3.63, revealing detailed structures of dust and molecular gas, and providing insights into a gas-rich galaxy merger in the early universe.
Contribution
First high-resolution imaging of dust and molecular line emission in a strongly lensed galaxy at z=3.63, revealing detailed merger dynamics and spatial distributions.
Findings
Reconstructed sub-kpc scale dust and gas structures.
Identified a major merger with two ULIRG components.
Observed similar line profiles indicating co-spatial gas phases.
Abstract
Using ALMA, we report high angular-resolution observations of the redshift z=3.63 galaxy, G09v1.97, one of the most luminous strongly lensed galaxies discovered by the H-ATLAS survey. We present 0"2-0"4 resolution images of the rest-frame 188 and 419m dust continuum and the CO(6-5), H2O(211-202) and J=2 H2O+ line emission. We also report the detection of HO in this source. The dust continuum and molecular gas emission are resolved into a nearly complete ~1"5 diameter Einstein ring plus a weaker image in the center, which is caused by a special dual deflector lensing configuration. The observed line profiles of the CO, H2O and H2O+ lines are strikingly similar. In the source plane, we reconstruct the dust continuum images and the spectral cubes of the line emission at sub-kpc scales. The reconstructed dust emission in the source plane is dominated by a compact disk with an…
Click any figure to enlarge with its caption.
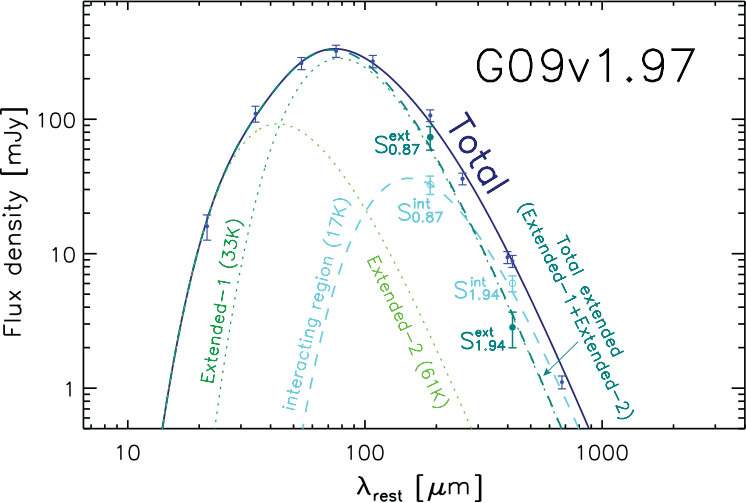 Figure 10
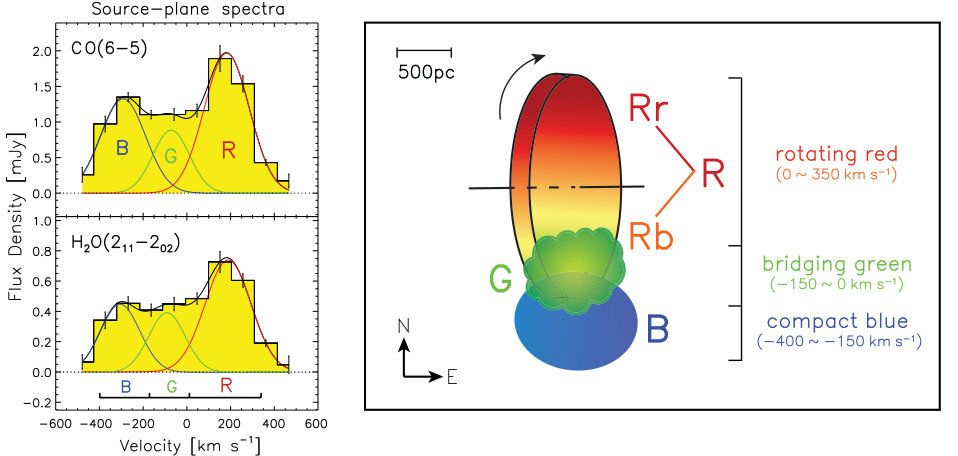 Figure 11
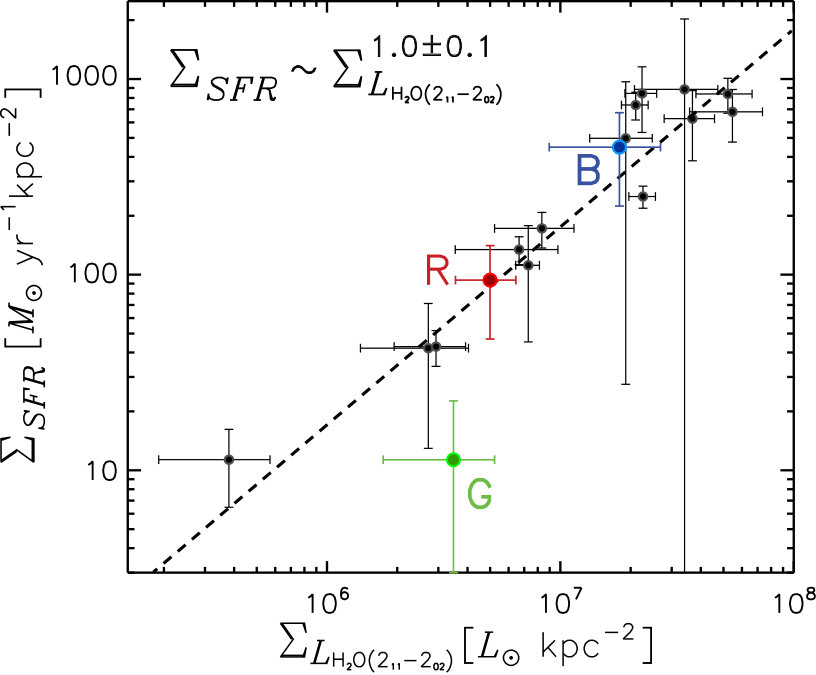 Figure 12
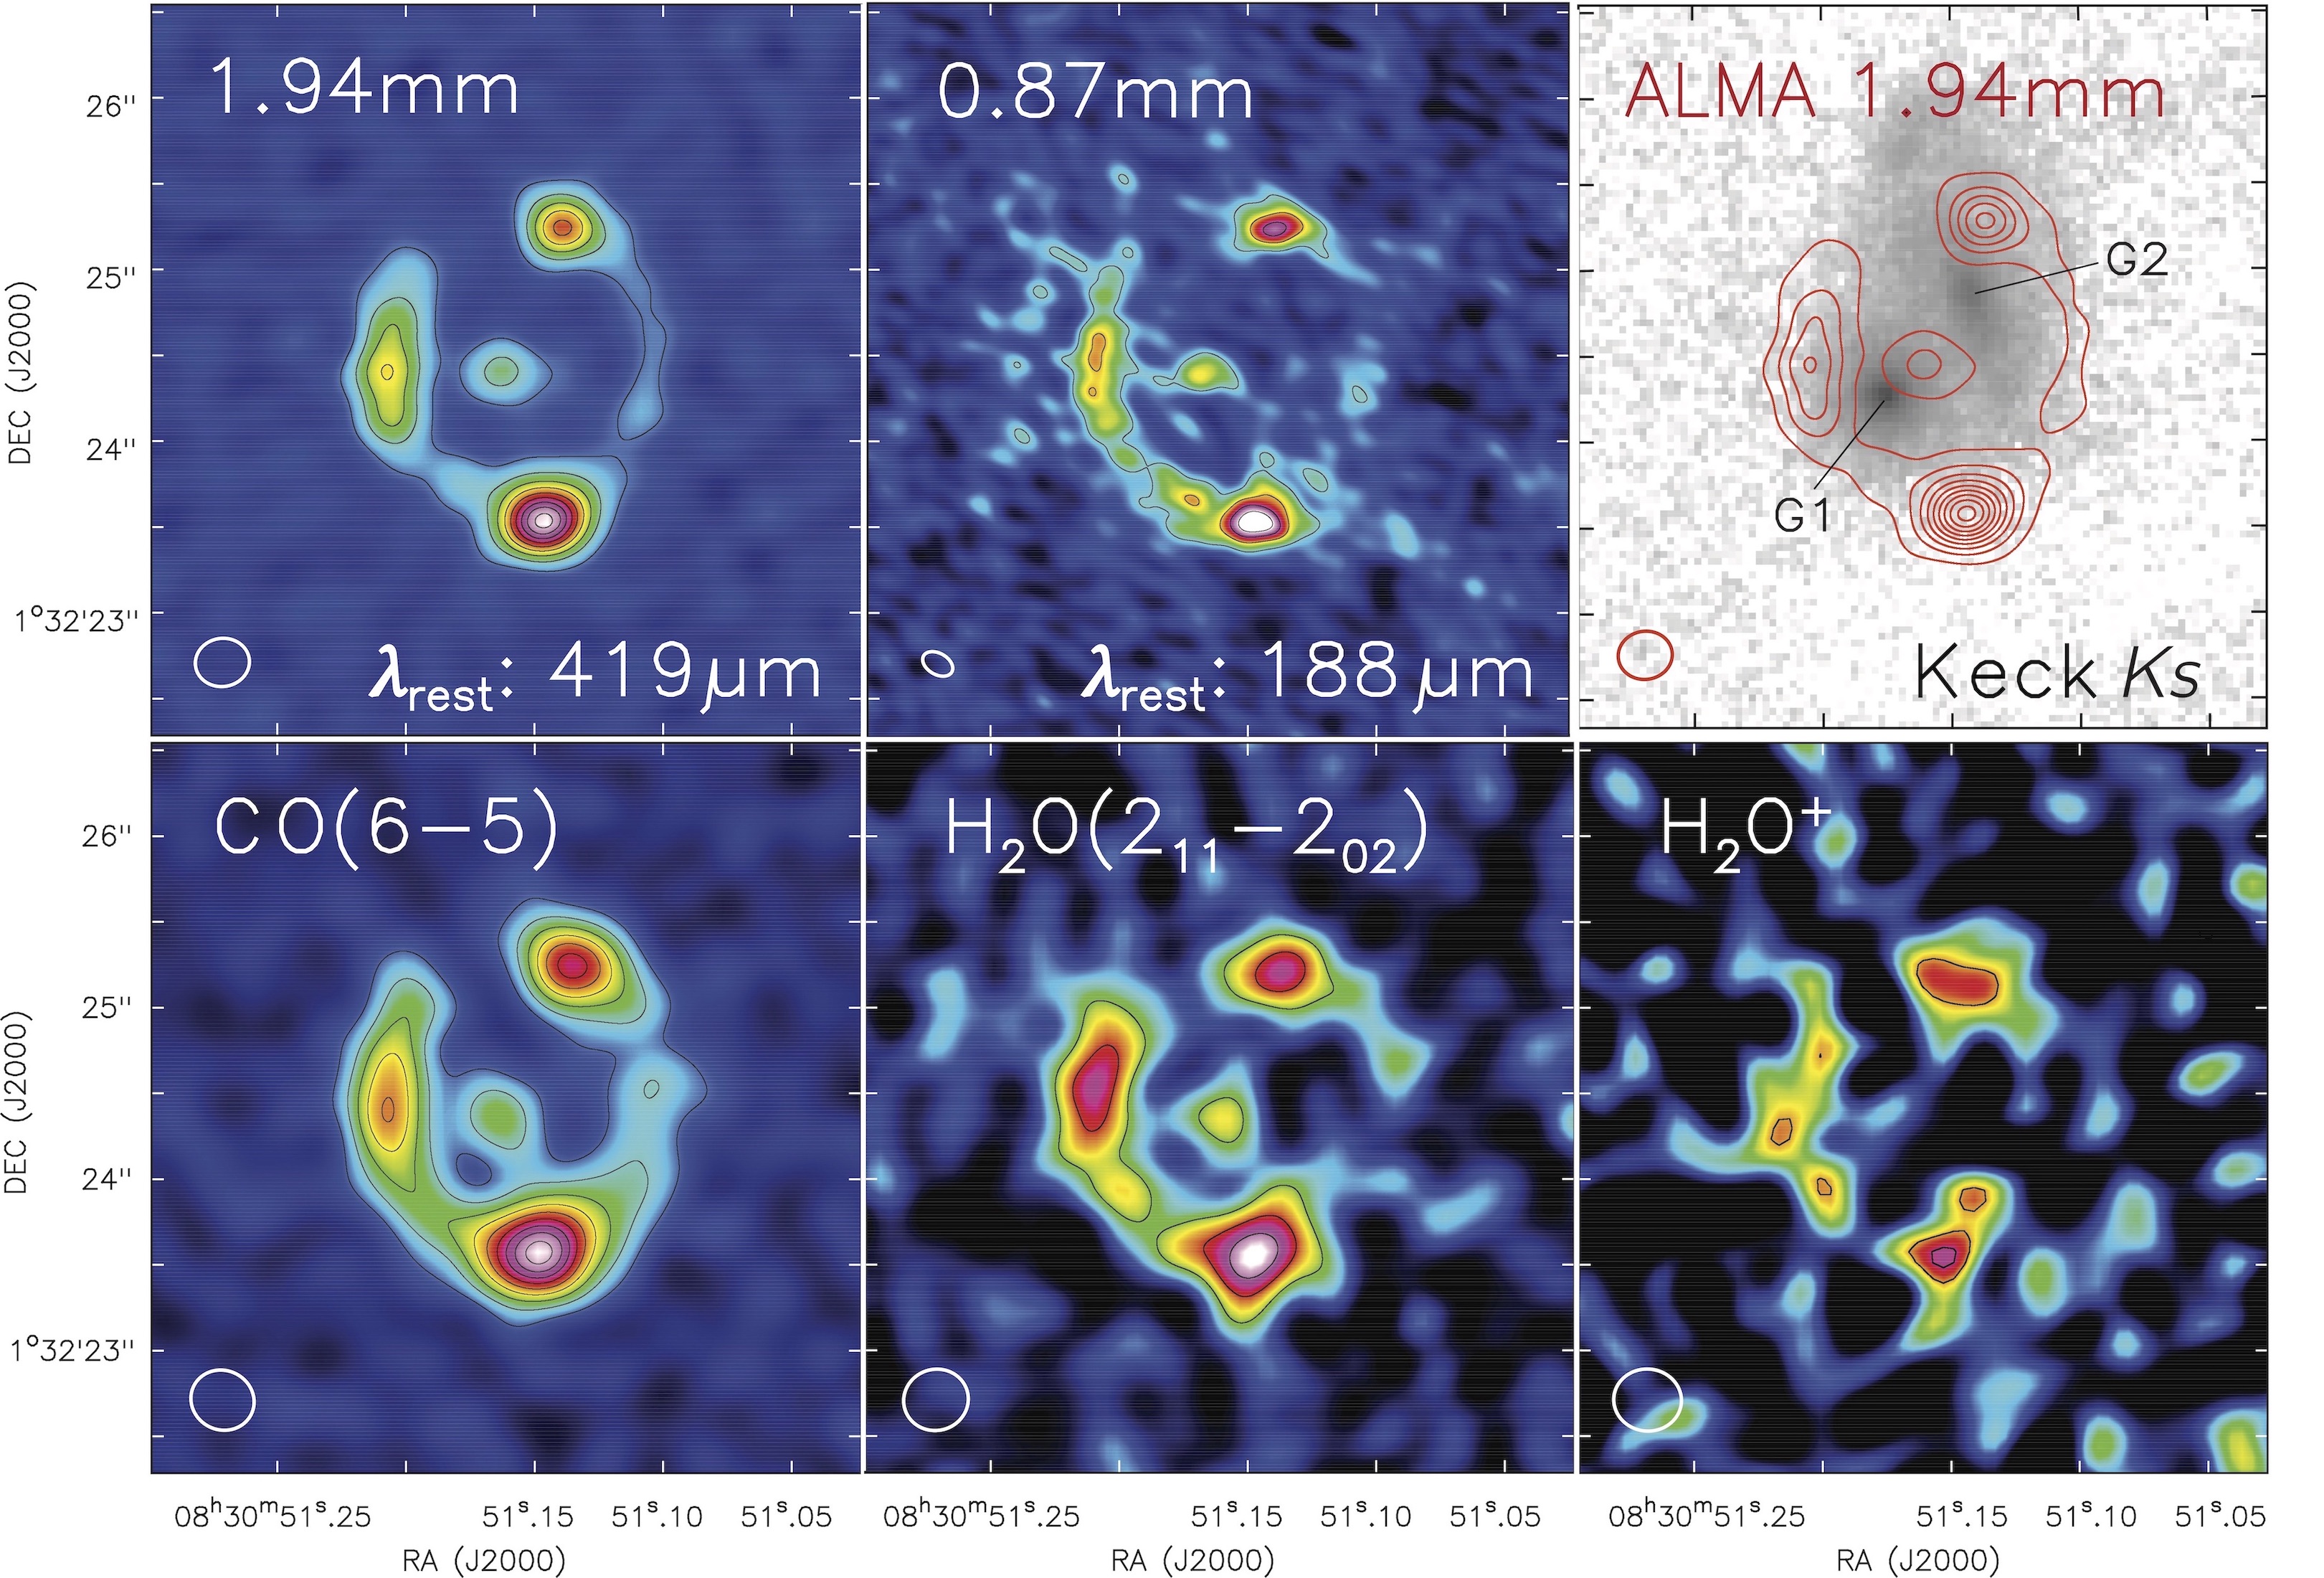 Figure 1
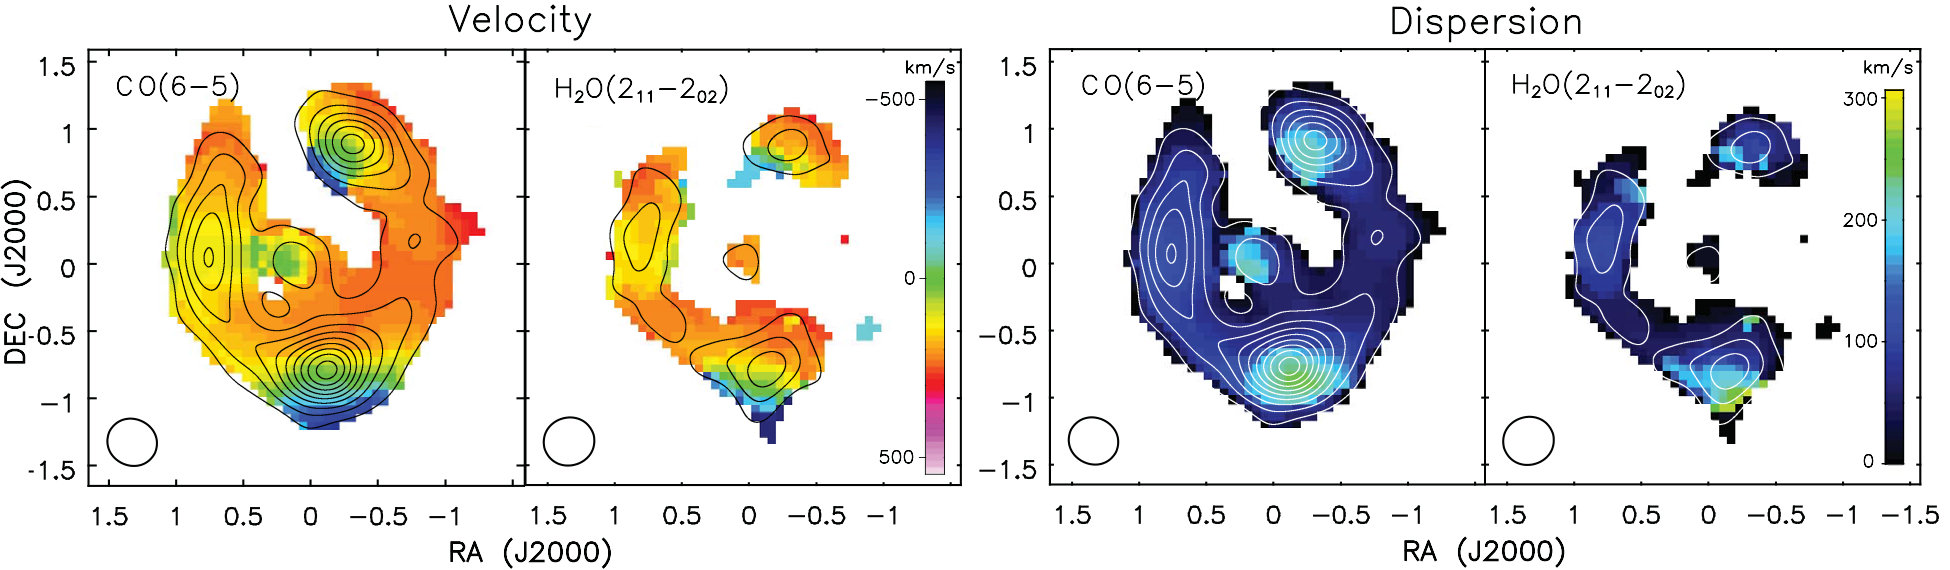 Figure 2
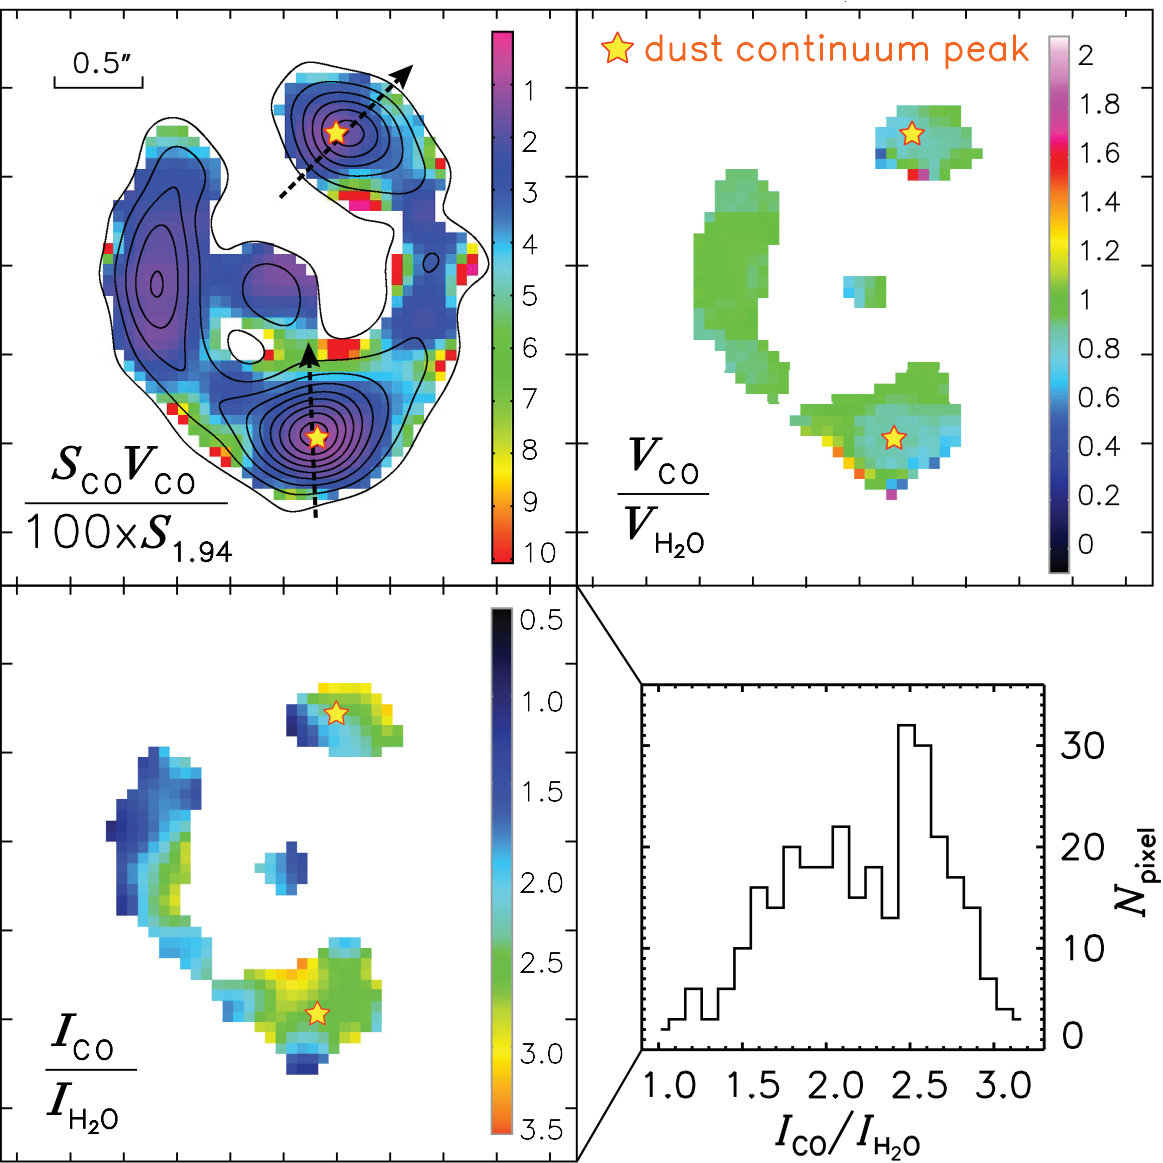 Figure 3
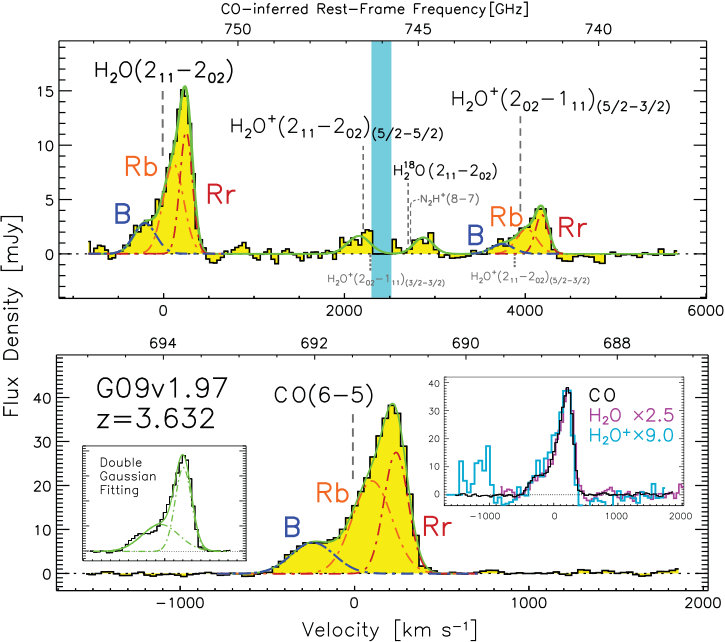 Figure 4
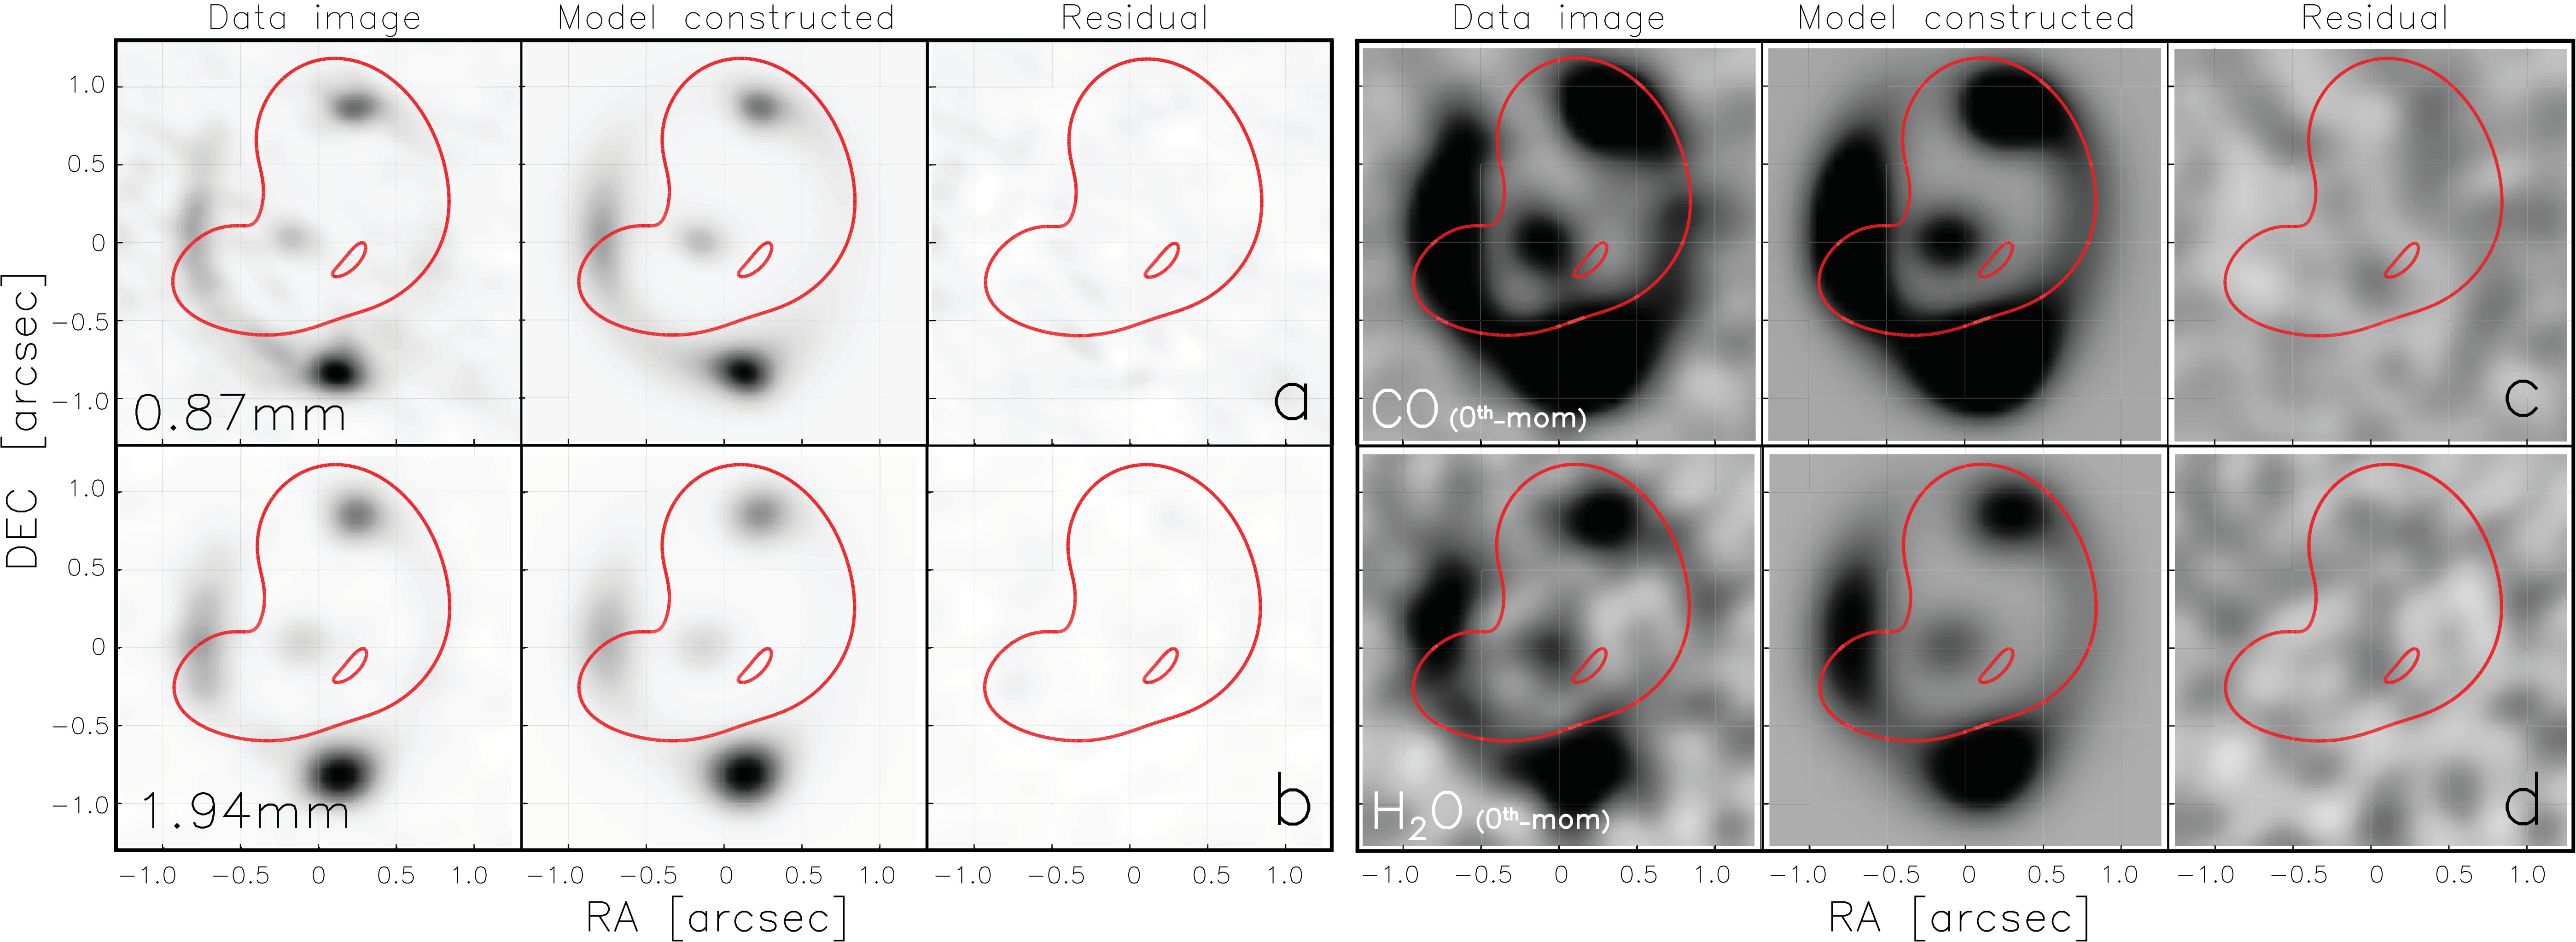 Figure 5
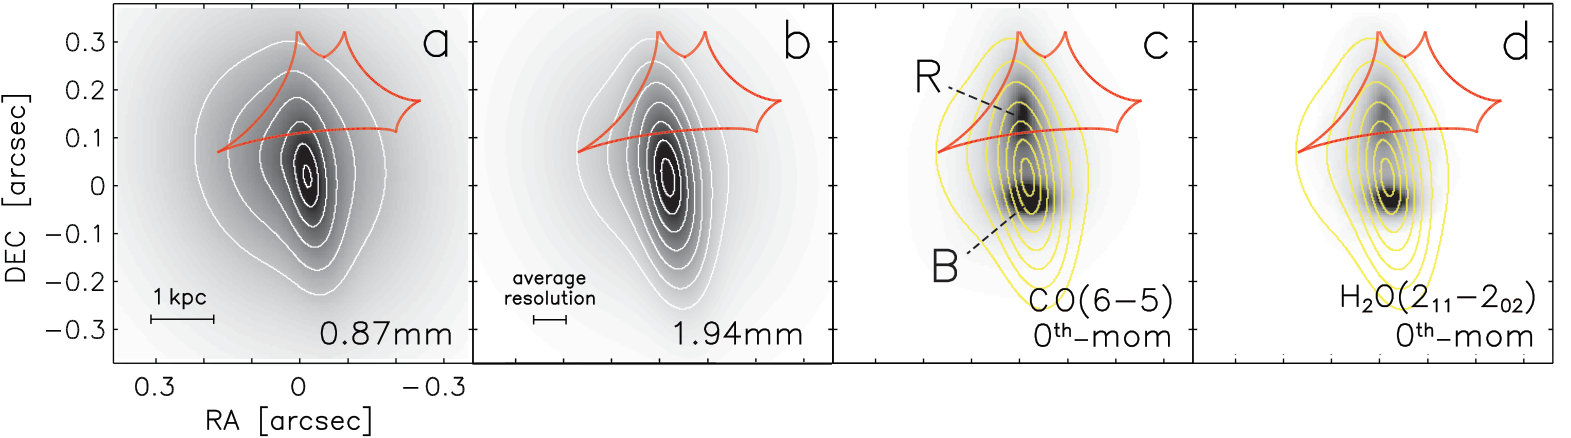 Figure 6
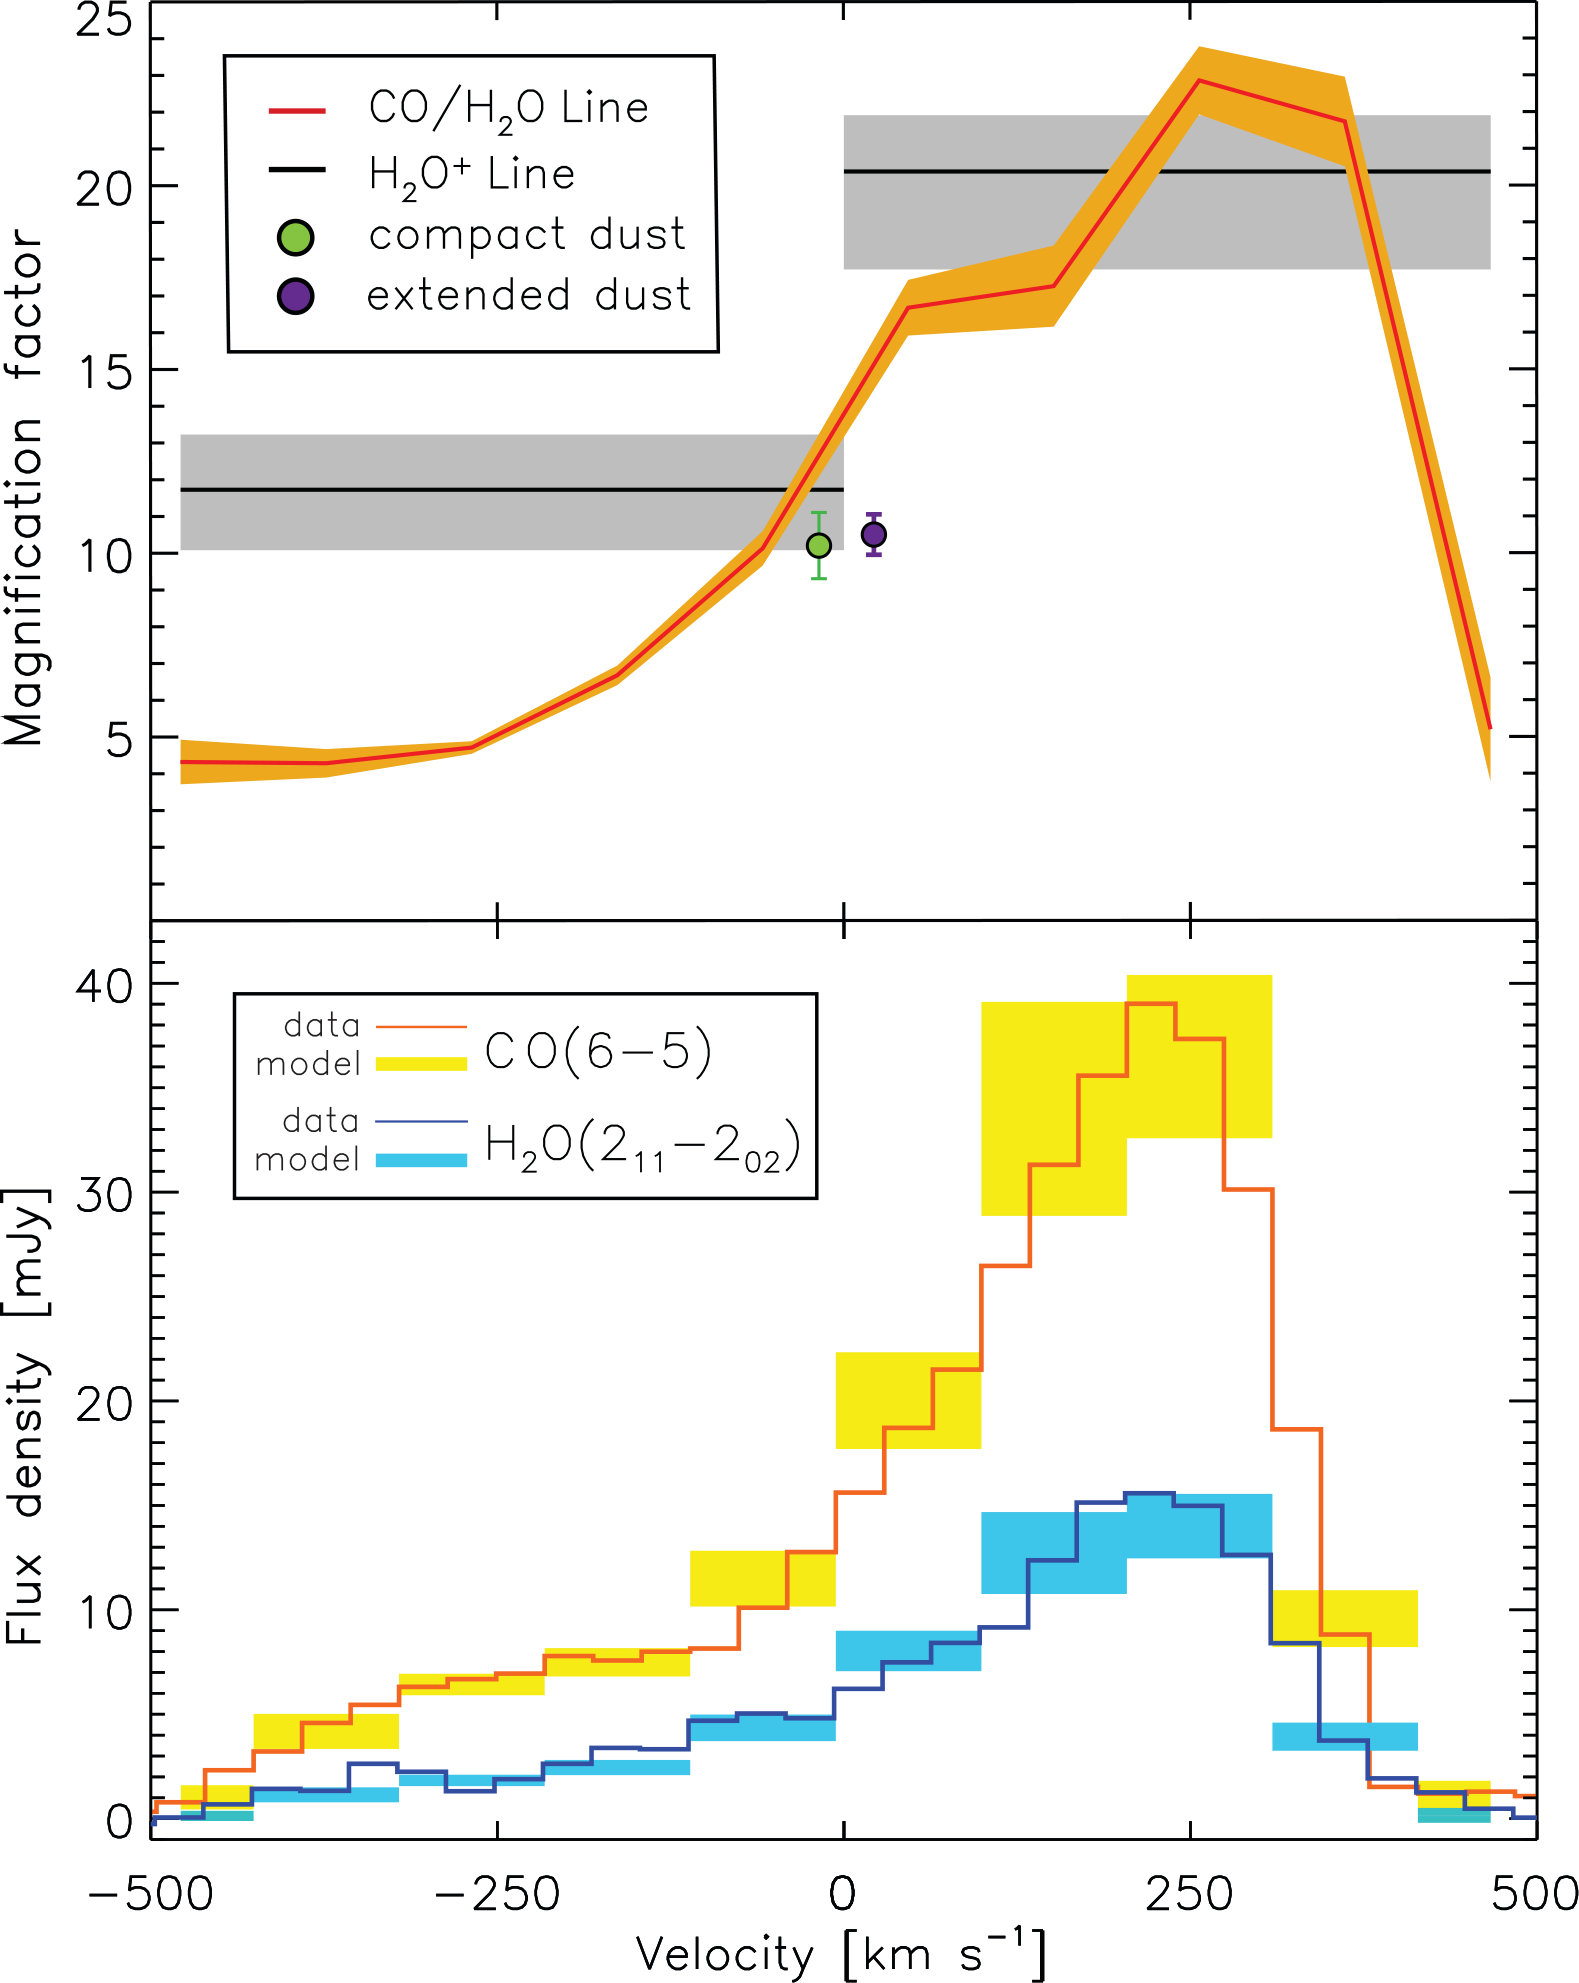 Figure 7
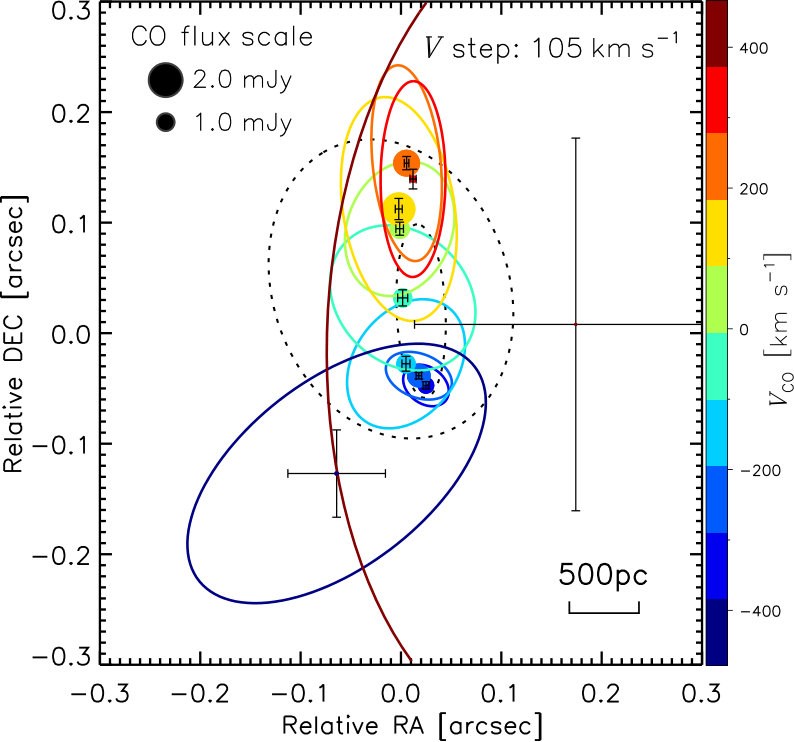 Figure 8
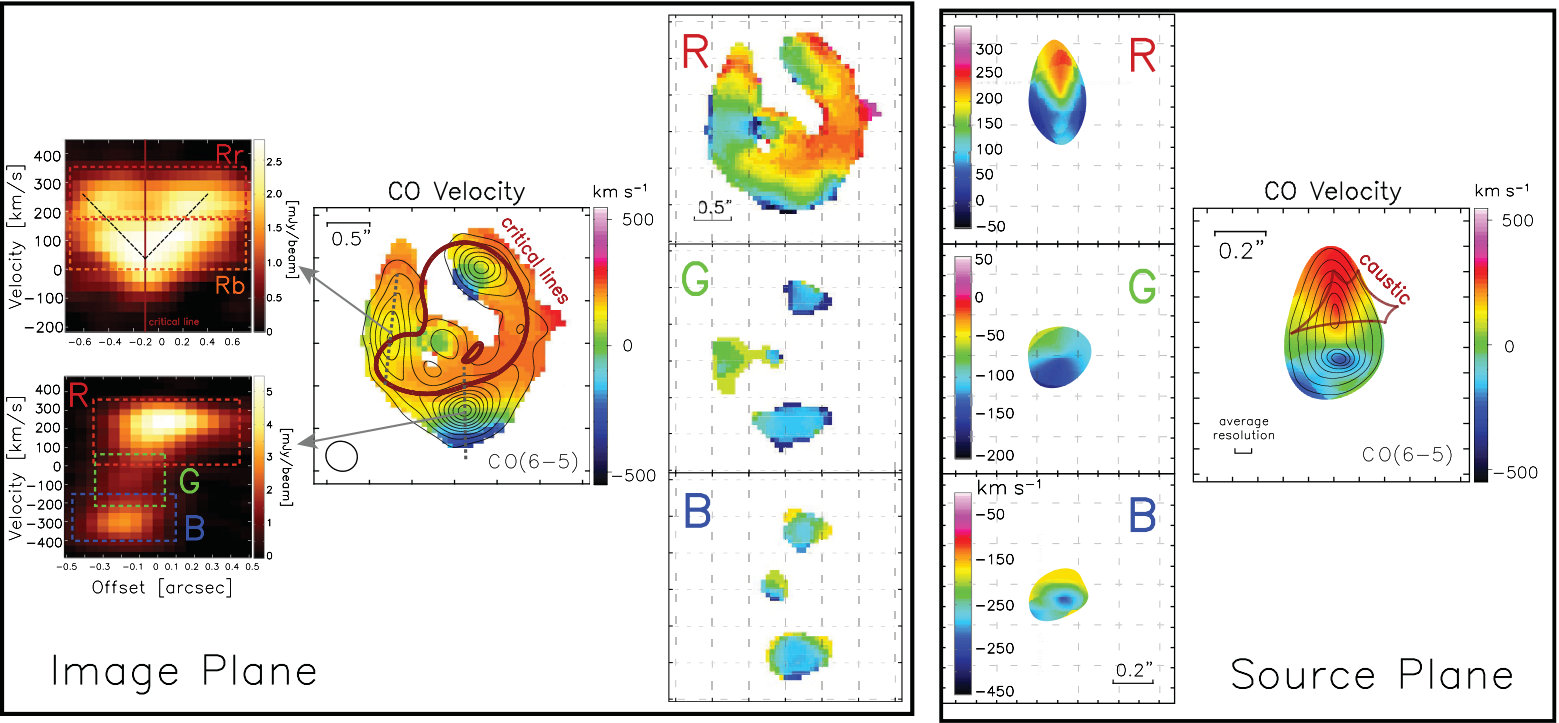 Figure 9
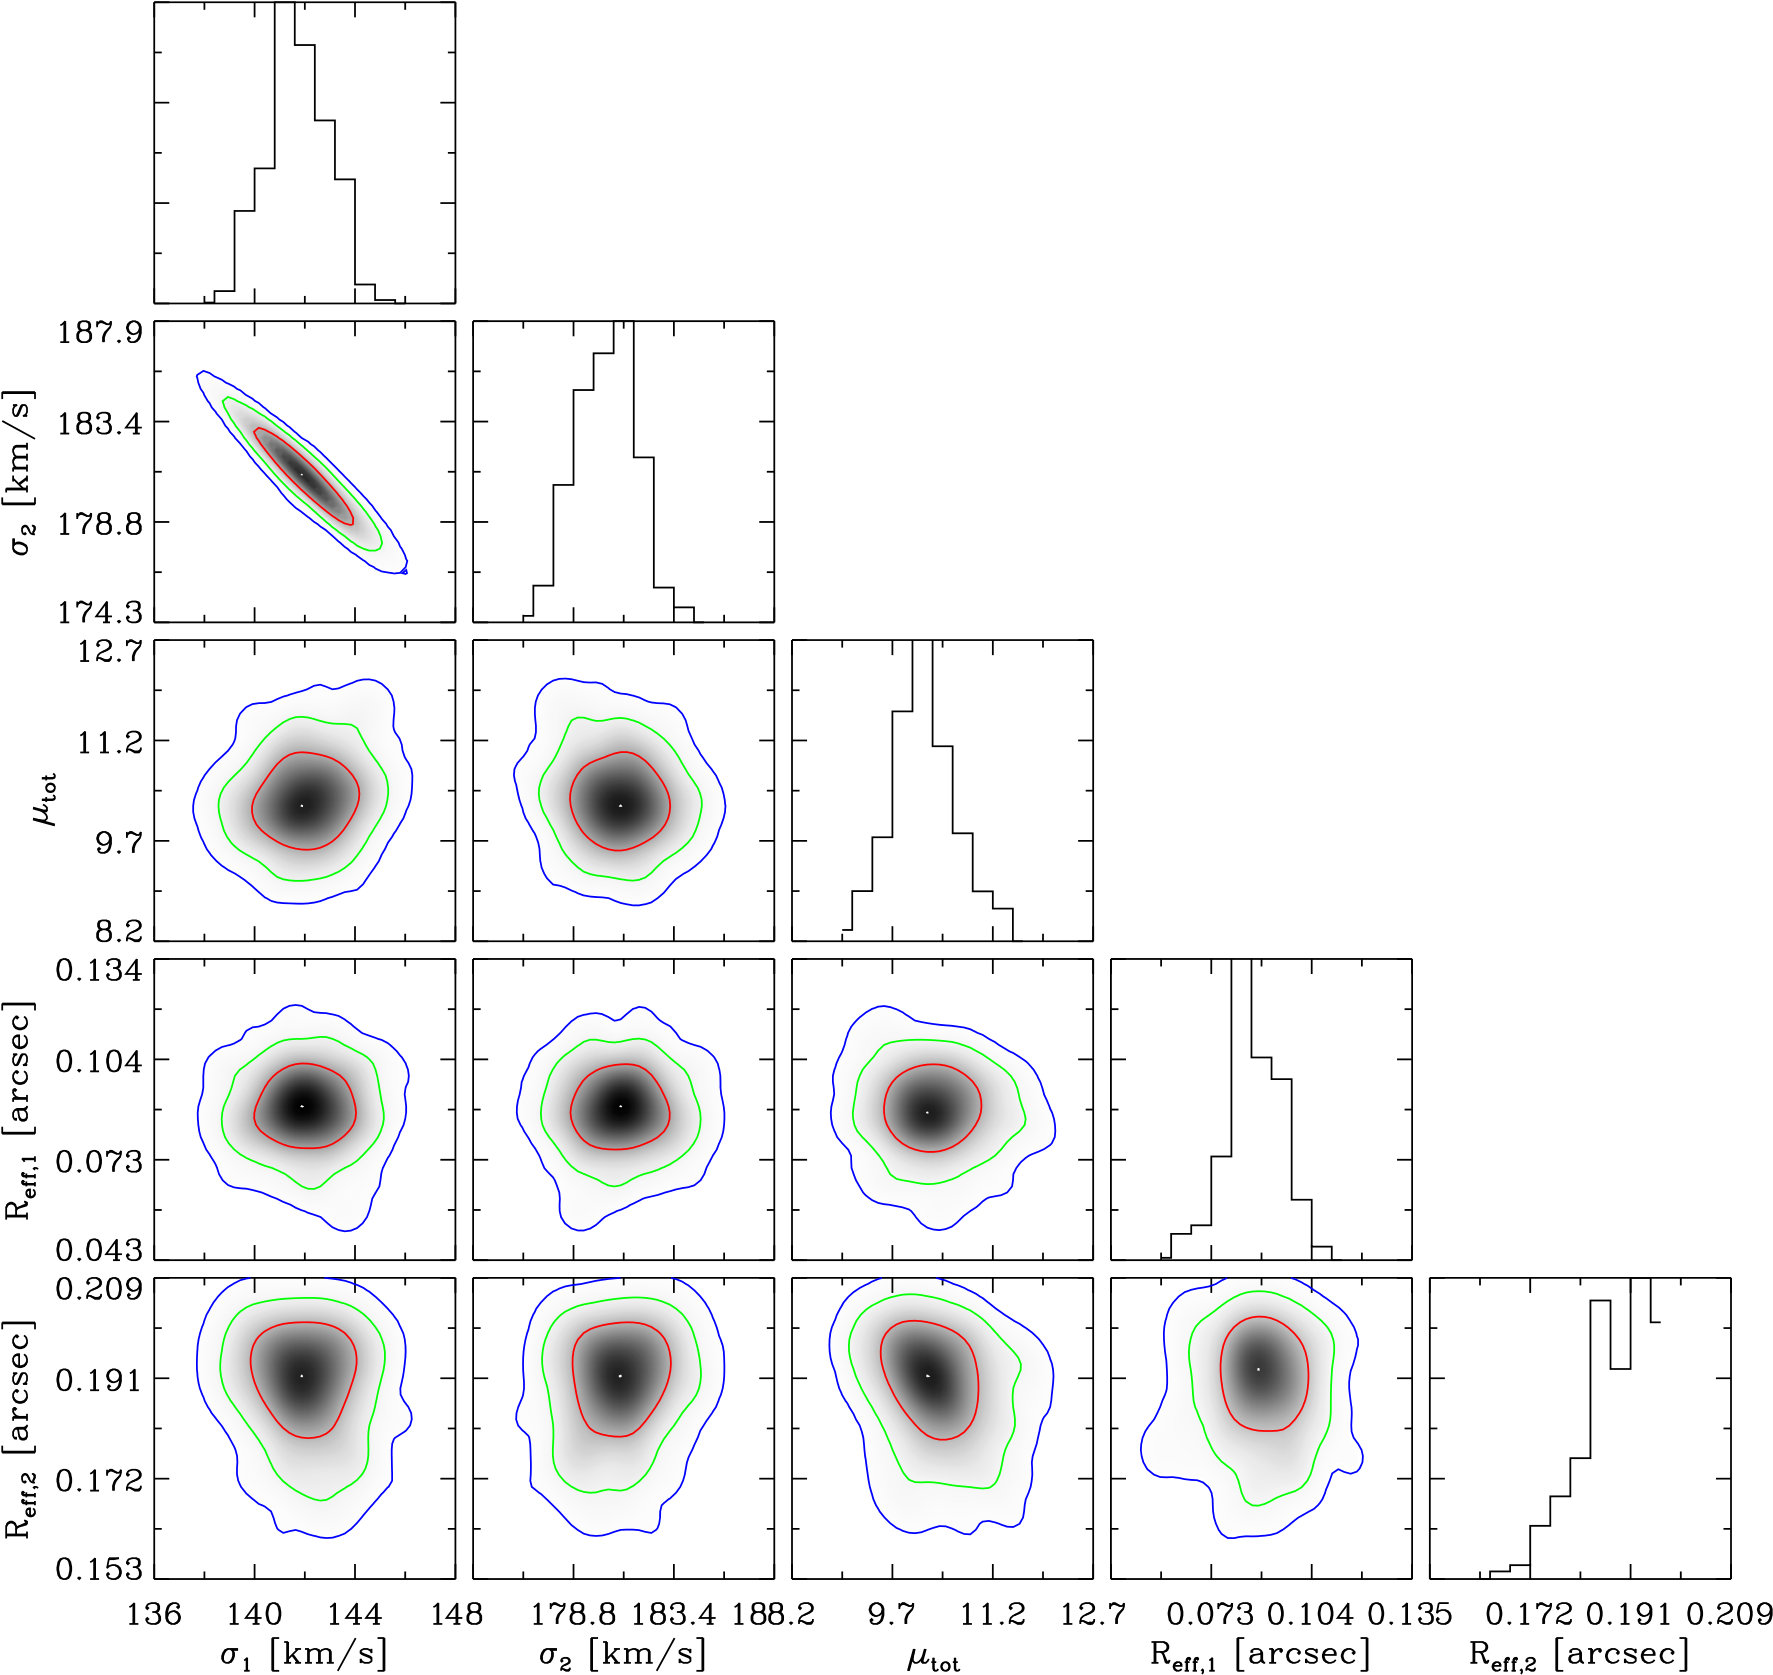 Figure 13
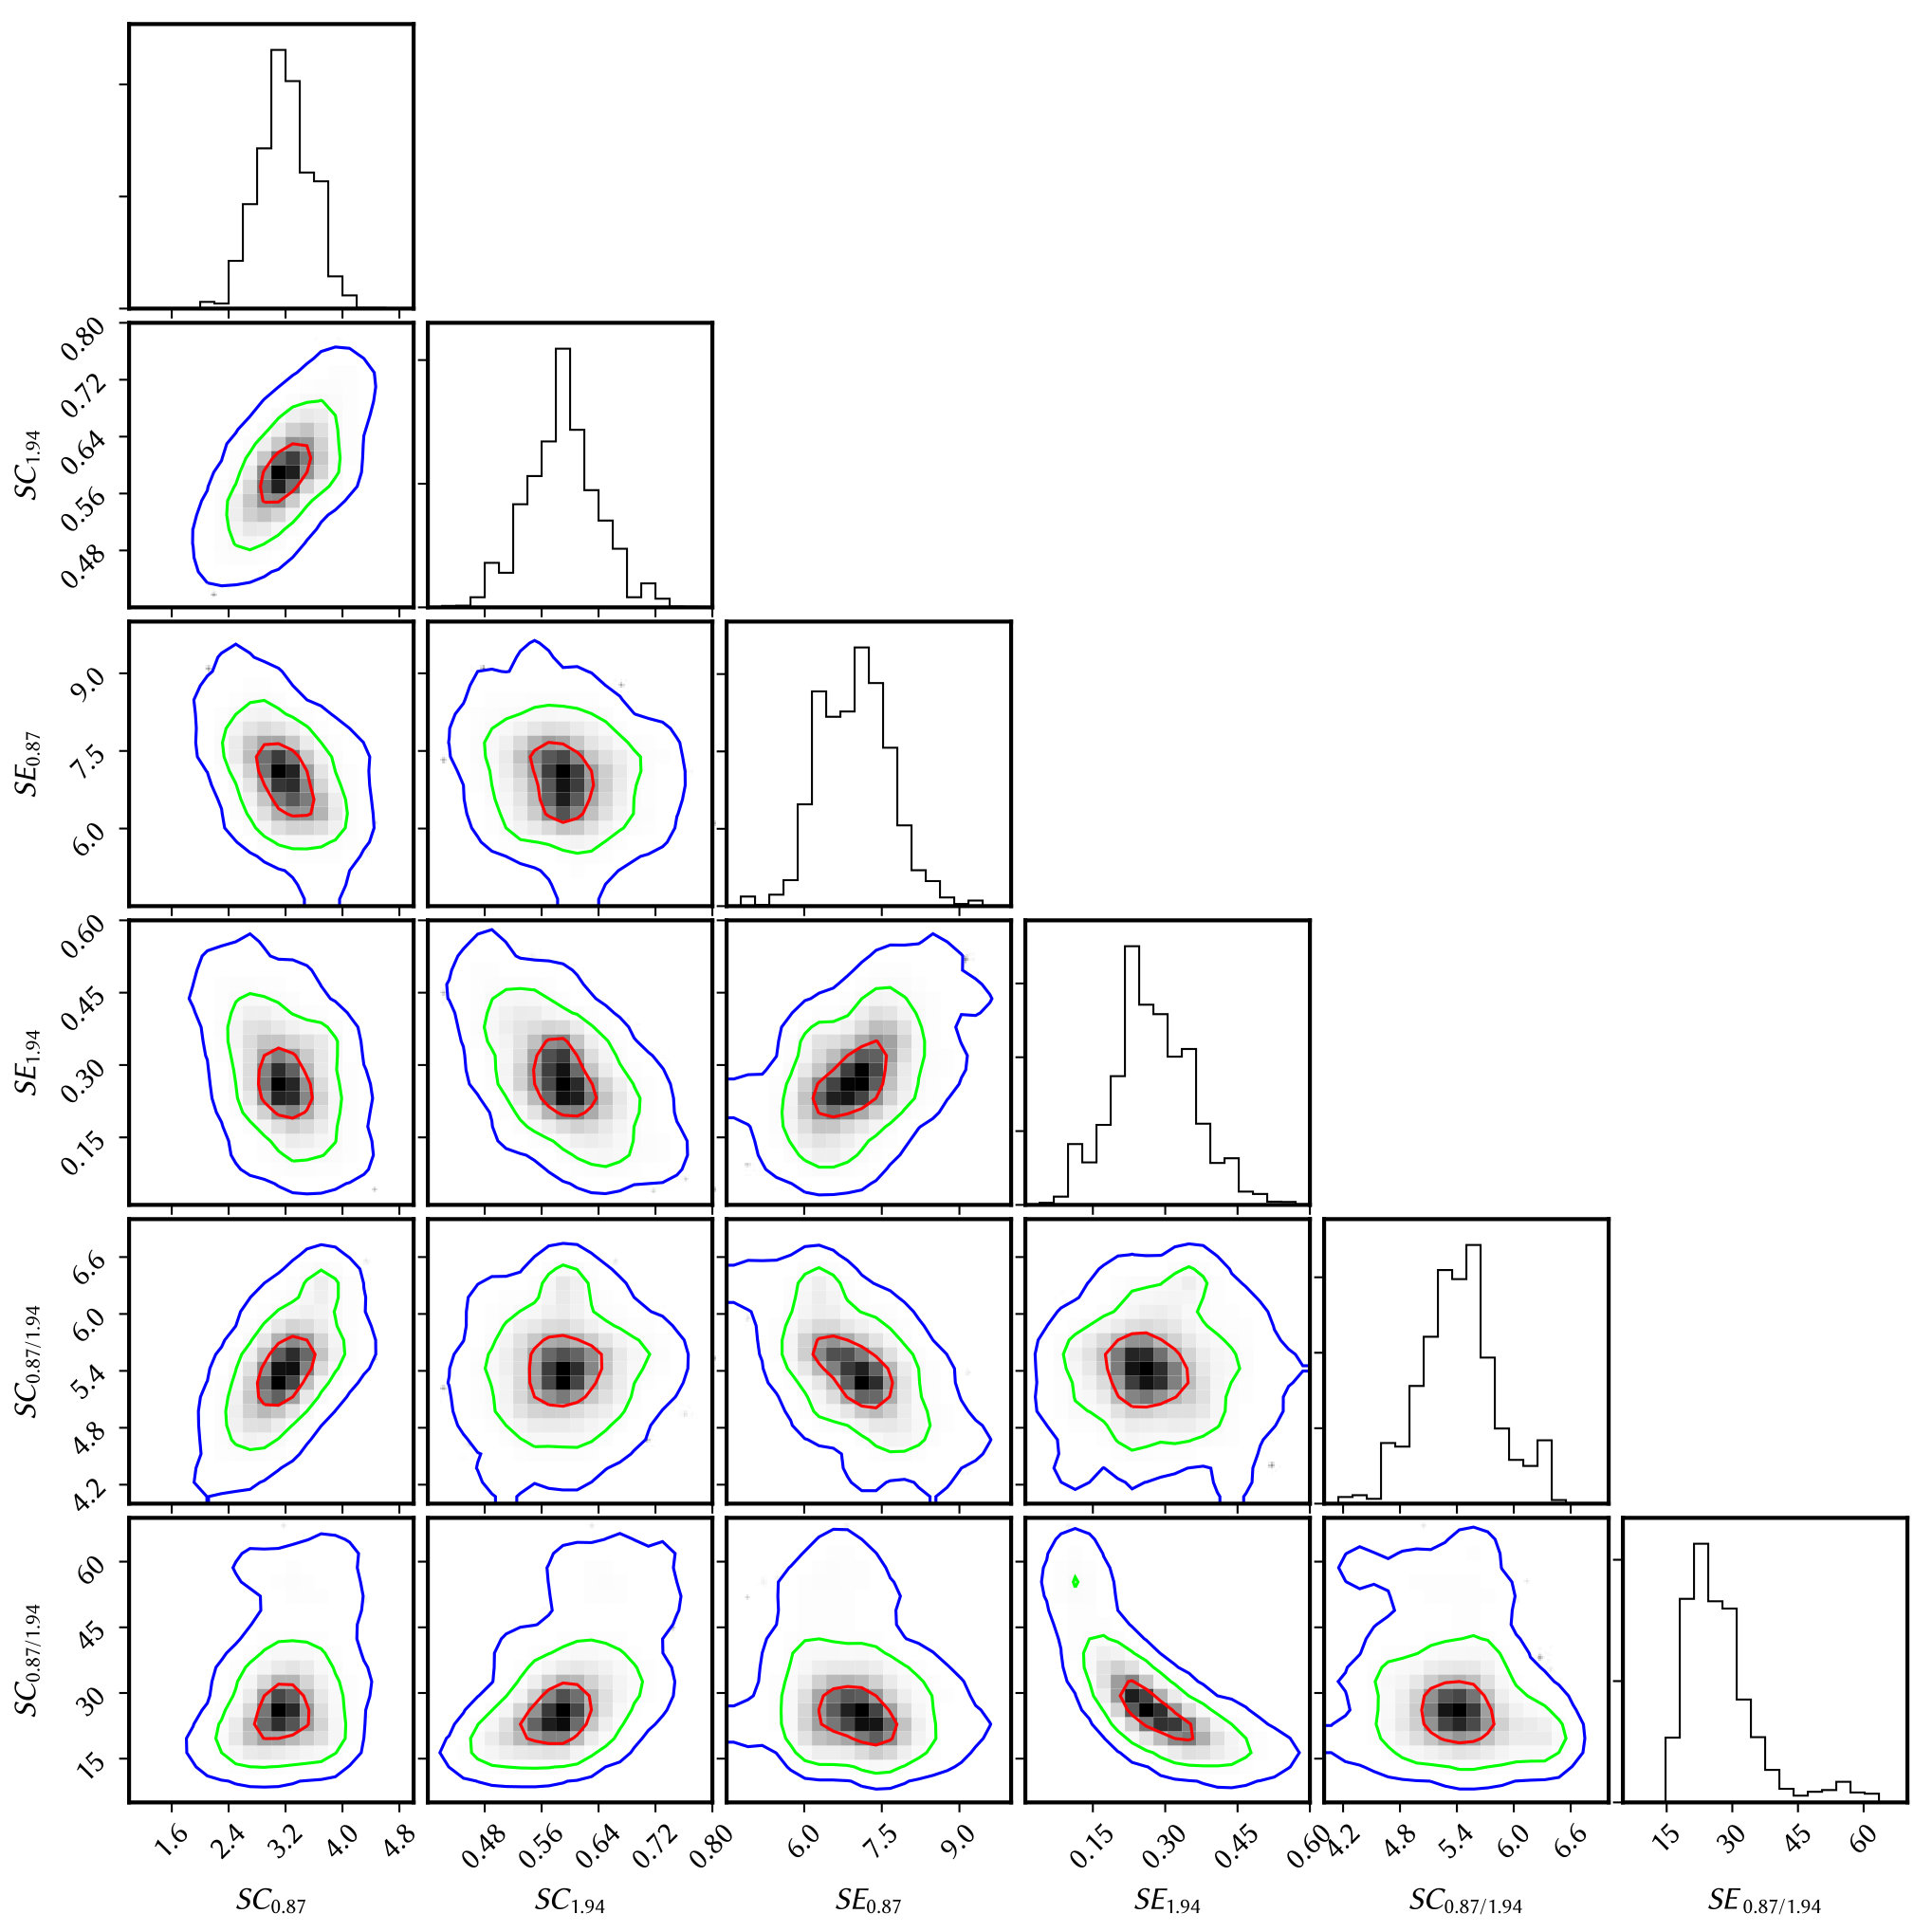 Figure 14
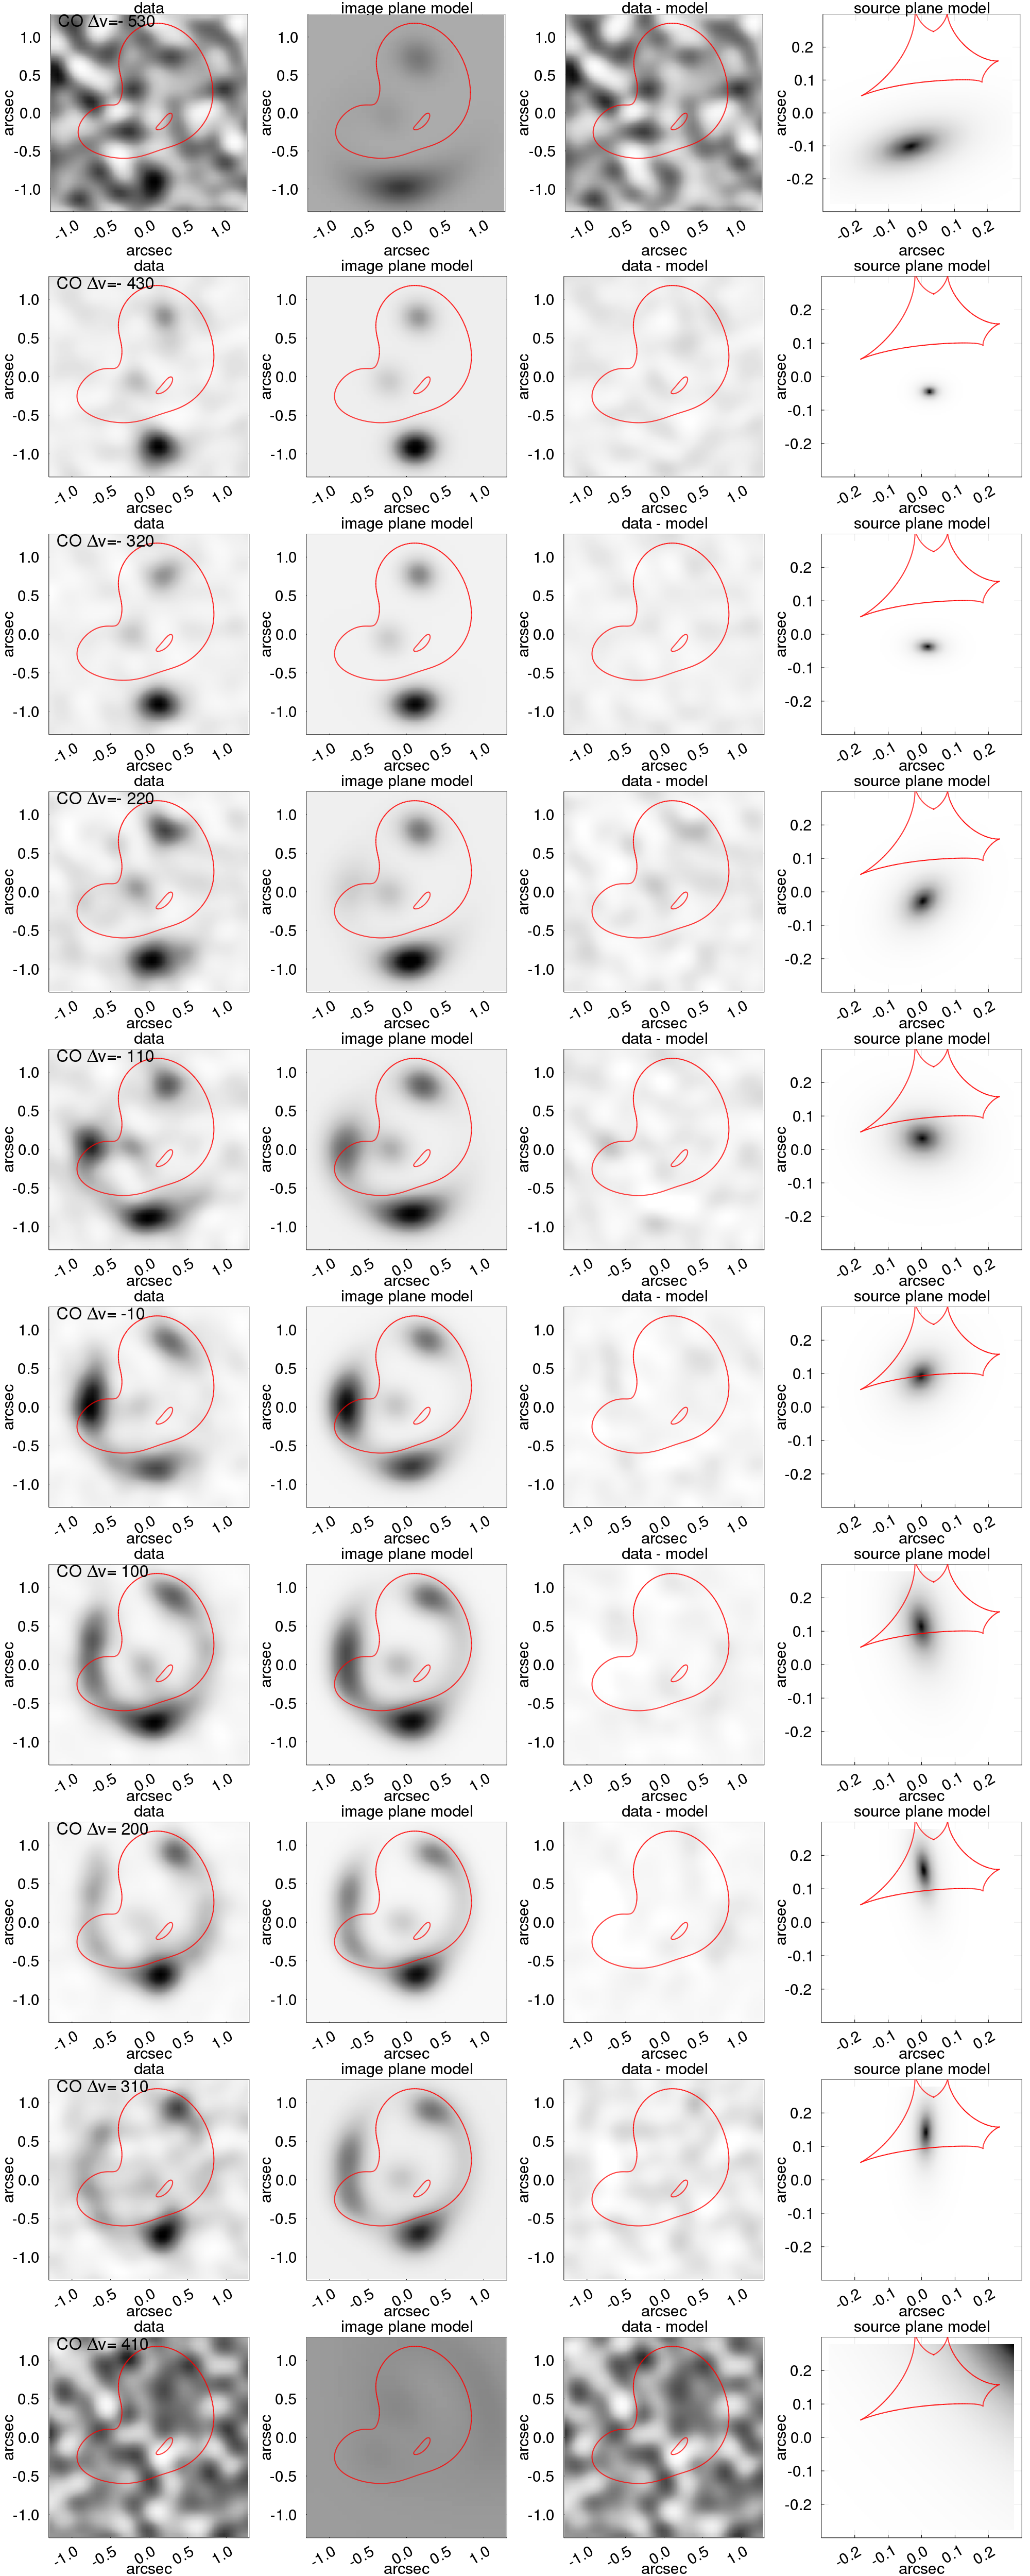 Figure 15
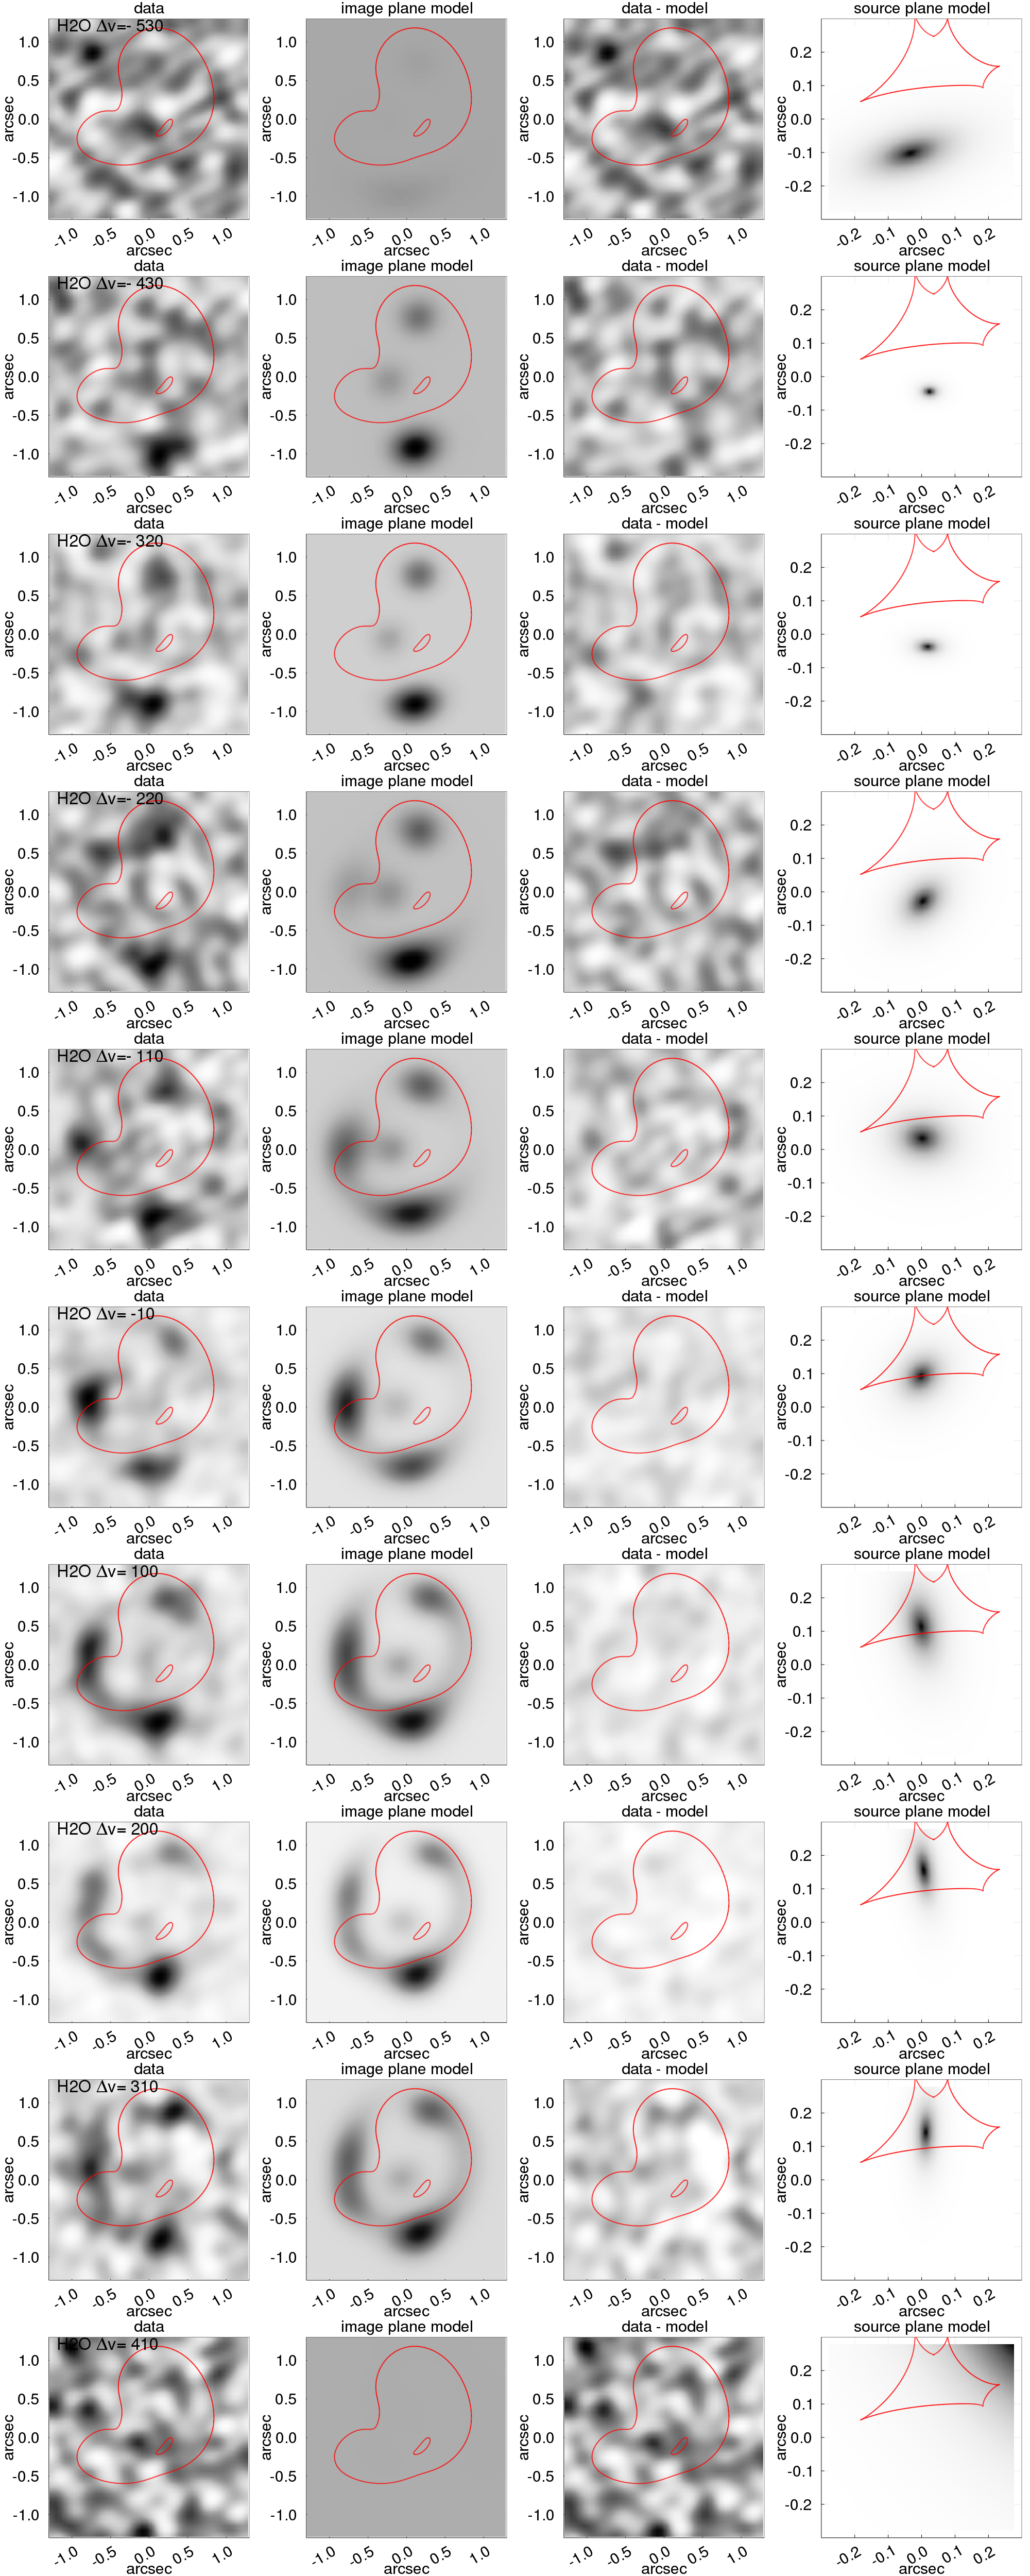 Figure 16
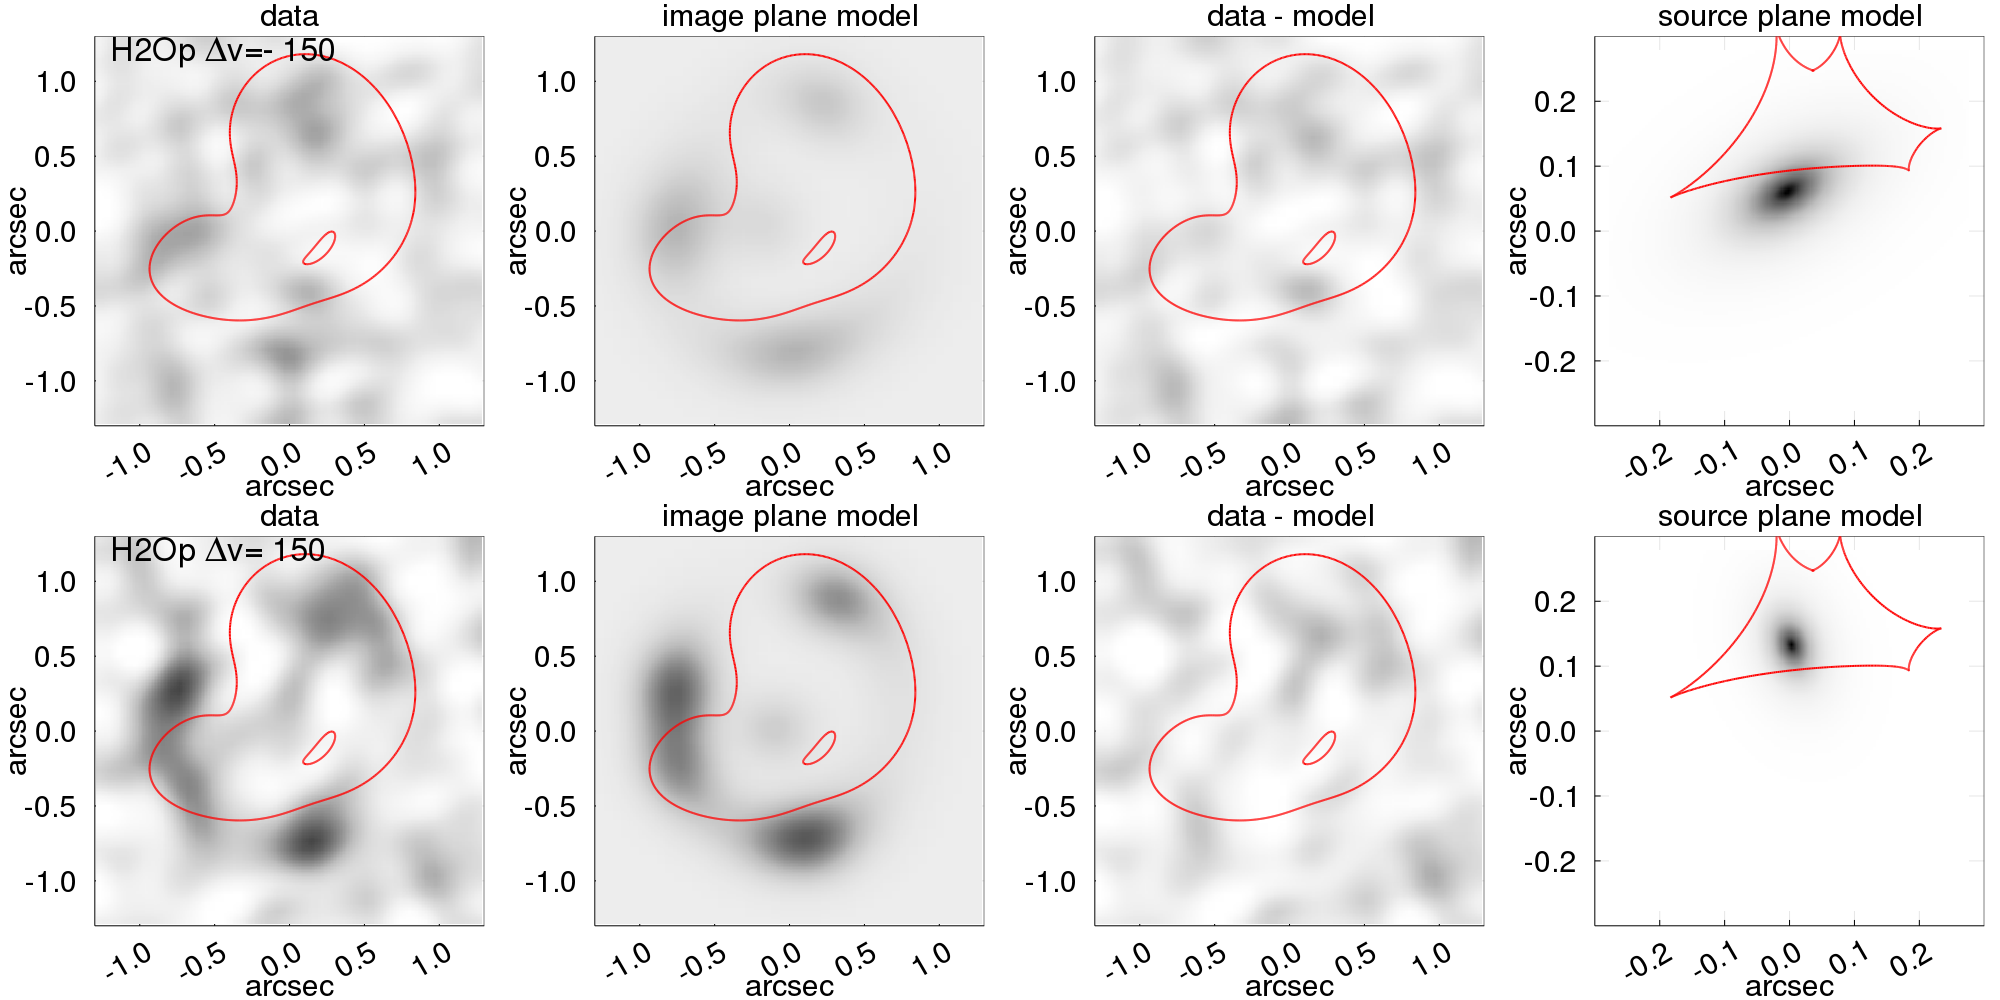 Figure 17
| Band | Date | Calibrator | Condition | SPW | Science Goal | Synthesis Beam | ||||||||||
| Bandpass | Flux | Phase | Baseline | Size | PA | |||||||||||
| (min) | (min) | (deg) | (mm) | (K) | (m) | (GHz) | (″) | (∘) | ||||||||
| 2 | 149.207 | 0.370.35 | 64 | |||||||||||||
| 4 | 04-Aug-2016 | J0750+1231 | J0750+1231 | J0825+0309 | 59.9 | 36.8 | 39 | 59 | 1.25 | 60 | 15–1396 | 0 | H2O() | 161.946 | 0.380.36 | 74 |
| 25-Aug-2016 | J0750+1231 | J0854+2006 | J0825+0309 | 68.7 | 36.8 | 38 | 28 | 0.65 | 55 | 15–1462 | 1 | H2O+ | 160.124 | 0.400.36 | 85 | |
| 0–3 | Continuuma | 154.508 | 0.320.28 | 82 | ||||||||||||
| 7 | 01-Sep-2015 | J0739+0137 | J0510+1800 | J0839+0104 | 31.4 | 3.1 | 34 | 46 | 0.29 | 94 | 15–1574 | – | Continuum | 343.494 | 0.190.12 | 60 |
| Line | Comp. | / | ||||||||
| (GHz) | (mJy) | (Jy km s-1) | (km s-1) | () | ( K km s-1 pc2) | |||||
| 149.287 | B | |||||||||
| Rb | ||||||||||
| Rr | ||||||||||
| H2O() | 162.362 | B | – | |||||||
| Rb | ||||||||||
| Rr | ||||||||||
| aH2O+() (5/2-3/2) | 161.2 | B | – | |||||||
| Rb | ||||||||||
| Rr | ||||||||||
| bH2O+() (5/2-5/2) | 160.2 | bB | b | – | b | – | b | – | ||
| cHO() | c160.907 | dRr+Rb | – | – | – | |||||
| Dust Continuum | 154.508 | 1.940 mm continuum | mJy | |||||||
| 343.494 | 0.873 mm continuum | mJy | ||||||||
| Parameters of SIE mass components | |||||
| (arcsec) | (arcsec) | (deg) | ( km s-1) | ||
| Southeast lens (G1) | |||||
| Northwest lens (G2) | |||||
| Line | Component | ||||||||
| (mJy) | (Jy km s-1) | (km s-1) | () | ( K km s-1 pc2) | |||||
| B | |||||||||
| G | |||||||||
| R(Rb+Rr) | |||||||||
| H2O() | B | ||||||||
| G | a | ||||||||
| R(Rb+Rr) | |||||||||
| B | log(/) = | = K | |||||||
| G | log(/) = | = K | |||||||
| R(Rb+Rr) | log(/) = | = K | |||||||
Peer Reviews
No public reviews on file for this paper yet. If you reviewed it on a platform where reviews are public (OpenReview, ICLR, NeurIPS, ICML), you can paste yours below so the community can read it here.
Videos
No videos yet. Explain this paper in a talk, walkthrough, or lecture? Add one.
11institutetext: European Southern Observatory, Alonso de Córdova 3107, Casilla 19001, Vitacura, Santiago, Chile. 11email: [email protected]: Institut d’Astrophysique de Paris, Sorbonne Université, CNRS, UMR 7095, 98 bis bd Arago, 75014 Paris, France. 33institutetext: Institut d’Astrophysique Spatiale, CNRS UMR 8617, Université Paris-Sud, Université Paris-Saclay, 91405 Orsay, France 44institutetext: Purple Mountain Observatory/Key Lab of Radio Astronomy, Chinese Academy of Sciences, Nanjing 210034, PR China 55institutetext: European Southern Observatory, Karl Schwarzschild Straße 2, 85748, Garching, Germany 66institutetext: Institute for Astronomy, University of Edinburgh, Royal Observatory, Blackford Hill, Edinburgh, EH9 3HJ, UK 77institutetext: Centre for Extragalactic Astronomy, Durham University, Department of Physics, South Road, Durham DH1 3LE, UK 88institutetext: National Radio Astronomy Observatory, 520 Edgemont Road, Charlottesville, VA 22903, USA 99institutetext: Joint ALMA Observatory, Alonso de Córdova 3107, Vitacura, Santiago, Chile 1010institutetext: Institut de Radioastronomie Millimétrique (IRAM), 300 rue de la Piscine, 38406 Saint-Martin-d’Hères, France 1111institutetext: Department of Physics and Astronomy, University of California, Irvine, CA 92697, USA 1212institutetext: School of Physics and Astronomy, University of Nottingham, University Park, Nottingham NG7 2RD, UK 1313institutetext: School of Physics and Astronomy, Cardiff University, The Parade, Cardiff CF24 3AA, UK 1414institutetext: Department of Physics & Astronomy, University of Iowa, Iowa City, IA 52245 1515institutetext: Universidad de Alcalá, Departamento de Física y Matemáticas, Campus Universitario, 28871 Alcalá de Henares, Madrid, Spain 1616institutetext: Instituto de Física y Astronomía, Universidad de Valparaíso, Avda. Gran Bretaña 1111, Valparaíso, Chile 1717institutetext: Astronomical Observatory Institute, Faculty of Physics, Adam Mickiewicz University, ul. Słoneczna 36, 60-286 Poznań, Poland 1818institutetext: Instituto de Astrofísica de Canarias, C/Vía Láctea, s/n, E-38205 San Cristóbal de La Laguna, Tenerife, Spain 1919institutetext: Universidad de La Laguna, Dpto. Astrofísica, E-38206 San Cristóbal de La Laguna, Tenerife, Spain 2020institutetext: Department of Astronomy, Cornell University, 220 Space Sciences Building, Ithaca, NY 14853, USA 2121institutetext: Leiden Observatory, Leiden University, Post Office Box 9513, NL-2300 RA Leiden, The Netherlands
CO, H2O, H2O+ line
and dust emission in a z = 3.63 strongly lensed starburst merger at sub-kiloparsec scales
C. Yang (杨辰涛) 11
R. Gavazzi 22
A. Beelen 33
P. Cox 22
A. Omont 22
M. D. Lehnert 22
Y. Gao (高煜) 44
R. J. Ivison 5566
A. M. Swinbank 77
L. Barcos-Muñoz 8899
R. Neri 1010
A. Cooray 1111
S. Dye 1212
S. Eales 1313
H. Fu (付海) 1414
E. González-Alfonso 1515
E. Ibar 1616
M. J. Michałowski 1717
H. Nayyeri 1111
M. Negrello 1313
J. Nightingale 77
I. Pérez-Fournon 18181919
D. A. Riechers 2020
I. Smail 77
P. van der Werf 2121
(Received …/ Accepted …)
Using the Atacama Large Millimeter/submillimeter Array (ALMA), we report high angular-resolution observations of the redshift =3.63 galaxy H-ATLAS J083051.0+013224 (G09v1.97), one of the most luminous strongly lensed galaxies discovered by the Herschel-Astrophysical Terahertz Large Area Survey (H-ATLAS). We present 02–04 resolution images of the rest-frame 188 and 419 m dust continuum and the , H2O(), and = 2 H2O+ line emission. We also report the detection of HO() in this source. The dust continuum and molecular gas emission are resolved into a nearly complete 15 diameter Einstein ring plus a weaker image in the center, which is caused by a special dual deflector lensing configuration. The observed line profiles of the , H2O(), and = 2 H2O+ lines are strikingly similar. In the source plane, we reconstruct the dust continuum images and the spectral cubes of the CO, H2O, and H2O+ line emission at sub-kiloparsec scales. The reconstructed dust emission in the source plane is dominated by a compact disk with an effective radius of kpc plus an overlapping extended disk with a radius twice as large. While the average magnification for the dust continuum is 10–11, the magnification of the line emission varies from 5 to 22 across different velocity components. The line emission of , H2O(), and H2O+ have similar spatial and kinematic distributions. The molecular gas and dust content reveal that G09v1.97 is a gas-rich major merger in its pre-coalescence phase, with a total molecular gas mass of 1011 . Both of the merging companions are intrinsically ultra-luminous infrared galaxies (ULIRGs) with infrared luminosities reaching , and the total of G09v1.97 is . The approaching southern galaxy (dominating from = 400 to 150 km s*-1* relative to the systemic velocity) shows no obvious kinematic structure with a semi-major half-light radius of = 0.4 kpc, while the receding galaxy (0 to 350 km s*-1*) resembles an = 1.2 kpc rotating disk. The two galaxies are separated by a projected distance of 1.3 kpc, bridged by weak line emission (150 to 0 km s*-1*) that is co-spatially located with the cold dust emission peak, suggesting a large amount of cold interstellar medium (ISM) in the interacting region. As one of the most luminous star-forming dusty high-redshift galaxies, G09v1.97 is an exceptional source for understanding the ISM in gas-rich starbursting major merging systems at high redshift.
Key Words.:
galaxies: high-redshift – galaxies: ISM – gravitational lensing: strong – submillimeter: galaxies – radio lines: ISM – ISM: molecules
1 Introduction
Some of the most vigorous starbursts that have ever occurred are found in the high-redshift, dust-obscured submillimeter (submm) galaxies (SMGs, Smail et al. 1997; Barger et al. 1998; Hughes et al. 1998), or dusty star-forming galaxies (DSFGs, see e.g., reviews by Blain et al. 2002; Casey et al. 2014). With total infrared (IR) luminosities integrated over the rest-frame 8–1000 m, 1012 (to even 1013 for a few), SMGs reach the limit of “maximum starbursts” (Barger et al. 2014) with star formation rates (SFRs) that can exceed 1000 yr*-1* (e.g., Simpson et al. 2015b). Their extreme star formation rates indicate that these starburst galaxies are in the critical phase of rapid stellar mass growth, presumably consuming their gas reservoir on timescales 100 Myr. Such intense star formation seen in high-redshift SMGs is thought to be triggered by galaxy mergers or at least enhanced by interaction with neighboring galaxies (e.g., Hopkins et al. 2006; Tacconi et al. 2008; Engel et al. 2010; Ivison et al. 2000; Hayward et al. 2011; Kartaltepe et al. 2012; Ivison et al. 2012; Hodge et al. 2012; Fu et al. 2013; Miettinen et al. 2017; Hayward et al. 2018; Litke et al. 2019; Xue et al. 2018). This is consistent with CDM (Lambda cold dark matter) simulations where merger rates are expected to increase with increasing redshift (e.g., Genel et al. 2009; Fakhouri et al. 2010; Rodriguez-Gomez et al. 2015). Nevertheless, some simulations predict that such intense star formation can also be produced through secular processes, which are driven by high gas fraction and instabilities in isolated clumpy disks at high redshift (e.g., Dekel et al. 2009; Davé et al. 2010). Such a scenario is also supported by observations (e.g., Tacconi et al. 2013; Hodge et al. 2016; Jiménez-Andrade et al. 2018).
Spectroscopic follow-up observations determined a median redshift of 2.5 for the SMG population discovered at 870 m (e.g., Chapman et al. 2005; Danielson et al. 2017), showing that they participate in the peak of the cosmic star formation rate density (Madau & Dickinson 2014) at 2–3 (e.g., Chapman et al. 2005; Murphy et al. 2011a; Magnelli et al. 2013; Swinbank et al. 2014). In fact, relatively bright submm sources with ¿ mJy contribute a significant fraction to the cosmic star formation rate at this epoch ( 10%, e.g., Le Floc’h et al. 2005; Murphy et al. 2011a; Magnelli et al. 2013; Swinbank et al. 2014; Dunlop et al. 2017; Michałowski et al. 2017). These high-redshift SMGs have many properties consistent with being progenitors of the local massive spheroidal galaxies (e.g., Lilly et al. 1999; Simpson et al. 2014; Toft et al. 2014; Gómez-Guijarro et al. 2018). They play a critical role in our understanding of the history of cosmic star formation and the physical processes underlying the most extreme phases of galaxy formation and evolution, although their nature remains hotly debated (e.g., Chakrabarti et al. 2008; Davé et al. 2010; Narayanan et al. 2015). This ongoing debate is sustained, at least in part, because the sensitivity and/or resolution of current observations are insufficient to unravel a complete picture of the complex physical conditions and spatial structure of their interstellar media (ISM) and of the processes that regulate the vigorous star formation.
Gravitational lensing provides one means to study the properties of the gas and dust at high spatial resolution and signal-to-noise ratio (S/N) in high-redshift galaxies by boosting the apparent flux and magnifying the apparent solid angle (e.g., Negrello et al. 2010; Swinbank et al. 2010; Riechers et al. 2011b; Conley et al. 2011; Dessauges-Zavadsky et al. 2015; Motta et al. 2018). At submm wavelengths, strongly lensed SMG candidates can be efficiently selected by applying a simple flux cut to survey images at far-IR, submm, and millimeter (mm) wavelengths, e.g., 100 mJy (Negrello et al. 2007, 2010, 2017; Wardlow et al. 2013). Although strongly lensed SMGs are rare, 0.3 deg*-2*, statistically significant samples have recently become available, thanks to extragalactic wide-area surveys such as the Herschel-Astrophysical Terahertz Large Area Survey (H-ATLAS, where sources are selected at 500 m, Eales et al. 2010), the Herschel Multi-tiered Extragalactic Survey (HerMES, also selected at 500 m, Oliver et al. 2012), the South Pole Telescope (SPT, 1.4 mm selected, Vieira et al. 2013), and the Planck all-sky survey (e.g., Planck Collaboration et al. 2015; Cañameras et al. 2015). These surveys have enabled the discovery and follow-up of hundreds of strongly lensed SMGs.
One of the most direct ways to understand the nature of these star-bursting dusty SMGs is by studying the raw ingredients that fuel their star formation, namely the content of their ISM. Such follow-up studies of the lensed SMGs have become routine (e.g., Cox et al. 2011; Gavazzi et al. 2011; Omont et al. 2011; Valtchanov et al. 2011; Fu et al. 2012; Lupu et al. 2012; Vieira et al. 2013; Bothwell et al. 2013; Omont et al. 2013; Messias et al. 2014; Dye et al. 2015; Cañameras et al. 2015; Swinbank et al. 2015; Aravena et al. 2016b; Spilker et al. 2016; Yang et al. 2016, 2017a; Oteo et al. 2017; Wardlow et al. 2017; Andreani et al. 2018; Harrington et al. 2018; Zhang et al. 2018a; Cañameras et al. 2018; Marrone et al. 2018; Spilker et al. 2018). However, most of these studies are limited in spatial resolution and only investigate their globally averaged properties. Spatially resolved observations with angular resolution approaching the characteristic scales of star-forming regions are still rare (e.g., Swinbank et al. 2015; Cañameras et al. 2017; Dye et al. 2018; Sharda et al. 2018; Massardi et al. 2018). In order to understand the detailed physical properties of high-redshift SMGs, especially their complex intrinsic structures, it is crucial to acquire high angular resolution images. From such data, fundamental information about gas and dust with different properties (e.g., density, temperature, optical depth, and mass) can be gained and related to the spatial and kinematical structures within individual sources.
However, high spatial-resolution observations of the ISM in SMGs remain a technical challenge, mostly due to their great distances. Indeed, such observations require high-sensitivity, long-baseline interferometric observations at submm/mm wavelengths. At = 3.6, a 1″ beam translates into a physical resolution of 7 kpc, which is comparable to the typical total extent of cold molecular gas reservoir within SMGs (e.g., Ivison et al. 2011, 2016; Swinbank et al. 2011; Riechers et al. 2011a; Sharon et al. 2013; Thomson et al. 2015), and 5 times larger than the size of its star-forming dense warm gas regions (e.g., 1 kpc, Tacconi et al. 2008; Riechers et al. 2013; Spilker et al. 2015; Swinbank et al. 2015; Hodge et al. 2015; Simpson et al. 2015a; Hodge et al. 2016). Reaching spatial resolutions below 007 ( 500 pc physical resolution), which are needed to resolve the star-forming dense warm gas regions of high-redshift SMGs, remains challenging for current observing facilities. Nevertheless, the magnification provided by strong gravitational lensing can boost the angular spatial resolving power by typical factors of 2–5 (e.g., Bussmann et al. 2013, 2015; Spilker et al. 2016), enabling us, in such cases, to perform high angular resolution observations with reasonable on-source integration times.
One of the brightest strongly lensed high-redshift SMGs in the H-ATLAS fields, J083051.0013224 (hereafter G09v1.97), at = 3.63 (the redshift was firstly measured from blind CO detections, Riechers et al. in prep., see Bussmann et al. 2013), is an ideal source for high spatial resolution observations. With a magnification factor of = , estimated from 880 m dust continuum observations with the SMA (Bussmann et al. 2013), the effective sensitivity is boosted by one order of magnitude and the angular resolution by an average factor of 3. Using the 1″ SMA observation (Bussmann et al. 2013) of G09v1.97, a spatial resolution of down to 2 kpc scales has been reached in the reconstructed source plane. G09v1.97 is intrinsically luminous in the far-infrared (far-IR) with an estimated intrinsic total IR luminosity of 2.3\times 10^{13}\,{\hbox{L_{\odot}}} and a star formation rate surface density of 700 yr*-1* kpc*-2* (taking the SMA-measured half-light radius size of 0.9 kpc). The total molecular gas mass is estimated to be (derived from /1010 = K km s*-1* pc2 using a CO-to-gas-mass conversion factor of 0.8 ( K km s*-1* pc2)-1), with a gas density = and a kinematic temperature = Yang et al. (2017a).
Here we present ALMA observations of the dust continuum, CO, H2O, and H2O+ line emission in G09v1.97 at spatial resolutions of 04. Based on a lens model, the spatial distribution and kinematical structures of the molecular gas can be derived at angular resolutions 01 in the source plane. The physical properties traced by the molecular line and dust emission can thus be spatially resolved on sub-kiloparsec (sub-kpc) scales, helping us to gain insight of the high-redshift SMG population. The paper is organized as follows: the observations and results are reported in Section 2; Section 3 describes the properties of the continuum and emission line images and the characteristics of the molecular line spectra; the lens modeling is outlined in Section 4; Section 5 discusses the properties of the molecular gas and dust continuum in the source plane, including the gas kinematics. Finally, concluding remarks are given in Section 6.
Throughout this work, we adopt a spatially flat CDM cosmology with , (Planck Collaboration et al. 2016), with an angular-size scale of 7.4 kpc/″at = 3.632. Using a Chabrier (2003) initial mass function (IMF), the calibration of the far-IR star formation rate () from Kennicutt & Evans (2012) gives a relation of = (/) yr*-1* (see also Murphy et al. 2011b).
2 Observations and Data Reduction
The = 3.632111Based on the observed central frequency of the line from this work. The redshift = 3.632 corresponds to a luminosity distance of = 32724 Mpc. strongly lensed SMG, G09v1.97 was observed in the 2 mm atmospheric window (Band 4) with the Atacama Large Millimeter/submillimeter Array (ALMA), in the project ADS/JAO.ALMA#2015.1.01320.S (PI: A. Omont). The observations used four spectral windows (SPW) covering two observed frequency ranges of 147.146–150.064 GHz and 159.278–162.819 GHz (see Table 1 for details). Data were acquired during two observing executions on 04-Aug-2016 and 25-Aug-2016, using 39 and 38 12-m antennas, respectively. The observations were performed with the ALMA C36-5 configuration, which provides baselines from 15 m up to about 1462 m, resulting in angular resolutions of 03–04 (with a Briggs robust weighting parameter of 0.5). The on-source integration time was 36.8 min for each execution, amounting to a total of 73.8 min on-source time, with a total amount of time for additional overheads of 54.8 min. The overheads include pointing, focusing, phase, flux density and bandpass calibrations. J0825+0309 was used as the phase calibrator and J0750+1231 as the bandpass calibrator. The flux calibrators were J0750+1231 and J0854+2006. A typical ALMA calibration uncertainty of 5% is adopted for the Band 4 data. J0839+0104 was also used as a check source222A check source, which is used to check the quality of the phase, is usually a bright quasar with a high-quality VLBI position, close to both the science target and the phase calibrator.. The total available 7.5 GHz bandwidth of Band 4 was divided into four SPWs (i.e., SPW-0, SPW-1, SPW-2 and SPW-3, see Table 1 for details), each 1875 MHz wide, covering the major targeted lines of G09v1.97, i.e., at 149.207 GHz, para-H2O() (H2O() hereafter) at 161.946 GHz and series of H2O+ lines (H2O+() (5/2-3/2) at the rest-frequency of 742.1 GHz and H2O+() (5/2-3/2) at the rest-frequency of 742.3 GHz) with a representative frequency of 160.124 GHz. In each spectral window, there are 128 frequency channels giving a resolution of 15.6 MHz ( 30 km s*-1*). The dust continuum in Band 4 is measured by combining all the line-free channels, resulting a representative frequency at 154.508 GHz corresponding to 1.94 mm or 419 m in the rest-frame. The weather conditions were good with low water vapor and stable phase during the two observing sessions as summarized in Table 1. The root mean square (RMS) of the data reaches 0.21 mJy beam*-1* in a 50 km s*-1* channel width.
We have also included in this study ALMA Band 7 continuum archive data of G09v1.97 centered at 343.494 GHz (ADS/JAO.ALMA#2013.1.00358.S, PI: S. Eales, for further discussion of this dataset, see Amvrosiadis et al. 2018), which allow us to have a better constrain of the lens model and perform a detailed analysis of the spatial distribution and properties of dust emission. The observed frequency corresponds to a wavelength of 0.873 mm, or 188 m in the rest-frame. The observations were performed on 01-Sep-2015 in good weather conditions, with 3.1 minutes on source time and a maximum baseline of 1.6 km, yielding a synthesis beam of 019012 (PA = 60∘). The bandpass, flux and phase calibrators were J0739+0137, J0510+1800, and J0839+0104, respectively. The absolute flux calibration uncertainty in Band 7 is 10%. Table 1 summarizes the details of the observations.
Both datasets were calibrated using the ALMA calibration pipelines, with only minor flagging required. The calibrated data were then imaged and CLEANed using tclean within CASA333Common Astronomy Software Applications (McMullin et al. 2007), see https://casa.nrao.edu for more information. version 5.1.1, with a Briggs robust weighting factor of 0.5 for the Band 4 dust continuum to generate CLEAN-component models. All the line free channels were combined by using the MS-MFS algorithm (Rau & Cornwell 2011) with multiple Taylor terms nterms=2 during the CLEAN process. We then performed several iterations of phase-only self-calibration until the S/N stopped improving. The typical phase variations are within 50 deg and change smoothly with time. Accordingly, the corresponding gaincal solutions were applied to the entire dataset. After subtracting the dust continuum for the line emission data cube, the datasets were then CLEANed with a Briggs robust weighting factor of 0.5 for the dust continuum (using again nterms=2, combining all line-free channels), 0.2 for the CO emission, and 0.5 for the H2O and H2O+ emission, considering the optimization between the synthesized beamsize and achieved S/N level of the CLEANed images. Similar procedures of self-calibration data reduction for the Band 7 dust continuum were also performed to maximize the S/N.
3 Results
3.1 Continuum and Emission Line Images
The ALMA images of the dust continuum and the , H2O(), and H2O+ line emission of G09v1.97 are displayed in Fig. 1. In the upper row, the ALMA Band 4 dust continuum emission at 1.94 mm ( 419 m in the rest-frame), at a resolution of 03, is shown next to the Band 7 dust continuum at 0.87 mm (rest-frame 188 m) at 015. Both the dust continuum images show a very similar structure with a nearly complete 15 diameter Einstein ring, with three major image components. This is in agreement with the SMA 880 m dust continuum image (Bussmann et al. 2013). In addition, there is a weaker and smaller image component at the center, which was undetected with the SMA. Among the three image components, the one to the south is by far the brightest. Finally, there is extended emission which connects the southern and northern components along the eastern side of the ring.
We also show the 1.94 mm dust continuum superimposed on the Keck-II/NIRC2 -band image in Fig. 1. The figure shows the two foreground deflecting galaxies, the southern galaxy at = 0.626 (G1) and the northern one at = 1.002 (G2), with the redshifts obtained from the William Herschel Telescope (WHT) ACAM spectroscopy through the detection of the Mg absorption and the [O II]3726,3729 doublet lines, respectively. A Hubble Space Telescope (HST) image taken in the F110W band, which was obtained as part of the ID 12488 Snapshot program (PI: Negrello), also confirms such a compound lens configuration.444Before comparing the ALMA images with the one from HST, we have corrected the registration of the archival optical/near-IR dataset with 9 Gaia stars in the field to ensure a good relative astrometry to within . The unusual line-of-sight configuration, with two deflecting galaxies, complicates the model of the gravitational potential (Section 4). This produces a central image that is not too de-magnified which is rarely seen in lensing configurations involving a single deflector with a cuspy mass distribution.
G09v1.97 is neither detected in the Keck-II -band (rest-frame 463 nm) nor in the HST F110W-band (rest-frame 221 nm) image, by checking the images after subtracting the foreground galaxies with GALFIT (Peng et al. 2002). Comparing the rest-frame 419 m dust continuum contours with the Keck-II image, it is evident that the contribution to the dust continuum from the two foreground deflectors is negligible. Finally, the similarities of the redshift and the profiles of the molecular line emission of the central component with the components along the Einstein ring rules out that this central emission is related to the deflecting galaxies.
Fig. 1 also shows the continuum-subtracted images with 03–04 resolution of the velocity-integrated molecular line emission of , H2O(), and H2O+ (integrated over the rest-frame 742.1 GHz H2O+() (5/2-3/2) line in SPW-1 and the 746.5 GHz H2O+() (5/2-5/2) line in SPW-0). Taking into account the range in S/N, all three molecular gas lines display a nearly complete Einstein ring morphology, akin to the one seen in the dust continuum emission, with a dominant sub-image in the south. The weak central image is detected in and H2O() but not in H2O+. Nevertheless, the upper-limit from the H2O+ image is consistent with the flux ratios between the three sub-images and the central component found in the dust continuum, the and H2O() line images. By comparing the detailed differences between the line emission and the dust continuum, we find that the line emission has a more extended morphology and resembles a more complete ring-like structure compared to the dust emission. Comparing the ratios between the brightest southern component and the two weaker ones in the northwest and northeast, the dust continuum of the southern component is about twice as bright, while for the line emission, the ratio ranges from 1.3 to 1.7 (20% uncertainties), and about 1.5 (with a larger uncertainty) for the H2O emission. This indicates that the rest-frame 200–400 m dust emission is slightly more concentrated than the CO and H2O line emission. Finally, the H2O+ emission is detected in the brightest southern component at 4-, while it is only marginally detected in the two other components with S/N ratios of about 3 (Fig. 1).
Our three-dimensional ALMA data cubes allow us to further study the kinematics of the and H2O() emitting gas. Fig. 2 shows the moment maps of the CLEANed and H2O() data cubes. Both the moment maps of CO and H2O show very similar distributions in velocity and dispersion, although comparing the moments maps of H2O with the other lines is hindered by the lower S/N. The moment maps reveal noticeable velocity gradients in its major southern and northern components as shown in the 1st moment maps and are possibly arising from the same lensed structure from the source plane. The velocity dispersion distributions compared to the 1st moment maps show similar structure among the three image components (and only for two components in H2O() due to the low S/N in the central component), with the peaks in velocity dispersion being slightly spatially offset from the continuum flux peaks.
To better compare the dust continuum and the and H2O() line emission, in Fig 3 we show the ratio of the dust continuum to the 0th moment of , as well as the -to-H2O() ratio of the 0th and 1st moments. The map of shows clear evidence that the emission of is more extended than the dust continuum at rest-frame 419 m. And there is indeed an offset between the dust and CO/H2O emission peaks. The difference in sizes is consistent with several previous observations that the size of dust continuum is usually found smaller than the gas tracers such as the low- and mid- CO lines (e.g., Riechers et al. 2011b; Ivison et al. 2011; Spilker et al. 2015; Chen et al. 2017; Calistro Rivera et al. 2018; Hodge et al. 2018). This could be caused by a radial dust temperature gradient (see, e.g., Miettinen et al. 2017). The 0th moment ratio of to H2O() shows small variations, having flux ratios between and H2O() 1.7–2.8 with an average value of 2.4. The velocity structure of the two gas tracers are almost identical, with a ratio = .
3.2 Integrated Spectra
The continuum-subtracted spectrum integrated over the entire source is shown in Fig. 4. The upper panel shows the combined spectra of the 2 mm windows SPW-0 and SPW-1 of the H2O and H2O+ lines, while the lower shows the line covered by SPW-2. In addition to the strong and H2O emission lines, there is a series of H2O+ emission lines including the dominant H2O+ feature, i.e., H2O+() (5/2-5/2) and H2O+() (5/2-3/2) (based on the analysis of the expected relative strengths of the H2O+ submm lines in Arp 220 by González-Alfonso et al. 2013). We also detect an emission line at 745 GHz, which will be discussed at the end of this section.
After extracting the spectra integrated over the entire spatial region of the source, the emission lines were fitted with multiple Gaussian profiles using the Levenberg-Marquardt least-square minimization code MPFIT (Markwardt 2009). Initially, two Gaussian components were fitted. However, as indicated in Fig. 4, fitting the profile with two Gaussians results in significant residuals in the blue part of the line profiles. Therefore, we fitted the lines with three Gaussian components. The overall line profile of all the emission lines are well fitted by the three Gaussian components which we mark with “B”, “Rb”, and “Rr” in Fig. 4. Since the line profiles of the , H2O, and H2O+ lines agree very well with each other (Fig. 4), we fix the linewidths of the B, Rb, and Rr components to be that found for the components of the line and use these line widths when fitting the profiles of the H2O and H2O+ lines. The results obtained, i.e., the velocity integrated line fluxes, linewidths (FWHM) and line centroid positions are given in (Table 5). The total integrated line fluxes for and H2O() are comparable to those obtained with the IRAM 30-meter telescope and NOEMA (Yang et al. 2016, 2017a) indicating that there is no missing flux in the ALMA data of G09v1.97. This implies that there is no significant diffuse emission (compared with the synthesis beam size) from either the dust continuum or any of the lines studied here.
We note that the blue-shifted component (B) in the spectrum slightly alters the CO redshift from = 3.634, derived from the lower S/N IRAM 30m data (Yang et al. 2017a) where only the dominant red-shifted velocity component (consisting of the components Rb and Rr) was detected, to = 3.632. This new redshift is defined by the central line position as the center of the full width at zero intensity, representing the overall redshift of the entire system. We will consistently use = 3.632 as the redshift for G09v1.97 in this work.
The spectra of the , H2O(), and H2O+ lines have very similar profiles (Fig. 4), composed of three Gaussian components, “B”, “Rb”, and “Rr”. The observed velocity-integrated flux ratios between the three components are similar for the three lines within the uncertainties. The overall profiles display pronounced asymmetries with a strong red-shifted peak and a weak blue-shifted wing. The blue-shifted wing shows a single approaching gas component B centered at velocity of km s*-1*, with a FWHM of 300 km s*-1* and most of its fluxes resides at negative velocities. The strong (receding) red-shifted peak emission feature can be explained by the two Gaussian components Rb and Rr, dominating the fluxes in positive velocity channel bins. The linewidths for Rb and Rr are somewhat different (see Table 5), and both components are close in velocity, peaking at 100 and 237 km s*-1*, respectively. This suggests that Rb and Rr are likely closely related. The peak flux ratio of Rr to Rb is 1.3 for the lines. The possible origin of the asymmetrical line profile could be an intrinsic asymmetrical line profile or/and differential lensing. The peak of the B component is 4 times weaker compared to the overall receding gas (Rb+Rr), and the linewidth is 1.5 times narrower (Table 5). The fact that the velocity separation between the component B and the group Rb/Rr is much larger than the velocity separation between Rb and Rr is an indication that B is likely to be a distinct velocity component. We will further discuss the nature of these velocity components in the following sections using position-velocity (PV) diagrams in the source plane after correcting for the gravitational lensing.
The significant similarity among the gas tracers strongly suggests that the emitting regions overlap for the , H2O(), and H2O+ lines, which is also supported by their similar moment maps (Fig 2). All these similarities in the spatial and kinematical distributions for the lines indicate that these gas tracers and the dust continuum emission are closely related to the similar active star-forming regions (see Yang et al. 2016, 2017a, who analyzed the gas excitation reaching a similar conclusion). We will further discuss the possible scenarios of the asymmetrical line profiles and compare the spatial and kinematical structure of and H2O() in the source plane in Section 5.
We derive the apparent line luminosities, and , via (see Solomon et al. 1992)
[TABLE]
from the observed line flux densities. is the velocity integrated line flux, and are the rest-frame and observed frequencies, and is the luminosity distance. The apparent CO line luminosity is around (4–10) or (4–9) K km s*-1* pc2, which is about weaker than the apparent , while for the H2O line, the line luminosity is about 2–3 times lower than the CO line (for B, Rb, and Rr), i.e., about (2–4) or (1–3) K km s*-1* pc2. The H2O+ lines are 3–4 times weaker than the H2O() line (Table 5).
At a rest-frame frequency of 745 GHz, we observe a 5- emission line with an integrated flux of Jy km s*-1* and a linewidth of km s*-1*. A similar emission line has also been observed at 745.3 GHz in another H-ATLAS source, NCv1.143 (H-ATLAS J125632.7+233625), at a significance of 3- (Yang et al. 2016), and was tentatively identified as the HO() line. The detected 5- emission at 745 GHz corresponds to the position of the Rb+Rr component of the rest-frame 745.320 GHz HO() line. Therefore, the line is likely to be HO(). Strong absorption lines of HO which are excited by far-IR pumping have been observed in local luminous IR galaxies (ULIRGS, defined by 1012 ¡ ¡ 1013 ) with Herschel-PACS, indicate enhanced abundance ratios of HO/HO 70 (e.g., in Arp 220, González-Alfonso et al. 2012, and, with possibly higher ratios in Mrk 231, Fischer et al. 2010; González-Alfonso et al. 2014b; González-Alfonso et al. 2018) suggesting that this line might be ubiquitous in starburst galaxies, and could potentially help us constrain the abundance of HO at high redshift.
Another possible identification of this emission line is N2H+(8–7) at 745.210 GHz. However, we rule out this identification for the following reasons. N2H+ is known to be a tracer of the quiescent gas associated with dense, cold star-forming cores (e.g., Bachiller 1996; Caselli et al. 2002) and is therefore less likely to be detected in a intense starburst like G09v1.97. The first high-redshift detection of N2H+ was discussed in Wiklind & Combes (1996), but only absorption against the background radio source PKS 1830211. Recently, Feruglio et al. (2017) reported an emission line at 94.83 GHz in the quasar APM 08279+5255, which they tentatively identified as N2H+(5–4) without completely ruling out other possibilities, including the detection of a low- CO line from the foreground deflector. Aladro et al. (2015) derived a ratio of 2 between the ground transition lines of HCO+ and N2H+ in nearby active galaxies. If this value is also valid for higher energy levels, we would expect a similar ratio for HCO+(8–7)/N2H+(8–7). The observed integrated flux of HCO+(5–4) in G09v1.97 is about 0.5 Jy km s*-1* (Yang 2017b). Assuming that the flux ratio of HCO+(8–7) to HCO+(5–4) is 0.7 (Imanishi et al. 2017), the expected flux of N2H+(8–7) in G09v1.97 would be 0.2 Jy km s*-1*, which is less than half of the currently measured flux.
Based on the above arguments, we conclude that the emission feature detected at the rest-frame frequency of 745.32 GHz in G09v1.97 is most likely to be the HO() line. This line is only seen in the red-shifted velocity component (dominated by Rr) and not in the weaker B component, which we attribute to component B having lower S/N.
4 Lens Modeling
In order to derive the intrinsic properties of G09v1.97, a lens model needs to be built using both the high-resolution ALMA imaging data and the optical/near-IR images to constrain the gravitational potential of the deflectors. We stress that the main focus of this paper is to study the properties of the background lensed source, and the detailed structure of the deflecting mass distribution will be presented in a subsequent study.
Similar to the parametric lens model in Bussmann et al. (2013), the two foreground deflectors (G1 and G2, see Fig. 1) are assumed to be singular isothermal ellipsoid (SIE) mass distributions centered on the two foreground galaxies. The parameter encoding the strength of the deflector, namely the depth of the lensing potential, is represented by the velocity dispersion (note here is not the velocity dispersion of the ISM gas). The velocity dispersion of the lens model is related to the Einstein radius by , in which and are the distance between the observer and deflector, and the distance between the deflector and the lensed object, respectively. The minor-to-major axis ratio and orientation of the major axis in the plane of the sky (position angle, ) are left free and explored over the parameter space.
The lens model is based on the sl_fit lens inversion code, following the method described in Gavazzi et al. (2011). Here we adopted a Markov chain Monte Carlo (MCMC) method, implementing the standard Metropolis-Hastings algorithm. It explores the space of lens model parameters and builds samples of the posterior probability distribution function. The sl_fit code is mostly tailored to fit optical/near-IR data. Nevertheless, we are able to account for synthesized beam and noise correlation in the CLEANed images for our ALMA data using the methods described in Gavazzi et al. (2011). Although fitting visibilities in the uv-plane would overcome the caveats related to side-lobes and correlated noise of interferometric data (e.g., Bussmann et al. 2012, 2013; Hezaveh et al. 2013; Nightingale & Dye 2015; Spilker et al. 2016; Leung et al. 2017; Enia et al. 2018), this is not implemented yet in sl_fit. Dye et al. (2018) showed that image- and uv-plane model fitting can yield highly consistent results with ALMA data with sufficiently high uv-plane coverage and thus small dirty beam side-lobes. Since our ALMA data has such sufficiently high uv-plane coverage and S/N, we safely assume that any information loss in the source plane as a result of our image-plane analysis is negligible. We leave a thorough comparison of visibility versus image-space fitting for future studies using higher angular resolution ALMA images. However, even with higher resolution, we do not expect any significant changes.
4.1 Fitting the dust continuum emission and the mass model
Our lens model places the deflectors at their corresponding spectroscopic redshifts ( = 0.626 for G1 and = 1.002 for G2). Following the prescription of Gavazzi et al. (2008), we allow for the slight lensing of G2 by G1 via a flat prior on the position of G2 and we check that the image-plane location of its center after modeling coincides with that observed. For G1, we apply a Gaussian prior of width centered on its observed position to accommodate absolute astrometric uncertainties. We have also run models where both deflectors are placed at the same redshift of = 0.626, finding very similar results apart from the central image which becomes slightly more magnified.
Because the dust continuum images have the best S/N values, we used the 1.94 and 0.87 mm dust continuum images (Fig. 1) to constrain simultaneously the mass distribution (SIE model) of G1 and G2 and the dust emission from the background source. The resulting best-fit mass model is then used to reconstruct, in the source plane, the line emission in each velocity channel. This approach is found to capture most of the information content of the data. Deeper and higher resolution data would enable us to perform a joint fit to the continuum and line emission, and eventually, provide the greater flexibility of creating a “pixelated source”, as was the case for the high-resolution observations of SDP 81 (e.g., Dye et al. 2015).
As discussed in Bussmann et al. (2013), a single Sérsic component of index was found to provide a good fit to the lower-spatial-resolution SMA data. With the improved depth and spatial resolution of our ALMA data, we can perform modeling with a more complex intrinsic light distribution. Therefore, we assume that the dust emission consists of two exponential profiles with several free parameters, e.g., positions (, ), sizes (effective radius ), ellipticities (, which equals the minor-to-major axis ratio) and orientations (). Those parameters can differ between each source component, although, by construction, the geometry (size, orientation, position) remains the same at 1.94 and 0.87 mm. Only the flux can differ across the two bands. In other words, each of the two background components has a constant magnification across its entire far-IR spectral energy distribution (SED). Two such sources sharing the same center would mimic a unique source with an SED gradient, should the data demand it, but these model assumptions also allow us to model two spatially distinct internally homogeneous sources. The Bayesian approach used in sl_fit requires a clear definition of modeling priors. For the lensing potential, we assume flat priors for the position of G2 and a Normal prior for the width centered on the observed position of the G1 galaxy. This is to take into account the deflection of the more off-axis galaxy G2 by source G1 which lies closer to the main axis of the deflection. The orientation of the major axis has a uniform prior whereas both axis ratios have a Normal prior centered on 0.5 and of width 0.2 and set to zero outside the range . The prior on both Einstein radii is uniform in the range . For the exponential profiles used for the morphology of the source plane dust emission, we apply a uniform prior in the range on both coordinates of both sources666This relatively narrow window was guided by previous models exploring a wider space of priors. Restricting the range simply helps to speed up the convergence of the model.. Both axis ratios have a uniform prior distribution in the range and orientations are uniform on the circle. Intrinsic source plane fluxes in both frequency channels are uniformly bound between 0 and a conservative upper limit set at 1.5 times the total image plane flux in the corresponding velocity channel. Finally, we applied a Normal prior for the effective radius centered on and of width multiplied by a sharp uniform prior in the range .
The results of the lens model and the reconstructed image-plane images at 1.94 and 0.87 mm are shown in panel a and b of Fig. 5. The constraints (median and confidence level intervals on the marginal distributions) of the model parameters defining the mass model and the source-plane dust continuum emission are provided in Table 3. For a few relevant parameters, marginal posterior distributions and pair-wise scatter plots are shown in Fig. 13 in Appendix A to illustrate possible parameters degeneracies. Despite its apparent simplicity, the model is able to reproduce most of the light distribution, leaving almost all residuals close to the noise level (¡ 2.5 ). One can recognize a nearly fold-like configuration, with the faint parts of the source straddling the caustic. The critical lines resulting from the best fit mass distribution clearly reflect the bimodality of the foreground mass. The double nature of the deflecting system (G1 and G2) introduces a central de-magnified image that is observed and well reproduced by the model.
The two deflectors have relatively low masses with an Einstein radius of for G1 at = 0.626 and for the more distant G2 at = 1.002, corresponding to km s*-1* and km s*-1* respectively. The two foreground galaxies have different shapes, with the ellipticity of G2 appearing to be well aligned with that of the host galaxy, and an orientation that is consistent with the shear generated by G1.
The source-plane dust continuum images at 1.94 and 0.87 mm reconstructed by the lens model are displayed in Fig. 6. The model requires two nearly concentric dust components with a very small separation, . One component is compact with a half-light radius, = , has a prominent north-south elongation, and contains the peak of the surface brightness distribution (the “core”). There is an additional extended envelope which is more circular and substantially larger with = . At 0.87 mm, the compact source is times brighter than the extended component, whereas this ratio rises to at 1.94 mm, suggesting that either the dust temperature and/or the submm optical depths might be different in the core and envelope (see Table 3). The compact core and the envelope experience a similar overall magnification. The total magnification is of order = , somewhat higher than the value = derived by Bussmann et al. (2013).
One should note that, although our double-disk model captures most of the dust continuum flux and the overall structure of the source, the 02–03 resolution ALMA continuum images could potentially even capture the flux variations at smaller scales. The average scale magnification can be inferred with 3.2. With such a magnification, the 02–03 continuum image will be resolved into average scales of 0.4 kpc (006). This has been further tested with PyAutoLens777https://github.com/Jammy2211/PyAutoLens (Nightingale et al. 2018), which reconstructs the source-galaxy using an Adaptive Voronoi tesselation as opposed to analytic Sérsic light profiles. The analysis converges to the same lens model and reconstructs a source galaxy with the same global structure as the double-disk model, yet it reveals subtle variations on smaller scales comparable with the averaged magnified scale of angular resolution, or even slightly smaller at locations close to the caustic. Nevertheless, the discussion on such variation structures at scales 0.4 kpc are beyond the scope of this paper. This lens modeling therefore verifies our parametric lens model which we will use hereafter to determine the properties of G09v1.97.
4.2 Fitting the CO and H2O Line Emission
The SIE parameters of the best (lens) mass model derived from the two dust continuum images were used as input to model the data cubes of the and H2O() emission lines. Due to the limited S/N at the edges of the spectra, we only performed such line-emission reconstructions in the source plane using the channel bins located in the velocity ranges within 450 km s*-1*, which covers all the full widths at zero intensity. Performing the inversion channel per channel, we study the intrinsic source-plane line emission and, in particular, the spatial variations of the line of sight velocity distribution (LOSVD), similar to e.g., Riechers et al. 2008; Swinbank et al. 2011; Spilker et al. 2015; Leung et al. 2017. We focus on the integrated line emission map ( moment of the LOSVD) and velocity field ( moment of the LOSVD).
In order to perform the inversion, the data cube was binned into 10 velocity channel bins of 105 km s*-1* from 478 to 467 km s*-1* for the and H2O() line cubes. Given the relative simplicity of the continuum emission, and in order to obtain the simplest possible source model, we assume that, up to a normalizing flux constant, the emission is identical between the and H2O() lines, and each emission component is well represented by a single elliptical exponential profile whose parameters (center, ellipticity, orientation, effective radius, and fluxes) are estimated for each independent slice. This procedure is supported by the pronounced similarities in the spatial and the velocity structure of and H2O() (Fig. 3). We thus fit for the 107 parameters defining the source emission while using the foreground mass distribution derived from the dust continuum modeling (Section 4.1). As with the modeling of this latter component, we apply the same priors on all of the source parameters. Hence, we obtain a model-predicted data cube in both the image and source planes.
As shown in panels c and d of Fig. 5, it is clear that the lens model reproduces the overall fluxes of both the and H2O() line emission. Both the moment maps are well reproduced with our lens models and the residual shows no significant disagreement. As shown in Fig. 14, the model provides a good reconstruction of the line emission in each channel bin and therefore reproduces the entire velocity field. Furthermore, Fig. 7 shows that the model reproduces the observed integrated line profiles, together with the magnification factor at each channel for the lines and the two dust components.
We also explored the nature of the H2O+ emission, which has lower S/N values than either or H2O(). We performed a similar analysis for the H2O+ data cube by dividing the emission into two channels, and the results are shown in Fig. 7 and Fig. 14.
We conclude that for all the lines, the image plane reconstruction is in good agreement with the observed imaging data, suggesting that our simple modeling assumptions already capture most of the information content of the current data. Increasing the complexity of the gas distribution would require more flexible modeling techniques (and more free parameters) which are not required with these data. Based on the lens inversion results, we will describe the intrinsic physical properties of the source including its kinematics and morphology in the source plane in the following sections.
5 G09v1.97 in the source plane
5.1 Morphology of the dust continuum and line emission
As shown in Fig. 6, the molecular line maps of and H2O() have an overall distribution elongated along the north-south direction. The orientation of the line emission is similar to the dust continuum at rest-frame 188 and 419 m, albeit more complex with indications of a bimodal structure. The source-plane dust continuum image shows a predominately elongated disk-like smooth distribution along the north-south direction, and which peaks between the two gas components, albeit slightly towards the southern one.
To better demonstrate the spatial distribution of the gas emission and its velocity structure, Fig. 8 displays the gas emission per velocity channel bin as described in Section 4.2. As clearly seen in the figure, the two distinct components in Fig. 6 of the 0th moment map of the gas emission have significantly different velocities. The northern disk is dominated by the emission from the red-shifted gas components (corresponds to “R” in Fig. 6) while the southern component is dominated by blue-shifted gas (corresponds to “B” in Fig. 6). There is also a gas bridge peaking at 59 km s*-1*, which is located near the peak of the dust continuum components (dashed ellipse). The reader should note that the R component in the 0th moment map corresponds to the “Rb” and “Rr” parts of the line profile observed in the image plane, while the B component is associated with the “B” part of the image-plane line profile (Fig. 4). The gas components associated with red-shifted velocities are located within the caustic pattern and hence experience a stronger magnification ( 12) than the southern blue-shifted component ( 5). This differential magnification contributes to the asymmetry of the image-plane integrated line profile, but only partially, because the intrinsic line-profile is asymmetric (Fig. 11). Most of the flux from the gas emission originates in the two blobs, i.e., R and B, with only a minor contribution from gas between the two. For the southern B component, the centroids at different velocities bins (central velocity of each bin from 478 to 163 km s*-1*) are varying in a very small spatial range of 003, neglecting the most blue-shifted velocity bin of 478 km s*-1* which has very low flux and large uncertainties. On the other hand, the northern R component shows a clear gradual variation over 006 of the centroid positions from 47 to 362 km s*-1*(here we also neglect the 467 km s*-1*channel because of its low flux and high uncertainty). Such a difference suggests that R has a clear velocity shear, presumably rotation, while B is not kinematically resolved. We will discuss the kinematics in more detail in Section 5.2.
Fig. 8 also shows the half-light radius of the dust continuum and the line emission for each velocity channel bin, as indicated by the size of the ellipse. It shows that the overall size of gas is a bit more extended than the dust continuum emission (comparing half-light radii), with the extended part of the dust encompassing most of the line emission except for the most northern part of the R components. This is, to first order, consistent with the findings that the CO and H2O lines and submm dust continuum are presumably coming from similar active star-forming regions (Yang et al. 2016, 2017a). Yet, the detailed structure of the dust and gas have two different patterns, namely a smooth single disk-like structure for the dust continuum and a bimodal-disk distribution for gas.
The northern red-shifted gas R is somewhat more diffuse than the southern blue-shifted component B. Both gas components bracket the dust continuum emission. In order to better characterize the morphology of the molecular gas traced by (and H2O()), we performed a fit to the 0th moment map of in the source plane with a disk model using IMFIT (Erwin 2015). The central positions, position angles, ellipticities, Sérsic indexes, and half-light radii are used as parameters to describe the disks in the model. One should note that the 0th moment image is a result of the linear sum of the disk model fitted per velocity bin (Fig.8 as described in Section 4.2). The main purpose of fitting a disk model to the 0th moment map is to estimate the overall size, ellipticity, and the position of the components seen in the map. Therefore, we used three disk-components to capture the features of the R and B components, also taking into account the gas which lies between the two components. The main parameters of this fitting are the half-light radius (), central position, ellipticity (), and position angle (). The parameter Sérsic index used in the IMFIT is only for the propose of constraining the entire parameter set and it does not influence the final results in any significant way. We will also not discuss the gas between the two components because of its complex morphological structure and the fact that its parameters are less well constrained due to the relative low fluxes from this emission region. Using bootstrap resampling, the uncertainties from the fit are determined with uncertainties of 10%. The best fitting model determined by minimizing (best-fit = 0.1) provides a good agreement with the overall morphology of the 0th moment map, with insignificant residuals (maximum differences are less than 1% of the emission). The best fit half-light radius, for R and B are 010 (0.8 kpc) and 004 (0.3 kpc), respectively. The corresponding ellipticities are 0.59 and 0.34, while the position angles are 4∘ and 97∘, for R and B, respectively. The two disks, R and B with semi-major axis half-length, (define as ) of 1.2 kpc and 0.4 kpc, are separated by a projected distance of 018 (1.3 kpc). Therefore, the overall size of the gas emission traced by is 1.5 times larger than the dust emission size (not necessarily the size of the dust distribution), which is consistent with the estimates found in the image plane. Assuming that both R and B are thin disks, the inclination angle can be derived from the minor to major axis ratio, (define as ), as , in which the value of indicates the intrinsic thickness of the disk (Hubble 1926). Choosing a typical value of for disk galaxies (e.g., Holmberg 1946; Haynes & Giovanelli 1984), we infer inclinations for R and B of 82∘ and 66∘, respectively.
The projected separation between the northern and southern gas emission peaks is 1.3 kpc with a difference in velocity of order km s*-1*and there is a significant difference in the spatial structure between the dust continuum and the molecular gas emission (the former shows a one-fold disk-like structure while the latter shows two blobs on both sides of the dust peak). This can either be explained by two distinct galaxies separated by a projected distance of 1.3 kpc or two (very luminous) dusty star-forming clumps within a single rotating disk with a size of 0.4–1.2 kpc. Considering the first possible scenario, such a separation is consistent with the observations of local ULIRG mergers, which are in a close-to-coalesce phase or already coalescing (e.g., Rigopoulou et al. 1999; Scoville et al. 2000; Carpineti et al. 2015). Also the compact size of each merging galaxy is consistent with size estimates for other SMGs (e.g., Tacconi et al. 2008; Toft et al. 2014; Bussmann et al. 2015; Smolčić et al. 2015; Simpson et al. 2015a; Hodge et al. 2016; Spilker et al. 2016; Chen et al. 2017; Calistro Rivera et al. 2018). On the other hand, in the single-rotating-disk scenario, if the R and B components in G09v1.97 are within a single SMG, their relative large sizes compared to gas clumps ( 100–300 pc) derived from high-resolution observations in other SMGs (Swinbank et al. 2015), suggest that they are unlikely to be the resolved individual star-forming clumps, but rather two collections of clumps. Additionally, we tested this single-SMG scenario by fitting a tilted-ring model (e.g., Begeman 1987) to the source-plane data cube using 3DBarolo (a 3D-Based Analysis of Rotating Objects from Line Observations, Di Teodoro & Fraternali 2015). We find that the rotating-disk model cannot explain the reconstructed source-plane data cube. The best-fitting model has a significant under-prediction for the red-shifted part of the line emission. Together with the spatial mismatch between the dust emission and the molecular line emission in the source plane (Fig. 6), the poor fit likely rules out that the source is made of several clumps in a single rotating galaxy. Therefore, we conclude that the system is made of two compact merging galaxies with a small separation.
The ratios of 1.94 and 0.87 mm dust continuum flux densities are different for the compact and extended components (Table 3). At the shorter wavelength, rest-frame 188 m, the extended dust continuum component is brighter than the compact dust component, while at the longer wavelength, rest-frame 419 m, the compact dust component is more luminous. This suggests that the compact dust continuum region has an intrinsic lower dust temperature than the extended dust component, and/or different submm optical depths. Such a picture is consistent with the merger scenario (but hard to be explained by dusty clumps in a single disk): the compact dust continuum component is tracing the large amount of cold dust peaking in the interacting region between R and B. This is similar to the cold dust maps seen in local mergers such as the Antennae (NGC 4038/39) (e.g., Haas et al. 2000; Wilson et al. 2000) and VV 114 (Le Floc’h et al. 2002), where the cold dust emission at relatively long wavelengths is peaking in the interacting regions between two merging galaxies, suggesting a concentration of cold dust in a pre-coalescence phase of the system. While for the extended dust component, the contribution from the warm dust emission from the nucleus of R and B, elevates the overall dust temperature compared with the interacting region (i.e., the compact dust component). Therefore, the extended dust component has a warmer dust temperature compared with the compact dust component. The line emission of and H2O() is also predominantly coming from the warm dense regions (i.e., concentrated at R and B while remaining weak at the interacting region). However, the current spatial resolution limits our ability to resolve any further detailed variations in the properties of the dust emission. Higher spatial resolution and longer wavelength observations are needed to understand the distribution of the dust temperature and mass in R, B, and the interacting regions.
For the source-plane reconstruction of the H2O+ line emission, with only two velocity bins, it is difficult to infer the line’s detailed spatial structure accurately. Nevertheless, we find no evidence that the spatial distribution of the H2O+ line emission is different from those of the or H2O() lines. This is consistent with the fact that the formation of H2O+ lines is associated with the strong cosmic rays from intensely star-forming regions, which are also traced by the and H2O() lines (Yang et al. 2016). As in SMGs, which have very high-density star formation, we would expect to see the impact of cosmic rays on the ionization of dense molecular gas tracers as cosmic rays, rather uniquely, deposit their energy in deeply embedded dense gas (e.g., Papadopoulos 2010; Papadopoulos et al. 2011).
5.2 Kinematic structure
Fig. 9 presents the source-plane reconstructed 1st moment map of the line emission and the same map in the image plane. The lens-model-reconstructed source-plane moment map shows the detailed intrinsic kinematic structure of G09v1.97. One should note that, as mentioned in Section 4.2, because the final source-plane cubes are reconstructed by extracting the best fitted parametric lens models from the posteriors of the MCMC realizations per velocity channel, the noise of the observed images will not be transferred into the source-plane cubes. Thus, the uncertainties could be underestimated. For the dust continuum and line emission cubes, the noise in the ALMA images is generally low. Because of this, the uncertainties of the source-plane cubes are likely to be predominately due to the goodness of the lens model, namely the posterior distribution of the parameters, which reflects how well the model fits the data. This approach is a good approximation considering the limited spatial resolution yet high sensitivity levels of the dust continuum, and H2O() line images. We will omit a discussion of the image plane map of H2O() since the velocity structure is very similar to that of the and we used fixed parameters when performing the lens modeling (Section 4.2). With these caveats in mind, we find an overall velocity gradient of the gas along the north-south direction, with the northern gas component dominating the velocity channels reward of the systemic velocity, while the southern component dominates the blue velocity channels, This is in agreement with the R and B image-components discussed in Section 5.1.
Although the 1st moment map in the source plane has a rotation-like velocity shear, it remains incompatible with a single rotating-disk model (Section 5.1). This demonstrates the fact that a 2D velocity map with limited spatial resolution is generally insufficient to distinguish between a system that is a merger or a clumpy rotating disk.
To further investigate the velocity structure of G09v1.97, we extract PV plots sliced from two positions in the west and south of the image-plane map (Fig. 9). The PV maps sliced from the west has a velocity range from 50 to 350 km s*-1*, which is mostly traces the northern disk R (which corresponds to the Rb and Rr components in the observed spectrum). It shows a typical mirrored folded structure along the two sides of the critical line (similar to e.g., the Eyelash, Swinbank et al. 2011). The continuous velocity gradient along the positional axis of the PV diagram shows the typical kinematic signature of a rotating disk, suggesting that the northern galaxy is a kinematically resolved rotating disk. However, given the limited spatial resolution, we are unable to rule out the possibility that the R component can also be a small-scale merger (see the model of e.g., Narayanan et al. 2015). We nevertheless assume R is a rotating disk in this work. The other PV plot sliced from the southern component of the image shows the full velocity range from 400 to 350 km s*-1*, and which consists of three major components. The R part from 0 km s*-1* to 350 km s*-1* is tracing the same rotating disk structure as in the first PV plot (western slice), but is less magnified and therefore shows only a marginally resolved kinematic structure. The B part in the PV plot from 400 to 150 km s*-1*, which is associated with the southern galaxy, is coming from the B component in the 0th moment map of the line emission. It is clear that the R and B components in the PV plot show spatially overlapping regions along the line of sight, suggesting that system cannot be a stable rotating disk. This again rules out the clumpy rotating disk interpretation. In the overlap region, there is another weak gas component from 150 to 0 km s*-1*, probably tracing the bridging gas in between the two merging galaxies.
To test the velocity structure of these three components found in the southern PV plot, and to check the consistency between the source- and image-plane results, we have divided both the datacube in the source and image plane into three parts: R 400 to 150 km s*-1*, G 150 to 0 km s*-1*, and B 0 to 350 km s*-1*. Fig. 9 shows the 1st moment maps for R, G, and B in the image and source plane. The component R shows a prominent velocity gradient consistent with a rotating disk, while G and B have no clear velocity structure. The moment maps from the image and source plane match very well, suggesting that our lens model is robust. The velocity structure further suggests that the system consists of two merging galaxies – a northern rotating disk with marginally resolved kinematics and a southern compact galaxy without any clear velocity structure – during their pre-coalescence phase. These two galaxies are connected by a bridge of gas with very weak emission and dominated by cold dust emission (see a sketch in Fig. 11).
5.3 The intrinsic properties of G09v1.97: ISM and star formation in the source plane
We extract the spatially integrated spectrum of the and H2O() line from the reconstructed source-plane cubes, and further decompose the spectra into 3 Gaussian profiles (Fig. 11). In the fitting process, we set all the parameters free, except for the linewidth of the G component of the H2O() line (by using the value from the CO line) to achieve robust constraints on the parameters (Table 8). Both the and H2O() line profiles are well-described by 3 Gaussians: a blue-shifted Gaussian profile located mainly between 400 and 150 km s*-1* (in terms of FWHM), which is associated with the southern blue compact galaxy B; a red-shifted Gaussian component from 0 to 350 km s*-1*, originating in the northern rotating disk; and a weak Gaussian component from 150 to 0 km s*-1* dominated by the gas bridge connecting the two merging galaxies. It is noticeable that due to the differential lensing, the spectrum in the source plane shows a somewhat different line profile. The R component is heavily magnified by a factor of 15–20, and has been decomposed into two Gaussian components, Rb and Rr, which are the blue-shifted side and red-shifted side of the northern rotating disk. For the G component, due to its weak flux and lower magnification (10), it is difficult to disentangle it from components Rb and B seen in the image-plane spectrum.
Comparing the linewidths of the red-shifted and blue-shifted Gaussian components of the line and the H2O() line, we find that the blue-shifted B has similar linewidth as the red-shifted R, despite the fact that the latter is resolved into a rotating disk while the former shows no clear velocity structure. This indicates B has a larger intrinsic velocity dispersion than R. The integrated flux ratio of R and B for the two lines are similar, 1.5–2.1, with a peak flux ratio of about 1.6 for both. The bridging gas component contributes 20% to the total flux for both the and H2O() lines. The flux ratios of /H2O() for R and B are within the typical flux ratios of /H2O() found in H-ATLAS SMGs (Yang et al. 2016, 2017a), and is slightly higher than the value found in Arp 220 (Rangwala et al. 2011). However, this flux ratio of /H2O() is a slightly lower than the value of found in the similar IR-luminous = 5.2 SMG HLSJ0918 (Rawle et al. 2014) and in the = 5.7 SMG ADFS-27 (Riechers et al. 2017). Since the excitation of the H2O() line is dominated by far-IR pumping, it is tracing the warm dust emission (with temperatures around 45 K, see e.g., González-Alfonso et al. 2014a), while the line is tracing the warm dense gas mass. The line ratio of CO to H2O may therefore offer an estimate of the gas-to-dust mass ratio in the warm dense star-forming molecular gas. If the flux ratio of /H2O() is indeed correlated with the gas-to-dust mass ratio, a similar ratio of /H2O() in R and B could indicate that the dust-to-gas mass ratios of the two merging galaxies are likely to be similar. While higher flux ratios of /H2O() in the 5 sources, such as the previously discussed HLSJ0918 and ADFS-27, suggests higher gas-to-dust mass ratios compared with the = 2–4 H-ATLAS SMGs and local ULIRGs. Although crude, this result is consistent with the fact that the higher redshift sources tend to be gas-rich and less enriched in metals and dust (e.g., Genzel et al. 2015). More work with a larger sample is needed to test the reliability of such an assumption.
The limited spatial resolution means that we are unable to resolve the detailed structure of the dust emission and disentangle the two galaxies and their interacting regions. Nevertheless, to first order, we can assume that the total infrared luminosity is proportional to the luminosity based on the tight correlation found in infrared-bright galaxies (e.g., Greve et al. 2014; Liu et al. 2015; Lu et al. 2017). Also, notice that the bridge has a lower dust temperature as indicated by its low ratio, / = 5.4 compared to R and B (for which we assume a similar ratio, / = 26). The fluxes of the two dust components at 0.87 and 1.94 mm, and their ratios are well constrained by our model, showing no sign of strong degeneracies between the parameters (Fig. 13). We can decompose the total into three parts using a modified black-body model ( = 2), for B, G, and R (Fig. 10). We acknowledge that there could be large uncertainties because there is no spatially resolved photometry for B, G, and R. Therefore, we introduced additional uncertainties of 50% to the resulting best-fit parameters.
The two merging galaxies are infrared luminous, with L_{\mathrm{IR}}$${}_{\mathrm{,\,B}} = (4.02.0)1012 and L_{\mathrm{IR}}$${}_{\mathrm{,\,R}} = (6.33.1)1012 , and can thus be considered as ULIRGs. The dust emission between the two galaxies has a = (4.02.0)1011 . The merging system has a total exceeding 1013 and therefore belongs to the class of hyper-luminous infrared galaxies (HyLIRGs). The intrinsic dust temperature for the two galaxies is about 33–61 K (composite of two temperature components of 33 and 61 K), which is typical for high-redshift SMGs (e.g., Chapman et al. 2005; Magnelli et al. 2012; Shu et al. 2016). The region between the two ULIRGs has a much lower dust temperature of 17 K. This temperature is consistent with values found for the coldest dust component in a sample of high-redshift SMGs (Magnelli et al. 2012). The corresponding star formation rates for B and R are = (63)102 yr*-1* and = (94)102 yr*-1*. Taking the intrinsic half-light radii of 0.4 kpc and 1.2 kpc for the two galaxies, we derive the surface star formation intensities, = (5.52.8)102 yr*-1* kpc*-2* and = (1.20.6)102 kpc*-2* for the B and R galaxies, respectively. Comparing these surface intensities with theoretical limits derived for an optically thick disk, where the radiation pressure on dust grains provides the pressure to support a disk against its own self-gravity (Thompson et al. 2005), the values of the star formation intensities are 2–7 times smaller and thus well below this “Eddington limit”. However, the two components of G09v1.97 are still among the strongest starbursts found in H-ATLAS sample of lensed SMGs in terms of their (Bussmann et al. 2013) and also comparable with SPT-selected sources (Spilker et al. 2016). Note that the will be further reduced by a factor of up to 5–7, if we allow for a top-heavy IMF (Zhang et al. 2018b).
Assuming similar gas excitation conditions, i.e., taking the same to ratio for R and B as in Yang et al. (2017a), we can derive the total molecular gas mass (acknowledging the large uncertainties) for R and B of about 51010 and 41010 , respectively, suggesting the two galaxies are gas-rich. The implied gas depletion time then is 60 and 63 Myr for R and B, respectively, which are typical values found for high-redshift dusty starbursts (e.g., Aravena et al. 2016a). When comparing the luminosity ratio of and infrared, we find values of / = (1.00.5)10*-5* for the southern galaxy B and (2.11.1)10*-5* for the northern galaxy R, which are well within the range found by statistically studying other high-redshift SMGs (Yang et al. 2017a), and very close to the ratios of the local ULIRGs whose emission is dominated by star formation, not AGN (Liu et al. 2015). For the H2O() line, we derive a ratio / of (0.50.3)10*-5* and (0.60.3)10*-5* for B and R, respectively. These values are also in agreement with that of other SMGs and local star-forming dominated ULIRGs (Yang et al. 2016; Liu et al. 2017), showing that the tight correlation still holds down to sub-kpc scales in such starbursts (Fig.12), further suggests that the submm H2O lines are robust indicators of star formation rates in these galaxies. In Fig.12, the G component has a small positional offset, showing an excess of H2O line emission. Nevertheless, given the fact that the estimate of the SFR is very uncertain in the interaction region, it is difficult to conclude that such a deviation is significant. However, shocks over the interaction region between two merging galaxies could also enhance low- H2O lines which may explain an excess of H2O luminosity (Flower & Pineau Des Forêts 2010; Appleton et al. 2013). Higher resolution observations are needed to further investigate such a hypothesis.
Our new ALMA data indicate that the ratio of the observed to (the 742.1 GHz line) is about 3 for the merging galaxies (using a total averaged magnification for H2O+), which agrees with the / ratios reported in Yang et al. (2016) for NCv1.143, G09v1.97, and G15v2.779 based on NOEMA compact array observations. With this ratio, the model discussed in Meijerink et al. (2011), suggests a high cosmic-ray ionization rate of 10*-14*–10*-13* s*-1*, with the upper limit being similar to the values derived in Arp 220 and NGC 4418 (González-Alfonso et al. 2013). Such high cosmic-ray ionization rates drive the level of the ambient ionization of the high column density clouds to 10*-3*, rather than the canonical 10*-4*. These cosmic rays, which are likely generated in the most intense star-forming regions, dominate the gas phase ionization and oxygen ion-neutral route of the oxygen chemistry (e.g., Meijerink et al. 2011; van der Tak et al. 2016).
In addition to the H2O+ lines, we also detected an emission line around 745.3 GHz, which we attribute to the HO() line emission ( 200 K). The oxygen isotope, 18O, is predominantly made in the early stages of helium burning in massive stars (e.g., Maeder 1983). HO has also been detected in emission in local ULIRGs both in a local Herschel archive survey (Yang et al. 2013) and in the compact obscured nucleus of Zw 049.057 (Falstad et al. 2015). Several absorption lines of this molecule at shorter wavelengths have also been detected by Herschel/PACS in local ULIRGs (González-Alfonso et al. 2012, 2018), indicating that the excitation of HO is similar to that of H2O. The integrated flux ratio of H2O() to HO() is 15, while the peak flux ratio is about 8. However, with only one transition line of HO detected, it is very difficult to derive the abundance ratio of 18O/16O because of the very large optical depth of the H2O line. With better constraints on the HO abundance (and careful astrochemical modeling), we can use this ratio to gain further insight into the IMF in high-redshift SMGs because 18O is a secondary nuclide that relies on the prior existence of the primary elements such as 12C and 16O (e.g., Clayton 1968; Danielson et al. 2013; Romano et al. 2017; Zhang et al. 2018b).
6 Summary
In this paper, we have presented high (02–04) angular resolution ALMA observations of the lensed redshift = 3.632 SMG, G09v1.97, in the dust continuum at the rest-frame wavelengths of 188 and 419 m and in the molecular line emission of , H2O(), and = 2 H2O+. The 2 mm spectra provide accurate values for the apparent luminosity of the lines and detailed line profiles, as well as the first detection of a line of at high redshift. The images of the dust continuum and line emission show a nearly complete 15 diameter Einstein ring with substructures and a weaker emission peak at the center. The central image is the result of the rare lens configuration of two compound foreground deflectors. With a magnification of 5–22 for the line across different velocity channels, and 10–11 for the continuum, the average boosted angular resolutions can reach down to scales of 0.4–1.3 kpc, resulting in one of the highest angular resolution images of water line emission in an extra-galactic source to date.
With careful lens modeling, we have reconstructed the source-plane images of G09v1.97 in the dust continuum and in the molecular emission lines of , H2O(), and H2O+. The model reproduces, in the image plane, most of the details of the observed images of the dust continuum and the three-dimensional line emission data cubes. The dust emission appears as a compact disk surrounded by an extended overlapping disk structure. The two dust components have slightly different dust temperatures and/or submm optical depths, suggesting the dust properties in its peak region and the extended regions are different. For the molecular line emission, we find very similar kinematic structure and spatial distribution between the and H2O() lines. The line emission shows a bimodal structure, with a northern disk-like gas component associated with red-shifted gas emission while the southern compact component is dominated by the blue-shifted gas. The cold dust emission peaks in between the two gas components. We argue that the two gas components in the south and north are two gas-rich galaxies, each having a total molecular gas exceeding 1010 . They are in the pre-coalescence phase, with a large amount of cold dust presented in their interacting region, and also weak bridging gas emission. The northern galaxy is kinematically resolved as a rotating disk with a semi-major half-light radius of 1.2 kpc, while the southern galaxy, kinematically unresolved by being more turbulent, is compact with = 0.4 kpc traced by the line. The ratios of the total IR luminosities to the and H2O() line luminosities in the two merging galaxies are similar and consistent with the values found in other high-redshift SMGs, supporting our contention that there is a tight correlation between star formation and the H2O line luminosity. The /H2O() flux ratios are found to be 2 (with 20% uncertainties), which is consistent with the = 2–4 SMGs, while this flux ratio is found to be higher in 5 SMGs. The detection of strong H2O+ emission and its relative strength to the H2O line suggests that the cosmic ray plays an important role in the regulation of the physical and chemical processes in the ISM of high-redshift SMGs. The star formation rate surface densities of the two components are in the range of 120–550 yr*-1* kpc*-2*, being 2–7 times below the value set by the Eddington limit, yet they are among the strongest starbursts at high redshift.
In addition to the and H2O() line, we also present the first 5- detection of HO(), which is about 8 times weaker than the H2O() line. This molecule may offer important information on the chemical processes of the ISM and the initial mass function in high-redshift galaxies.
Future higher angular resolution observations will be needed to explore and trace in greater detail the distribution and kinematics of the gas content in G09v1.97. With its very high luminosity, the gas-rich merger, G09v1.97, remains an exceptional target for further studies at high spatial resolution. For instance, with ALMA, a resolution of 005 would help to further resolve the source at scales below 100 pc for G09v1.97, which is about the characteristic sizes of associations of molecular clouds. Such high spatial resolution observations will allow us to probe the properties of distinct molecular clumps in this star-bursting galaxy in the early universe.
Acknowledgements.
We thank the anonymous referee for very helpful comments and suggestions. C.Y. was supported by an ESO Fellowship. C.Y. thanks Johan Richard and Martin Bureau for insightful discussions, and also thanks John Carpenter and Edward Fomalont for discussion on ALMA data reduction. This paper makes use of the following ALMA data: ADS/JAO.ALMA#2015.1.01320.S and #2013.1.00358.S. ALMA is a partnership of ESO (representing its member states), NSF (USA) and NINS (Japan), together with NRC (Canada), MOST and ASIAA (Taiwan), and KASI (Republic of Korea), in cooperation with the Republic of Chile. The Joint ALMA Observatory is operated by ESO, AUI/NRAO, and NAOJ. C.Y. and Y.G. acknowledge support by National Key R&D Program of China (2017YFA0402700) and the CAS Key Research Program of Frontier Sciences. R.G., C.Y., and A.O. acknowledge the Programme National Cosmology and Galaxies for financial support in the early stages of this project. C.Y., A.O., and Y.G. acknowledge support from the NSFC grants 11311130491 and 11420101002. C.Y., A.O., A.B., and Y.G. acknowledge support from the Sino-French LIA-Origins joint exchange program. I.R.S. and A.M.S. acknowledge support from STFC (ST/P000541/1). S.D. is supported by the UK STFC Rutherford Fellowship scheme. E.I. acknowledges partial support from FONDECYT through grant N∘ 1171710. E.G.-A. is a Research Associate at the Harvard-Smithsonian Center for Astrophysics, and thanks the Spanish Ministerio de Economía y Competitividad for support under projects FIS2012-39162-C06-01 and ESP2015-65597-C4-1-R, and NASA grant ADAP NNX15AE56G. RJI acknowledges support from ERC in the form of the Advanced Investigator Programme, 321302, COSMICISM. H.F. acknowledges support from NSF grant AST-1614326. D.R. acknowledges support from the National Science Foundation under grant number AST-1614213. M.N. acknowledges financial support from the European Union’s Horizon 2020 research and innovation programme under the Marie Skłodowska-Curie grant agreement No 707601. M.J.M. acknowledges the support of the National Science Centre, Poland, through the POLONEZ grant 2015/19/P/ST9/04010; this project has received funding from the European Union’s Horizon 2020 research and innovation programme under the Marie Skłodowska-Curie grant agreement No. 665778. I.P.-F. acknowledges support from the Spanish grants ESP2015-65597-C4-4-R and ESP2017-86852-C4-2-R. US participants in H-ATLAS acknowledge support from NASA through a contract from JPL. Italian participants in H-ATLAS acknowledge a financial contribution from the agreement ASI-INAF I/009/10/0. SPIRE has been developed by a consortium of institutes led by Cardiff Univ. (UK) and including: Univ. Lethbridge (Canada); NAOC (China); CEA, LAM (France); IFSI, Univ. Padua (Italy); IAC (Spain); Stockholm Observatory (Sweden); Imperial College London, RAL, UCL-MSSL, UKATC, Univ. Sussex (UK); and Caltech, JPL, NHSC, Univ. Colorado (USA). This development has been supported by national funding agencies: CSA (Canada); NAOC (China); CEA, CNES, CNRS (France); ASI (Italy); MCINN (Spain); SNSB (Sweden); STFC, UKSA (UK); and NASA (USA).
Appendix A Details on the lens model
In addition to the model parameters listed in Table 3, we show in Fig. 13, the constraints (pair-wise covariance and marginal probability density functions, i.e., PDFs) we derived for some relevant parameters defining the continuum flux, size, and magnification of the two exponential profiles.
Note that the uncertainties of (and on the intrinsic source flux and size) do not account for the effect of mass-sheet degeneracy and do not fully explore the degeneracy of these inferred parameters with the density profile slope of the mass distribution. This fundamental limitation of lens modeling at recovering intrinsic source-plane quantities are generally overlooked. However, the assumption of isothermal mass distribution, which is able to break somewhat the degeneracy, is largely confirmed by observations (Koopmans et al. 2009; Sonnenfeld et al. 2013) and cosmological simulations (Dubois et al. 2013; Peirani et al. 2017; Xu et al. 2017; Remus et al. 2017).
The reference list from the paper itself. Each links out to its DOI / PubMed record.
- 1Aladro et al. (2015) Aladro, R., Martín, S., Riquelme, D., et al. 2015, A&A , 579, A 101 · doi ↗
- 2Amvrosiadis et al. (2018) Amvrosiadis, A., Eales, S. A., Negrello, M., et al. 2018, MNRAS , 475, 4939 · doi ↗
- 3Andreani et al. (2018) Andreani, P., Retana-Montenegro, E., Zhang, Z.-Y., et al. 2018, A&A , 615, A 142 · doi ↗
- 4Appleton et al. (2013) Appleton, P. N., Guillard, P., Boulanger, F., et al. 2013, Ap J , 777, 66 · doi ↗
- 5Aravena et al. (2016 a) Aravena, M., Decarli, R., Walter, F., et al. 2016 a, Ap J , 833, 68 · doi ↗
- 6Aravena et al. (2016 b) Aravena, M., Spilker, J. S., Bethermin, M., et al. 2016 b, MNRAS , 457, 4406 · doi ↗
- 7Bachiller (1996) Bachiller, R. 1996, ARA&A , 34, 111 · doi ↗
- 8Barger et al. (2014) Barger, A. J., Cowie, L. L., Chen, C.-C., et al. 2014, Ap J , 784, 9 · doi ↗