SDSS-IV eBOSS Spectroscopy of X-ray and WISE AGN in Stripe 82X: Overview of the Demographics of X-ray and Mid-Infrared Selected Active Galactic Nuclei
Stephanie M. LaMassa, Antonis Georgakakis, M. Vivek, Mara Salvato,, Tonima Tasnim Ananna, C. Meg Urry, Chelsea MacLeod, Nicholas Ross

TL;DR
This study presents the largest spectroscopic survey of AGN selected solely by WISE colors, combining X-ray and mid-infrared data to analyze the demographics and obscuration properties of active galactic nuclei in Stripe 82.
Contribution
It provides a comprehensive catalog of nearly 5,000 AGN with combined X-ray and WISE data, revealing selection biases and the fraction of obscured and high-luminosity AGN.
Findings
61% of X-ray AGN are not MIR-selected.
Approximately 30% of AGN are optically obscured.
High-luminosity X-ray AGN are often missed by MIR selection.
Abstract
We report the results of a Sloan Digital Sky Survey-IV eBOSS program to target X-ray sources and mid-infrared-selected WISE AGN candidates in a 36.8 deg region of Stripe 82. About half this survey (15.6 deg) covers the largest contiguous portion of the Stripe 82 X-ray survey. This program represents the largest spectroscopic survey of AGN candidates selected solely by their WISE colors. We combine this sample with X-ray and WISE AGN in the field identified via other sources of spectroscopy, producing a catalog of 4847 sources that is 82% complete to . Based on X-ray luminosities or WISE colors, 4730 of these sources are AGN, with a median sample redshift of . About 30% of the AGN are optically obscured (i.e., lack broad lines in their optical spectra). BPT analysis, however, indicates that 50% of the WISE AGN at have emission line ratios consistent with…
Click any figure to enlarge with its caption.
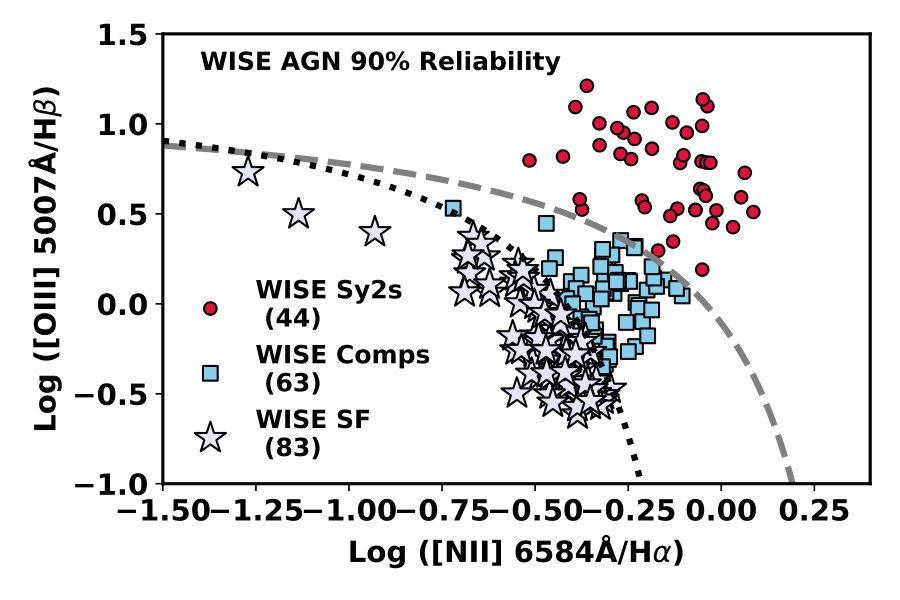 Figure 1
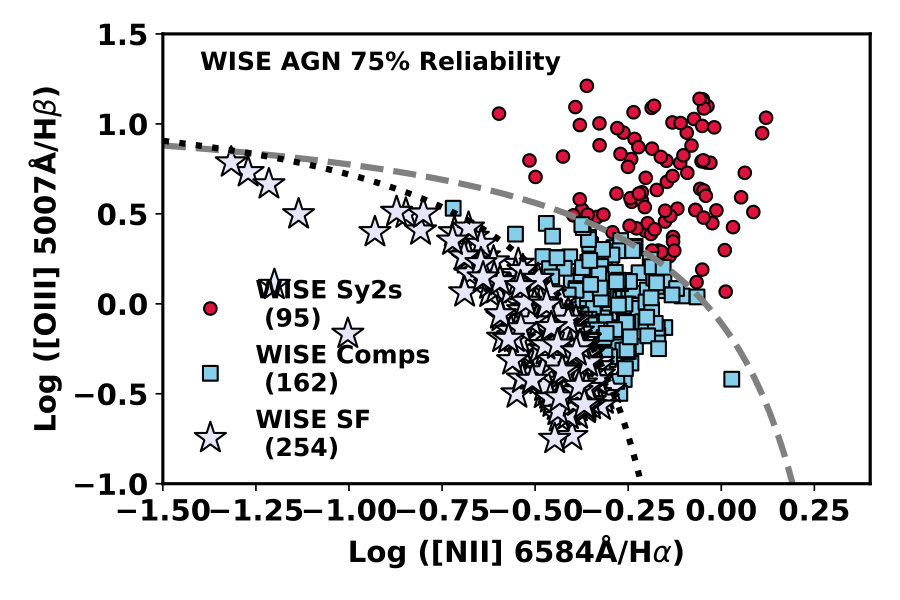 Figure 2
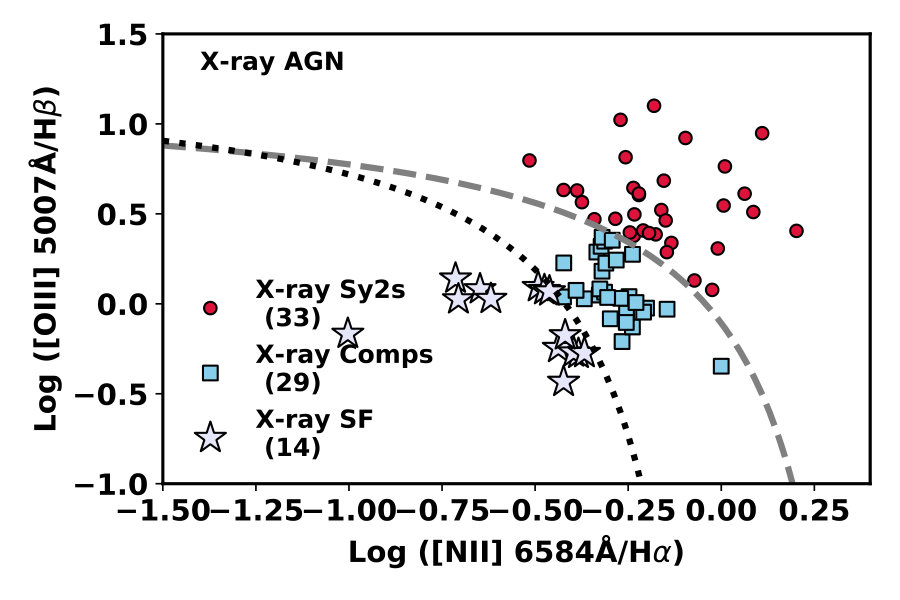 Figure 3
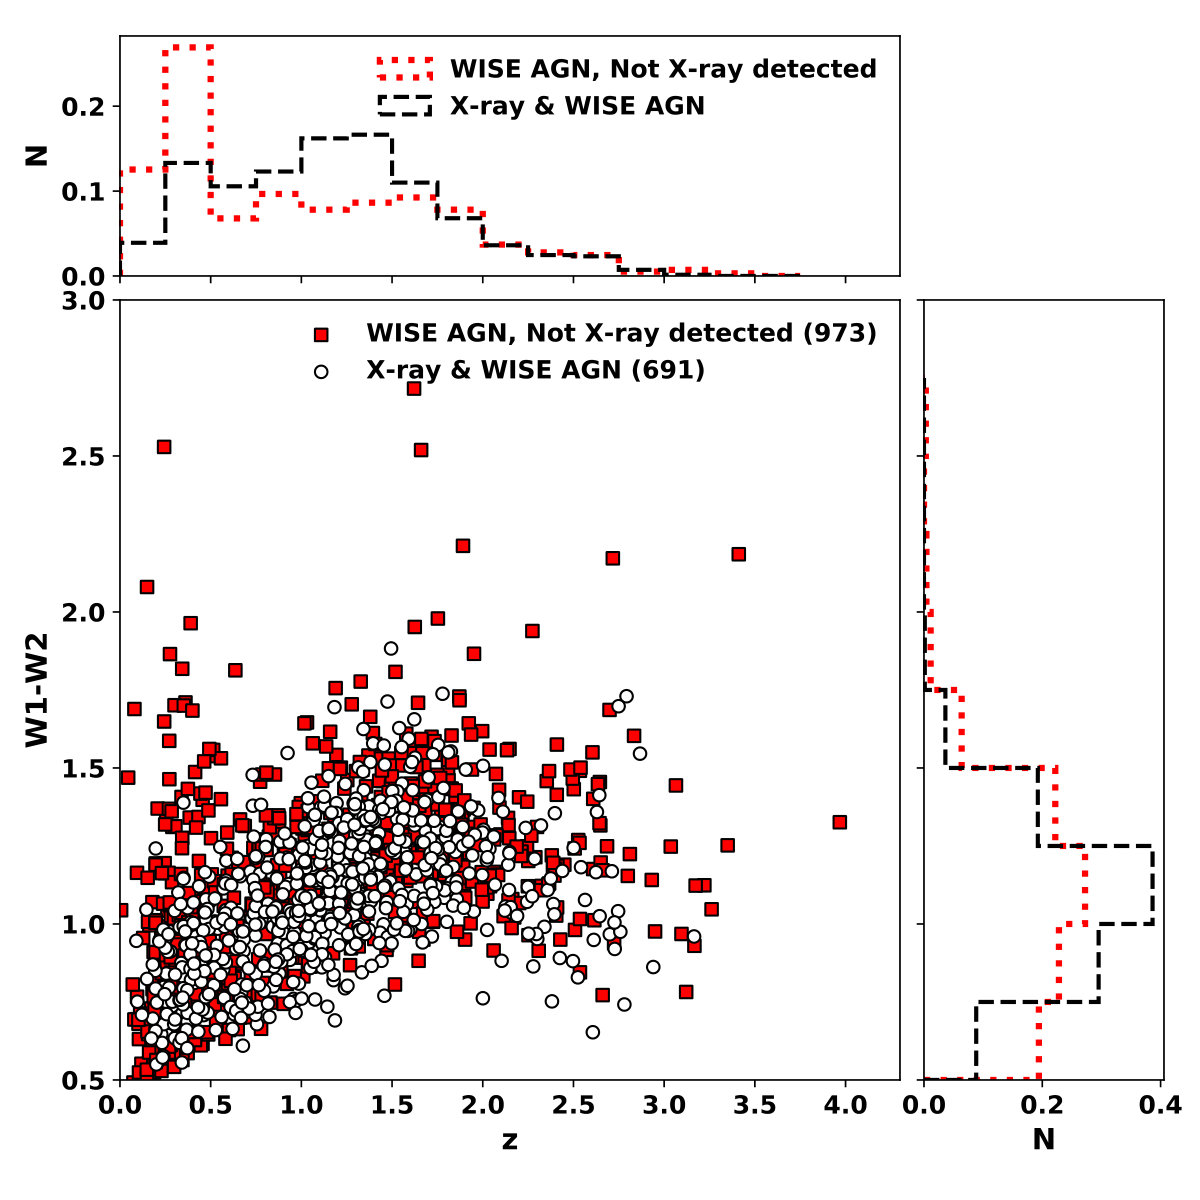 Figure 4
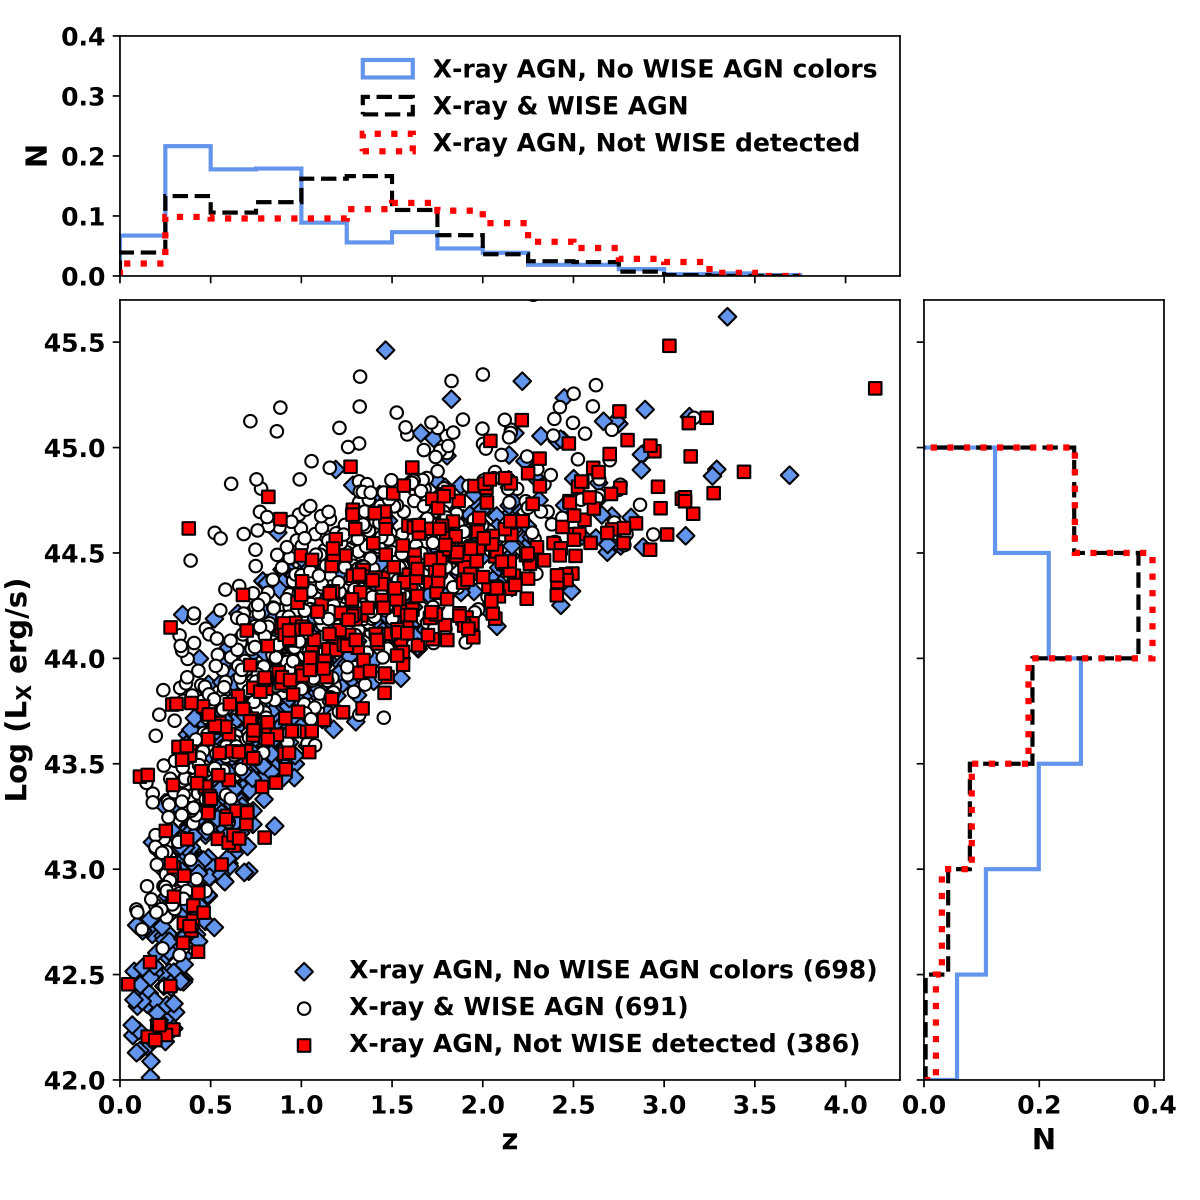 Figure 5
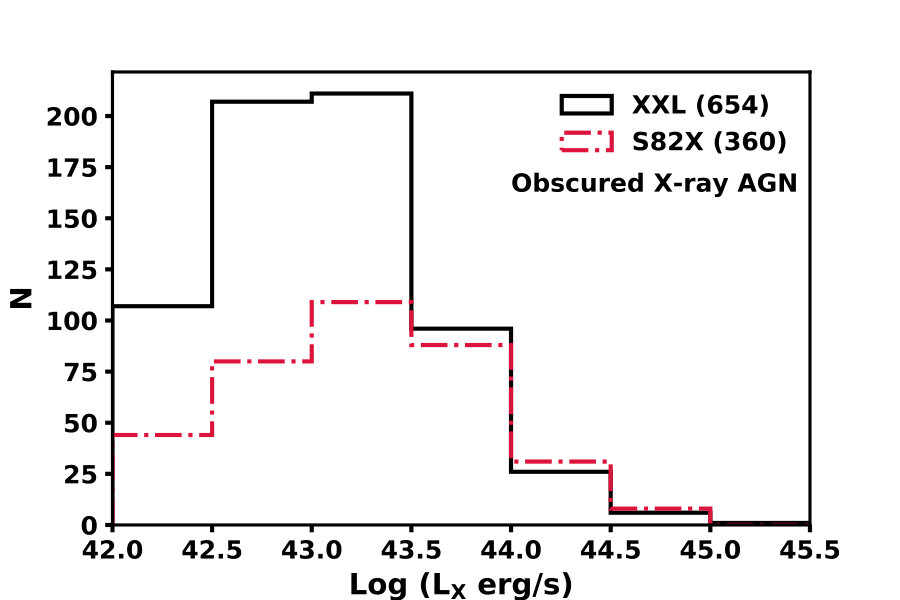 Figure 6
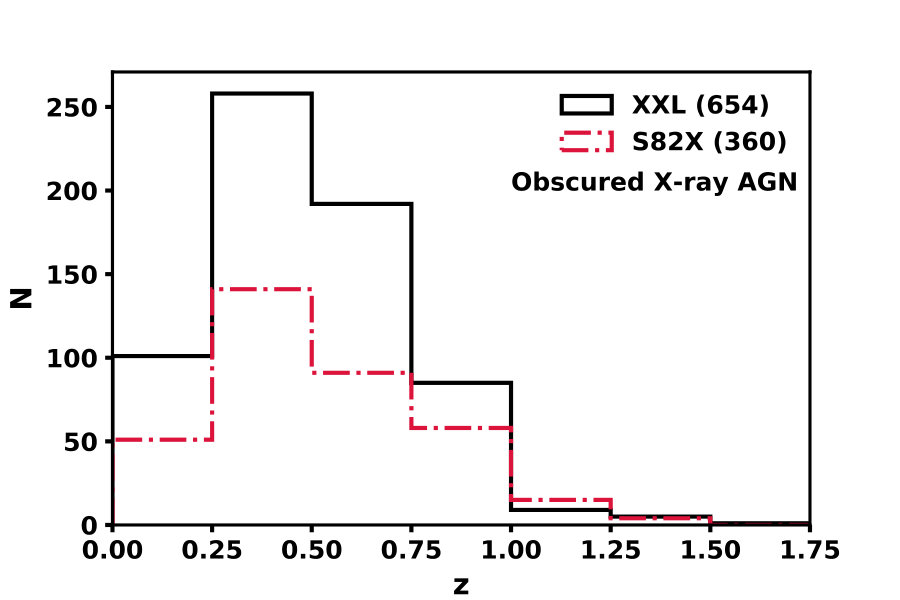 Figure 7
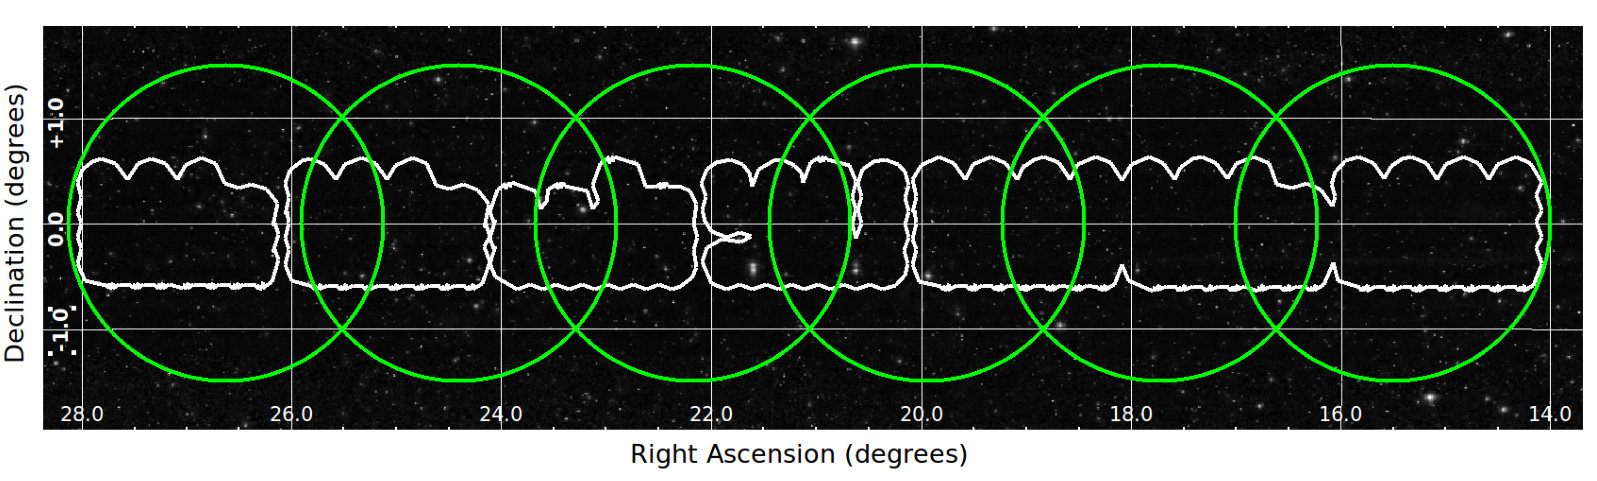 Figure 8
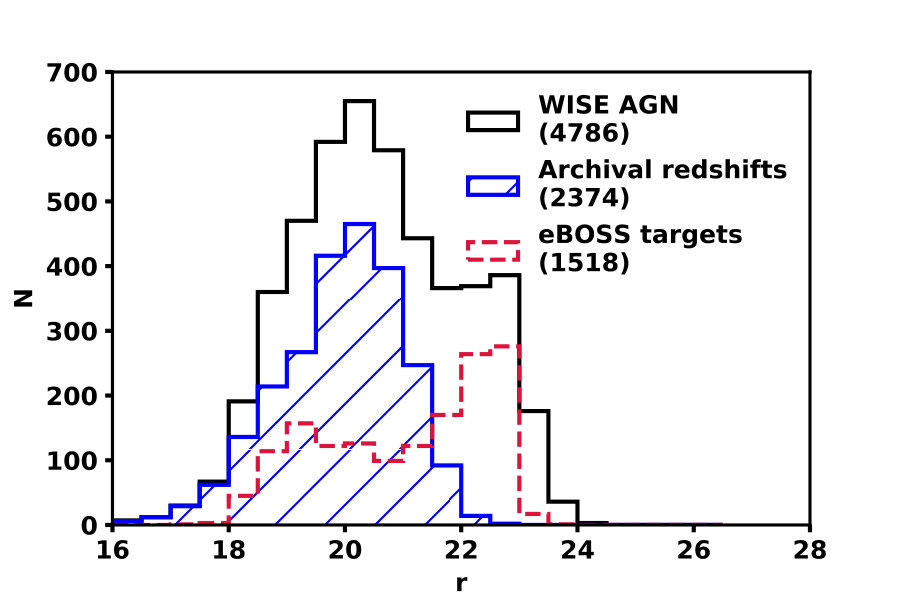 Figure 9
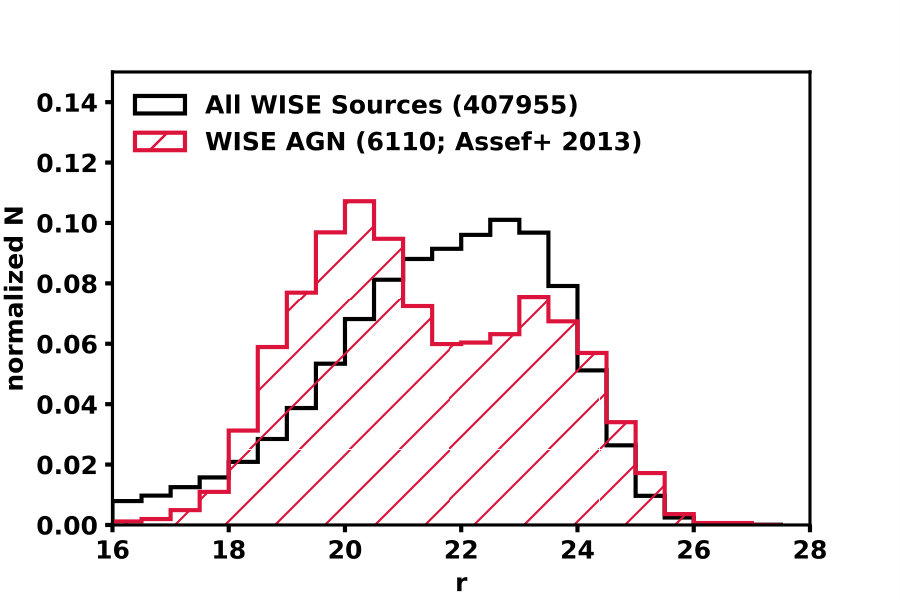 Figure 10
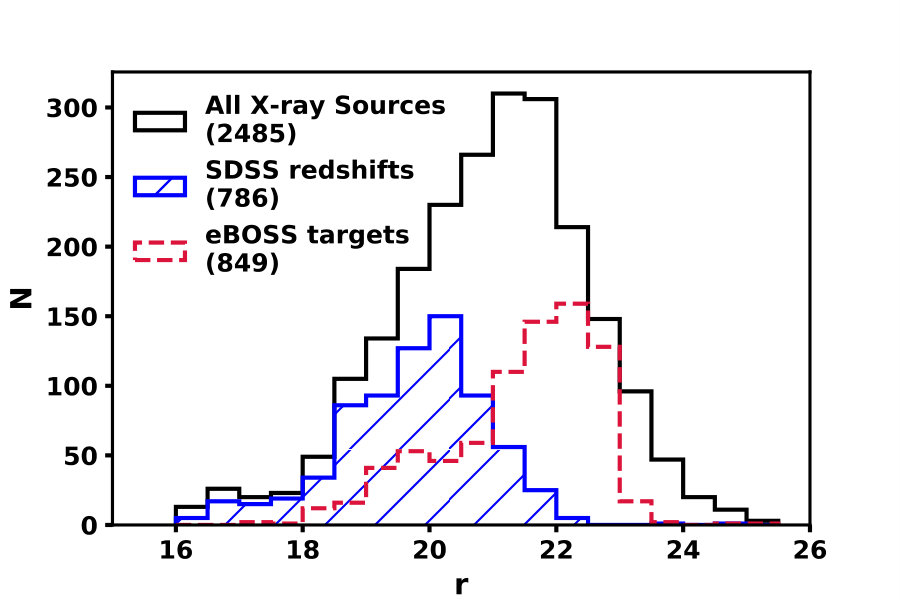 Figure 11
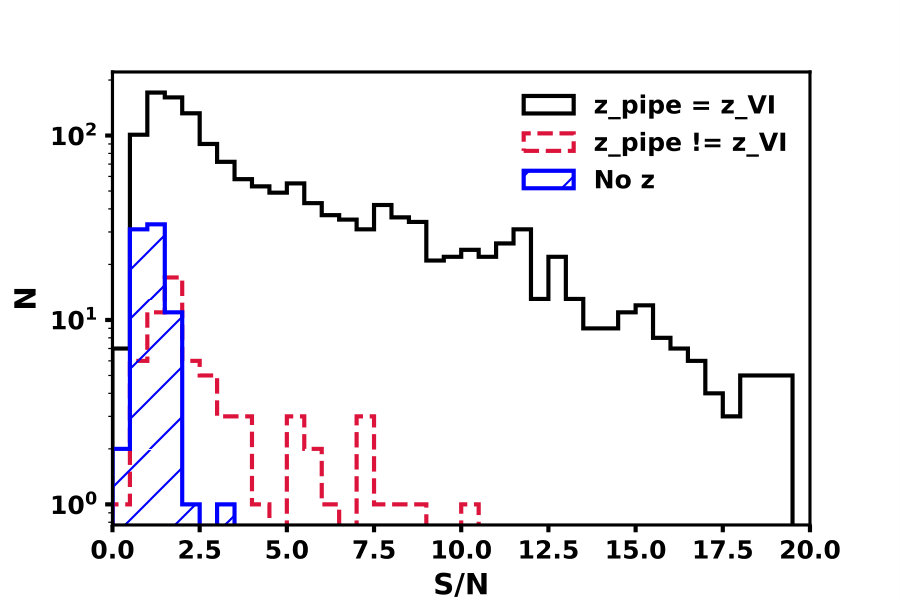 Figure 12
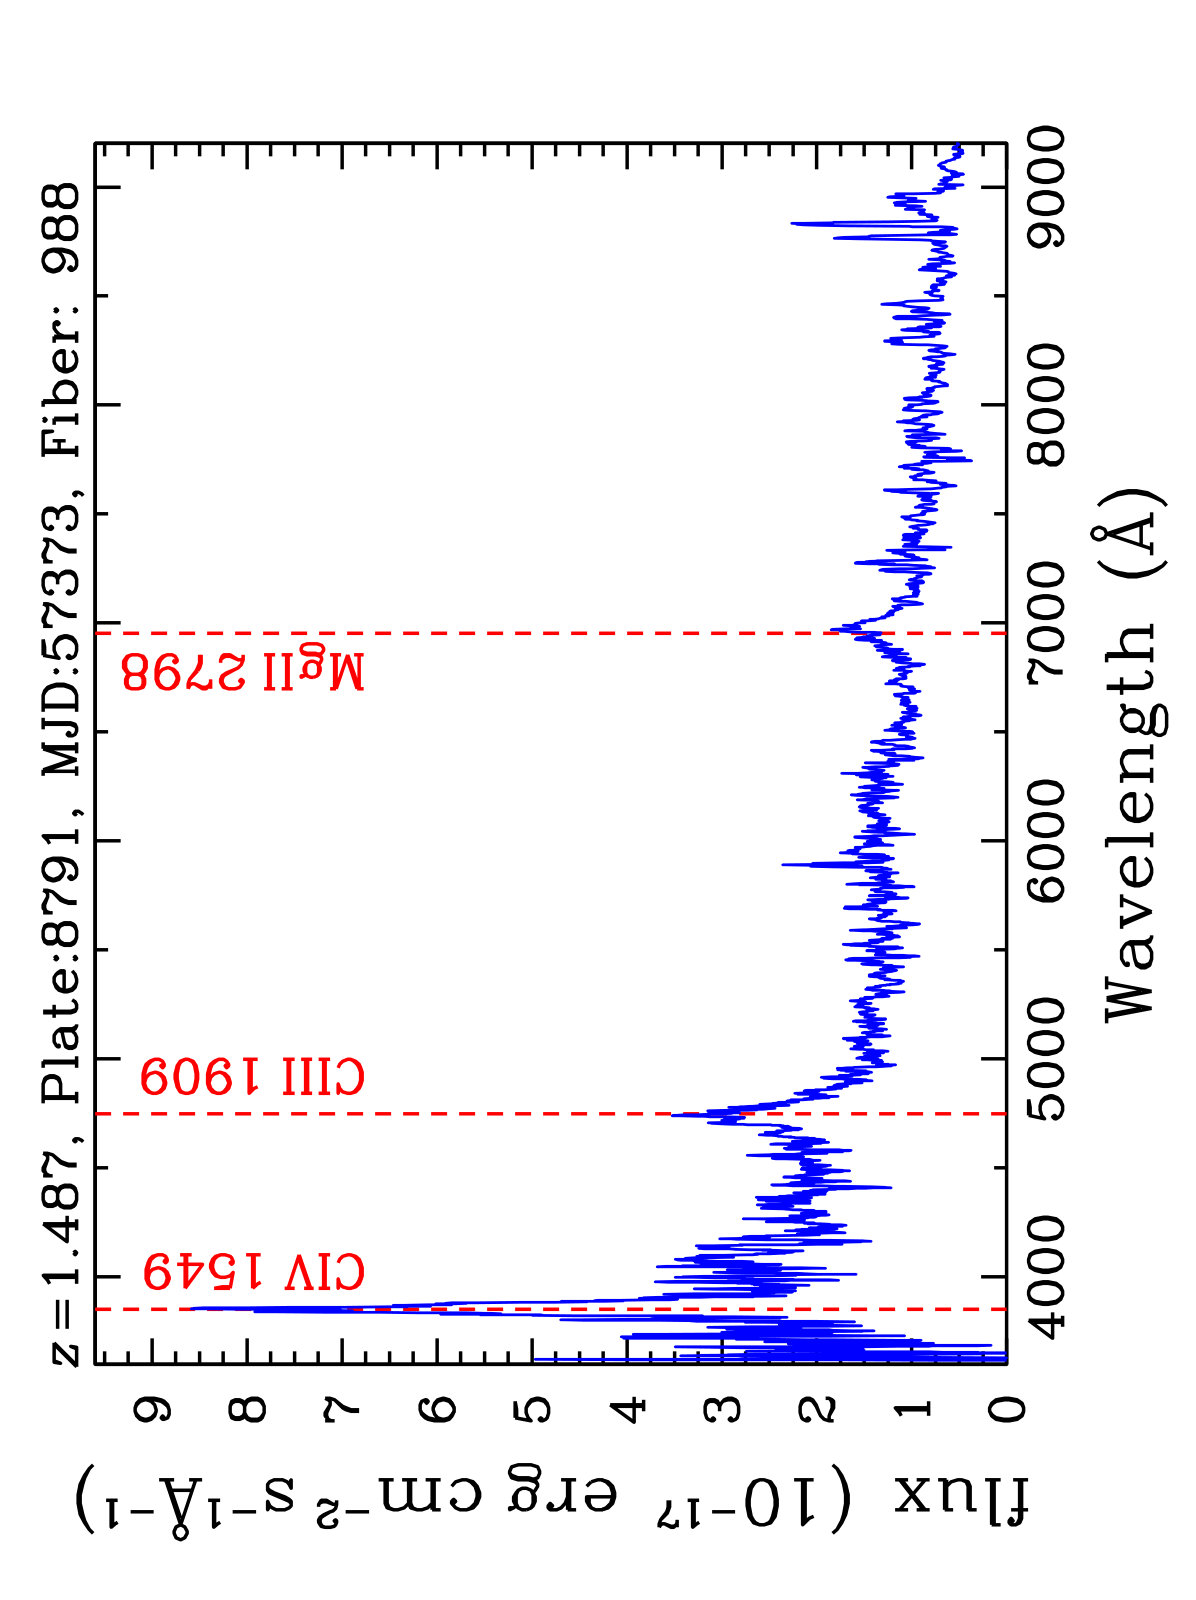 Figure 13
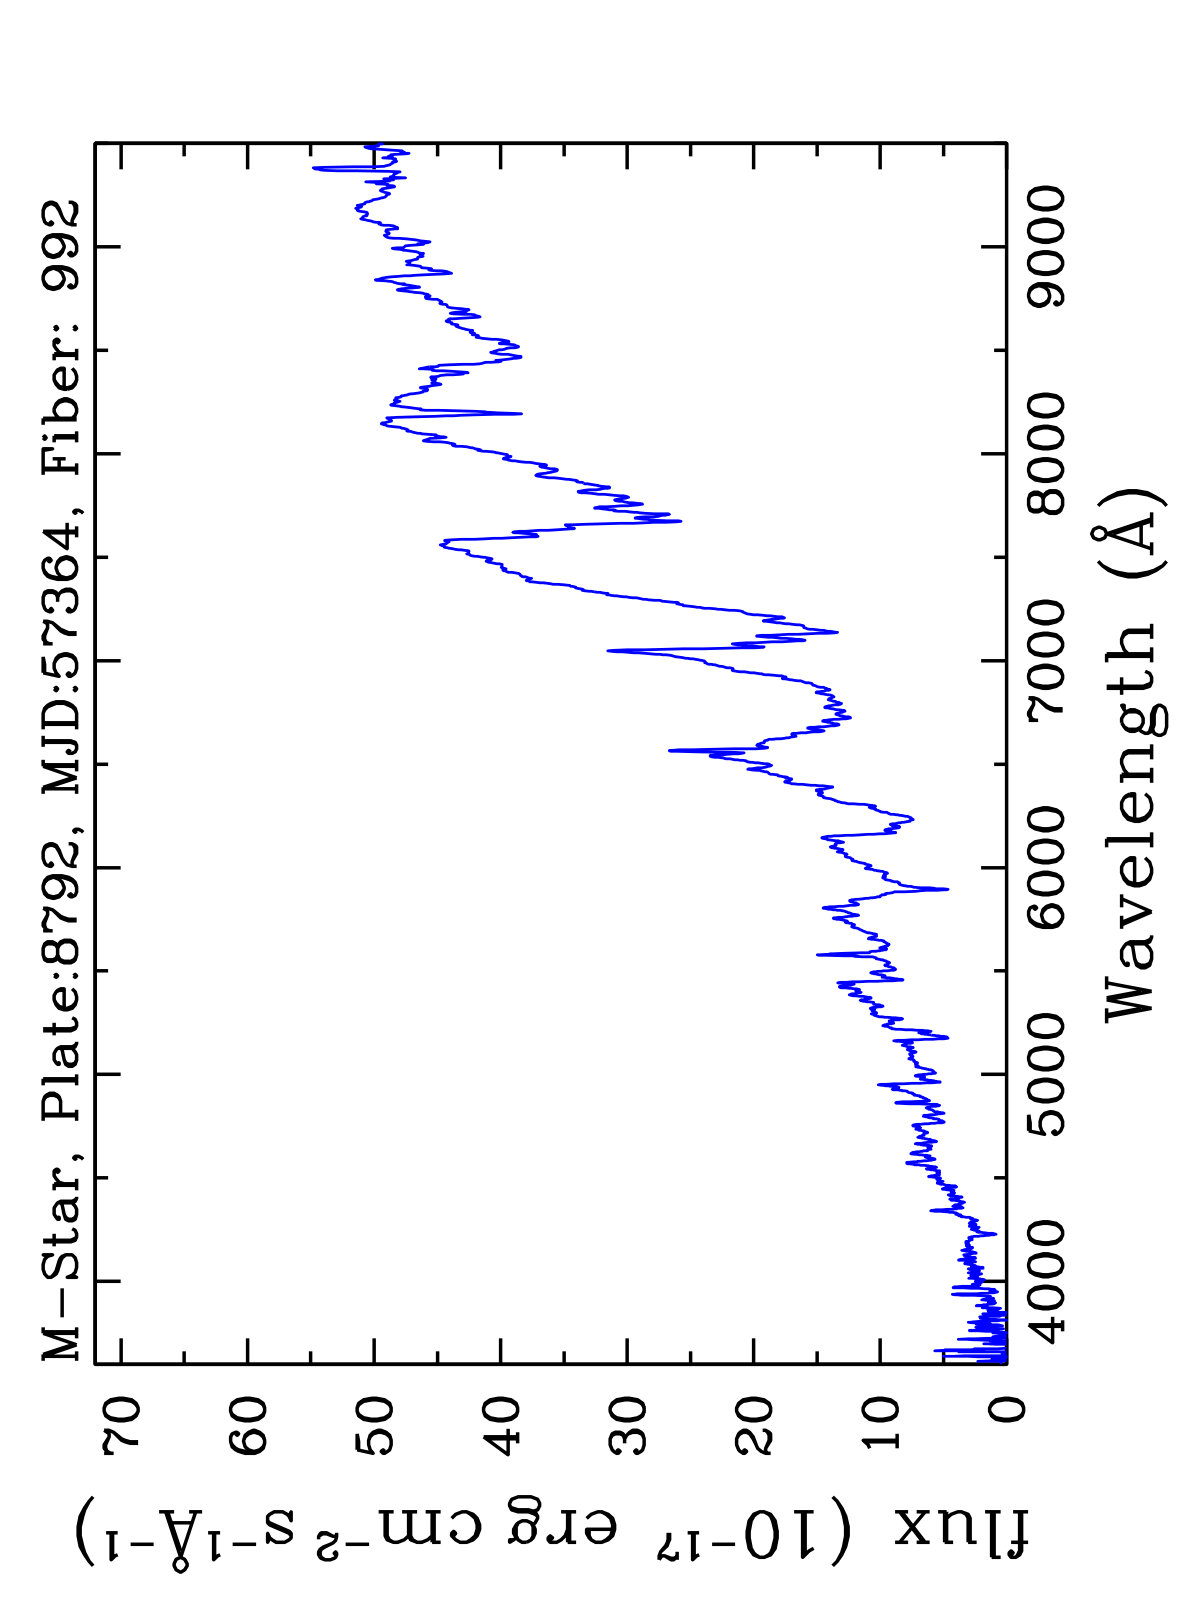 Figure 14
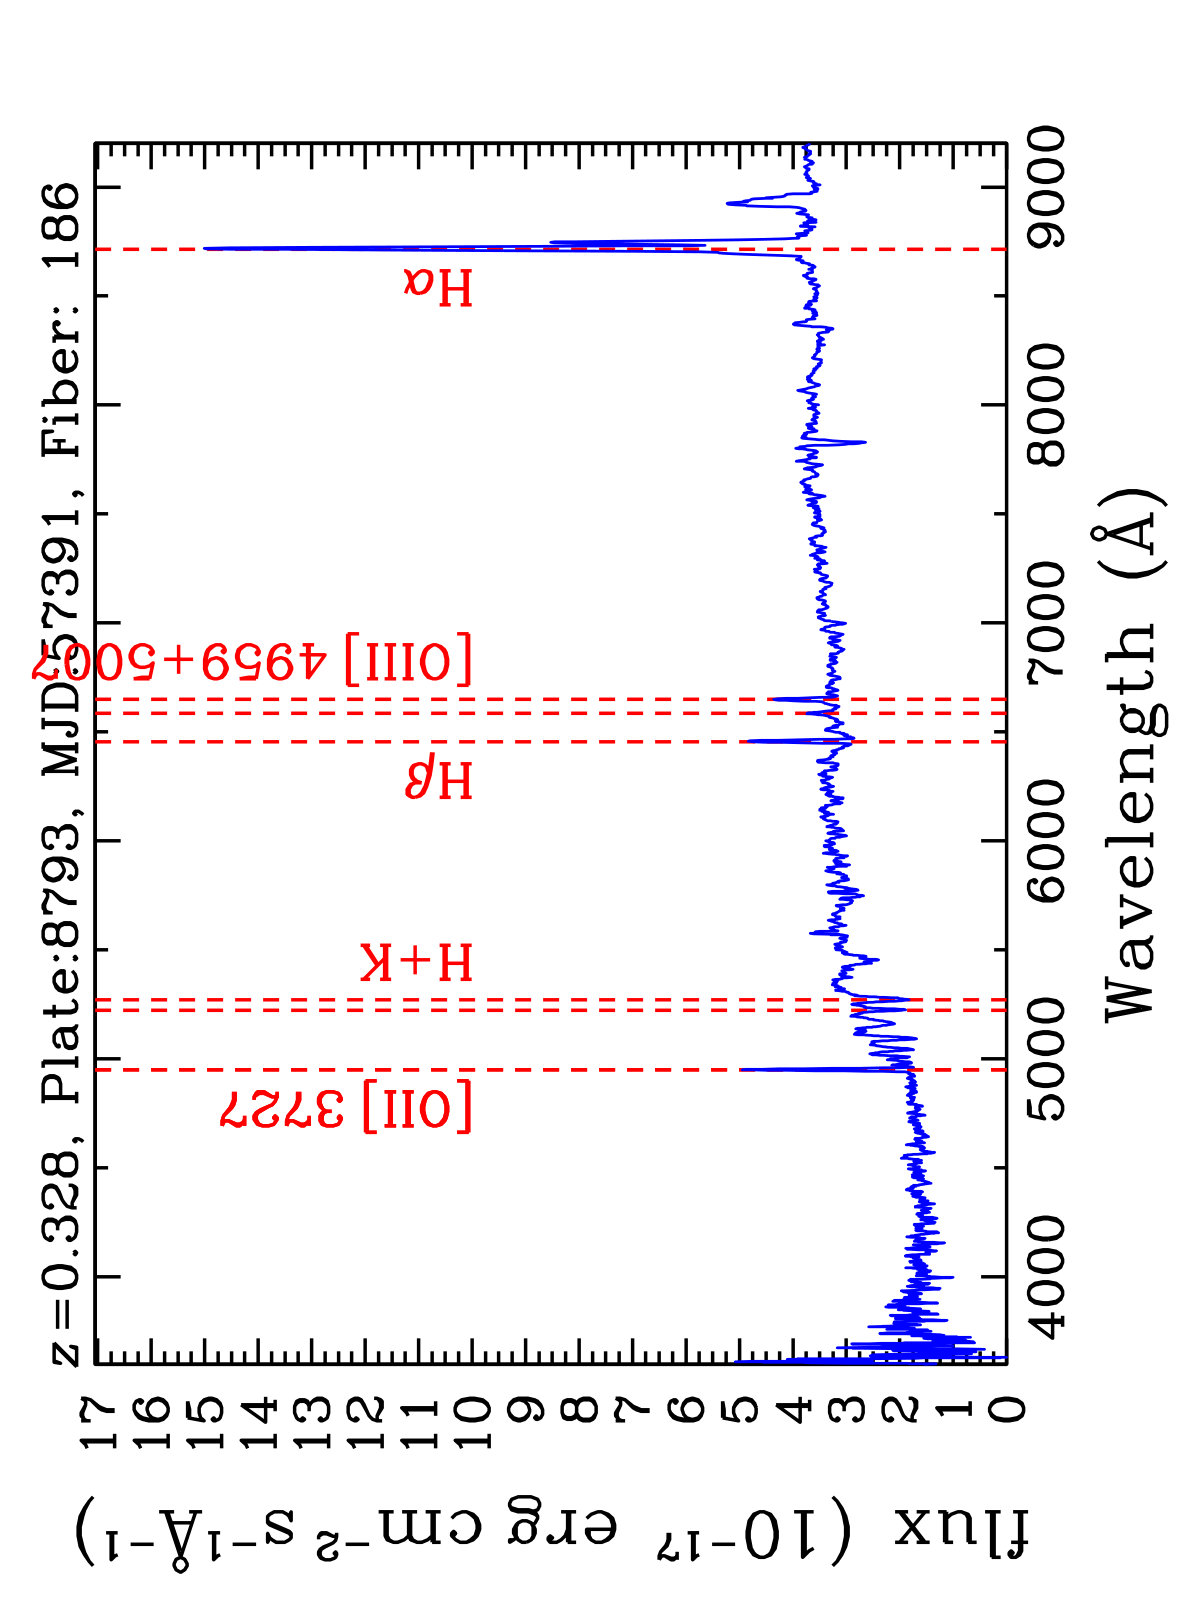 Figure 15
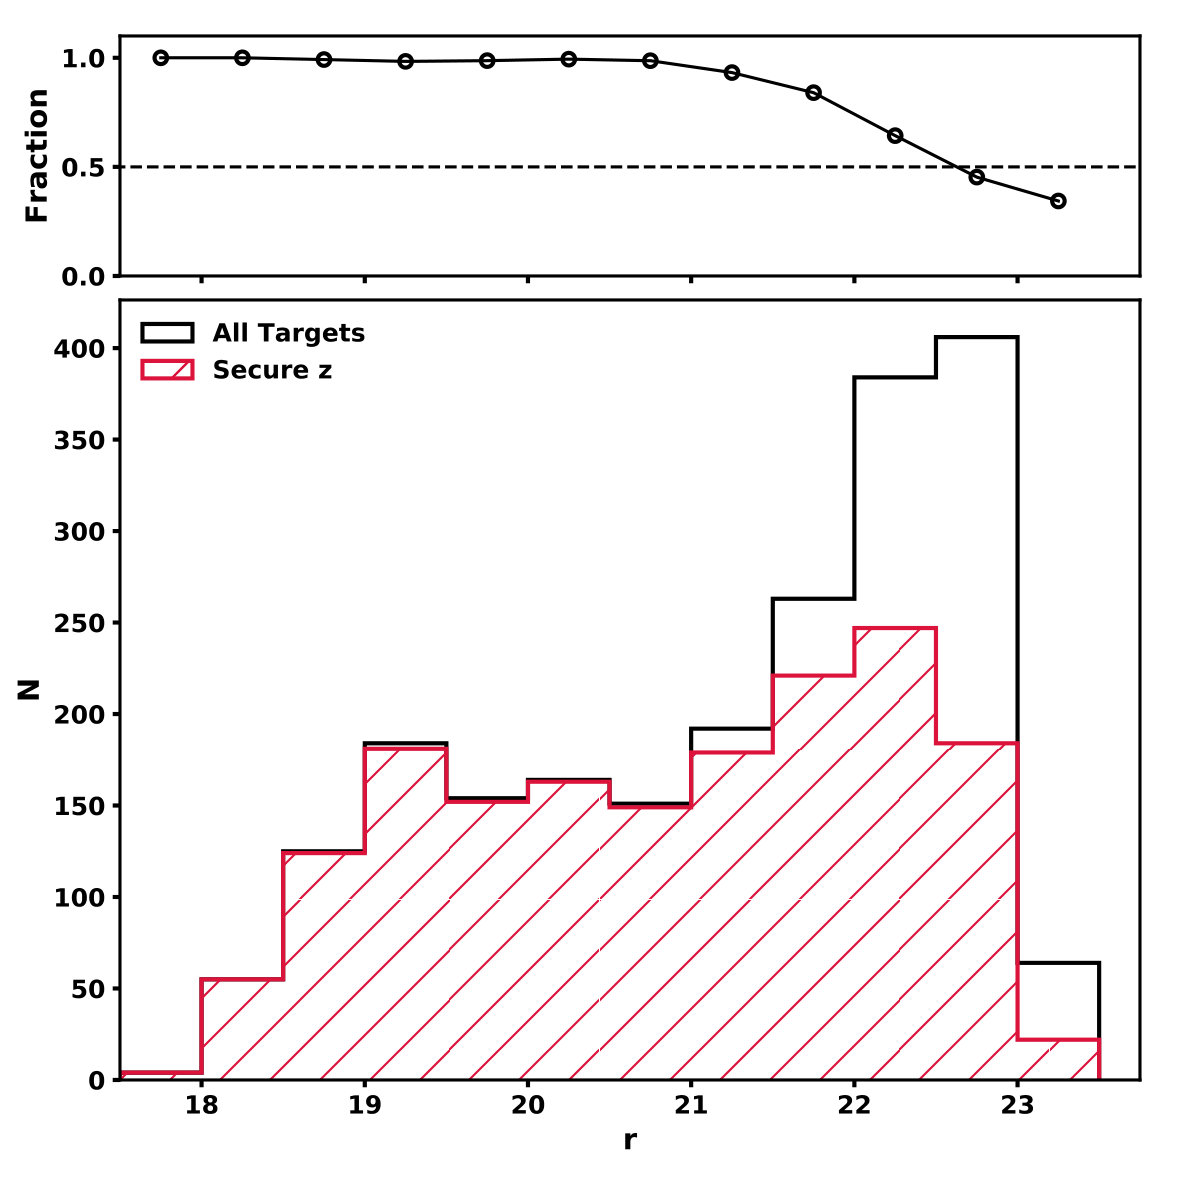 Figure 16
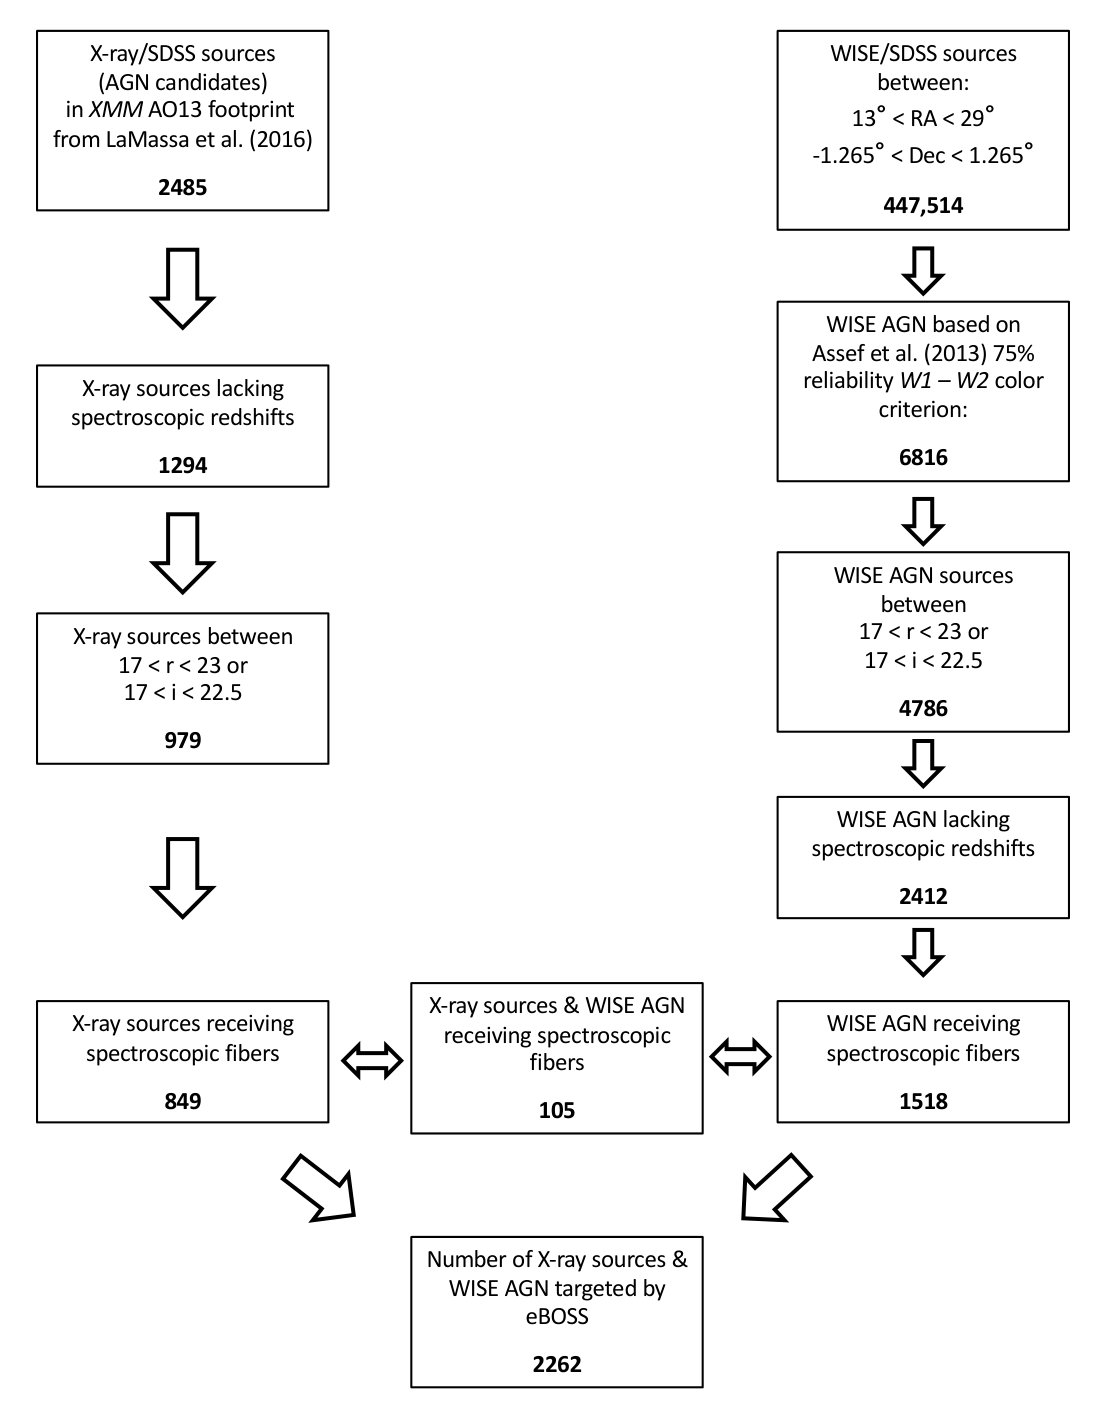 Figure 17
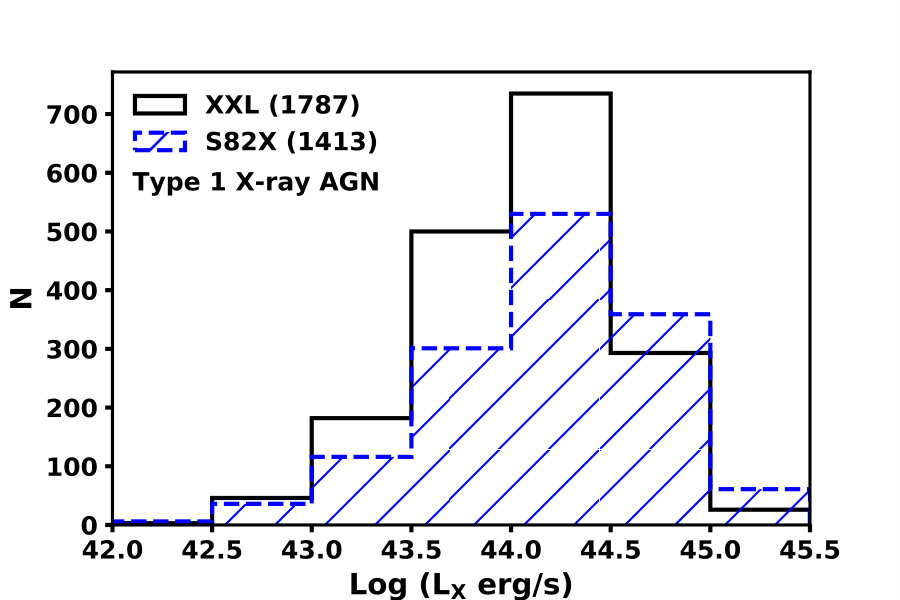 Figure 18
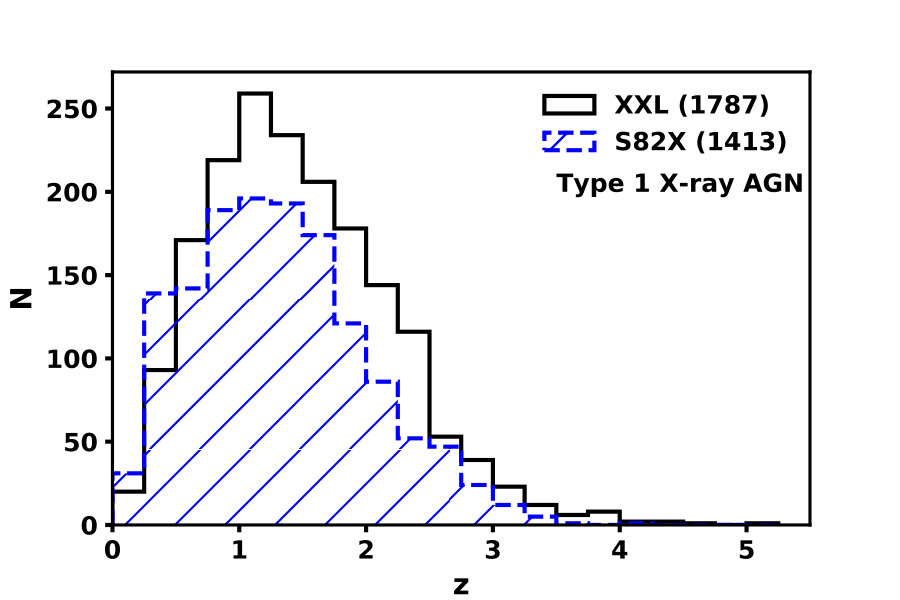 Figure 19
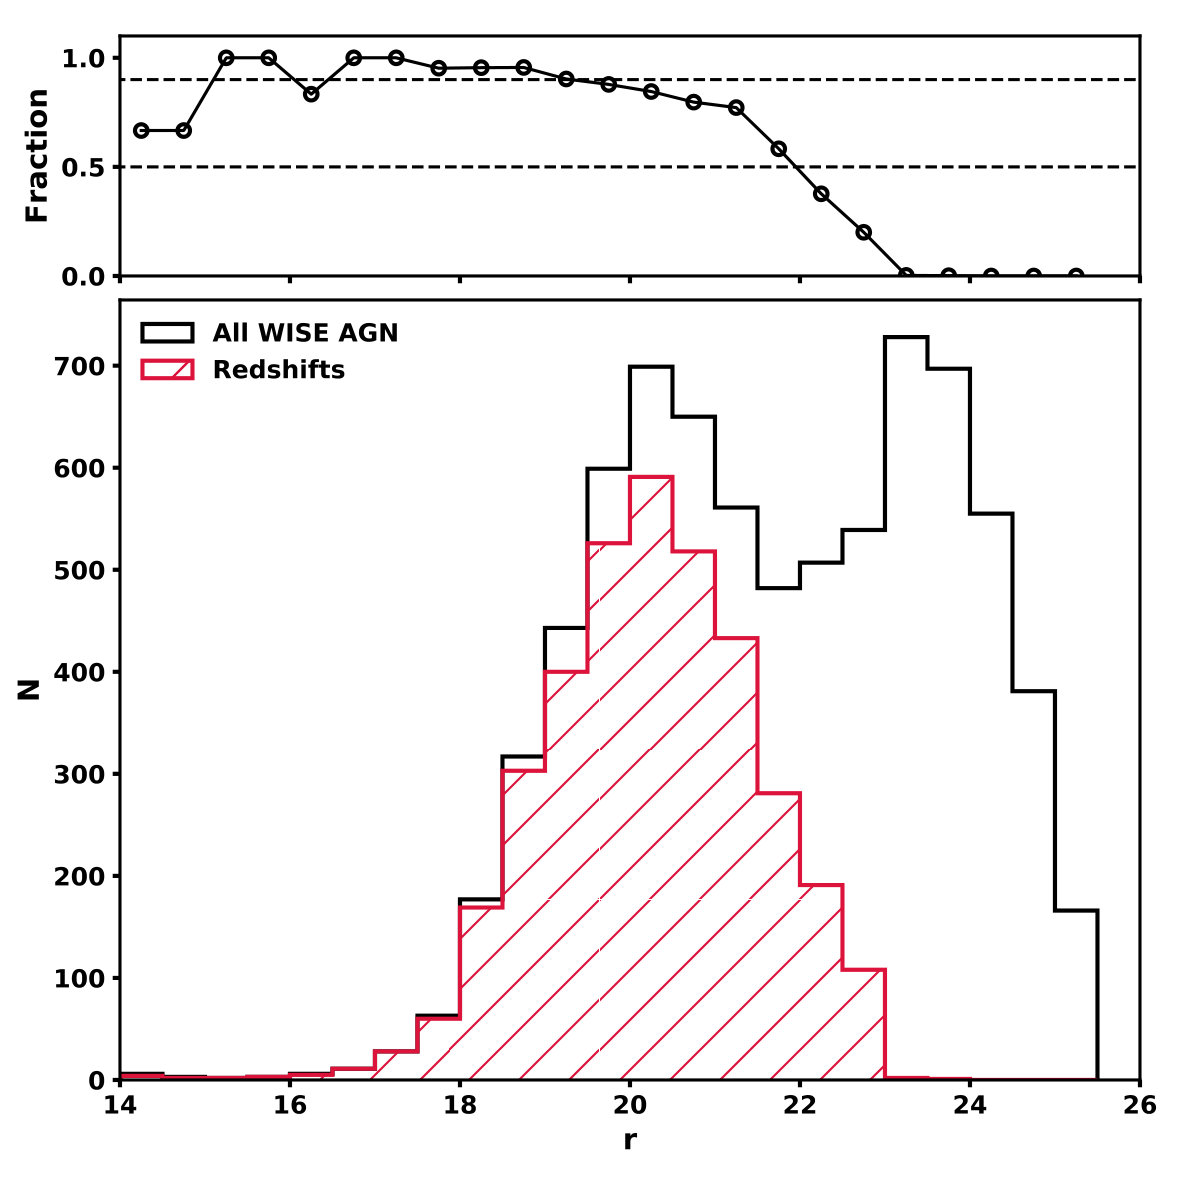 Figure 20
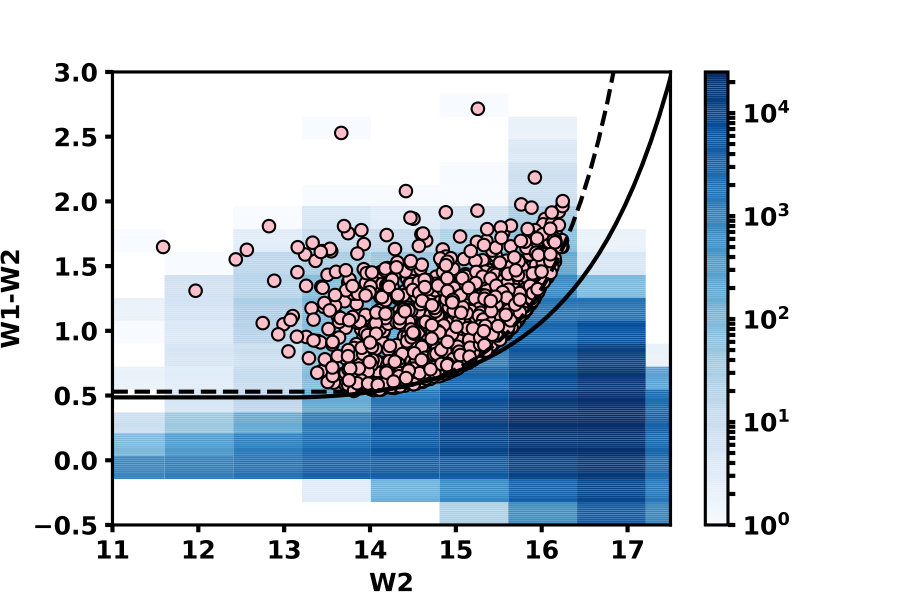 Figure 21
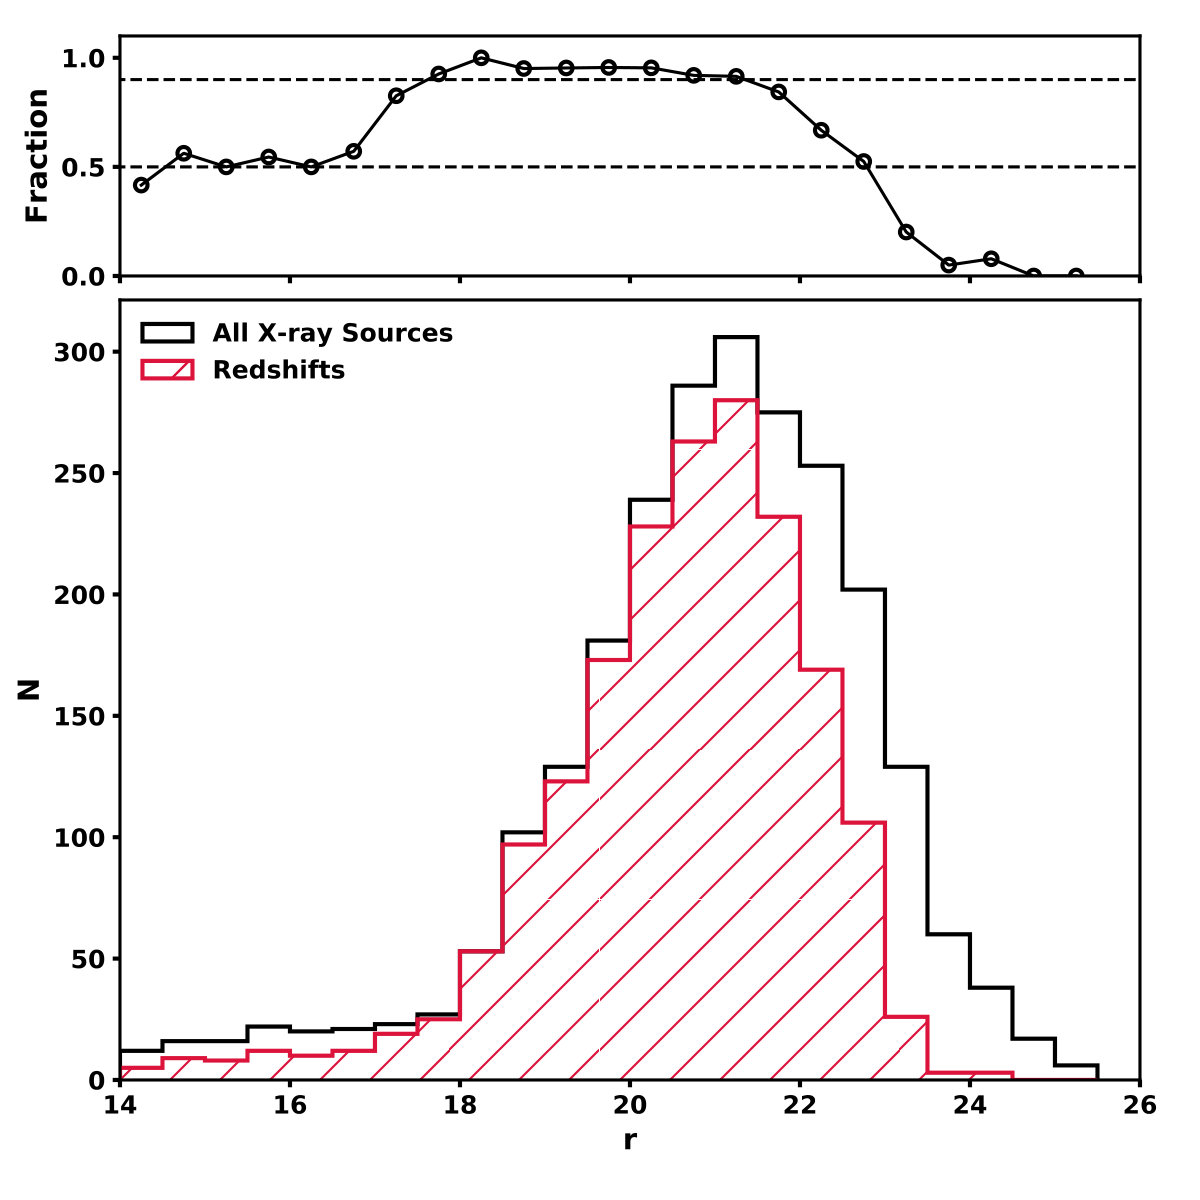 Figure 22
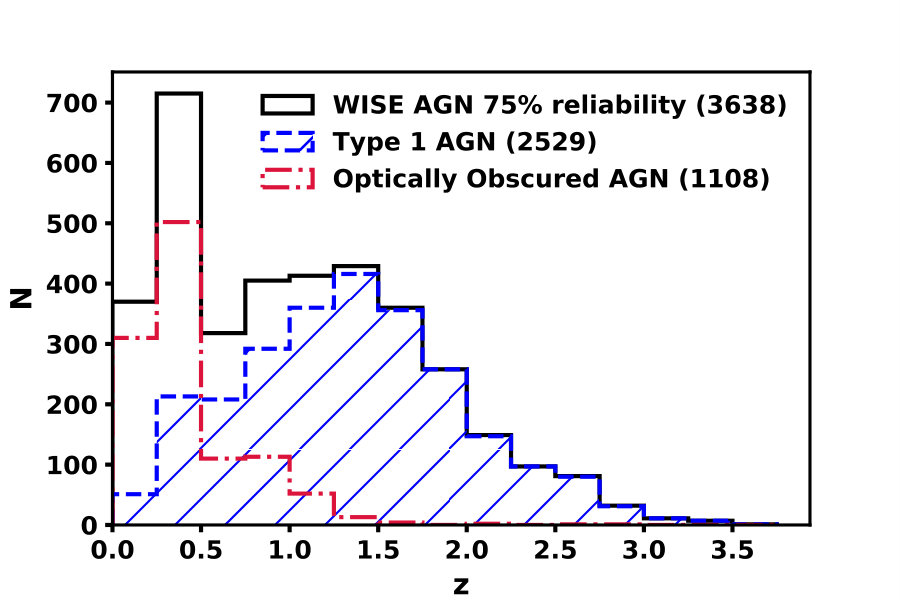 Figure 23
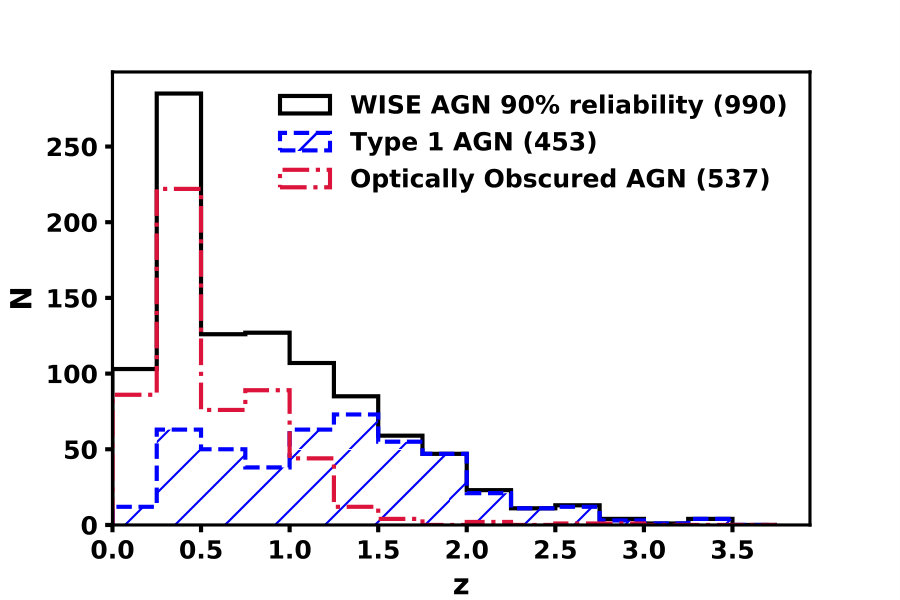 Figure 24
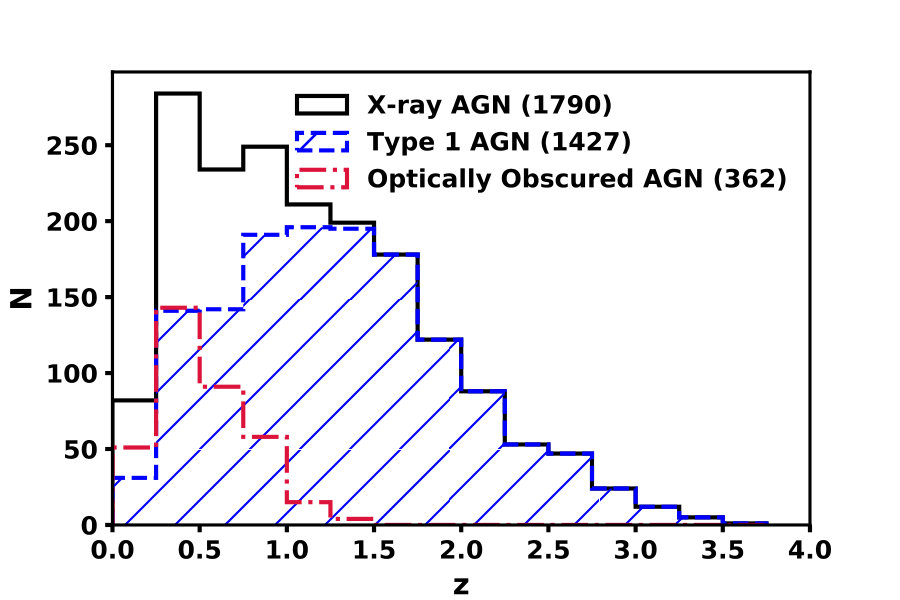 Figure 25
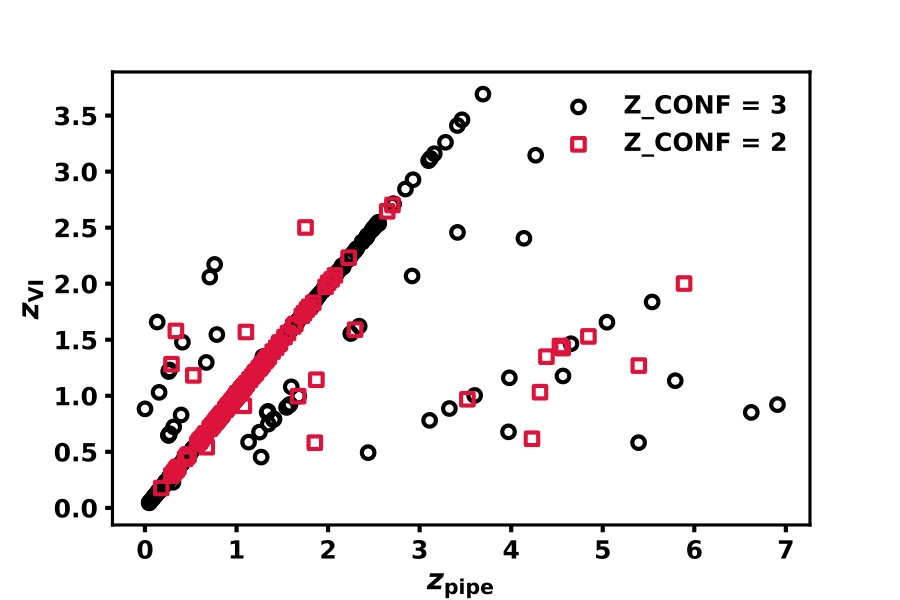 Figure 26
| 8788 | 8789 | 8790 | 8791 | 8792 | 8793 | |
|---|---|---|---|---|---|---|
| TARGET CLASS | ||||||
| S82X_BRIGHT_TARGET | 921 - 547 | 832 - 520 | 678 - 470 | 593 - 451 | 703 - 461 | 705 - 478 |
| S82X_XMM_TARGET | 198 - 187 | 197 - 178 | 142 - 132 | 75 - 71 | 169 - 162 | 208 - 195 |
| S82X_WISE_TARGET | 324 - 303 | 289 - 269 | 259 - 248 | 247 - 235 | 297 - 282 | 287 - 273 |
| S82X_SACLAY_VAR_TARGET | 273 - 157 | 249 - 155 | 249 - 193 | 278 - 254 | 241 - 181 | 263 - 1829 |
| S82X_SACLAY_BDT_TARGET | 274 - 155 | 241 - 166 | 228 - 175 | 205 - 183 | 197 - 146 | 207 - 133 |
| S82X_SACLAY_HIZ_TARGET | 154 - 18 | 132 - 16 | 103 - 24 | 83 - 19 | 120 - 17 | 118 - 25 |
| S82X_RICHARDS15_PHOTOQSO_TARGET | 32 - 24 | 40 - 30 | 30 - 23 | 29 - 29 | 42 - 40 | 42 - 35 |
| S82X_PETERS15_COLORVAR_TARGET | 225 - 132 | 265 - 173 | 219 - 179 | 212 - 192 | 215 - 66 | 239 - 161 |
| S82X_LSSTZ4_TARGET | 27 - 27 | 18 - 18 | 23 - 23 | 27 - 27 | 19 - 19 | 25 - 25 |
| S82X_UNWISE_TARGET | 206 - 59 | 170 - 49 | 125 - 37 | 127 - 48 | 173 - 54 | 152 - 62 |
| S82X_CLAGN1_TARGET | 2 - 2 | 2 - 1 | 5 - 5 | 4 - 4 | 5 - 5 | 5 - 5 |
| S82X_CLAGN2_TARGET | 23 - 21 | 26 - 23 | 31 - 29 | 37 - 35 | 35 - 31 | 31 - 28 |
| TOTAL | 1497 - 900 | 1422 - 900 | 1228 - 900 | 1117 - 900 | 1282 - 900 | 1313 - 900 |
| z_conf | ||||
|---|---|---|---|---|
| 0 | 1 | 2 | 3 | |
| class_person | ||||
| NONE | no vote/opinion | Bad spectrum | no signal (continuum or spectral features) | continuum but no spectral features |
| QSO | single broad line | spectral features (including broad lines) | ||
| Galaxy | single non-broad line | lines (non-broad) | ||
| QSO BAL | BAL troughs only; uncertain | BAL troughs and (narrow) emission lines | ||
| Blazar | continuum, no features to measure | continuum & spectral features to measure | ||
| Star | Stellar-like continuum | Stellar-like continuum & spectral features |
| Stripe 82X eBOSS Value Added Catalog Column Descriptions SDSS RA | SDSS Right Ascension (J2000) |
| SDSS Dec | SDSS Declination (J2000) |
| MJD | Modified Julian Date of SDSS spectroscopic observation; only applicable to sources with SDSS spectroscopy |
| Fiber | Fiber ID number of SDSS spectroscopic target; only applicable to sources with SDSS spectroscopy |
| Plate | Plate number of SDSS spectroscopic observation; only applicable to sources with SDSS spectroscopy |
| Redshift | Spectroscopic redshift. If spectrum was derived from the SDSS-IV eBOSS Stripe 82X program, it was vetted or independently determined by visual inspection. |
| Class | Optical spectroscopic classification, vetted via visual inspection. Entries are: “STAR”, “QSO” (if at least one broad emission line is present), “GALAXY” (only narrow emission lines or absorption lines are present). |
| z_src | Source of spectroscopic redshift and classification: • eBOSS_S82X - eBOSS spectroscopic survey of Stripe 82X, described in this paper; • SDSS_DR14 - SDSS Data Release 14 (Abolfathi et al., 2018); • SDSS_DR14Q - SDSS Quasar Catalog Data Release 14 (Pâris et al., 2018); • SDSS_DR13 - SDSS Data Release 13 (Albareti et al., 2017); • SDSS_DR12 - SDSS Data Release 12 (Alam et al., 2015); • SDSS_DR12Q - SDSS Quasar Catalog Data Release 12 (Pâris et al., 2017); • SDSS_DR8 - SDSS Data Release 8 (Aihara et al., 2011); • SDSS_DR7Q - SDSS Quasar Catalog Data Release 7 (Abazajian et al., 2009); • SDSS_zwarning_verified_by_eye - SDSS zwarning flag was non-null, but spectrum was vetted in the catalog release of LaMassa et al. (2016a); • pre-BOSS - pre-BOSS pilot survey using Hectospec on MMT (Ross et al., 2012); • 2SLAQ - 2SLAQ survey (Croom et al., 2009); • 6dF - 6dF survey (Jones et al., 2004, 2009); • HYDRA_2014_Jan - follow-up observations of Stripe 82X sources from WIYN HYDRA in 2014 Jan, first published in LaMassa et al. (2016a); • HYDRA_2015_Jan - follow-up observtions of Stripe 82X sources from WIYN HYDRA in 2015 Jan, first published in LaMassa et al. (2016a); • Gemini_GNIRS_2015 - follow up observations of obscured AGN candidates in Stripe 82X from Gemini GNIRS in 2015, first published in LaMassa et al. (2017); • DBSP_2015_Sep - follow-up observations of Stripe 82X sources from Palomar DoubleSpec in 2015 Sep, published here for the first time; • DBSP_2016_Aug - follow-up observations of Stripe 82X sources from Palomar DoubleSpec in 2016 Aug, published here for the first time; • DBSP_2017_Oct - follow-up observations of Stripe 82X sources from Palomar DoubleSpec in 2017 Oct, published here for the first time; • Keck_LRIS_Oct2017 - follow-up observations of Stripe 82X sources from Keck LRIS in 2017 Oct, published here for the first time. |
| z_conf | Confidence on spectroscopic redshift via visual inspection. 2: one emission/absorption line identified, 3: 2 emission/absorption lines identified; only applicable to sources from the SDSS-IV eBOSS Stripe 82X program. |
| u_mag | SExtractor “AUTO” (i.e., Kron-line elliptical aperture) -band magnitude from coadded Jiang et al. (2014) catalog (AB) or SDSS ModelMag photometric measurement. |
| u_err | error on -band magnitude from coadded Jiang et al. (2014) catalog or SDSS ModelMagErr value from SDSS pipeline. |
| g_mag | SExtractor “AUTO” (i.e., Kron-line elliptical aperture) -band magnitude from coadded Jiang et al. (2014) catalog (AB) or SDSS ModelMag photometric measurement. |
| g_err | error on -band magnitude from coadded Jiang et al. (2014) catalog or SDSS ModelMagErr value from SDSS pipeline. |
| r_mag | SExtractor “AUTO” (i.e., Kron-line elliptical aperture) -band magnitude from coadded Jiang et al. (2014) catalog (AB) or SDSS ModelMag photometric measurement. |
| r_err | error on -band magnitude from coadded Jiang et al. (2014) catalog or SDSS ModelMagErr value from SDSS pipeline. |
| i_mag | SExtractor “AUTO” (i.e., Kron-line elliptical aperture) -band magnitude from coadded Jiang et al. (2014) catalog (AB) or SDSS ModelMag photometric measurement. |
| i_err | error on -band magnitude from coadded Jiang et al. (2014) catalog or SDSS ModelMagErr value from SDSS pipeline. |
| z_mag | SExtractor “AUTO” (i.e., Kron-line elliptical aperture) -band magnitude from coadded Jiang et al. (2014) catalog (AB) or SDSS ModelMag photometric measurement. |
| z_err | error on -band magnitude from coadded Jiang et al. (2014) catalog or SDSS ModelMagErr value from SDSS pipeline. |
| opt_src | Source of optical photometry. J14 - coadded catalog of Jiang et al. (2014), SDSS - pipeline photometry from the single-epoch SDSS catalog. |
| W1 | WISE magnitude at 3.4m measured with profile-fitting photometry (Vega). Only reported if W1 magnitude has a S/N 2. |
| W1sig | uncertainty on magnitude |
| W2 | WISE magnitude at 4.6m measured with profile-fitting photometry (Vega). Only reported if W2 magnitude has a S/N 2. |
| W2sig | uncertainty on magnitude |
| W3 | WISE magnitude at 12m measured with profile-fitting photometry (Vega). Only reported if W3 magnitude has a S/N 2. |
| W3sig | uncertainty on magnitude |
| W4 | WISE magnitude at 22m measured with profile-fitting photometry (Vega). Only reported if W4 magnitude has a S/N 2. |
| W4sig | uncertainty on magnitude. |
| R-W1 | (Vega) color, useful to assess reddening of source. |
| WISE color, which is used to determine whether the source is a WISE AGN. | |
| WISE_AGN_75 | If WISE color obeys the Assef et al. (2018) AGN selection at the 75% reliability threshold, this flag is set to “YES.” In the main body of the text, a source that meets this color criterion is considered a WISE AGN. |
| WISE_AGN_90 | If WISE color obeys the Assef et al. (2018) AGN selection at the 90% reliabilibty threshold, this flag is set to “YES” |
| Soft_flux | X-ray flux in the 0.5-2 keV band from LaMassa et al. (2016a) |
| Soft_DETML | Significance of X-ray detection in the soft band, where = -ln, with as the Poissonian probability that the detection is a random fluctuation. |
| Soft_Lum | Log of the -corrected soft-band X-ray luminosity. Only computed if Soft_DETML 10. |
| Hard_flux | X-ray flux in the 2-10 (2-7) keV band for XMM-Newton (Chandra) sources from LaMassa et al. (2016a) |
| Hard_DETML | Significance of X-ray detection in the hard band, where = -ln, with as the Poissonian probability that the detection is a random fluctuation. |
| Hard_Lum | Log of the -corrected hard-band X-ray luminosity. Only computed if Hard_DETML 10. |
| Full_flux | X-ray flux in the 0.5-10 (0.5-7) keV band for XMM-Newton (Chandra) sources from LaMassa et al. (2016a) |
| Full_DETML | Significance of X-ray detection in the full band, where = -ln, with as the Poissonian probability that the detection is a random fluctuation. |
| Full_Lum | Log of the -corrected full-band X-ray luminosity. Only computed if Full_DETML 10. |
| Xray_Lum | Estimate of the -corrected 2-10 keV X-ray luminosity (). If Hard_DETML 10, this value respresents the measured -corrected hard X-ray luminosity. Otherwise, if Full_DETML 10, the -corrected full-band luminosity is adjusted by a factor of 0.665 to convert to the 2-10 keV band luminosity. If both Hard_DETML and Full_DETML are below 10, the -corrected soft-band luminosity is scaled by a factor of 1.27 to convert to the 2-10 keV band luminosity. |
| Xray_AGN | If erg s-1, the source is considered an X-ray AGN and this flag is set to “YES” |
| Log(NII_6584/H_alpha) | Logarithm of the [NII] 6584/H ratio. Only populated for sources spectroscopically identified as “Galaxies” in the SDSS pipeline with a S/N 5 in the [NII] 6584 Å, [OIII] 5007 Å, H, and H lines. Emission line fluxes are measured by the SDSS pipeline. |
| Log(OIII_5700/H_beta) | Logarithm of the [OIII] 5007/H ratio. Only populated for sources spectroscopically identified as “Galaxies” in the SDSS pipeline with a S/N 5 in the [NII] 6584 Å, [OIII] 5007 Å, H, and H lines. Emission line fluxes are measured by the SDSS pipeline. |
| BPT Classification | BPT classification of sources at that are classified as “Galaxies” in the SDSS pipeline, and with emission line fluxes significant at the 5 level. “Sy2”: Seyfert 2 galaxy based on the definition of Kewley et al. (2001); “Comp”: Composite galaxy with emission line rations between the theoretical starburst line of Kewley et al. (2001) and empirical dividing line of Kauffmann et al. (2003); “SF”: Star-forming galaxies with emission line ratios below the Kauffmann et al. (2003) demarcation. |
Peer Reviews
No public reviews on file for this paper yet. If you reviewed it on a platform where reviews are public (OpenReview, ICLR, NeurIPS, ICML), you can paste yours below so the community can read it here.
Videos
No videos yet. Explain this paper in a talk, walkthrough, or lecture? Add one.
SDSS-IV eBOSS Spectroscopy of X-ray and WISE AGN in Stripe 82X: Overview of the Demographics of X-ray and Mid-Infrared Selected Active Galactic Nuclei
Stephanie M. LaMassa1, Antonis Georgakakis2, M. Vivek3,4, Mara Salvato5, Tonima Tasnim Ananna6,7, C. Meg Urry6,7, Chelsea MacLeod8, Nicholas Ross9
1Space Telescope Science Institute, 3700 San Martin Drive, Baltimore, MD 21210; 2National Observatory of Athens, Vas. Pavlou & I. Metaxa, 15236 Penteli, Greece; 3Department of Astronomy and Astrophysics, The Pennsylvania State University, 525 Davey Lab, University Park, PA 16802, USA; 4Department of Physics & Astronomy, University of Utah, Salt Lake City, UT 84112, USA; 5Max-Planck-Institut f ur Extraterrestrische Physik, Garching, Germany; 6Department of Physics, Yale University, P.O. Box 201820, New Haven, CT 06520-8120, USA; 7Yale Center for Astronomy and Astrophysics, P.O. Box 208121, New Haven, CT 06520, USA; 8Harvard-Smithsonian Center for Astrophysics, 60 Garden Street, Cambridge, MA, 02183, USA; 9Institute for Astronomy, University of Edinburgh, Royal Observatory, Blackford Hill, Edinburgh EH9 3HJ, UK 0000-0003-1830-6473
Abstract
We report the results of a Sloan Digital Sky Survey-IV eBOSS program to target X-ray sources and mid-infrared-selected WISE AGN candidates in a 36.8 deg2 region of Stripe 82. About half this survey (15.6 deg2) covers the largest contiguous portion of the Stripe 82 X-ray survey. This program represents the largest spectroscopic survey of AGN candidates selected solely by their WISE colors. We combine this sample with X-ray and WISE AGN in the field identified via other sources of spectroscopy, producing a catalog of 4847 sources that is 82% complete to . Based on X-ray luminosities or WISE colors, 4730 of these sources are AGN, with a median sample redshift of . About 30% of the AGN are optically obscured (i.e., lack broad lines in their optical spectra). BPT analysis, however, indicates that 50% of the WISE AGN at have emission line ratios consistent with star-forming galaxies, so whether they are buried AGN or star-forming galaxy contaminants is currently unclear. We find that 61% of X-ray AGN are not selected as MIR AGN, with 22% of X-ray AGN undetected by WISE. Most of these latter AGN have high X-ray luminosities ( erg s*-1*), indicating that MIR selection misses a sizable fraction of the highest luminosity AGN, as well as lower luminosity sources where AGN heated dust is not dominating the MIR emission. Conversely, 58% of WISE AGN are undetected by X-rays, though we do not find that they are preferentially redder than the X-ray detected WISE AGN.
Subject headings:
catalogs, surveys, galaxies:active
1. Introduction
Active galactic nuclei (AGNs) serve as signposts of accreting supermassive black holes (SMBHs) across the Universe. Multi-wavelength selection of AGN is necessary for a complete picture of SMBH growth and evolution, mitigating selection biases that are inherent in any one band. Optical AGN selection favors Type 1 AGN, or those where we have a direct view of the accretion disk and associated broad line region. The typical blue colors of these Type 1 AGN and point-like morphology serve as a basis for ground-based targeting from optical spectroscopic surveys, such as the Sloan Digital Sky Survey (SDSS, York et al., 2000), garnering hundreds of thousands of confirmed AGN (e.g., Pâris et al., 2017). However, optical surveys are biased against obscured AGN, where the accretion disk and broad line region are hidden behind large amounts of dust and gas on circumnuclear to galactic scales. Though these Type 2 AGN can be identified in nearby (i.e., ) galaxies on the basis of the ratios of their narrow emission lines using the so-called “BPT” diagram (Baldwin et al., 1981), they are more challenging to efficiently detect at larger distances, requiring infrared spectroscopic follow-up to observe the traditional BPT emission lines (Kewley et al., 2013a, b), or alternate diagnostics (Trouille et al., 2011; Juneau et al., 2011; Lamareille, 2010).
X-rays, produced in a hot corona around the accretion disk, provide a direct probe of SMBH fueling. This energetic emission pierces through optically obscuring dust, but becomes attenuated at high gas column densities, especially at Compton thick levels ( cm*-2*) where they will appear X-ray weak (Bassani et al., 1999; Heckman et al., 2005; LaMassa et al., 2009, 2011), even at the highest X-ray energies (Lansbury et al., 2014, 2015).
AGN heated dust emits at mid-infrared energies, imparting a characteristic powerlaw shape to the spectral energy distribution, dominating over host galaxy star formation in powerful AGN (Lacy et al., 2004; Stern et al., 2005; Donley et al., 2012). Mid-infrared (MIR) color selection then becomes a powerful tool to recover obscured AGN missed by optical and X-ray selection, though contamination from star-forming galaxies can be considerable at fainter fluxes (Barmby et al., 2006; Cardamone et al., 2008; Mendez et al., 2013). Additionally, AGN at fainter luminosities are missed by mid-infrared selection (Mateos et al., 2012; Menzel et al., 2016; LaMassa et al., 2016b).
A combination of AGN samples selected via independent methods is then crucial to understand selection effects and provide a comprehensive view of cosmic black hole growth. While survey fields, like GOODS (Alexander et al., 2003; Comastri et al., 2011; Xue et al., 2011; Luo et al., 2017) and COSMOS (Scoville et al., 2007; Hasinger et al., 2007; Elvis et al., 2009; Civano et al., 2016) have a wealth of multi-wavelength data where such analysis can be done, these cover a relatively small volume of the Universe with survey areas of 0.13 deg2 and 2.2 deg2, respectively. To find a representative sampling of rare AGN, wide-area surveys, which cover a large volume of the Universe, are necessary, complementing the AGN population found in smaller area fields.
Stripe 82X is such a wide-area X-ray survey, covering 31 deg2 of the legacy SDSS Stripe 82 field (LaMassa et al., 2013a, b, 2016a; Ananna et al., 2017). Imaged 100 times as part of a supernova legacy program (Frieman et al., 2008), the coadded depth in Stripe 82 is approximately 2 magnitudes deeper than any single SDSS scan (Annis et al., 2014; Jiang et al., 2014; Fliri & Trujillo, 2016). Stripe 82 contains rich multiwavelength coverage, with ultraviolet data from GALEX (Morrissey et al., 2007), near-infrared (NIR) data from UKIDSS (Hewett et al., 2006; Casali et al., 2007; Lawrence et al., 2007) and the Vista Hemisphere Survey (VHS; McMahon et al., 2013), MIR data from Spitzer IRAC (Timlin et al., 2016; Papovich et al., 2016) and WISE (Wright et al., 2010), far-infrared coverage from Herschel SPIRE (Viero et al., 2014), and radio coverage at 1.4 GHz from FIRST (Becker et al., 1995; Helfand et al., 2015). About half (15.6 deg2) of the Stripe 82X survey is contiguous, spanning from 14 RA and -0.6 Dec . This region was observed between 2014 and 2015 with XMM-Newton in response to a successful AO13 proposal (PI: Urry; LaMassa et al., 2016a), and reaches an 0.5-10 keV flux limit of erg s*-1* cm*-2* at half survey area.
This contiguous, homogeneously covered portion of the Stripe 82X survey provides an ideal dataset to assess whether AGN identified via various multi-wavelength selection methods represent unique populations, determine the types of AGN common across identification methods, and construct a bolometric quasar luminosity function to analyze how AGN evolve over cosmic time. Important first steps are to determine redshifts and classifications for the X-ray sources via spectroscopy and to create an independent sample of MIR-selected AGN in the same survey area. These samples can then be combined with optically-selected AGN from SDSS within this survey area for a multi-wavelength view of black hole growth.
A special eBOSS (Smee et al., 2013; Dawson et al., 2016) program of SDSS-IV (Gunn et al., 2006; Blanton et al., 2017) spectroscopically observed the XMM-Newton AO13 Stripe 82X field, targeting 849 SDSS counterparts to Stripe 82 X-ray sources from the catalog of LaMassa et al. (2016a) and 1518 independently selected WISE AGN candidates (based on their , 3.4m - 4.6m, color; Assef et al., 2013) within the same survey area. In this catalog release paper, we describe the observations and success rate of the spectroscopic identifications. We combine this source list with other spectroscopically identified X-ray and WISE AGN in the field to create a nearly complete sample of X-ray and MIR-selected AGN to , and comment on the demographics of these populations. Throughout, we assume a cosmology of = 67.8 km s*-1* Mpc*-1*, = 0.37, = 0.69 (Planck Collaboration et al., 2016).
2. Target Selection
The parent X-ray and WISE samples we used for the target selection are discussed in detail below. We identified SDSS counterparts to these sources using the maximum likelihood estimator (MLE; Sutherland & Saunders, 1992), a statistical approach that accounts for the distance between an X-ray (WISE) source and potential multiwavelength counterparts within a pre-defined search radius, the magnitudes of the potential associations within that search radius, the magnitude distribution of background sources, and astrometric errors on the X-ray (WISE) coordinates and those of the potential multiwavelength counterparts. This algorithm computes a likelihood ratio (), which is the probability that the correct counterpart is found divided by the probability that an unassociated background source is there by chance. From , a reliability value () is then calculated for each source. This counterpart matching was done separately for the X-ray and WISE sources, where () was used to distinguish between true counterparts and spurious associations for the X-ray (WISE) sources, as discussed below.
In total, 2262 SDSS counterparts to X-ray- and infrared-selected sources were targeted by the eBOSS Stripe 82X survey in the fall of 2015. Of these SDSS sources, 105 were both X-ray- and infrared- selected, 744 were detected only in X-rays, and 1413 were selected on the basis of their mid-infrared properties alone. Figure 1 summarizes the selection criteria for both classes of objects, with further details in the following subsections.
After the eBOSS observations, an updated multi-wavelength matched catalog to the Stripe 82X survey was published in Ananna et al. (2017), using a deeper coadded SDSS catalog (Fliri & Trujillo, 2016) and matches to Spitzer data in the field (Timlin et al., 2016; Papovich et al., 2016). Ananna et al. (2017) cross-matched these various multi-wavelength associations and reported the most likely counterpart to each X-ray source, resulting in 14% discrepant associations compared with the LaMassa et al. (2016a) catalog. Additionally, Assef et al. (2018) published a WISE AGN catalog using slightly updated color selection criteria for the 90% and 75% reliability levels, leading to slight discrepancies between the eBOSS WISE AGN target list and the most up-to-date AGN definition.
When discussing the targeting procedure and inspecting the results of the pipeline, we preserve the original source lists, since success of the pipeline results depend on optical properties, regardless of why the source was included in the target list. However, we vet these lists to only retain the sources in the updated Ananna et al. (2017) catalog and those that obey the revised Assef et al. (2018) color criterion at the 75% reliability level in the published catalog and when we comment on AGN demographics.
2.1. X-ray
The X-ray sample is culled from the 15.6 deg2 portion of the 31.3 deg2 Stripe 82 X-ray survey that was observed with XMM-Newton in AO13 (LaMassa et al., 2016a). The full X-ray coverage in Stripe 82X includes 4.6 deg2 of XMM-Newton observations from AO10 and archival XMM-Newton and Chandra observations in the field (LaMassa et al., 2013a, b) that were not observed with this SDSS-IV eBOSS spectroscopic program since the fields were mostly not contiguous with the XMM-Newton AO13 footprint. The X-ray-selected sources are from the XMM-Newton AO13 program as well as two archival Chandra observations and one archival XMM-Newton observation that overlapped the footprint of the SDSS spectroscopic plates. The coverage of the eBOSS “Stripe 82X” survey region is somewhat larger than the 15.6 deg2 XMM-Newton AO13 survey area (see Figure 2).
The details of the MLE matching are discussed in LaMassa et al. (2013a, 2016a), but in brief, SDSS associations were identified within a 7*′′* search radius of an XMM-Newton source (Brusa, et al., 2010), or within a 5*′′* of a Chandra source (Civano, et al., 2012). The X-ray sources were originally matched to both the SDSS single-epoch imaging catalog and the coadded SDSS catalogs of (Jiang et al., 2014), which reach a depth of mag (AB), i.e. about two magnitudes deeper than the SDSS single-epoch data: if a source was found in the SDSS single-epoch imaging, we retained that match to enable efficient querying of the web-based SDSS database, otherwise we reported the magnitude(s) from the coadded catalog (if a reliable counterpart was found in this deeper catalog). We empirically determined a reliability threshold above which we accepted an SDSS source as a counterpart to an X-ray source: we shifted the X-ray positions by random amounts, repeated the MLE counterpart matching, and defined a critical reliability cutoff where the spurious association fraction (i.e., matches to randomized positions) was 10% of the matches to actual X-ray sources. Any SDSS sources with a reliability value above this threshold was considered an X-ray counterpart.
Within the SDSS-IV eBOSS Stripe 82X survey area, there are 2485 SDSS sources that are identified as counterparts to X-ray sources in LaMassa et al. (2016a). Of these, 1191 had pre-existing spectroscopic redshifts, with 786 from previous SDSS programs (e.g., SDSS Data Releases 8 - 13 and previous releases of the SDSS quasar catalog; Albareti et al., 2017; Alam et al., 2015; Aihara et al., 2011; Abazajian et al., 2009) and the remainder from 2SLAQ (Croom et al., 2009), 6dF (Jones et al., 2004, 2009), and proprietary SDSS redshifts at the time the target list was generated (which are now publicly available in SDSS Data Release 14 (Abolfathi et al., 2018)). Of the 1294 X-ray/SDSS sources lacking redshifts, we imposed the following magnitude cuts to maximize the success rate of the SDSS-IV eBOSS program: or , leaving us with 979 sources in the parent target list. Of these sources, 849 received fibers during the tiling process. Figure 3 shows the -band magnitude distribution of the sample of the SDSS counterparts to X-ray sources within the SDSS-IV eBOSS Stripe 82X survey footprint, highlighting the sources with pre-existing SDSS spectroscopy that were public at the time of the observations and those targeted by the eBOSS survey.
2.2. Mid-Infrared
The starting point for the mid-infrared selection of AGN was the ALLWISE data release catalog (hereafter WISE), which combines data from the WISE cryogenic and NEOWISE missions (Mainzer, et al., 2011) as well as the post-cryogenic survey phases. Since the circular SDSS spectroscopic plates have a diameter of 3*∘*, six plates were needed to cover the width of the XMM-Newton AO13 Stripe 82X strip (see Figure 2). The SDSS plates cover a greater area than the XMM-Newton AO13 footprint (36.8 deg2), and the exact tiling strategy was only finalized after the parent target lists were generated. Hence, the WISE target list was chosen to cover the general area of the SDSS plates, with the exact targets chosen in the tiling process.
To create this master list, we selected WISE sources with right ascensions between 13 RA 29*∘* and declinations between -1.265 Dec 1.265*∘*, which corresponds to the approximate width of Stripe 82 where deep coadded optical photometry is available. We further excluded potentially spurious WISE sources as well as sources with MIR photometry and/or positions affected by image artifacts by requiring that the contamination and confusion flag (cc_flags) of the WISE catalog equals zero in all four WISE spectral bands.
These selections yield a total of 543,584 WISE sources. These are matched to optical counterparts using the Stripe 82 co-added catalogs presented by Jiang et al. (2014), using the MLE methodology as implemented in Brusa, et al. (2007). The maximum radius within which potential counterparts are search for is set to 2*′′*. This limit is motivated by the sub-arcsec positional accuracies of both the WISE and Jiang et al. (2014) catalogs. A likelihood ratio cut of is adopted for the WISE optical counterparts, which yields identifications for 82% of the WISE sample (i.e., 447,514 sources) with an expected spurious fraction of %.
Figure 4 presents the - magnitude distribution of the WISE optical counterparts; 39,559 SDSS counterparts were not detected in the -band and are thus not included in this plot. Also shown in this figure is the distribution for 6110 WISE AGN candidates with -band detections and WISE colors redder than the 75% reliability color-cut defined by Assef et al. (2013), as shown in Figure 5; an additional 706 WISE AGN are not shown since they lack -band detections. These sources have a bi-modal -band magnitude distribution. The optically-faint peak of the distribution in Figure 4 may include a large fraction of obscured AGN (e.g. DiPompeo et al., 2014), where the optical range of the Spectral Energy Distribution is dominated by host galaxy rather than AGN light.
Targets for follow-up spectroscopy were selected to lie within the 75% reliability WISE color-wedge defined by (Assef et al., 2013, ; see Figure 5) and have optical counterparts with magnitudes brighter than , or mag, in the Jiang et al. (2014) co-added catalog, leaving 4786 sources. These optical limits are a trade-off between depth, to explore the nature of the optically-faint WISE AGN candidates (e.g. Figure 4), and sufficient signal-to-noise of the resulting SDSS spectra to measure reliable redshifts, at least in the case of emission line galaxies and/or AGN (Menzel et al., 2016; Raichoor, et al., 2017; Delubac, et al., 2017). Spectroscopy is available for 2374 of the WISE AGN from previous SDSS programs. These sources were not targeted as WISE-selected AGN in the eBOSS survey unless they qualified for repeat observations to explore QSO optical spectral variability (see Section 2.3). The remaining 2412 sources were potential spectroscopic targets as WISE AGN candidates; 1518 received fibers in the tiling process. The optical magnitude distribution of these sources is shown in Figure 6.
2.3. Additional Targets
Additional sources were added to the target list to make use of all available spectroscopic fibers during the tiling process (see Table 1 for a summary). These “filler” targets included:
- •
quasar candidates from the photometric redshift catalogs of:
- –
Richards et al. (2015), using SDSS and WISE photometry (“S82X_RICHARDS15_PHOTOQSO_TARGET”),
- –
Peters et al. (2015), using optical photometry and variability in Stripe 82 (“S82X_PETERS15_COLORVAR_TARGET”);
- •
quasar candidates from LSST (AlSayyad et al., 2015, “S82X_LSSTZ4_TARGET”);
- •
changing-look AGN candidates, where the optical spectra may show disappearing or emerging broad Balmer lines between spectroscopic epochs (e.g., Denney et al., 2014; Shappee et al., 2014; LaMassa et al., 2015; Ruan et al., 2016; Runnoe et al., 2016; Gezari et al., 2017; Yang et al., 2018), using the photometric variability cuts employed in MacLeod et al. (2016), with or without an additional cut on the timing of the previous spectral epoch (“S82X_CLAGN1_TARGET” or “S82X_CLAGN2_TARGET”, respectively);
- •
WISE AGN candidates from WISE forced photometry at the positions of known SDSS sources (Lang et al., 2014) that were otherwise not already in the WISE target list (“S82X_UNWISE_TARGET”);
- •
photometric variability selected quasar candidates from Palanque-Delabrouille et al. (2016, “S82X_SACLAY_VAR”);
- •
quasar candidates selected on the basis of their SDSS and Spitzer colors, using a boosted decision tree algorithm (“S82X_SACLAY_BDT”);
- •
high redshift quasar candidates identified by defining drop-out regions in optical color and optical - WISE color parameter space (“S82X_SACLAY_HIZ”; see Richards et al., 2002).
The SDSS counterparts to the X-ray sources and the WISE AGN candidates are listed as “S82X_XMM_TARGET” and “S82X_WISE_TARGET”, respectively, in Table 1 and in the SDSS database. We focus on these targets exclusively when commenting on the results of the eBOSS program, and note that the spectra for the ancillary targets were made public in SDSS Data Release (DR) 14 (Abolfathi et al., 2018), with specific samples to be discussed in future papers (e.g., MacLeod et al., in prep.).
2.4. Tiling
The objective of the tiling process is to achieve a distribution of sources across a plate that maximizes the number of observed targets with a minimum number of plates (Dawson et al., 2016). As the X-ray and WISE target density was fairly uniform across the region, we chose to tile six plates with fixed centers (see Figure 2). These plates are identified with plate identification numbers ranging from 8788-8793. Target selection algorithms resulted in an average number of 1304 targets per plate. Five percent of these target were eliminated either due to a possible knock out with an allocated high priority fiber or due to their high brightness.
While tiling the fibers across the plates, we opted to treat each plate independently so that there are repeat spectra of high-priority targets in the overlap regions. However, there are many targets that are relatively bright (), in which case the S/N in a nominal observation ( 2 hrs) would be sufficient (”S82X_BRIGHT_TARGET”). Hence, we adopted a tiered-priority system for assigning fibers to the targets. The advantage of this system is that we could free up some fibers for additional targets by removing the bright objects from the overlap regions as each plate is successively tiled. For each plate, we carried out three rounds of tiling and in each round we assigned fibers to targets depending on the priority of the targets. Targets corresponding to “S82X_XMM_TARGET”, “S82X_WISE_TARGET”, “S82X_LSSTZ4_TARGET”, “S82X_CLAGN1_TARGET”, and “S82X_CLAGN2_TARGET” were included in the highest priority list. The next priority list includes targets corresponding to “S82X_SACLAY_VAR_TARGET”, “S82X_SACLAY_BDT_TARGET”, “S82X_RICHARDS15_PHOTOQSO_TARGET”, and “S82X_PETERS15_COLORVAR_TARGET”. The final priority list contains targets corresponding to “S82X_BRIGHT_TARGET”, “S82X_SACLAY_HIZ_TARGET”, and “S82X_UNWISE_TARGET”. Table 1 lists the number of available targets and the number of tiled targets for the different target classes among the six plates. For each round, if all the higher priority targets were assigned fibers, the remaining fibers were allocated to the targets in the next priority. Three hundred fifty-three targets have additional spectra owing to the overlap of the plates.
More specifically, and relevant to this catalog release, a total of 849 X-ray sources and 1518 WISE AGN candidates received spectroscopic fibers in the tiling process: 744 sources were X-ray only, 1413 sources were WISE only, and 105 sources were both X-ray and WISE targets, for a total of 2262 unique SDSS sources receiving fibers. Optically faint X-ray and WISE AGN candidates in overlapping regions between the neighboring plates were observed for twice the nominal exposure time, for 95 X-ray sources and 92 WISE sources.
3. Observations
The six plates were observed to twice the depth as that of typical eBOSS observations from previous SDSS data releases (Dawson et al., 2016). A plate is exposed for 15 minutes per exposure, with the number of exposures repeated until the square of the signal-to-noise, (S/N)2, per pixel in all four cameras (two red and blue cameras for spectrograph one and spectrograph two) passed a pre-determined (S/N)2 threshold. Standard eBOSS plates had a (S/N)2 threshold of 10 and 22 in the blue and red cameras, respectively, for an object with = 22 and = 21, respectively (Dawson et al., 2016); here the magnitudes are measured through the SDSS spectroscopic fibers.
As the Stripe 82X targets are relatively fainter compared to previous eBOSS targets, the Stripe 82X plates were exposed to a higher (S/N)2 threshold of 20 and 44 for the red and blue cameras, respectively. While it required 19 exposures at 15 minutes an exposure for two plates (8790 and 8791) due to bad observing conditions, the remaining four plates had 8-12 exposures of 15 minutes apiece. All the observed data were run through the full SDSS pipeline, IDLSPEC2D v5_10_0. IDLSPEC2D extracts the spectrum corresponding to each exposure and combines the individual spectra to give a combined high SN spectrum for each target. While combining the individual spectra, the SDSS pipeline excludes those exposures which have (S/N)2 less than 20% of the (S/N)2 of the best exposure. The pipeline rejected fiver exposures for plate 8791, but none for any of the remaining five plates.
3.1. Pipeline Processing
Both the WISE and X-ray selected targets of this eBOSS survey include a large fraction of optically faint sources (e.g. Figure 6), close to the spectroscopic limit of 2-m class telescopes. Visual inspection was therefore deemed necessary to control the quality of the redshift measurements and optical spectral classifications for individual sources.
The visual inspection of the WISE spectra proceeded in two stages. First a total of 5 human classifiers inspected the spectra observed on a single plate of the survey (plate number 8792, observed on Modified Julian Date, MJD, 57364). The classification included the determination of the source redshift, an assessment of the redshift-measurement reliability/quality and the assignment of a rough spectral class. The starting point of the visual inspection were the products of the SDSS spectral reduction pipeline version 5.10.0 (Bolton, et al., 2012). These include among others a best-fit spectral template and the corresponding redshift for each source as well as a warning flag (zwarning) raised in the case of bad, uncertain or more generically problematic redshift fits. The classifiers were presented with the best-fit pipeline products and had to decide whether they agreed or not, modify the redshift if they deemed necessary, assign a redshift quality flag (z_conf) and a spectral class (class_person). The possible values of the latter flags and their meaning are presented Table 2. The visual inspection process enforced agreement of all classifiers on the redshift, quality and class of a given source. Discrepancies were discussed and settled in a reconciliation round, which result to a final list of redshifts for the sources targeted on plate number 8792 (Modified Julian Date 57364).
Based on these results, 2 of the classifiers (AG, SL) visually inspected the remaining WISE-selected AGN candidates (AG) and X-ray sources (SL) targeted by this eBOSS program; a third classifier (VM) reviewed uncertain redshifts for the X-ray sources and all three resolved any discrepant classifications via additional visual inspection and discussion. In the analysis that follows we use all redshifts with z_conf, i.e. spectra with at least a single identified feature.
4. Results
Of the 2262 SDSS sources targeted, we verified or independently determined redshifts and classifications for 1769 objects (78% success rate), with 1602 sources where z_conf = 3 and 167 sources where z_conf = 2. Of these sources, 591 are QSOs, 1129 are galaxies, and 49 are stars. We expect that the results from this eBOSS pilot program will inform observing strategies and efficient data quality control checks for future SDSS surveys and those from other ground-based observatories.
We show an example spectrum of each of these sources in Figure 7 to highlight the variety of objects detected by the eBOSS program; for reference, we include identifying information for these sources (MJD of observation, plate number, and fiber identification number) in the caption.
4.1. Identification Success Rate
We explore the success rate of the pipeline as a function of optical magnitude in Figure 8, where we show the -band magnitude distribution for all targets (solid black histogram) and the subset with reliable redshifts (red hatched histogram; here we use the co-added optical photometry from Jiang et al. (2014) for all sources). The top panel of Figure 8 shows the fraction of sources identified as a function of their magnitude, with a horizontal line at 50% completeness shown for reference.
We can identify more than half of the sample at . Even at the faintest magnitude limits (i.e., ), we are able to obtain reliable redshifts and classifications for above 37% of the sample, which is a significant fraction.
This success rate suggests that future SDSS programs can relax the nominal limiting magnitude constraint (e.g., in the eBOSS quasar survey; Myers et al., 2015) for deeper observations and targets expected to have emission lines, akin to the Stripe 82X eBOSS survey. Our results indicate that surveys from observatories that have larger aperture mirrors, like the 4-m Dark Energy Survey, will also be successful in obtaining spectroscopic redshifts for sources to faintness levels of under similar observing conditions.
4.2. Pipeline vs. Visual Inspection: Clues from Pipeline Flags
In addition to the 493 sources where we were unable to determine a reliable redshift, we find spectroscopic redshifts that are different from the pipeline value for 73 sources (see Figure 9). Furthermore, for 54 sources where the pipeline redshift agrees with that from visual inspection, we found different spectroscopic classifications: either the pipeline failed to identify a weak broad emission line apparent by eye and labeled a source a “Galaxy” instead of a “QSO”, or vice versa.
In total, we find 1642 sources (73% of targets) whose pipeline produced spectroscopic redshifts and classifications were deemed reliable via visual inspection. When considering the subset of 167 sources with lower confidence on the visually inspected redshift (i.e., z_conf = 2), we find that only 18 objects have discrepant redshifts from the pipeline value.
A non-null value of the SDSS zwarning flag indicates potential problems with the pipeline fit to the SDSS spectrum. In 595 cases, the zwarning flag was set: 414 of the 493 sources where we were unable to determine a redshift had a non-null zwarning value. About 30% of the sources flagged by the zwarning field did have spectra of sufficient quality to determine a redshift and classification. In 61 out of the 127 cases where we found a different redshift or spectroscopic classification than the pipeline, the zwarning flag was also non-null.
Is there a way to immediately identify the remaining 145 sources where the pipeline redshift or classification was found to be unreliable via visual inspection, but the zwarning flag did not indicate a potential error? We look at the S/N of the spectrum for clues. In Figure 10, we plot the S/N for sources where the zwarning flag was null for the following subsets: visual inspection confirmed the pipeline determined redshift and classification, we were able to determine a redshift from visual inspection that differed from that calculated by the pipeline, and we were unable to measure a redshift from the spectrum. As expected, the sources where we were unable to determine a redshift have the lowest S/N spectrum, while the sources where visual inspection revealed a different redshift from the pipeline have a range of S/N values.
Our results indicate that in the absence of the automated zwarning flag raising an alarm that the spectral fit may be problematic, the S/N can be used as a proxy. Seventy-eight of the 79 sources with spectra that were unidentifiable but had the zwarning flag set to null have S/N values below 2.25. About 60% of the sources (39 out of 66) where visual inspection revealed a different redshift than the pipeline are also below this S/N limit. This S/N cut could potentially be used to automatically reject any spectral classifications below this threshold. However 509 sources whose pipeline redshifts were deemed reliable via visual inspection (i.e., 29% of identified sources) would be discarded with such an automatic cut.
To balance the competing demands of maximizing sample size with reliable spectral classifications and limited resources, we suggest that visual inspection of any source where zwarning is non-null or S/N 2.25 would be prudent. Though most of the spectra will be unclassifiable when the zwarning flag is set, about 30% of the sources should be recoverable with visual inspection. About 20% of sources that are not flagged as potentially problematic by the zwarning output and have S/N below 2.25 are either unclassifiable or have different redshifts and/or classifications than the pipeline. Conversely, sources whose spectra are not flagged by zwarning and have S/N 2.25 have largely reliable pipeline measurements: only 27 out of 1040 sources (3%) that meet these criteria have different redshifts/classification from the pipeline.
4.3. Creating the Spectroscopic Sample
As mentioned earlier, revised SDSS counterparts to the Stripe 82 X-ray sources (Ananna et al., 2017) and AGN color selection criteria (Assef et al., 2018) were published after the eBOSS Stripe 82X observations. To ensure where are using the most up-to-date information, with the most reliable counterparts and current MIR AGN definition, we only retain X-ray and WISE AGN targets that are marked as X-ray counterparts in the catalog of Ananna et al. (2017) or WISE AGN candidates that obey the Assef et al. (2018) color selection at the 75% level. Our catalog is further vetted to only include eBOSS sources for which we were able to verify or independently determine a redshift (z_conf 2).
To create a complete spectroscopic catalog of X-ray sources and WISE AGN within this portion of the Stripe 82X survey, we include spectroscopic redshifts of SDSS counterparts to X-ray sources and WISE AGN from:
- •
Ancillary eBOSS Stripe 82X targets that are X-ray and WISE AGN counterparts based on these updated definitions (23 sources, for 1723 sources total from the SDSS-IV eBOSS Stripe 82X program);
- •
Sources whose spectra became available in SDSS DR14 but were not targeted as part of the SDSS-IV eBOSS Stripe 82X survey (1670 sources; Abolfathi et al., 2018; Pâris et al., 2018);
- •
Previous SDSS data releases whose zwarning flag is null (Albareti et al., 2017; Pâris et al., 2017; Alam et al., 2015; Aihara et al., 2011; Abazajian et al., 2009; Ross et al., 2012) or whose spectra were independently vetted in a previous release of the Stripe 82X catalog (1407 sources; LaMassa et al., 2017);
- •
2SLAQ (29 sources; Croom et al., 2009);
- •
6dF (2 sources; Jones et al., 2004, 2009);
- •
Dedicated follow-up observing programs led by the members of the Stripe 82X collaboration (16 sources).
In total, our spectroscopic sample consists of 4847 sources, out of a parent sample of 10702 X-ray and WISE AGN candidates that lie within the SDSS-IV eBOSS Stripe 82X survey footprint. In the spectroscopic sample, we have 1891 X-ray sources, 3657 WISE sources, and 701 sources that are both.
Before discussing the completeness of the relative samples, we note that a subset of sources that lie along the North/South border of the SDSS scans within Stripe 82 lack photometry in the Jiang et al. (2014) catalog (see their Figure 1). While creation of the eBOSS target list for the WISE AGN candidates was based on photometry from the Jiang et al. (2014) catalog, we supplement this information with SDSS single-epoch photometry for both the spectroscopic sample and the parent sample. The sources with photometry from the SDSS single-epoch imaging is a small percentage of the total, amounting to 3.8% of the spectroscopic sample and 5.2% of the parent sample, respectively.
With the caveat in mind that we are using photometry from two different catalogs, we estimate the spectroscopic completeness of our samples based on the -band magnitude. We highlight that 12.5% of sources in the parent sample do not have photometric measurements in the -band. Based on inspecting the magnitude distributions of these sources at other optical wavebands, we see that the -band drop-outs are likely undetected as they are fainter than the -band limit of the survey. We only consider the spectroscopic completeness for the subset of sources that are detected in the -band, noting that this value is an upper limit for the full sample, but reasonable to the -band depth of the Jiang et al. (2014) catalog ().
In Figure 11, we show the number of X-ray sources and WISE AGN with spectroscopic redshifts compared with their parent samples as a function of -band magnitude. We immediately see that the relatively low spectroscopic completeness of 45% for the combined sample is due to the bi-modal distribution in the -band magnitudes for the WISE sources, where there is an optically faint population that peaks at . When considering the samples separately, we find that the X-ray sample is 74% complete while the WISE sample is 41% complete. Considering the -band limit of the eBOSS Stripe 82X survey (), the spectroscopic completeness rises to 72% for the full sample, and 82% and 71% for the X-ray and WISE samples, respectively. At , the combined sample is 82% complete, with the X-ray sample being 88% complete and the WISE sample being 82% complete.
4.4. Description of Multi-Wavelength Information in Catalog
In the catalog, we list the redshifts and optical spectroscopic classifications from the various surveys. The source of the spectroscopic redshift is noted in the column “z_src” (see Table LABEL:cat_cols). If the redshift is from the SDSS-IV eBOSS Stripe 82X survey, the confidence on the vetted redshift is reported in “z_conf”, as described in Table 2, otherwise it is set to a null value. The “opt_src” column indicates whether the optical photometry is from the Jiang et al. (2014) catalog or the SDSS pipeline. If the former, the magnitudes represent the “AUTO” magnitude from SExtractor (i.e., Kron-like elliptical aperture). If the source is not detected in the Jiang et al. (2014) catalog but has photometric measurements in the single-epoch SDSS catalog, then the optical magnitudes are the ModelMags from the SDSS pipeline, which for extended sources represent the better of an exponential profile fit or a de Vaucouleurs profile fit, while a PSF model is used for point sources. The WISE magnitudes measured from profile-fitting photometry are are also reported, if the source is detected by WISE. We include the WISE photometry for every X-ray source detected by WISE, regardless of whether the source has AGN colors.
For the X-ray sources, we report the flux in the soft (0.5 - 2 keV), hard (2 - 10 keV for XMM-Newton; 2 - 8 keV for Chandra), and full (0.5 - 10 keV for XMM-Newton; 0.5 - 8 keV for Chandra) bands, as well as the significance of the detection in the corresponding “soft_detml,” “hard_detml,” and “full_detml” columns (LaMassa et al., 2016a), where = -ln, with as the Poissonian probability that the detection is a random fluctuation. For the energy bands where (i.e., , 4 detection significance), we calculated the -corrected X-ray luminosity111, where is the powerlaw slope of the X-ray spectrum. For the Stripe 82X survey, we assumed =1.7 for the hard and full bands and =2.0 for the soft band (see LaMassa et al., 2013b, 2016a). for extragalactic sources. We emphasize that the reported X-ray sensitivity of the Stripe 82X survey is calculated for a higher significance value, namely for (5.1) for the XMM-Newton observations and 4.5 for the archival Chandra observations.
From the X-ray fluxes, we calculated a hard-band X-ray luminosity () which we use to classify whether a source is an X-ray AGN ( erg s*-1* Brandt & Hasinger, 2005; Brandt & Alexander, 2015). If the hard band X-ray flux is measured at , then we use this luminosity as . Otherwise, if the full band detection is significant at the level, we scale the full band -corrected luminosity by 0.665 to convert from the 0.5 - 10 keV band to the 2 - 10 keV band and estimate . If both the hard and full band detections are not significant at this level, then the soft band flux is scaled by a factor of 1.27 to convert from the 0.5 - 2 keV band to the 2 - 10 keV band for an estimate of .
In the catalog, we include the colors for sources detected by WISE. We also note whether the source would be classified as an AGN at the 90% (“WISE_AGN_90”) or 75% (“WISE_AGN_75”) reliability level based on the criteria in Assef et al. (2018):
[TABLE]
where (,,) = (0.650, 0.153, 13.86) for the 90% reliability selection and (,,) = (0.486, 0.092, 13.07) for the 75% reliability selection. When commenting on demographics below, we consider any source that obeys the 75% reliability selection as a WISE AGN.
Finally, we include a column that indicates the reddening of the source by calculating the optical to mid-infrared color (LaMassa et al., 2016b). We first convert the -band magnitude in AB to in Bessel using:
[TABLE]
(Blanton et al., 2017), then to Vega with:
[TABLE]
As demonstrated in LaMassa et al. (2016b), obscured AGN between tend to have colors, which is a redshift regime where the traditional BPT diagnostic becomes untenable for observed-frame optical spectra.
We perform BPT analysis on the low redshift sources () that are spectroscopically classified as “Galaxies” but have X-ray luminosities or colors consistent with AGN and relevant emission line fluxes with a S/N 5 (see below). Thus, we also report the ratios of [NII] 6584/H and [OIII] 5007/H and the BPT classifications in the published catalog, where applicable.
All catalog columns are summarized in Table LABEL:cat_cols.
5. Discussion
We report on the demographics of the AGN in the spectroscopic sample, dividing AGN based on their optical spectroscopic classifications:
- •
“Type 1 AGN” have at least one broad emission line in their SDSS spectra (i.e., labeled as “QSO”s in the SDSS pipeline and Table 2);
- •
“optically obscured AGN” have no broad lines (i.e., labeled as “Galaxy” in Table 2), but are AGN on the basis of their X-ray luminosity or WISE colors.
We note that four objects from archival spectroscopic databases do not report optical classifications, so we do not include these sources when discussing Type 1 versus optically obscured AGN. All four sources have extragalactic redshifts, one is an X-ray AGN, and one is a WISE AGN. In the Appendix, we discuss how the demographics of the Stripe 82 X-ray AGN compare with the AGN from the XMM-XXL Northern survey (Pierre et al., 2016; Liu et al., 2016; Menzel et al., 2016).
5.1. Demographics of X-ray and WISE AGN
Of the 4847 sources in our spectroscopic sample, 4782 are extragalactic and 65 are stars (46 X-ray emitting stars and 19 stars with WISE colors that meet the AGN 75% reliability threshold). Considering the extragalactic sample, we find 1790 X-ray AGN (i.e., erg s*-1*), 3638 WISE AGN, and 698 X-ray and WISE AGN. Fifty-five sources are X-ray galaxies (i.e., erg s*-1*), but three of these are classified as AGN based on their WISE colors.
In Table 5.1, we summarize the X-ray and WISE AGN classifications for the spectroscopic sample within the SDSS-IV eBOSS Stripe 82X field. Of the 4730 AGN in the survey area, 70% are Type 1 and 30% are optically obscured. As our sample is over 80% complete to , these demographics may be representative of the X-ray and MIR-selected AGN population up to the optical, X-ray, and MIR flux limits of these surveys, but as we discuss further below, the total number of AGN, and number of optically obscured AGN, may be biased by a significant fraction of star-forming galaxy interlopers with WISE AGN colors at . When considering the WISE and AGN samples separately, we do fine a higher percentage of optically obscured WISE AGN (30%) than X-ray AGN (20%).
For reference, we include a demographic summary of the AGN classified from the SDSS-IV eBOSS Stripe 82X survey in Table 5.1, highlighting that an overwhelming fraction of the optically obscured AGN in the field (76%) were garnered from this dedicated follow-up program. This results underscores the importance of spending resources to follow-up X-ray and MIR-selected AGN candidates for a complete census of obscured black hole growth.
22footnotetext: X-ray sources where erg s*-1* and are thus classifiable as AGN based on their powerful X-ray emission. We list the number of X-ray detected stars (and stars with WISE colors consistent with AGN) for reference. In addition to the sources listed here, there are 55 X-ray galaxies (i.e., X-ray sources with erg s*-1*), 3 of which are classified as AGN based on their WISE colors; 6 of these X-ray galaxies are from the eBOSS survey.
The AGN span a redshift range of , with a median redshift of , as shown in Figure 12. In the redshift distribution for the optically obscured WISE AGN, a prominent peak is visible at . For both the X-ray and WISE AGN, the Type 1 sub-populations are visible to a higher redshift than the optically obscured AGN.
5.1.1 BPT Analysis of Local Obscured AGN
We perform BPT analysis for the subset of sources optically spectroscopically identified as “Galaxies” at that have a signal-to-noise ratio of at least 5 in the H, H, [OIII] 5007 Å, and [NII] 6584 Å lines. Here, we use the Kewley et al. (2001) maximal starburst line to define Seyfert 2 galaxies, and the empirical Kauffmann et al. (2003) demarcation to separate star-forming galaxies from composite galaxies, which have a mixture of star-forming and AGN ionization powering their emission.
For the X-ray AGN (left panel of Figure 13), we see that 18% of the sources (14 out of 76) would be misclassified as non-AGN on the basis of their optical emission alone. However, based on their X-ray luminosities, these galaxies do host active central black holes. Similar results, i.e., X-ray AGN hosted in BPT-classified star-forming galaxies have been observed in other X-ray samples (so-called “optically elusive AGN”; Maiolino et al., 2003; Caccianiga et al., 2007; Menzel et al., 2016; Pons & Watson, 2014; Smith et al., 2014).
A much higher percentage (50%) of WISE AGN at are classified as star-forming galaxies (right panel of Figure 13). The nature of these objects is less clear than for the X-ray AGN. Combined with the redshift peak of WISE AGN at , these results may point to a degeneracy in WISE AGN color selection, where star-forming galaxies at these redshifts can have mid-infrared colors mimicking AGN (see Satyapal et al., 2018). If we restrict the WISE AGN to those defined at the 90% reliability level of (Assef et al., 2018), we see a similar trend: a peak in the AGN distribution at remains (Figure 14, left), and the fraction of WISE AGN in the star-forming locus of the BPT diagram is similar (44%, Figure 14, right). Distinguishing between optically buried AGN and star-forming galaxy impostors masquerading as MIR AGN at would require further theoretical modeling (Satyapal et al., 2018), which will be the topic of a future paper.
5.2. Comparison between X-ray and WISE AGN
Here we explore the characteristics of AGN found, and missed, by X-ray and MIR selection. We reiterate that the area of the SDSS plates in the eBOSS program is larger than the field of view of the XMM-Newton AO13 observations in Stripe 82 (Figure 2). Thus, for the most straightforward comparison between the demographics of the X-ray and WISE AGN, we cull the WISE list to only include those sources detected within the 15.6 deg2 footprint of the XMM-Newton AO13 Stripe 82 survey area; we also remove the archival X-ray sources from the eBOSS program that do not overlap the AO13 survey area. Table 5.2 provides a demographic summary of the X-ray and WISE sources used in this analysis, amounting to 2751 AGN total.
We immediately see from Table 5.2 that the space density is comparable between the WISE AGN (108/deg2) and the X-ray AGN (114/deg2). Only 23% of the X-ray or WISE AGN in this sample are classified as AGN on the basis of optical broad lines, X-ray luminosity, and MIR colors (639 out of 2751). Of the 804 obscured AGN, only 6% are identified as accreting black holes on the basis of both X-ray emission and red MIR colors.
In Figures 15 and 16, we explore the populations detected and missed by defining AGN based on X-ray luminosity and MIR color, highlighting the complementarity of multiple selection criteria to offer a comprehensive view of black hole growth.
The 1775 X-ray AGN are shown in Figure 15, where we highlight the subset of sources also identified as AGN on the basis of their colors (691; 39%), those AGN detected by WISE but with bluer colors than the Assef et al. (2018) 75% reliability color cut (698; 39%), and those undetected by WISE (386; 22%). Similar to trends previously reported in other samples (e.g., Eckart et al., 2010; Mendez et al., 2013; Menzel et al., 2016; LaMassa et al., 2016b), the X-ray AGN detected by WISE that do not meet the color criterion tend to be at low to moderate X-ray luminosities (i.e., 64% have erg s*-1*). This percentage is consistent with the 50-70% of X-ray AGN not identified as such by their colors found by Georgakakis et al. (2017), albeit with a more conservative color cut () than what we use here. It is reasonable to assume that in these cases, the AGN is not dominating the MIR emission, which is a population to which the color selection is not tuned.
However, we also find that though MIR-selected AGN are found at the highest X-ray luminosities and redshifts, the X-ray sources undetected by WISE populate the same parameter space. About a third of the highest luminosity ( erg s*-1*), highest redshift () X-ray AGN are undetected by WISE, indicating that MIR selection can miss a non-negligible fraction of the most luminous black hole growth. Many of these sources may be “hot dust poor quasars” described in Hao et al. (2010, 2011) and Lyu et al. (2017). This population was shown to have anomalously weak rest-frame NIR emission between 1-3m compared to other Type 1 AGN, which can be explained by a low dust covering factor. Indeed, the rest-frame and passbands at probe rest-frame NIR emission, suggesting this interpretation has some merit. However, fitting the broad-band SEDs of these sources to derive NIR and optical slopes are required to test whether they fit the definition of hot dust poor quasars, which will be explored in a follow-up paper.
We perform the corollary analysis in Figure 16, where we investigate the color as a function of redshift for the 691 WISE and X-ray AGN and the 973 WISE AGN not detected in X-rays (only 3 sources classified as WISE AGN are X-ray galaxies), representing 42% and 58% of the WISE AGN, respectively. Though it seems plausible that the WISE AGN undetected by X-rays suffer from high levels of extinction, we do not observe that these sources have redder colors compared with the X-ray detected AGN.
6. Conclusions
We reported on the results of an SDSS-IV eBOSS spectroscopic survey that covered 36.8 deg2 of Stripe 82 in the fall of 2015. About half of this survey area (15.6 deg2) overlaps the largest, contiguous region of the Stripe 82 X-ray survey, observed by XMM-Newton in AO13 (PI: Urry; LaMassa et al., 2016a). The primary targets of this survey were X-ray sources and WISE AGN candidates from the ALLWISE survey (Mainzer, et al., 2011) identified on the basis of their colors (i.e., the 75% reliabibility threshold of Assef et al., 2013). SDSS counterparts to the X-ray and WISE sources were identified using the statistical maximum likelihood approach, as described in (LaMassa et al., 2016a) for the X-ray sources and in the main text for the WISE population. Additional “filler” targets were observed to make use of all available spectroscopic fibers across the SDSS plates. Subsequent to the SDSS-IV eBOSS observing program, an updated multi-wavelength matched catalog to the Stripe 82X survey was published by Ananna et al. (2017), and the color criteria for AGN were modified with respect to the eBOSS target list we created (Assef et al., 2018), leading us to curate the sources in our final published catalog with respect to the objects we targeted.
In total, 2262 SDSS counterparts to the original X-ray and WISE AGN candidate target lists were spectroscopically observed. We visually inspected all spectra, finding that 1769 sources (78%) were of sufficient quality to determine redshifts and classifications, where we achieved a 37% identification rate at the faintest magnitudes (; Figure 8). We recommend visual inspection of spectra flagged by zwarning or having S/N 2.25 to maximize sample size and reliability of results; only 3% of sources not flagged by zwarning and with S/N 2.25 were found to have discrepant redshifts and/or classifications between visual inspection and the pipeline. If limited resources preclude visual inspection of spectra, then imposing a S/N threshold exceeding 2.25 and a null zwarning flag would result in a reliable sample, but at the expense of discarding 30% of spectra that would otherwise be of sufficient quality for analyzing source demographics.
After vetting the SDSS spectroscopic results and curating the target lists to only include X-ray/SDSS counterparts from Ananna et al. (2017) and WISE AGN meeting the Assef et al. (2018) color criteria at the 75% level, we combined this sample with X-ray and WISE AGN in the survey area with spectroscopic redshifts from other SDSS programs (Abazajian et al., 2009; Aihara et al., 2011; Alam et al., 2015; Albareti et al., 2017; Abolfathi et al., 2018; Pâris et al., 2017, 2018), 2SLAQ (Croom et al., 2009), 6dF (Jones et al., 2004, 2009), and dedicated follow-up programs of Stripe 82 X-ray sources (LaMassa et al., 2016a, 2017). The total sample is 82% complete to , with the X-ray and WISE AGN samples being 88% and 82% complete at this magnitude limit (Figure 11).
Our spectroscopic sample consists of 4847 sources, of which 4730 are AGN (1790 X-ray AGN, 3638 WISE AGN, 698 X-ray and WISE AGN): 3310 are Type 1 AGN (70%) and 1418 are optically obscured AGN (30%; Table 5.1); two AGN did not have spectroscopic classifications in the archival catalogs we queried. A vast majority of the optically obscured AGN (76%) were identified via the eBOSS Stripe 82X survey. The AGN range in redshift from , with a median redshift of (Figure 12). BPT analysis of the AGN with high S/N emission lines show that 50% of the WISE AGN occupy the star-forming locus (Figure 13): whether these sources are optically buried AGN or star-forming galaxies whose MIR colors mimic those of AGN requires further analysis (e.g. Satyapal et al., 2018).
In the 15.6 deg2 area of the XMM-Newton AO13 Stripe 82 footprint, we compared the AGN populations from X-ray and MIR-selection (Table 5.2), finding the following trends among the 2751 AGN in this area-restricted sample:
- •
only 6% of the optically obscured AGN (52 out of 804) are both X-ray and WISE AGN, highlighting the importance of both X-ray and MIR selection to recover AGN missed by optical surveys;
- •
61% of X-ray AGN (1084 out of 1775) are not MIR AGN (Figure 15):
- –
39% are detected by WISE but have colors too blue for the Assef et al. (2018) 75% reliability color definition. These sources are generally at lower luminosity, where the AGN is not contributing signficantly to the MIR SED (see also, e.g., Eckart et al., 2010; Mendez et al., 2013; Menzel et al., 2016; LaMassa et al., 2016b).
- –
22% are undetected by WISE. These sources are generally X-ray luminous (i.e., erg s*-1*), challenging the conventional wisdom that MIR color selection identifies all luminous AGN: these sources may have anomalous dust properties, similar to “hot dust poor” or “hot dust deficient” quasars (Hao et al., 2010, 2011; Lyu et al., 2017).
- •
58% of WISE AGN (973 out of 1664) are not detected in X-rays (Figure 16), but there is no clear color difference between X-ray AGN and non-detections, indicating that the WISE AGN undetected in X-rays are not redder and hence may not preferentially be more obscured.
We thank the referee for a careful reading of the manuscript and for providing insightful comments that helped us streamline the paper. Funding for the Sloan Digital Sky Survey IV has been provided by the Alfred P. Sloan Foundation, the U.S. Department of Energy Office of Science, and the Participating Institutions. SDSS-IV acknowledges support and resources from the Center for High-Performance Computing at the University of Utah. The SDSS web site is www.sdss.org. SDSS-IV is managed by the Astrophysical Research Consortium for the Participating Institutions of the SDSS Collaboration including the Brazilian Participation Group, the Carnegie Institution for Science, Carnegie Mellon University, the Chilean Participation Group, the French Participation Group, Harvard-Smithsonian Center for Astrophysics, Instituto de Astrofísica de Canarias, The Johns Hopkins University, Kavli Institute for the Physics and Mathematics of the Universe (IPMU) / University of Tokyo, Lawrence Berkeley National Laboratory, Leibniz Institut für Astrophysik Potsdam (AIP), Max-Planck-Institut für Astronomie (MPIA Heidelberg), Max-Planck-Institut für Astrophysik (MPA Garching), Max-Planck-Institut für Extraterrestrische Physik (MPE), National Astronomical Observatories of China, New Mexico State University, New York University, University of Notre Dame, Observatário Nacional / MCTI, The Ohio State University, Pennsylvania State University, Shanghai Astronomical Observatory, United Kingdom Participation Group, Universidad Nacional Autónoma de México, University of Arizona, University of Colorado Boulder, University of Oxford, University of Portsmouth, University of Utah, University of Virginia, University of Washington, University of Wisconsin, Vanderbilt University, and Yale University. This research made use of Astropy, a community-developed core Python package for Astronomy (The Astropy Collaboration et al., 2018). Some of the data presented herein were obtained at the W. M. Keck Observatory, which is operated as a scientific partnership among the California Institute of Technology, the University of California and the National Aeronautics and Space Administration. The Observatory was made possible by the generous financial support of the W. M. Keck Foundation. The authors wish to recognize and acknowledge the very significant cultural role and reverence that the summit of Maunakea has always had within the indigenous Hawaiian community. We are most fortunate to have the opportunity to conduct observations from this mountain. SML acknowledges funding support from 17-ADAP17-0055. Sloan, XMM, CXO, Hale, WIYN, Keck:I (LRIS), Gemini:Gillet
Appendix A Comparison between Stripe 82X AGN and XMM-XXL-N AGN
We compare the X-ray AGN identified in this program with those observed in a similar SDSS BOSS program to target X-ray AGN from the 18 deg2 XMM-XXL northern field (Menzel et al., 2016). With a flux limit of erg s*-1* cm*-2* at 50% of the survey area, it is slightly more sensitive than the XMM-Newton AO13 component of the Stripe 82X survey ( erg s*-1* cm*-2* at half the survey area). Out of 8445 X-ray point sources in the XMM-XXL-N field (Pierre et al., 2016; Liu et al., 2016), 3004 were spectroscopically followed up by BOSS, garnering reliable redshifts and spectroscopic classifications for 2514 extragalactic sources (including two blazars) and 85 stars. We a priori remove the 57 sources with “not classifiable” BOSS spectra from the Menzel et al. (2016) catalog in our comparison below, since though their redshifts are securely determined via visual inspection, the low S/N of the spectra precludes optical spectroscopic classification.
We follow our categorization scheme above when classifying the sources in Menzel et al. (2016), where the optical spectroscopic classification of “Type 1 AGN” refer to objects that have at least one broad emission line and “Optically Obscured AGN” indicate sources with narrow emission lines only or absorption lines, regardless of their BPT designation. We consider these objects X-ray AGN if their estimated -corrected 2 - 10 keV luminosity () exceeds 1042 erg s*-1*, where we follow a similar prescription to that of the Stripe 82X sources to calculate if the source is not detected in hard band. Here, we use to calculate -corrected luminosities since this was the spectral slope assumed by Liu et al. (2016) when converting from counts to fluxes. Based on this spectral slope, we use a correction factor of 0.74 and 2.88 to convert the luminosity from the 0.5 - 10 keV and 0.5 - 2 keV bands, respectively, to the 2 - 10 keV band.
In XMM-XXL-N, we find 1787 Type 1 AGN and 654 optically obscured AGN. The detection threshold for the XMM-XXL-N sources in Liu et al. (2016) is lower than that used in Stripe 82X, with a detection significance set to for XMM-XXL-N, compared with for Stripe 82X. Due to the lower significance threshold of XMM-XXL-N and the deeper observations, the number density of spectroscopically confirmed X-ray AGN in the 18 deg2 XMM-XXL-N (136 deg*-2*) is higher than that of the 15.6 deg2 Stripe 82X XMM-AO13 field (114 deg2).
We find a smaller fraction of optically obscured X-ray AGN between Stripe 82X (20%) compared with XMM-XXL-N (27%). However, despite the higher number density of AGN in XMM-XXL-N, the number of high-redshift ( for Type 1 AGN; for optically obscured AGN) and high-luminosity ( erg s*-1* for Type 1 AGN; erg s*-1* for optically obscured AGN) are similar, as demonstrated in Figure 17. Hence, wide area at moderate depths ( erg s*-1* cm*-2*) is more important than deeper coverage in unveiling AGN at the highest luminosities and redshifts.
The reference list from the paper itself. Each links out to its DOI / PubMed record.
- 1Abazajian et al. (2009) Abazajian, K. N., Adelman-Mc Carthy, J. K., Agüeros, M. A., et al. 2009, Ap JS, 182, 543
- 2Abolfathi et al. (2018) Abolfathi, B., Aguado, D. S., Aguilar, G., et al. 2018, Ap JS, 235, 42
- 3Aihara et al. (2011) Aihara, H., Allende Prieto, C., An, D., et al. 2011, Ap JS, 193, 29
- 4Alam et al. (2015) Alam, S., Albareti, F. D., Allende Prieto, C., et al. 2015, Ap JS, 219, 12
- 5Albareti et al. (2017) Albareti, F. D., Allende Prieto, C., Almeida, A., et al. 2017, Ap JS, 233, 25
- 6Alexander et al. (2003) Alexander, D. M., Bauer, F. E., Brandt, W. N., et al. 2003, AJ, 126, 539
- 7Al Sayyad et al. (2015) Al Sayyad, Y., Mc Greer, I. D., Fan, X., et al. 2015, American Astronomical Society Meeting Abstracts #225, 225, 144.46
- 8Ananna et al. (2017) Ananna, T. T., Salvato, M., La Massa, S., et al. 2017, Ap J, 850, 66