From kpcs to the central parsec of NGC 1097: feeding star formation and a black hole at the same time
M. Almudena Prieto (1, 2), Juan A. Fernandez-Ontiveros (1, 2),, Gustavo Bruzual (3), Andreas Burkert (4, 5), Marc Schartmann (4, 5) and, Stephan Charlot (6) ((1) Instituto de Astrof\'isica de Canarias (IAC), ( 2 ), Universidad de La Laguna

TL;DR
This study uses high-resolution multi-wavelength imaging to analyze the star-forming ring and gas inflow in NGC 1097, revealing episodic star formation, dust-gas streamers feeding the nucleus, and the complex interplay between gas availability and star formation activity.
Contribution
It provides a detailed, multi-scale view of the gas inflow and star formation history in NGC 1097's central kpc, highlighting the role of dust filaments and episodic bursts.
Findings
Identified four major starburst episodes in the last 100 Myr.
Mapped narrow dust filaments feeding the ring and nucleus.
Found gas availability alone does not explain star formation rates.
Abstract
A panchromatic view of the star forming ring and feeding process in the central kpc of the galaxy NGC 1097 is presented. The assembled IR to UV images at 10 pc resolution allow us to characterise the population of circa 250 clusters in the ring and disentangle the network of filaments of dust and gas that enshroud and feed them. The ring is a place of intermittent star bursts over the last 100 Myr. Four major episodes covering a proto-cluster phase of eleven mid-IR sources at the molecular clouds core, and two (three) previous bursts with a time separation of 20 - 30 Myr are identified. The extinction map of the inner few kpc resolves NGC1097's two major dust lanes in bundles of narrow, 25 pc width, filaments running along the galaxy's bar. As they approach the ring, some circularise along it, others curve to the centre to produce a nuclear spiral. We believe these are…
Click any figure to enlarge with its caption.
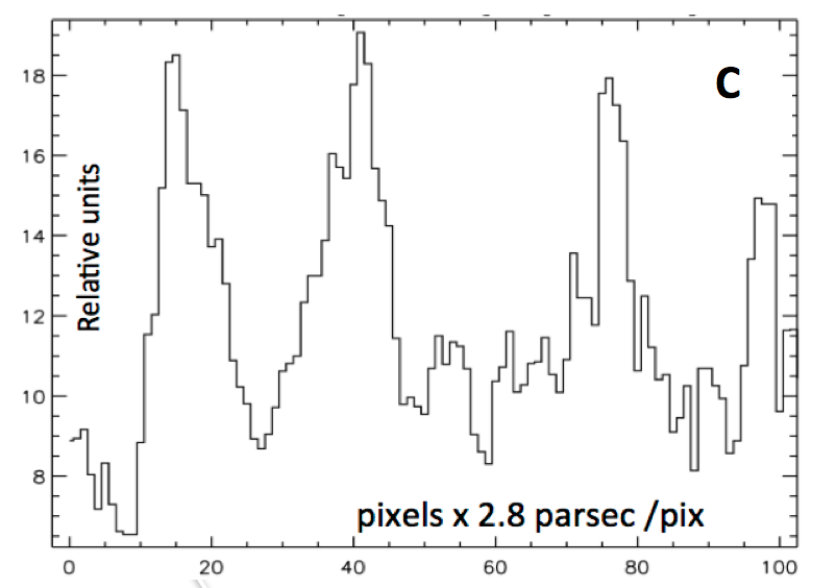 Figure 1
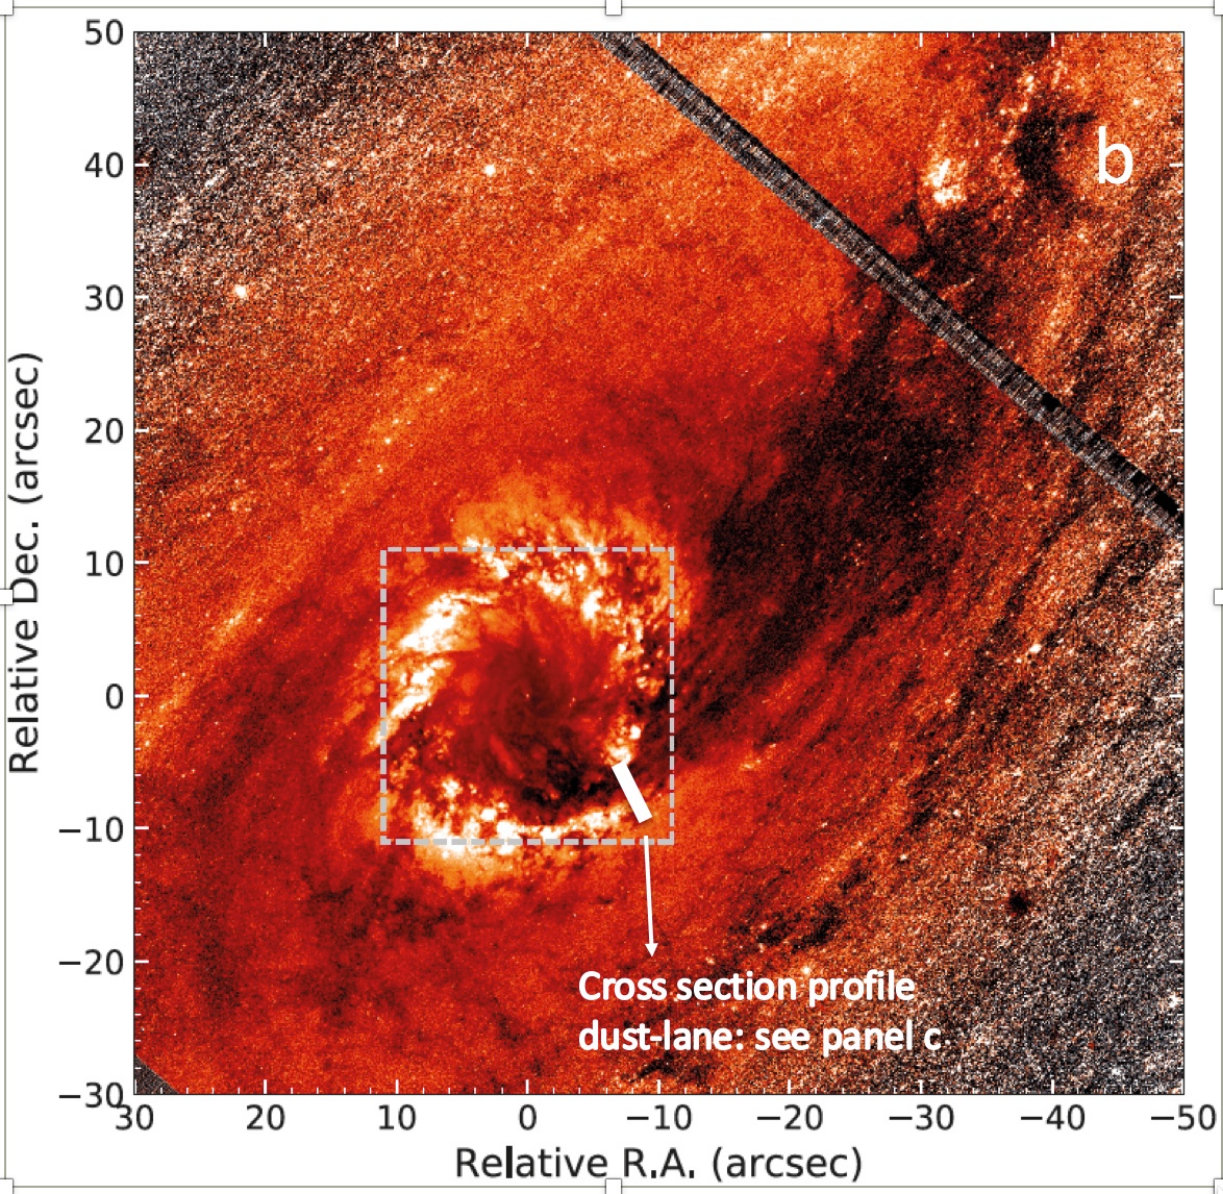 Figure 3
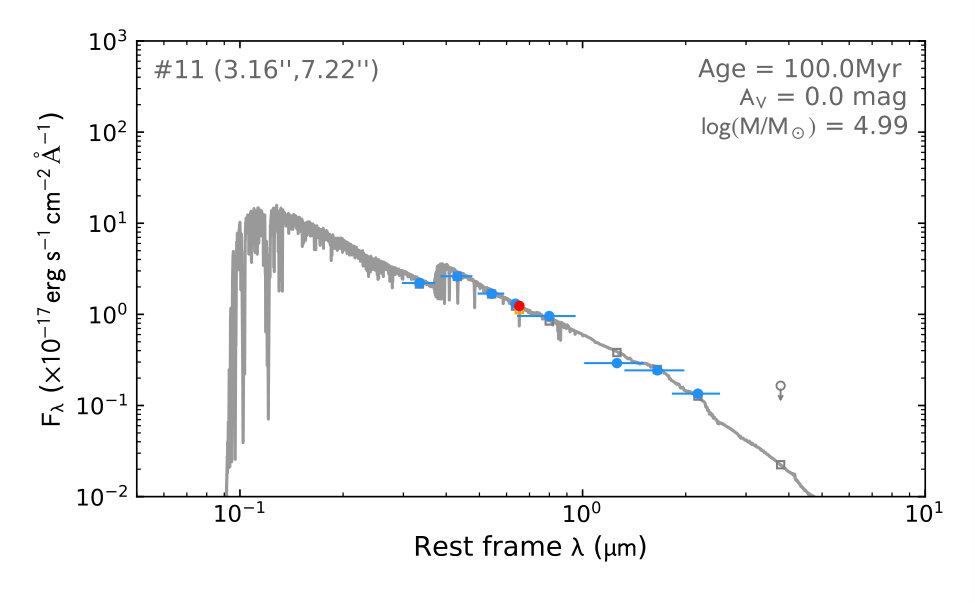 Figure 3
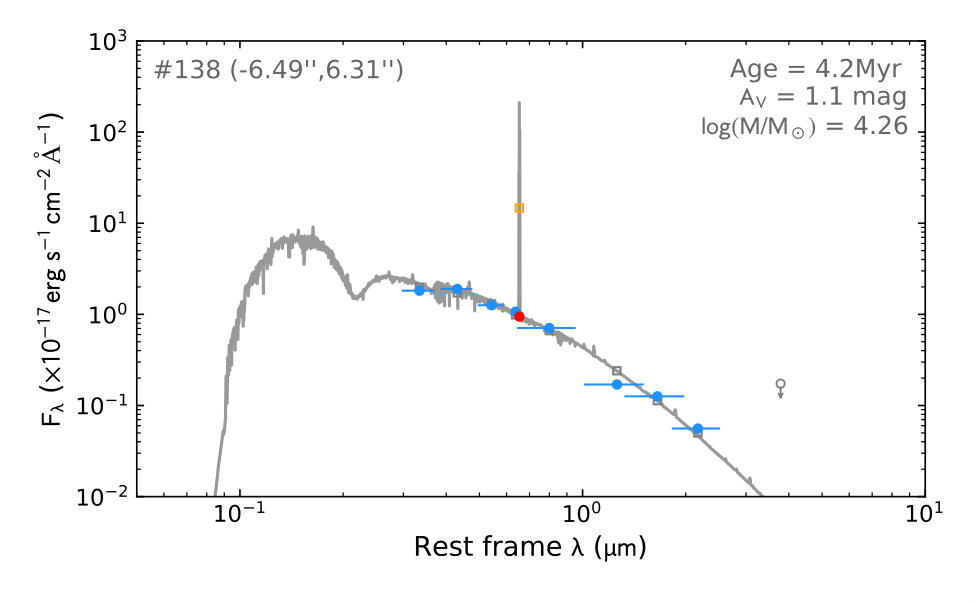 Figure 4
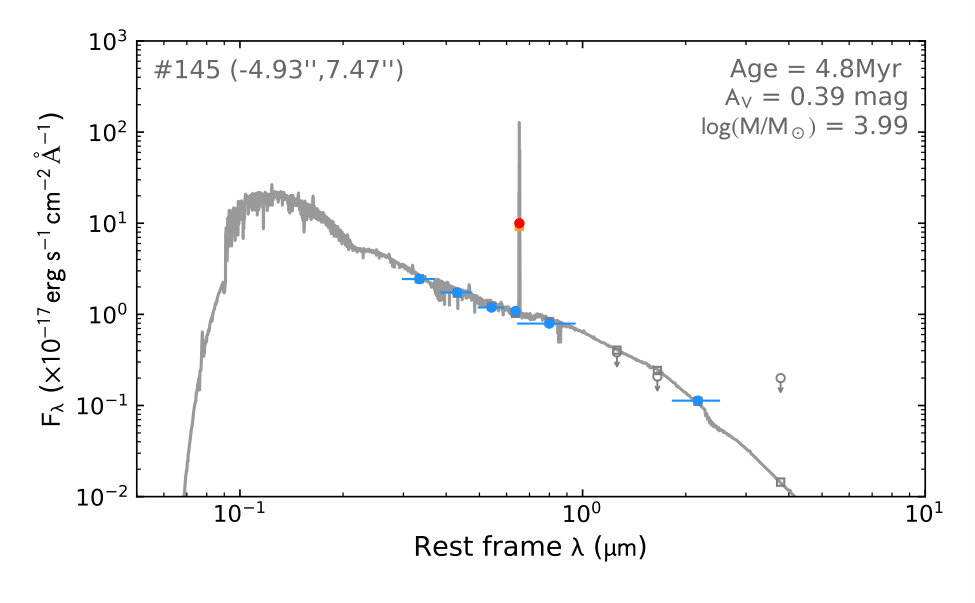 Figure 5
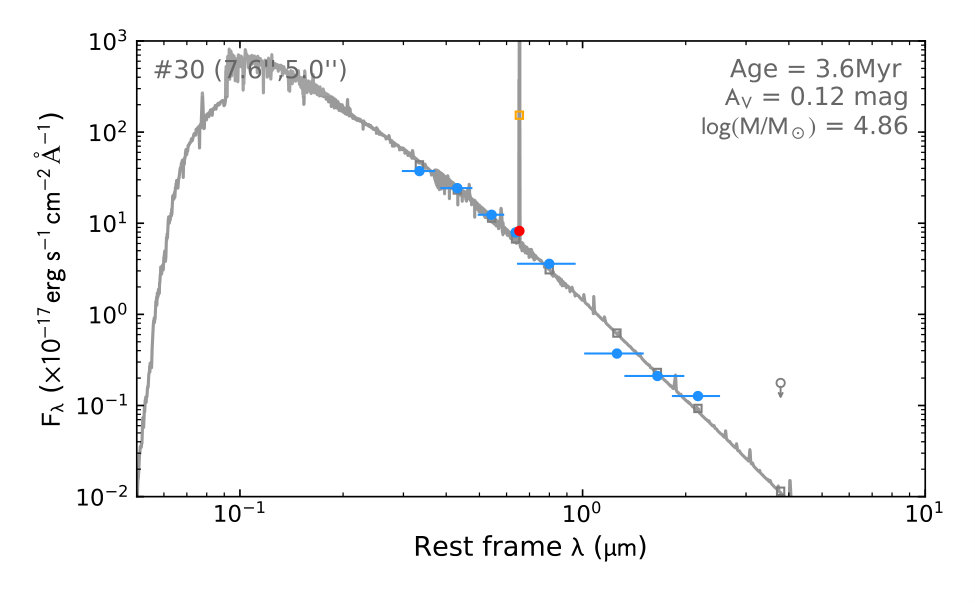 Figure 6
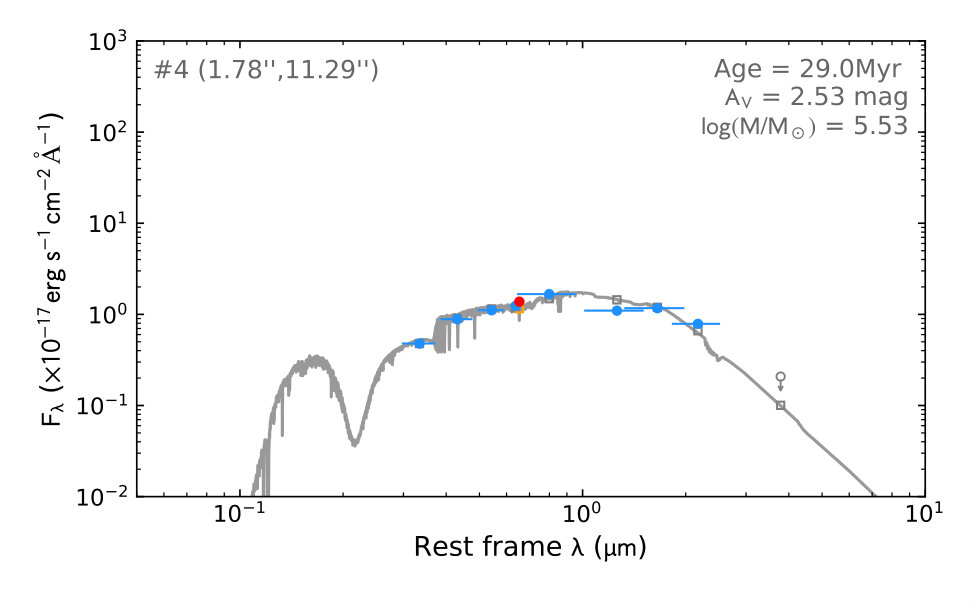 Figure 7
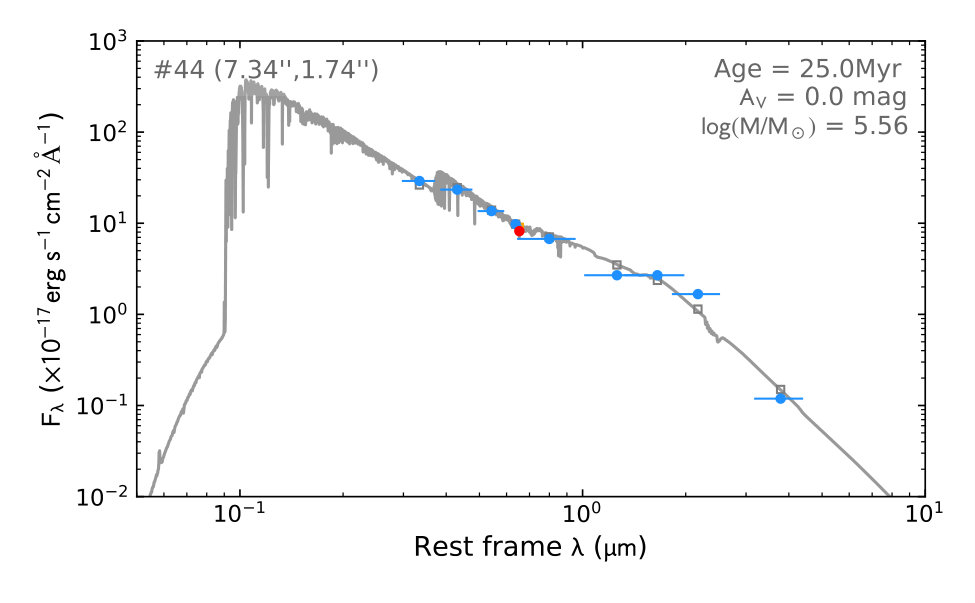 Figure 8
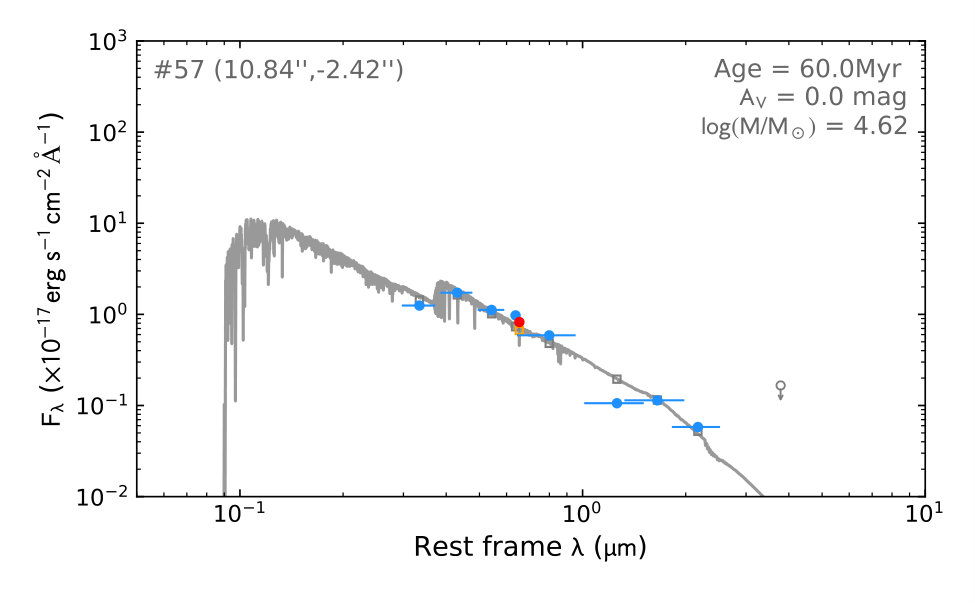 Figure 9
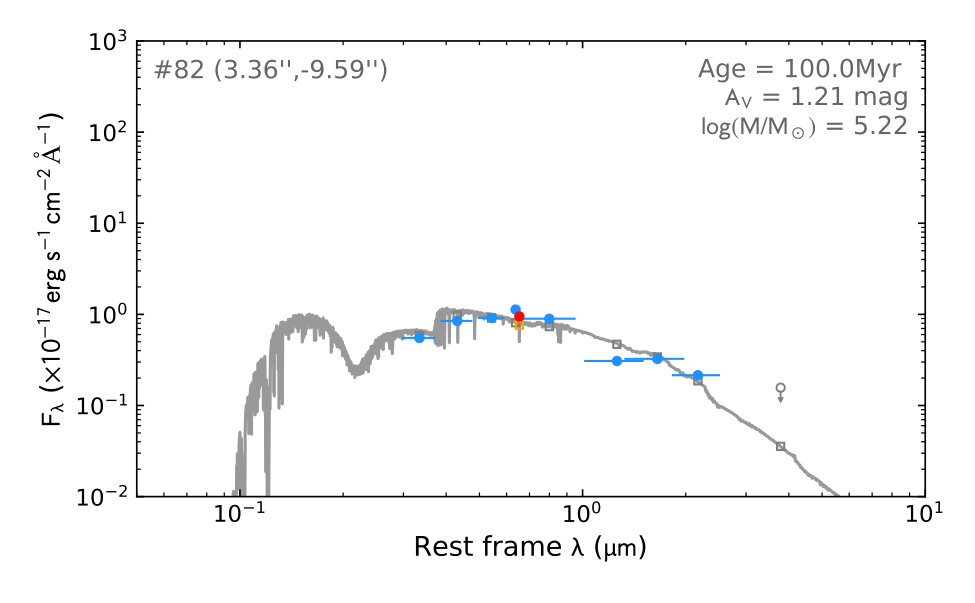 Figure 10
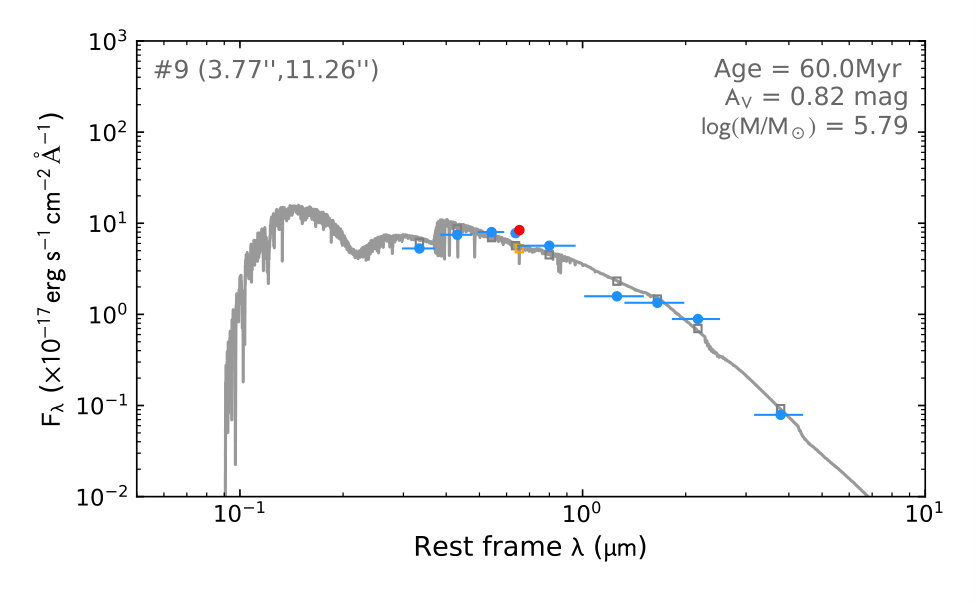 Figure 11
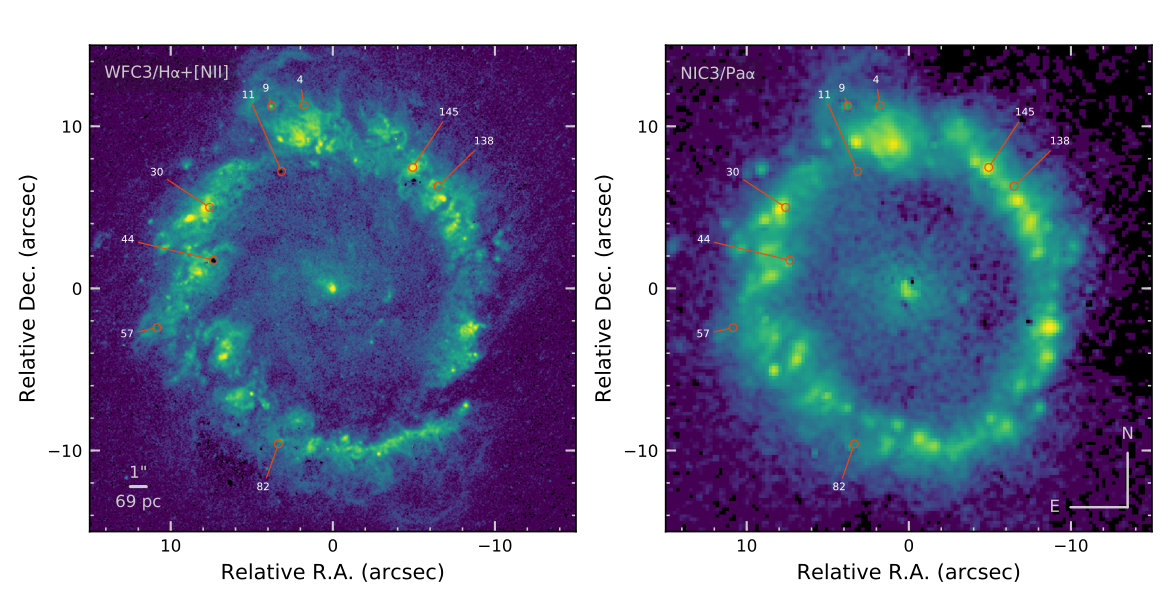 Figure 12
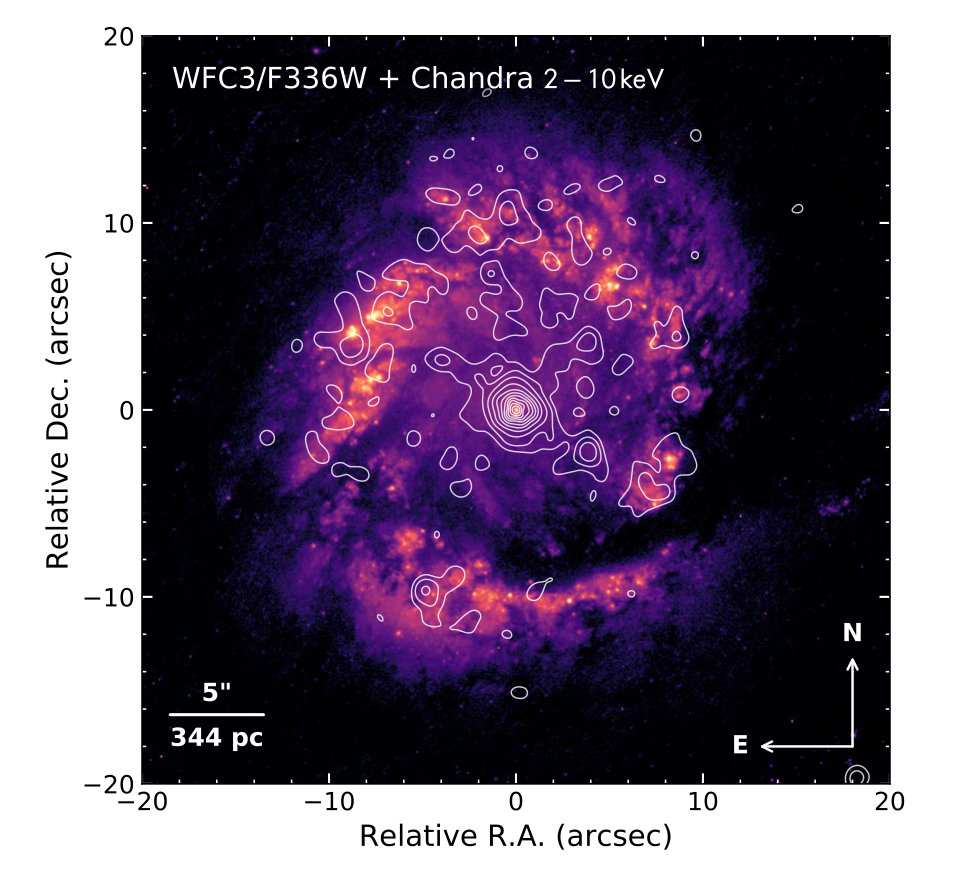 Figure 13
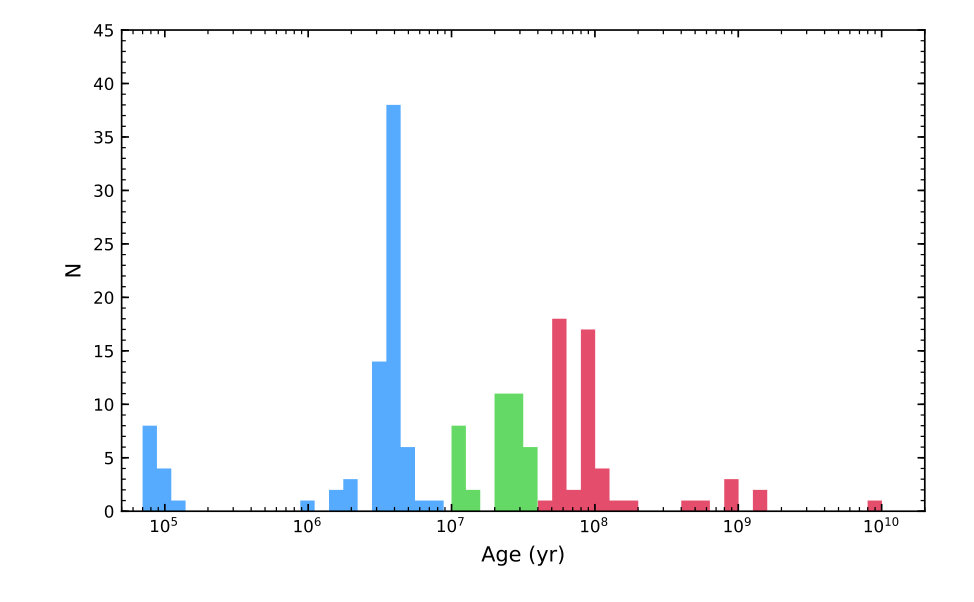 Figure 14
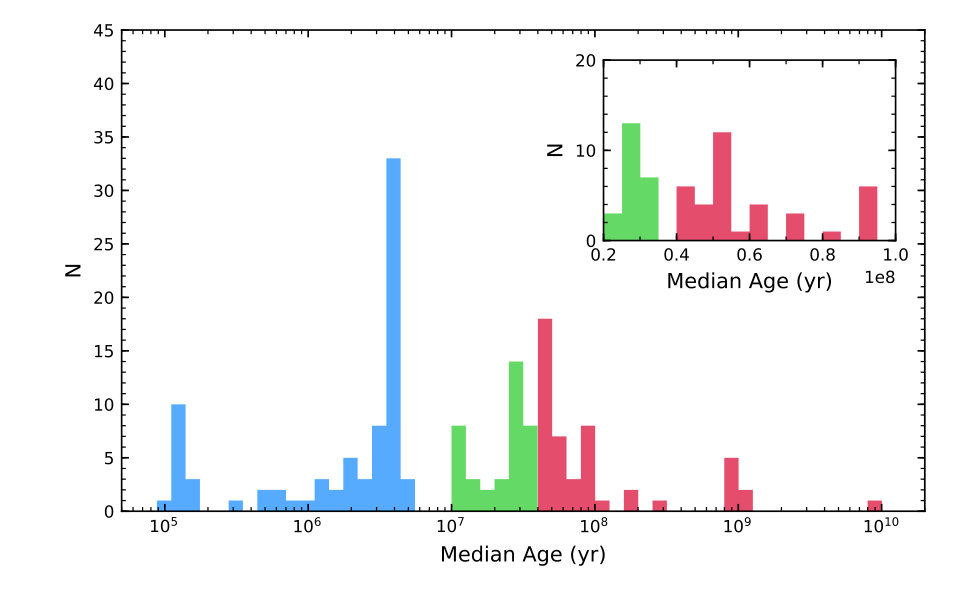 Figure 15
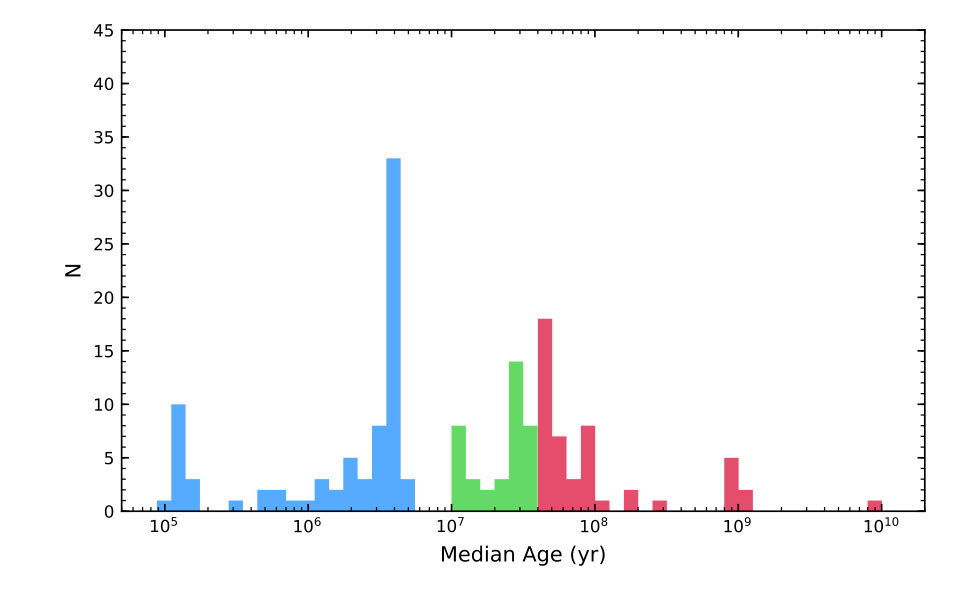 Figure 16
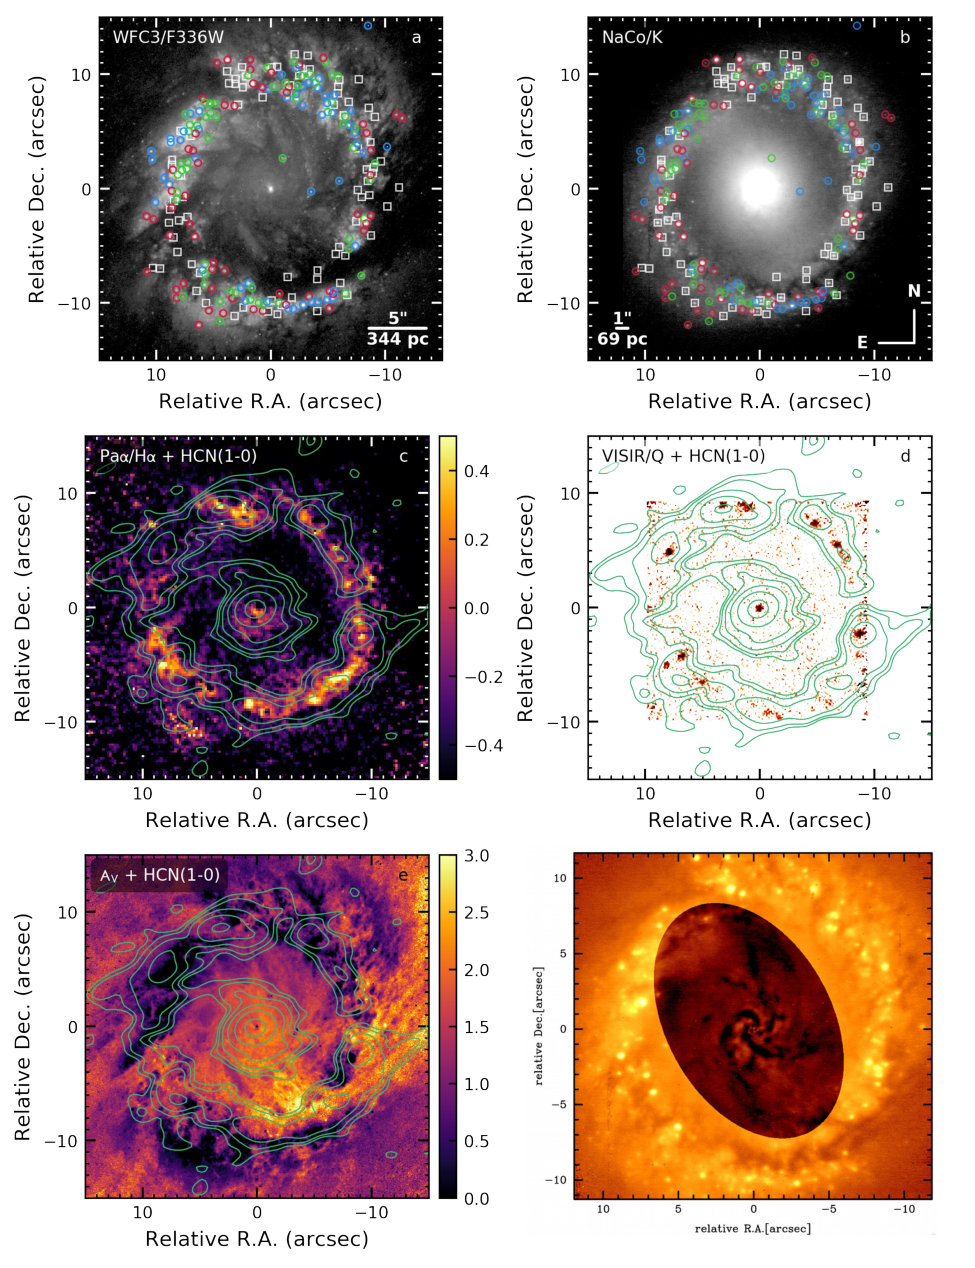 Figure 1
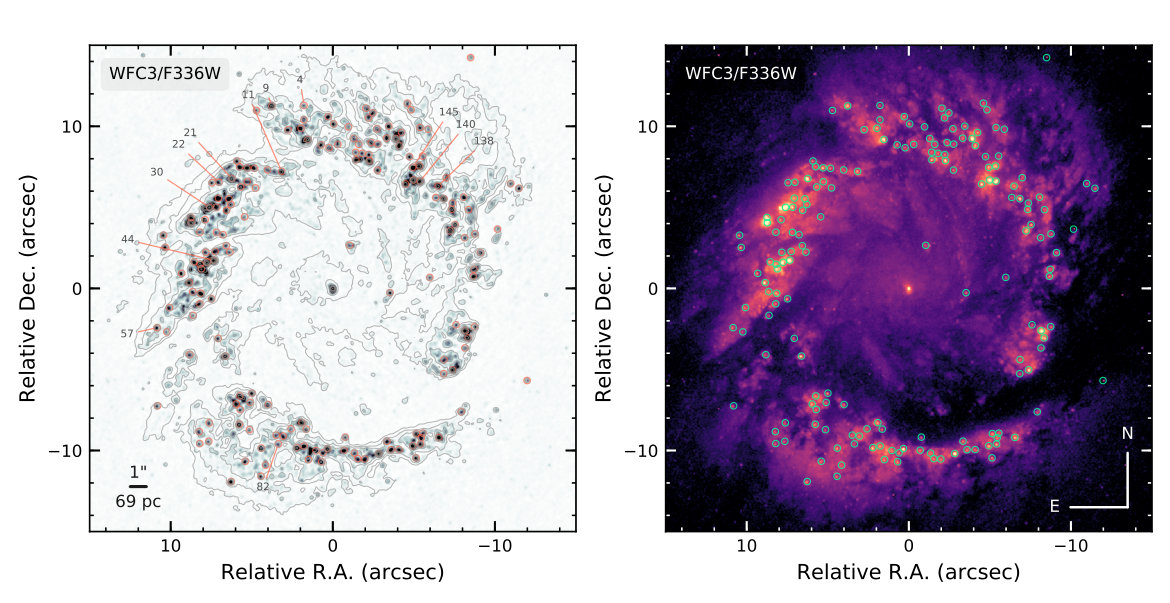 Figure 18
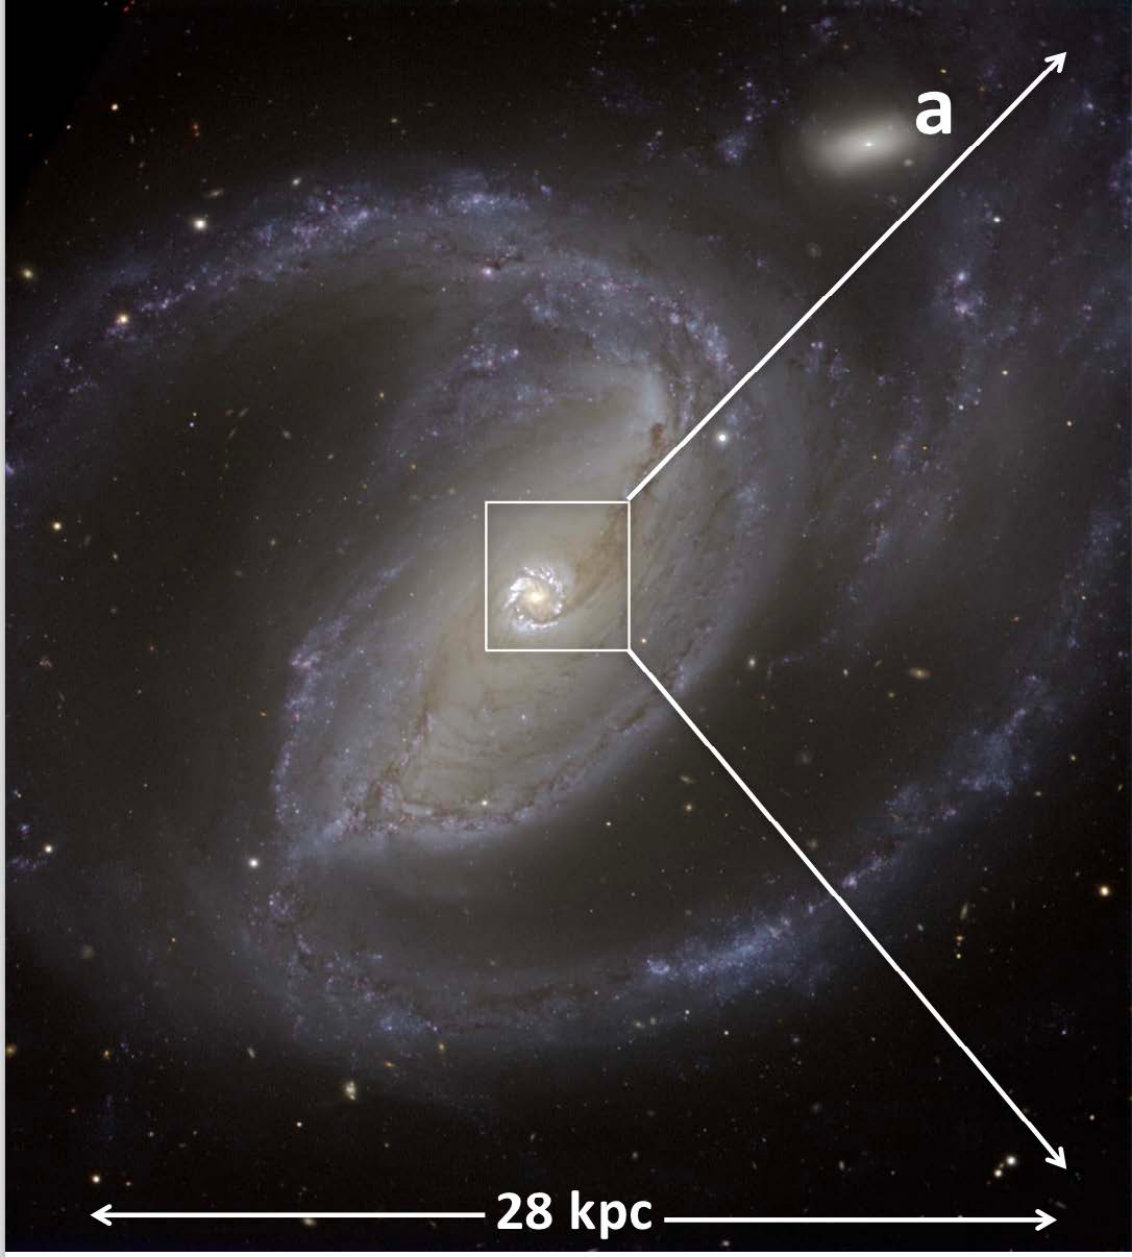 Figure 19
Peer Reviews
No public reviews on file for this paper yet. If you reviewed it on a platform where reviews are public (OpenReview, ICLR, NeurIPS, ICML), you can paste yours below so the community can read it here.
Videos
No videos yet. Explain this paper in a talk, walkthrough, or lecture? Add one.
From kpcs to the central parsec of NGC 1097: feeding star formation and a black hole at the same time††thanks: Based on observations from VLT 60.A-9026A, 77.B-0728A, HST13413, ALMA 2011.0.00108.5
M. Almudena Prieto1,2, Juan A. Fernández-Ontiveros1,2, Gustavo Bruzual3,Andreas Burkert4,5, Marc Schartmann4,5, Stephan Charlot6
1Instituto de Astrofísica de Canarias (IAC), E–38200 La Laguna, Tenerife, Spain.
2Universidad de La Laguna, Dept. Astrofísica, E–38206 La Laguna, Tenerife, Spain
3Instituto de Radioastronomía y Astrofísica, UNAM, C.P. 58089 Morelia, México
4Universitäts-Sternwarte München, Scheinerstr. 1, D-81679 München, Germany
5Max-Planck-Institut für extraterrestrische Physik, Postfach 1312, Giessenbachstr., D–85741 Garching, Germany
6Sorbonne Universités, UPMC-CNRS, UMR7095, Institut d’Astrophysique de Paris, F-75014 Paris, France Email: [email protected]
Abstract
A panchromatic view of the star forming ring and feeding process in the central kpc of the galaxy NGC 1097 is presented. The assembled IR to UV images at 10 pc resolution allow us to characterise the population of circa 250 clusters in the ring and disentangle the network of filaments of dust and gas that enshroud and feed them. The ring is a place of intermittent star bursts over the last 100 Myr. Four major episodes covering a proto-cluster phase of eleven mid-IR sources at the molecular clouds core, and two (three) previous bursts with a time separation of 20 - 30 Myr are identified. The extinction map of the inner few kpc resolves NGC1097’s two major dust lanes in bundles of narrow, 25 pc width, filaments running along the galaxy’s bar. As they approach the ring, some circularise along it, others curve to the centre to produce a nuclear spiral. We believe these are kpc-scale dust-gas streamers feeding the ring and the black-hole. The total mass in clusters formed in the ring in the last 100 Myr is , i.e. of the of molecular gas in the ring; yet, at its current star formation rate, , an order of magnitude more in stellar mass should have been produced over that period. This means that the availability of gas in the ring is not the sole star formation driver, perhaps the rate at which dense gas accumulates in the ring is key.
keywords:
Galaxies: individual: NGC 1097 – galaxies: nuclei – galaxies: starformation – galaxies: ISM
††pagerange: From kpcs to the central parsec of NGC 1097: feeding star formation and a black hole at the same time††thanks: Based on observations from VLT 60.A-9026A, 77.B-0728A, HST13413, ALMA 2011.0.00108.5–LABEL:lastpage††pubyear: 2018
1 Introduction
Feeding and feedback in galaxies affects two major phenomena in their centre: the growth of super massive black holes (BH) and their activity cycles, and the on-set of new star formation. The supplying material to sustain those processes, the mechanism by which material falls into the centre are standing issues. The environment of galaxies whether in clusters or in the field, and their history via mergers and interactions, are phenomena that will naturally lead to the rain of fresh material into the centre providing a substantial reservoir for new star formation and BH feeding (e.g. Silk & Rees 1998; Gebhardt et al. 2000; Springel et al. 2005; Fabian 2012)
High angular resolution observations particularly at frequencies not subjected to dust extinction are providing detailed insight on the feeding process in the centre of galaxies at scales of few parsec, which mainly occurs via narrow dust / gas streamers (e.g. Mueller-Sanchez et al. 2009, Mezcua et al. 2015, Imanishi et al. 2016 for NGC 1068; Espada et al. 2017 for Cen A; Mezcua et al. 2016 for Circinus; Storchi-Bergmann et al. 2010 for NGC 4151; Malkan et al.1998, Prieto et al. 2014, for samples of the nearest Seyfert galaxies), via nuclear spirals (e.g. Prieto et al. 2005, Davies et al. 2009, Fathi et al. 2013 for NGC 1097; Combes et al. 2014 for NGC 1566; Combes et al. 2018), via G2-like clouds (Gillessen et al. 2012 at the Galactic Center). On galactic scales, bars, mergers are among the most efficient mechanisms to drive material to the central kpc where it often ends up in a circumnuclear star forming ring. The latter is supported by observations of barred galaxies which often present large molecular gas concentrations and ensued star formation (e.g. Matsuda & Nelson 1977; Sakamoto et al. 1999). Still, the comprehensive view of the complete feeding process from the source of the feeding material to where and how ultimately it is deposited relies mostly on theoretical predictions and simulations (e.g. Shlosman et al. 1990; Friedli & Benz 1993; Springel et al. 2005; Li et al. 2015 and references therein).
This work relies on multiwavelength - UV to mm- high angular resolution data to illustrate the feeding process and star formation history of the very bright and highly populated circumnuclear star forming ring in the barred galaxy NGC 1097. The stellar ring in this galaxy is a reference because of the large number of clusters, in the few hundreds, it contains and their high brightness. Yet, the galaxy is sufficiently close to individually resolve the clusters at scales of parsecs.
NGC1097 is an early-type , barred, spiral with two grand-design spiral arms. Each arm anchors at the North and South edges of the galaxy disc, at which point about 10 kpc long dust-lanes develop and extend straight up to the central kpc of the galaxy along a bar seen in HI. The Northern spiral arm is distorted at its end at the location of the companion galaxy NGC 1097A. The total mass of the galaxy in HI is (Ondrechen et al. 1989).
At the central 800 pc radius, a very bright circumnuclear star forming ring stands out. The ring resolves in hundreds of stellar clusters seen prominent in the optical (e.g. Barth et al. 1995, this work), near and mid-IR (e.g. Prieto et al. 2005, Mason et al. 2007; Reunanen et al. 2010), cm (Beck et al. 2005), X-rays and in molecular (Mezcua et al. 2015), CO and HCN lines among others (e.g. Izumi et al. 2013, Martin et al. 2015), barely in HI (Ondrechen et al. 1989).
The nucleus hosts a BH mass of (Lewis & Eracleous 2006), with moderate activity given the low bolometric luminosity of the source extracted from integration of the central 10 pc spectral energy distribution (SED): (Prieto et al. 2010), which places it as a very low efficiency source accreting at a rate of in Eddington units. The nucleus has shown activity cycles, the optical spectrum mutating from a low ionisation – LINER type – to a double-peaked broad line, type 1 source (Storchi-Bergman et al. 1997).
The nature of the nucleus emission as inferred from the analysis of the central 10 parsec-scale spectral energy distribution (SED) is synchrotron jet-dominated emission (Fernandez-Ontiveros et al. 2012 and in preparation, Koljonen et al. 2015). The core is developing a pc-scale jet discovered with VLBA in 8.4 GHz (Mezcua & Prieto, 2014). The radio loudness of the core, measured as F(5 GHz) / F( 2180 A ) from our 10 pc scale SED (see Mezcua & Prieto, 2014) is about 200, in line with what often found in low efficient accreting sources (Sikora et al. 2017.
This paper makes use of subarcsec UV to IR data to spatially resolve the ring in its individual components: the star clusters and the network of dust / gas filaments in which they reside. The panchromatic view at a similar scale of across the electromagnetic spectrum allows us 1) to resolve spatial and temporally the star formation history in the ring via the individual analysis of the cluster population; 2) to spatially resolve the network of narrow dust filaments that enshroud the ring. The nucleus of NGC 1097 is known to be enshrouded by also a network of narrow dust-filaments that spiral from the ring all the way to the galactic centre (Prieto et al. 2005). This work connects the nuclear dust spiral with the filaments in the ring and further out at several kpc distance with the two major dust lanes of the galaxy where they all origin. Characteristic physical parameters of the filaments are derived. Putting together all the information, a comprehensive view of the origin, feeding and recurrent star formation in the central kpc of the galaxy is attempted.
A distance to NGC 1097 of 14.5 Mpc (Tully 1988) is used, 1 arcsec = 70 pc.
2 Multiwavelength dataset
The data comprises of subarcsec resolution continuum- and hydrogen-recombination-lines- images spanning the – range, complemented with arcsec-scale submillimeter data at 88 GHz (Fig. 1). The sources are Hubble Space Telescope (HST) images from Wide-Field Camera 3 (WFC3) in U-, B-, V-, I- , H and adjacent continuum- bands, namely in the filters F330W, F438W, F547M, F814W, F657N and FR656N respectively, and from NICMOS in Pa and adjacent-continuum, F187N and F190N filters respectively. The final multi-drizzle, cosmic-ray-free images delivered by the HST pipeline are used in this work.
The dataset further includes ESO-Very Large Telescope (VLT) data from the Adaptive-Optics-assisted NACO camera in J-, H- , Ks- and L-bands from Prieto et al. (2005) and diffraction-limited, line-free VISIR images in narrow-band continuum filters centred at and from Reunanen et al. (2010).
The NACO images have angular resolutions FWHM 0.15 arcsec (Prieto et al. 2005) comparable to those of the HST in the optical; the VISIR images have FWHM 0.35 arcsec (Reunanen et al. 2010). HST and VLT images were all registered to a common reference system using nine, bright and isolated clusters in the stellar ring, present in all the images. The achieved registration precision is 30 mas (see Mezcua et al. 2015 for details).
The set is further complemented with archived ALMA data in band 3 (centred at 88 GHz), from which the HCN(1-0) 88.6 GHz line map from the calibrated data cube in the archive was extracted. This line was selected for being a high density tracer and among the strongest molecular line in the ring (Martin et al. 2015). The HCN line-map has a beam resolution of , a factor three to ten worse than that of the UV - IR dataset. Accordingly, the registration of this image with the UV - IR dataset had to rely on NGC 1097’s nucleus. Nonetheless, the registration precision is high as the eleven point-like sources detected in the VLT-VISIR image fall at corresponding emission peaks in the HCN map (Fig. 1).
To complete the panchromatic view, the deepest available X-rays Chandra image of the central kpc of the galaxy is shown on top of the HST-UV image in Fig. 1. The nucleus is the strongest point source in the field (discussed in Mezcua et al. 2015) and the second clear detection is a point-like source at 4 arcsec South-West from the nucleus with no cluster counterpart. The ring itself shows some low level of diffuse emission across, somewhat pinpointing a few of the brightest regions in the ring, but the signal to noise level is very low which unfortunately warrants any further analysis. We are hoping getting much deeper X-ray image, thus no further discussion of this data is in this work.
3 Star clusters identification
On the registered UV - IR dataset, a total of 247 individually resolved star clusters detected above a 3 sigma level with respect to their local background were identified. The reference identification was performed at the ESO/NACO Ks-band to overcome dust extinction, and separately also in the HST / F336W U-band to enhance cluster contrast over the background bulge light that dominates in the IR. Cross identification with the rest of the images followed next. Of the 247 sources, we secured 171 clusters detected in the UV (HST U-band), and up to (VLT NACO-Ks-band) most of them, with a few also detected up to (VLT NACO L-band, detection is limited because of sensitivity issues). The remaining 76 sources are detected from onward only because of dust extinction.
There are a few detections of clusters outside the strict ring limits, e.g. in between the nucleus and the ring, or beyond 1 kpc radius. They all show properties similar to the rest of the sample in terms of size, luminosity, mass, age, and for the purposes of this work they will be treated as integral part of the total sample.
Fig. 3 shows a contours-version of the HST-UV image after removal of the stellar light using a filter (white - tophat) that remove the low frequency diffuse light thus enhancing point-like sources in the image. Accordingly, Fig. 3 singles out the cluster population identified in the UV only (note that the UV- and K- band images in Fig. 1, show the complete cluster set detected in both UV and /or in K- band). Removing of the stellar light enhances the clusters contrast thus facilitating their identification and isolation with respect to neighbouring ones. Once clusters are identified, photometry is done on the original image without any filtering applied.
3.1 Cluster identification in HII gas
Cluster identification was equally pursued in the HST WFC3-H+[NII]- and HST NICMOS-Pa images after continuum emission subtraction (sect. 3.3, continuum-free line images are shown in Fig. 3). Prime identification was done in the H+[NII] image that have comparable resolution to that of the UV and near-IR set. The nebular gas shows diffuse emission all over the ring, and few clusters were found to have a significant point like counterpart in gas. Most do not, this is a priory consistent with the ages of the large fraction of clusters in the ring, (discussed in sect. 4) but it is somewhat unexpected for the youngest old population, for which the detected H emission is lower than what is predicted for their age. The deficit in H emission for this population is confirmed after further examination of a second although less deep HST ACS-H+[NII] image,111Fathi et al. (2013) refer in their Fig.1 to an HST H image that looks different from that in Fig. 3. The discrepancy is presumably due to the fact that their image does not have the continuum emission subtracted, thus all the point-like sources in their image are predominantly continuum rather than H emission. and of the HST NICMOS-Pa image of the ring. All show equivalent appearance. It should be noted that the resolution of the NICMOS-Pa image is three times lower than that of H which hampers a detailed comparison. Still, the Pa image uncovers a few regions extinguished by dust in H, but nonetheless the comparison of H and Pa images in Fig. 3 shows consistent results.
3.2 Clusters size
The clusters’s emission is unresolved in all the images, thus cluster’s sizes are set by the achieved spatial resolution and are upper limits. These are determined as the Full-Width-Half-Maximum (FWHM) of a Gaussian function fit to the cluster light profile. The fit was applied to the brightest, best isolated clusters in the ring. At the two extremes of the wavelength range, the FWHM of point-like clusters in the WFC / F336W image is ; that in the NACO / K-band is . Thus, an upper limit to the clusters size is set to . For comparison, the size of the spatially resolved cluster emission in one of the nearest starbursts, NGC 253, is FWHM1.5 pc (Fernandez-Ontiveros et al. 2009).
Cluster photometry in the 0.3 – 5 region was done in an aperture radius r = , consistent with the mean angular resolution of this spectral band, and after subtracting the local, median, background from an annulus with radii from to .
3.3 Gas extinction in the ring
Gas extinction was derived from the HST recombination map H/Pa (Fig. 1). H was extracted from the WFC3 F657N image, with the continuum subtracted from a linear interpolation between WFC3 -F547M and -F814W images; Pa from the NICMOS F187N image with the continuum subtracted from NICMOS / F190N image. Prior producing the ratio map, the angular resolution of the WFC3 H+[NII] image was degraded to match that of NICMOS-Pa, and an estimate of 40% [NII] 6548, 6584 Å light contribution to the H+[NII] blend (following Phillips et al. 1984) was subtracted from the H+[NII] image. Witt et al. (1992) extinction curve and recombination case B, (Osterbrock 1989) applies.
The average extinction in the ring is , in line with the high percentage of clusters, of the total sample of identified clusters, detected in the UV. Exceptions occur at locations next to the thicker dust filaments in the ring and at the entrance of the dust lane at the Southern region in the ring where rises to . Dust obscured regions in the ring - filaments and lanes - are easily visualised in the UV image as well as in the dust extinction map discussed in sect. 5 (see also Fig.1), and in general, Av values in the gas are at most regions comparable with those applicable to the continuum light, the latter being inferred from the stellar population analysis (sect. 4) or from the continuum extinction maps (sect. 5).
4 Cluster properties: age, mass and extinction
Dating of the cluster population is restricted on the 171 clusters that have secure identification in the UV, and thus cover the widest wavelength range in this work, namely – (up to in some cases). Spectral Energy Distributions (SED) were constructed for each of these UV clusters that have detection in at least four, and up to nine, photometric bands. Most fits are based on 6 -7 photometric bands always covering the whole UV to IR range. Ages and masses were determined by SED fits using Charlot & Bruzual latest update of their Single Stellar Population (SSP) models.
The Charlot & Bruzual’s SSP models whose astrophysical ingredients are in Gutkin et al. (2016), Wofford et al. (2016) are based on Kroupa’s (2001) Initial Mass Function (IMF). The results from these models were checked with the particular case in which the IMF is populated stochastically following the prescriptions in Bruzual (2010). The stochastic effect was found relevant for clusters of mass M⊙, which is not the case for the bulk of the population in the ring (see below). Thus the results discussed in this work follow Charlot & Bruzual’s models with fixed IMF.
The models used are based on solar metallicity, and an age range from 104 yr to 9.75 Gyr. The sampling in ages is progressively increasing with ages: for ages less than , 0.1 Myr step up to 10 Myr, 0.5 Myr step in the 10 -15 Myr range, 1 to 3 Myr step in the 15 - 60 Myr range, 10 Myr step from 60 Myr to few 100 Myr. The SSP fits are done with the whole range of ages covered by the models rather than introducing an arbitrary cut in age. This choice is important taking into account the wide range of ages covered by the ring.
Because of the diffuse nature of the emission (sect. 3.1), fitting of the nebular emission was not included in the SSP fits. However, for comparative purposes, per each model in the Bruzual & Charlot’s library, H nebular emission associated with the ionising continuum budget was calculated following Osterbrock ’s (1989) prescription - this is relevant for the youngest ages, below 5 Myr. Bruzual & Charlot’s models already include the stellar H contribution in absorption, thus, the net difference between the absorption and emitting H flux components was ultimately compared with the measured H at the cluster locations. As the observable is via a filter that includes and continuum, prior to the comparison the model derived H flux was convolved with the HST-WFPC3 F657N filter used in the observations.
Cluster’s SED fitting was done via a minimisation. Free parameters in the fit are the cluster mass, age, and continuum dust extinction. Examples of SSP fits are in Fig. 4.
The simultaneous inclusion of UV, optical and IR data in the fit was found to be critical for the age determination in the particular range covered in the ring, in the 1 Myr to a few 100 Myr (see below). Moreover, the moderate extinction at the clusters location (sect. 5) also helped in better constraining ages as the observed SED is close to its intrinsic shape and minimum correction due to dust is required in the fit. On this basis, special features in the SED that were found determinant for the age estimates are: the steep UV-optical-IR spectral slope for assuring the ages of the younger, less than 10 Myr old population (in this case the cluster H emission cannot be used - sect. 3.1 - but the wide wavelength coverage up to and minimum dust extinction makes the result very solid); the Balmer break for ages older than 20 Myr; the near-IR bands helped to constrain the oldest population beyond 60 Myr because of the progressive curvature of the SED, simultaneously, towards the UV and IR bands.
Dating of the clusters detected only from onwards was found largely uncertain: the SSP fits are based on four spectral bins only and the rather featureless shape of the continuum in the workable range, , is alone insufficient to properly constrain the age. For this reason, these clusters are not further analysed in this work. The denser dusty environment of these clusters is evidenced by comparing the UV- with the K-band image of the ring (Fig. 1), to see that these clusters are often located behind the thicker dust filaments.
Putting in context the cluster properties of NGC 1097’s ring as compared with those of massive young star clusters in the Milky Way and nearby galaxies indicates very normal properties. Cluster masses are found in the range, and thus the ring classify as a population of Young Massive Star (YMS) clusters as those found in our Galaxy and nearby galaxies (Portegies Zwart et al. 2010). Ages span in the Myr to a few 100 Myr range. For comparison, YMS in the Milky Way have ages in the 2 Myr to 20 Myr range, in the LMC and Andromeda, up to a few 100 Myr (Portegies Zwart et al. 2010 and references therein). The range of continuum extinction found in the fit is , in line with the continuum dust- and recombination- maps (Fig. 1, sects. 3 & 5).
4.1 Recurrent star formation in the ring
The HST-F336W and VLT/NACO Ks-band images in Fig. 1 show the cluster population colour coded according to the age. The optical and IR images in between these two bands are similar and not shown. The color code follows a continuous sequence as follows: blue are the youngest population in the ring, less than 10 Myr old, green are those between 10 and 40 Myr, in red those older than 40 Myr and up to a few 100 Myr, in white, those detected longward of only because of extinction. These ”white” clusters are not dated (sect. 4).
A histogram in Fig 6a shows the relevant peaks in the distribution of ages. Focusing on continuous bins that sum up together 20 clusters or more, about three main age periods are distinguished: the most prominent is the burst at Myr, comprising of the total 171 clusters dated; a second period centres in the Myr range with of the total, the uncertainty is at least 10 Myr, the step in the models; a third period resumes, arguable, the two peaks at 60 Myr and 90 Myr, comprising 23% of the total. The dispersion in ages in the last two periods is large, chiefly caused by the rather similar shape of the models within these ages.
The histogram shows also some minor peaks at extreme ages: below 1 Myr, and beyond 1 Gyr. There is also a small group at . All these clusters are detected in the UV - optical range but not in the IR, the reason being that they are slightly fainter than the rest and their IR counterpart, particularly for the younger ones, drops steeply with increasing wavelength and gets below our detection limit in the IR with VLT-NACO. Judging from a comparative analysis with the rest of clusters, we believe the clusters below 1 Myr pertain to the 4 Myr group, and those in the Gyr range pertain to the 50 - 100 Myr group. Nonetheless, they require further age diagnosis.
To asses the range of uncertainty in the distribution of the main burst periods identified, Fig 6b shows a highly censored age histogram in which the assigned age to each cluster is the median of its 10 best fits ranked by their . It can be seen that this new histogram is a smoothed version of the one in Fig 6a: the age peak at 3 - 5 Myr still remains well defined and isolated, but the two older periods merge into a smoothed distribution, still bimodal, with two main peaks at Myr and 50 Myr, the former with a dispersion of 10 Myr in line with the age-step of the models, the later presenting a broad tail up to 100 Myr, both peaks in any case remaining within the star formation periods identified in Fig 6a.
Overall, a time separation of about 20 - 30 Myr between major burst periods is apparent. If so, the proto-cluster population may still be in its infancy (sect. 4.2). It may nonetheless be possible that the older burst periods include themselves a finer temporal sequence of bursts that our simple SED fit approach cannot resolve.
Fig. 4 shows examples of the SSP fits for representative cases of the various age periods. Errors in the measured fluxes (circles) are smaller that the symbols and not distinguishable, upper limits apply for non detections. Age, mass and Av derived from the fit are indicated in the plots. It can be noted that the shape of the observed continuum changes markedly between the different age periods identified: extremely blue and steep for the youngest, less than 10 Myr old group, an increasingly strong and broad IR SED and pronounced Balmer break in the 20 - 40 Myr case, a strong curvature in the SED in both the UV and IR bands for the oldest group. The predicted and measured H emission is also shown. As discussed in sect. 3, most of the clusters do not show nebular emission, which is consistent with their assigned age but for the youngest, less than 4 Myr old, population which should show relevant H emission but do not (see sect. 3.1). Fig. 4 provides examples of this young population which is typically characterised by very blue SED, low Av but H emission lower than the prediction: two cases with lower emission than predicted, one case in agreement with the prediction, are shown.
4.2 The proto-cluster population
Beyond the identified clusters in the ring, an even younger population - presumably in a proto-cluster phase - is identified in the mid-IR. This population singles out in VLT-VISIR diffraction-limited images of the ring at 11 and (Reunanen et al. 2010). Fig. 1d shows the VLT image, for best signal to noise ratio, to resolve in circa ten - eleven, bright, point-like sources (dark-reddish point-sources in the image). The VISIR show the same sources (not shown here but it is in Reunanen et al. 2010) as well as in an equivalent Gemini image published in Mason et al. (2007). In Fig. 1d, it can be noticed that the location of these sources just coincides with the emission peak of an equivalent number of ALMA / HCN(1-0) molecular clouds resolved in the ring: almost each molecular cloud in the ring encloses one or two mid-IR sources. The sources also coincide with the CO(1-0) clouds after comparing with Hsieh’s et al. (2011) map. Because of their strategic location, these mid-IR sources are presumably dust cocoons at the innermost -densest- region in the molecular cloud, the factories where the new burst of star clusters is to emerge.
An estimate of their temperature is inferred from fitting a grey black-body to their – SED. Assuming a standard dust emissivity with a power law exponent ( e.g. Barvainis 1987), a grey black-body (BB) fit, , yields a temperature, for most of the sources. In a few cases it was possible to associate the VISIR emission with ALMA sub-millimeter continuum emission at (this ALMA map is shown in Izumi et al. 2013), and (this maps is not shown here but it is similar to the map), but the sub-millimeter emission turned to be very steep, presumably it is dominated by the strong non-thermal component of the ring found in Tabatabaei et al. (2017), and could not be used to further constrain the dust temperatures.
These mid-IR sources are furthermore found to be shielded from the external radiation by highly optically thick material. The simple comparison between their associated BB emission at with that of the clusters at this frequency implies an extinction Av mag. This is in line with the inferred column densities of the molecular clouds, (Hsieh et al. 2011), which imply extinctions of at least Av = 50 mag.
The size of these proto-clusters is limited by the spatial resolution of our VISIR data, currently at the VLT diffraction limit at , to be .
4.3 On the diffuse nature of the clusters HII gas
As illustrated in Fig. 3, nebular H and Pa are found all over the ring but its structure is dominated by diffuse emission, no clear point-like counterpart emission at the cluster locations, especially for the youngest 4 Myr old population, is detected (sect. 3.1). Thus, this population shows a substantial deficit in HII gas as compared with what is predicted for their age.
A further characteristic of the HII gas is its occasional filamentary morphology at locations away from the cluster positions, for example at locations North- and South-West- of the ring. Diffuse arch-like features sometimes extending 200 pc away from the ring (e.g. North of the ring) are apparent (Fig. 3).
It thus follows that the HII gas measured at the cluster spatial scales may not be indicative of the star formation rate, nor of the age of the cluster - an effect also pointed out by Hollyhead et al. (2015) who observe a similar phenomenon in the cluster population of M83. For the youngest 4 Myr old population in the ring of NGC 1097, the measured flux would be inconsistent with that age, however the steep, extremely blue UV to IR spectra of this population could only be reproduced by SSP models of those ages. A stochastically populated IMF could account for these spectra if few OB stars are in place but stochastic effects would explain sporadic cases and not what it seems to be a systematic.
Possibilities include that the clusters are matter bounded which would naturally lead to a leakage of photons, therefore a deficit in H emission (Papaderos et al 2013). Still, one would expect in this case a sharp boundary in the ionised gas at the location of the young clusters, which is not the case as no point-like counterpart in nebular gas are found.
A possible explanation relates to a low density cluster environment, low density allows for the ionising photons to escape / distribute far beyond the cluster boundary. As a test, the size of the sphere of Stromgren was evaluated at the clusters location. For HII region densities of , the size is in the 2 - 3 pc range, i.e. smaller than the typical separation between clusters in the ring, in the 10 pc range. But if gas densities are as low - as it appears to be the case in Giant Extragalactic HII regions (Arsenault & Roy 1988), the Stromgren’s sphere could be as large as 10 - 100 pc radius (Osterbrock, 1989), far beyond the stellar cluster boundary, with the effect that overlapping spheres of neighbouring young clusters would produce the diffuse appearance of the gas in the ring.
5 The network of dust filaments: from the kpcs-scale dust lanes to the central parsec
Lanes and filaments all over the ring are visualised in the HST-UV image, and in its comparison with the almost dust-free VLT-K-band image (Fig. 1a, b). The UV image also traces well the known nuclear spiral of dust filaments, a sharper view of it in the VLT-NACO / J-band is shown for comparison purposes in Fig.1f taken from Prieto et al. (2005).
A highly contrasted dust map of the central kpc of the galaxy is provided via the extinction map Av in Fig. 1e. The creation of the Av map follows the procedure outlined in e.g. Prieto et al. (2014). In brief, the map is produced by taking the ratio of two images separated in wavelength. For NGC 1097, we take the ratio of the HST images I-band and B-band. In such a ratio, regions depressed by dust in the B-band are expected to get enhanced at longer wavelengths, particularly in the I-band. The conversion of this image ratio to an extinction map is done by comparing I-band / B-band values at locations in the filaments and lanes, with those at dust-free locations selected visually, outside the ring. Typically, dust-free locations are selected at distances no larger than 1.5 kpc radius to minimise stellar colour gradients. The Witt et al. (1992) extinction curve is used. Fig. 1e shows the Av map for the nuclear region and the ring, Fig 7b shows the large field-of-view I-band / B-band image ratio from which the Av map is constructed.
The most conspicuous feature in the Av map - Fig. 1e - is the bright, tongue-like structure that runs from the Western side of the ring to the South of it. It traces one of the two major dust lanes of the galaxy, namely that coming from North of the galaxy (Fig 7), at its entrance into the ring. The second major dust lane arises South of the galaxy and as the Northern one, it equally extends from the edge of the galactic disc straight to the ring. Yet, this South lane is not showing up as prominently in the extinction map as it presumably enters the ring from the back, and the extinction map traces dust against a background emitting source only.
The extinction map further shows that most clusters lie in low dust regions, with , in line with values derived independently from the stellar population analysis of the clusters (sect. 4). The largest extinction, mag, are found at the thickest filaments and at the prominent lane in the map. Extinction maps based on other continuum image ratios, namely VLT/NACO Ks-band- and HST/WFC3 F814W-, F438W-, and F336W- images yielded consistent results, namely are found across the ring. This consistency is reassuring, it further suggests the applicability of the extinction curve used to the central kpc of NGC 1097.
A closer look at the conspicuous dust lane in Fig. 1e, or at the larger scale view in Fig 3b, shows that it resolves into narrow, relatively long filaments running parallel to each other along the lane flow. The filaments can be followed, continuously, from the lane through the ring, and further in to the nuclear central parsecs. It can been seen that some of the filaments as they enter into the ring at the South-East region of the ring they follow the ring by circularising along the Southern region of it, others curve immediately towards the nucleus to produce the known nuclear spiral of filaments which can be traced up to a few pc from the BH (Prieto et al. 2005).
To compare the extinction map with the molecular gas in the region, Fig. 1e shows the ALMA - HCN gas at the same scale on top of the Av map. Albeit its lower angular resolution, the HCN gas follows closely the location of the dust lane inside the ring, where it circularises at the Southern region, and even outlines the filaments at some locations. For example, the HCN tongue-like feature entering the ring at the South-West region follows the dust lane at that location, an equivalent HCN feature at the North-East side of the ring coincides with the entrance of the opposite dust lane into the ring. North of the nuclear spiral, a correspondence between an HCN feature bridging the ring and the nuclear molecular gas is seen overlapping with a dust filament that also crosses the ring and curves into the nuclear spiral. These correspondences are equally seen in CO gas after comparing with e.g. Izumi’s et al. (2013) map.
6 Discussion
6.1 Random age distribution in the ring
Clusters at all ages are found anywhere in the ring regardless of the evolutionary phase i.e. whether they are in the proto-cluster phase or already formed. Moreover, clusters do not group by age or a special location in the ring. Special locations are e.g., at the entrance of the dust lanes into the ring, or at the molecular-clouds location, being those places where the younger clusters are expected to be.
The proto-clusters are the only sources that can certainly be associated with the molecular clouds as they sit at the cloud peak emission or close to it (Fig. 1). Because of this, and their moderate temperature (sect. 4.2), they may be very young, perhaps less than 0.5 Myr if put in the context of the so-called class 0 phase of proto-stellar clouds, these being known as strong blackbody emitters in the far-IR (Evans et al. 2009; Seale et al. 2012).
There is marginal indication for the youngest Myr old population to group slightly, in the sense that there is a larger probability of finding a 4 Myr cluster next to a similar one, but otherwise they are largely mixed in the ring, an indication that the clusters are moving away from their natal cloud soon after their birth, in less than Myr or, that the natal clouds get destroyed by some kind of stellar feedback on short time scale.
The mixing of ages also implies that clusters seen in projection on a given molecular cloud may not necessarily have arisen from that cloud, nor be representative of the star formation efficiency of that cloud, and therefore estimate of specific star formation per either cloud area or a given section of the ring could be misleading.
6.2 Build up of the ring stellar mass
The amount of gas stored in the ring is found (as derived from the HCN gas, Hsieh et al. 2011). Following on the co-spatiallity between the molecular-gas and the dust- lane and filaments at the entrance to the ring (sect. 5), it is conceived that the gas in the ring proceeds and is replenished by material flowing along the two major dust lanes of the galaxy via the dust filaments or streamers. We note that whereas some of the dust filaments get through the ring and inward, others kind of overshoot it, meaning that they carry a range of different specific angular momenta. Because of the large concentration of gas in the ring, there should have been over the past one dominant component of the momentum responsible for the ring configuration at the specific ring radius that is observed.
Evidence for a net gas inflow along the large-scale dust lanes of the galaxy relies on kinematic modelling of the HI gas along NGC 1097’s bar by Ondrechen et al. (1989) who finds a net inflow within the central 1.5 kpc radius. Further in at the galactic centre, a net inflow via the nuclear spiral of dust filaments is supported by hydrodynamic and kinematic models (Prieto et al. 2005; Davies et al. 2009; Fathi et al. 2013), with net inflow rates of gas of from distances of 100 pc and decreasing inward.
A first order estimate of the filling factor and volume density of the streamers in the dust lane could be derived from the extinction map. A transversal cut at the North lane at the position marked in Fig 7b reveals its inner structure in detail: the cut distinguishes up to three major bumps - the filaments - over a lane width of 280 pc, each bump having a width, FWHM, of - (Fig 7c). Presumably, these widths are upper limits set by the signal to noise in the lanes and our ability to spatially resolve the filaments in the lane. The filaments filling factor in the lane can be derived as the ratio of the filament- to lane-section- areas, times the number of filaments in the lane section. Taking the lowest filament width, . Note that this is not a filling factor per volume but per area as the lane is considered as a tube filled with filaments all running parallel to each other along the flow direction.
The filaments density could be inferred from the extinction values. The highest extinction in the Av map is measured along the dust lane at its entrance into the ring, mag. is converted to total gas column density, , using the standard conversion (Savage & Mathis 1979). note that traces mostly molecular gas, as HI is barely detected in the lanes (Ondrechen et al. 1989). The volume density, , is estimated from assuming the filament depth equal to its width. Taken a conservative average width of 28 pc (see above), densities in the range are inferred.
Presumably, the source for this material running along the streamers is the HI gas reservoir of , most of it placed at the galaxy outskirts, as suggested by Ondrechen et al. (1989). The morphology of the HI gas embracing the NGC 1097 and its companion NGC 1097 A further suggests the ultimate origin of this gas to be related to the past interaction of NGC 1097 with its companion.
6.2.1 Arrival mass through the streamers: feeding the ring and the BH
A crude estimate of the arrival mass rate through the streamers at the entrance to the ring can be derived from the filament’s density and filling factor above estimated, and assuming a geometry for the dust lane - we take it as cylinder with diameter, D , this is an average lane FWHM measured in Fig 7b, and a velocity for the gas flow, , at the entrance to the ring. For the latter, we use the fact that the filaments as they approach the ring they circularise along it, thus they are expected to get coplanar with the ring and share the same specific angular momentum as that of the gas in ring. The ring gas velocity is known from the HCN kinematic to follow a rotation curve that gets close to flat at (Hsieh et al 2011). We adopt this velocity as that of the flow at the entrance into the ring. Using the expression: , where the factor 2 accounts for two dust lanes, and the fiducial values above, a mass arrival rate is found.
This is to be compared with the gas consumption in the ring and inward. The global current star formation in the ring estimated from the Pa integration in the ring (see sect. 6.3) is . In addition to this, there is the material that following the nuclear spiral falls towards the centre, the estimated infall rate is at 100 pc from the BH (Fathi et al. 2013). An upper limit to the BH accretion rate as derived from the central 10 pc SED (sect. 1) is orders of magnitude less, using a 10% conversion efficiency. Summing up the above numbers, the estimated gas consumption in the central kpc is . Subject to the approximations made, this consumption may comfortably be accounted for by the streamers.
6.3 Star formation regulation in the ring
The star formation rate (SFR) in the ring as derived from the integration of the Pa emission, after extinction-correction using the H/Pa extinction map (Fig. 1), and converted to a star formation rate using Kennicutt & Evans’ calibration (2012) yields , where is the flux corrected for extinction. This SFR is a factor 2.5 lower than previous estimate by Hummel et al. (1987), the difference being due to the higher, by same factor 2.5, SFR calibration factor applied by those authors.
The gas depletion timescale, i.e., the ratio of molecular gas mass to SFR, is = , in line with the universal depletion timescale of molecular gas in star forming galaxies, in the Gyr range (Tacconi et al. 2018 and references therein). Yet, the total mass in clusters in the ring older than say, 20 Myr and up to 100 Myr, the age of the older clusters dated in the ring, is found to be (cluster’s mass is derived from the SSP analysis, sect. 4). At the current SFR of , the ring should have produced a total of in clusters mass instead, i.e an order of magnitude more in stellar mass. It thus appears that factors other than the availability of gas are more determinant in the regulation of star formation, perhaps the rate at which dense gas accumulates in the ring to become self gravitating for star formation to begin is more crucial (Gao & Solomon 2004; Burkert & Hartmann 2013; Burkert 2017; Evans 2017).
The ring is a place of bursty, recurrent star formation. The intermittent star formation may be due to an interrupted feeding or perhaps to conditions in the ring unsuitable for star formation. If the ring is fed by the streamers, the collimated morphology of the lanes over several kpc distance across the galaxy and the large concentration of gas in the ring suggest a rather continuous flow of matter through the lanes (still, the kinematics of HI along the bar indicates a more complex dynamic, Ondrechen et al. 1989 ).
Here we focus on a more local process, namely the suitability of the gas in the ring to form stars and examine the Toomre parameter, Q, which is a measurement of the stability of a disc of gas against collapse. For an infinitesimal thin disc, Q =1 indicates a stable disc, but for thick discs, stability still remains for Q 0.7 (e.g. Behrendt et al. 2015). Following Toomre (1964):
where is the sound speed, , the epicyclic frequency, is approximated as , G is the gravitational constant, is the ring surface gas density.
Typical temperatures of the diffuse gas in the Milky-Way are (e.g. Kulkarni & Heiles, 1998) yields ; the gas in the ring is rotating with (Hsieh et al. 2011), the total gas mass is and the internal and external ring-radii are taken 600 pc and 1 kpc respectively. Substituting values results in Q 0. 9 - 0.6, pressure terms as turbulence or/and magnetic field ( e.g. Tabatabaei et al. 2017) are not even considered, meaning that the ring is presumably in a marginally stable regime. It is thus possible that in the past, may be roughly the last few 100 Myr, the streamers have fed the ring without forming (a significant amount of) stars because at that time the disc was stable against collapse. Yet, at some point, enough mass had accumulated such that the increasing surface density pushes Q below one and stars start to form. It is thought to be some kind of self-regulation so that Q remains close to one (Dekel et al. 2009; Burkert et al. 2010): once enough gas is accumulated, star formation starts, gas is consumed and Q is pushed above one again. Such scenario could explain the small mass in stars and intermittent star formation in the ring.
7 Summary: the overall view
This work presents a multiwavelength, parsecs-scale study of the young cluster population and the interstellar medium enshrouding it, dust, ionised and molecular gas, in the kpc-radius circumnuclear ring of the galaxy NGC 1097. Circa 250 young stellar clusters are individually resolved in the ring. About show emission up to the UV, thus avoiding the numerous dust filaments that cross the ring. The remaining group, hidden by dust, is recovered at near-IR wavelengths, chiefly in the K-band (sect. 3, Fig.1). The clusters’ properties fit entirely within those of massive star clusters in the MW and nearby galaxies: masses in the range, ages in the Myr to a few 100 Myr range, luminosities in the range. Their sizes are however limited by the angular resolution of the data, FWHM, their extinctions inferred from different methods are moderate, (sect. 4).
The ring is a place of intermittent bursts of star formation spreading over the last few 100 Myr. Several major burst episodes are identified, these cover a proto-cluster phase, a major one at Myr, and older ones at , and possible one, perhaps two episodes between 50 Myr and 60 Myr and in between 80 Myr and 100 Myr. All together, they may separate by an elapsed time of 20 - 30 Myr (sect. 4.1, Fig 6).
The proto-cluster phase comprises about eleven – point-like sources, sizes , strategically placed at the core of the HCN (J=1-0) molecular clouds in the ring, which are FWHM 100 pc in size (Fig. 1). Their emission is in all cases consistent with a grey black-body temperature, and they are shielded from the external radiation by thick envelopes that represent extinctions Av in the 50 - 80 mag range (sect. 4.2). These sources may presumably be cluster factories, possibly still in the cooling phase. Judging from the older bursts in the ring, taking as an average rate of about 20 to 30 clusters per burst (Fig 6), each of these proto-clusters should give birth to two to three clusters each.
Cluster of any age are found at all locations in the ring, old and young mix at all positions. The proto-cluster population also spreads all over the ring. The mixing may be caused by the incoming of material through the two major streamers into the ring, the critical time scale for mixing being (sect. 6.3) Myr, the time needed for the gas to move from one streamer to the opposite one in the ring. This timing may conmesurates with the onset of the pre-cluster population seen at all positions in the ring.
Judging by the large proportion of clusters detected up to the UV, their clean environment is presumably a consequence of the onset of winds by new born stars which sweep out the parental material from which they form. The cleaning should happen at the early phases considering that the youngest 4 Myr population is mostly dust-free (Fig. 1).
The ring has a molecular mass of . It produces stars at a current rate of SFR = as inferred from the Pa gas (sect. 6.3), and there is an additional drain of material to the galaxy centre of through the nuclear spiral filaments. We believe all this material is being supplied by the two major dust-gas streamers that flow along NGC 1097 bar to the ring, the source of this material being as suggested by Ondrechen et al. (1989), the envelope of HI gas at the galaxy outskirts. The streamers resolve in narrow, FWHM , filaments that are followed from the dust lane into the ring with undisrupted morphology. As they approach the ring, they start circularising along it, some continue further in circularising long the ring, others curve inward to produce the nuclear spiral (Fig 7b). The filaments fill the lane, across the transversal direction with a filling factor of about . A first-order estimate of the arrival mass rate through the streamers at the entrance to the ring is found to be largely sufficient to account for the total current global SFR in the ring and infall mass rate to the galactic centre (sect. 6.2.1).
The gas depletion timescale in the ring, , is within the range of that observed in general in starforming galaxies. Yet, the total mass in clusters in the ring formed over the last 100 Myr is \lesssim 8\times 10^{6}\,\rm{M_{\odot}}\ one order of magnitude at least, below of what is expected on the basis of the current SFR. It thus appears that the star formation in the ring is independent of the gas at disposal, perhaps the rate at which dense gas accumulates at the clouds is more critical. The stability criterium of gas in the ring, following Toomre parameter, yields without considering any pressure term due to e.g. turbulence, which we interpret as the disc being in a marginally stable regime. It is thus plausible that over the last 100 Myr, the streamers have fed the ring without forming (a significant) amount of stars because the gas density may not have reached the threshold for disc fragmentation, i.e. Toomre parameter was much larger than one. Yet, at some point, enough mass had accumulated such that the increasing surface density pushes Q below one and star formation begins. A first order estimate of individual SFR for the older bursts in the ring points to a low efficiency process. Assuming a burst duration of 2 Myr (judging from the age dispersion of the 4 Myr burst), an average mass per a cluster of and an average of 20 - 30 clusters per a burst yield SFR between 0.7 to 0.5 per burst, i.e. more than a factor two below the current one.
8 Acknowledgements
AP thanks the CAST group of the Ludwig Maximilians University of München (LMU) for the numerous comments and their enthusiasm, and the Max-Planck Institute für extraterrestrische Physik for the continuous hospitality. Thanks to T. Naab, J. M. Vilchez, C. Muñoz-Tuñon, G. Tenorio-Tagle, for discussions.
The reference list from the paper itself. Each links out to its DOI / PubMed record.
- 1[1] Arsenault & Roy 1988, A&A, 201, 199
- 2[2] Baldwin, J. et al. 1984, MNRAS, 210, 701
- 3[3] Barvainis, R. 1987, Ap J 320, 537
- 4[4] Barth, A.J., Ho, L.C., Filippenko, A.V., Sargent, W.L. 1995, AJ, 110, 1009
- 5[5] Behrendt, M.; Burkert, A.; Schartmann, M. 2015, MNRAS 448, 1007
- 6[6] Beck, R. et al. 2005, A&A 444
- 7[7] Bruzual, G. & Charlot, S. 2003, MNRAS 344, 1000
- 8[8] Bruzual G., 2010, Philosophical Transactions RS London Series A, 368, 783