A Joint Deep Learning Approach for Automated Liver and Tumor Segmentation
Nadja Gruber, Stephan Antholzer, Werner Jaschke, Christian Kremser and, Markus Haltmeier

TL;DR
This paper compares single-step and two-step deep learning architectures for automated liver and tumor segmentation in CT images, aiming to improve accuracy and efficiency in clinical assessments.
Contribution
It introduces and evaluates a dual-network approach for liver and tumor segmentation, demonstrating its effectiveness over a single-network method.
Findings
Dual-network approach improves segmentation accuracy
Two-step method outperforms single-step in tumor detection
Networks trained on LiTS dataset show promising results
Abstract
Hepatocellular carcinoma (HCC) is the most common type of primary liver cancer in adults, and the most common cause of death of people suffering from cirrhosis. The segmentation of liver lesions in CT images allows assessment of tumor load, treatment planning, prognosis and monitoring of treatment response. Manual segmentation is a very time-consuming task and in many cases, prone to inaccuracies and automatic tools for tumor detection and segmentation are desirable. In this paper, we compare two network architectures, one that is composed of one neural network and manages the segmentation task in one step and one that consists of two consecutive fully convolutional neural networks. The first network segments the liver whereas the second network segments the actual tumor inside the liver. Our networks are trained on a subset of the LiTS (Liver Tumor Segmentation) Challenge and evaluated…
Click any figure to enlarge with its caption.
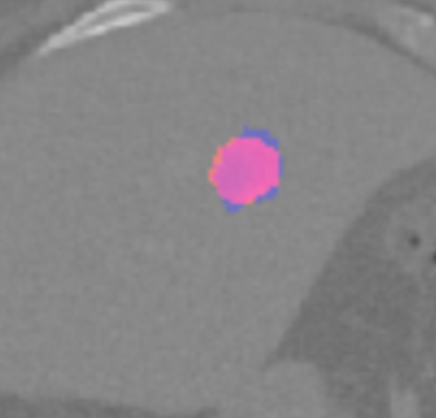 Figure 1
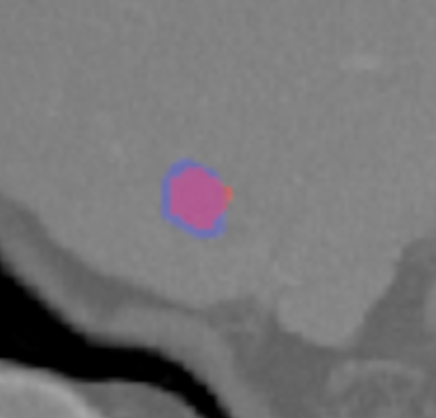 Figure 2
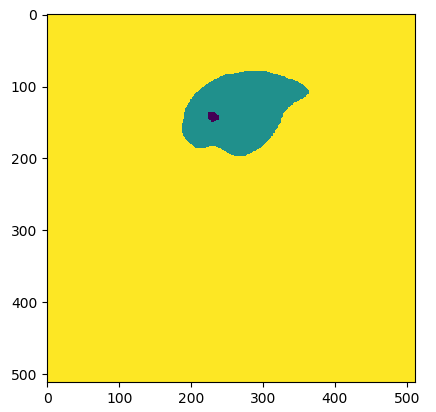 Figure 3
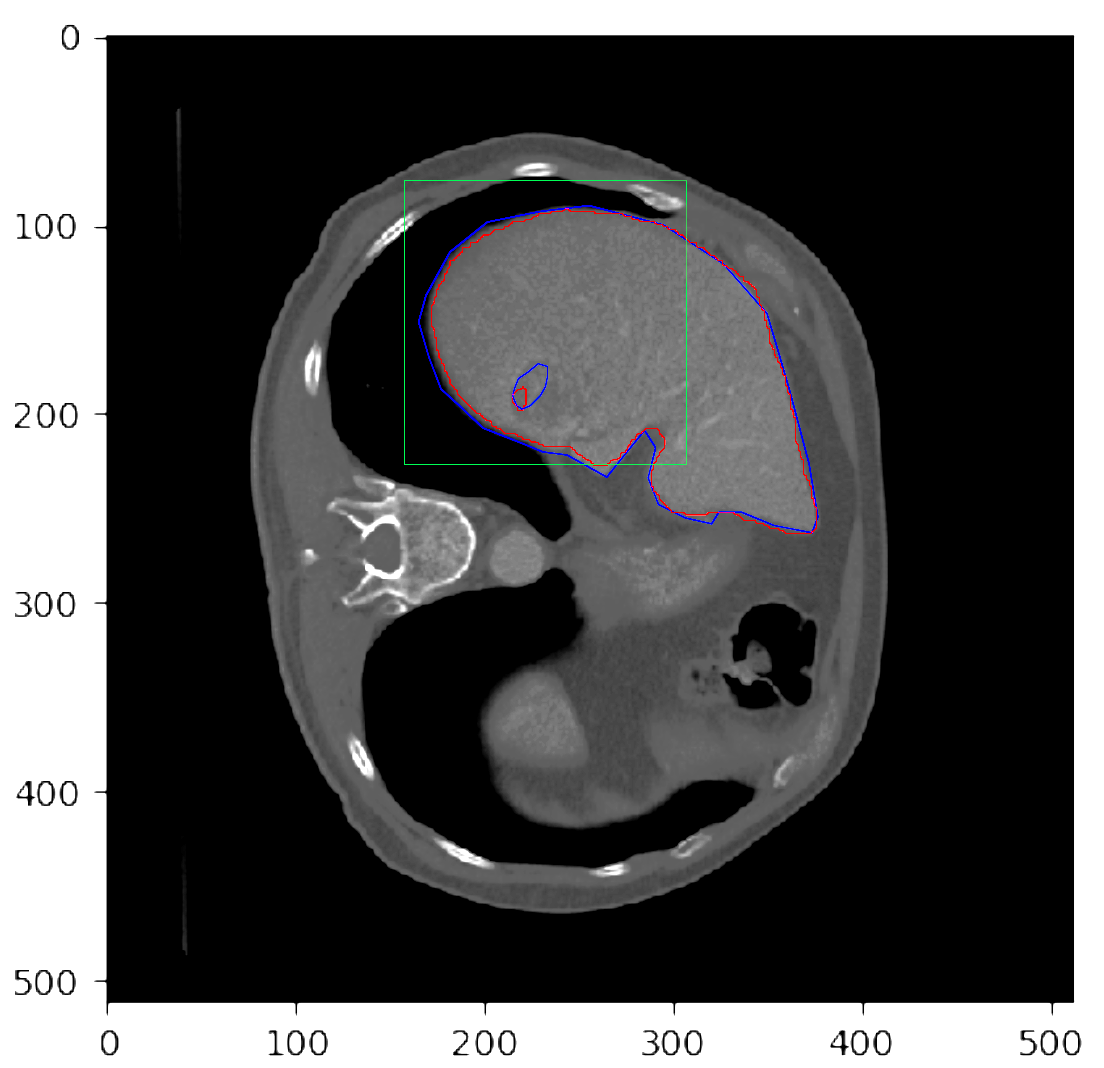 Figure 4
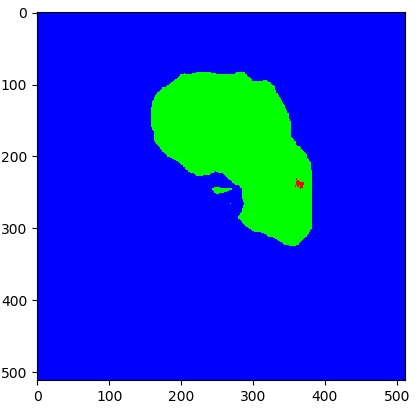 Figure 5
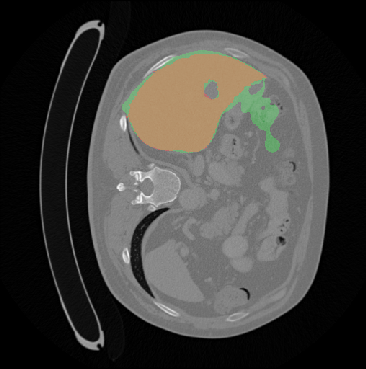 Figure 6
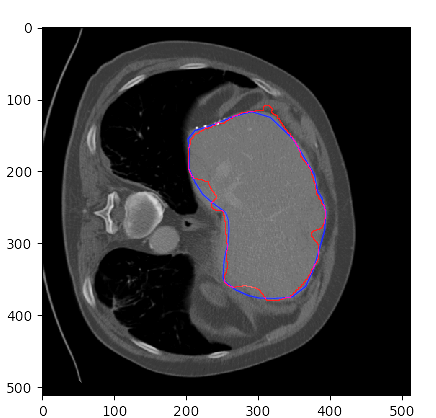 Figure 7
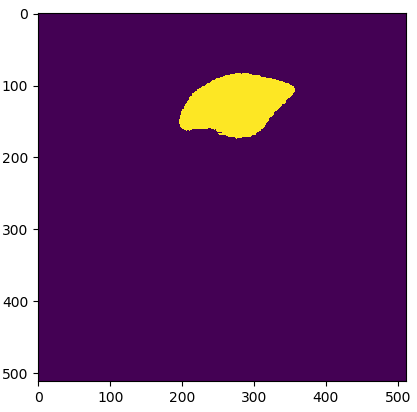 Figure 8
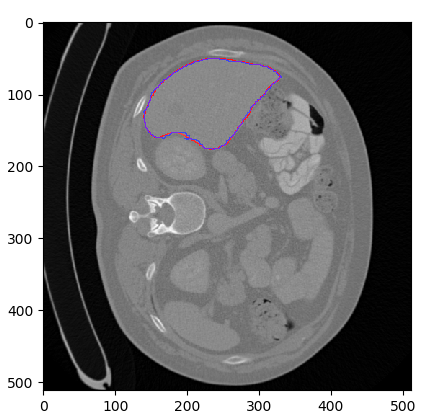 Figure 9
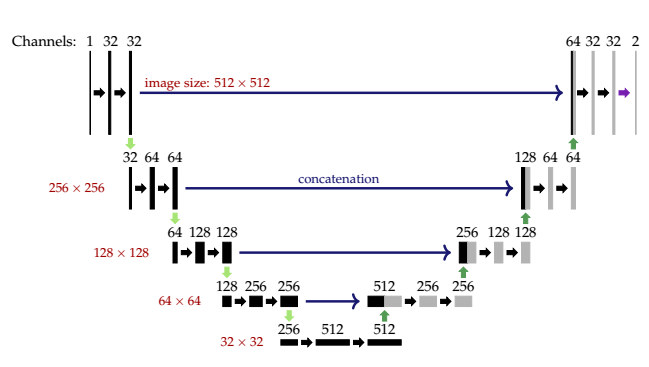 Figure 10
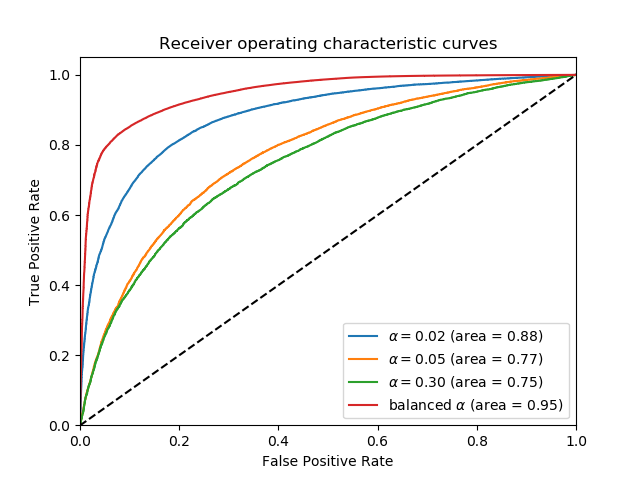 Figure 11
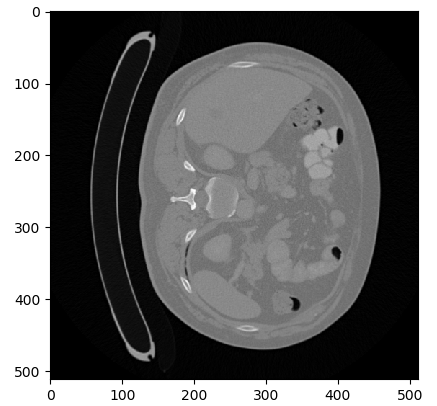 Figure 12
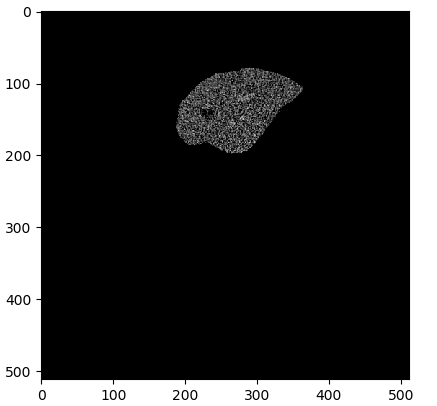 Figure 13
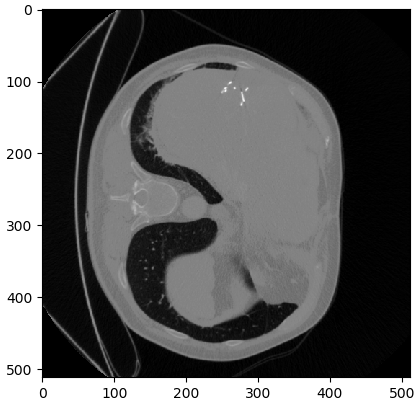 Figure 14
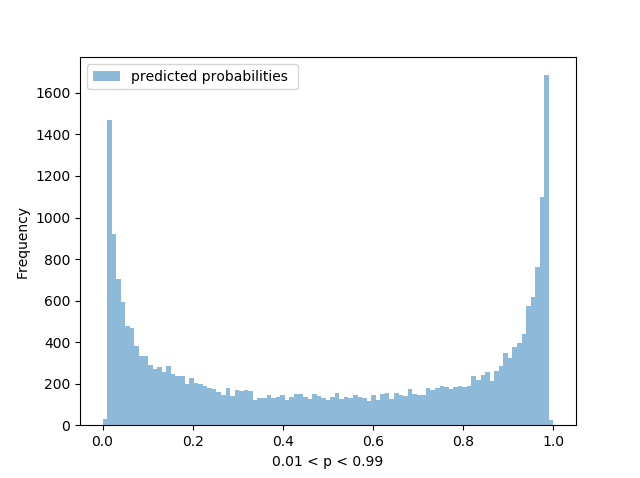 Figure 15
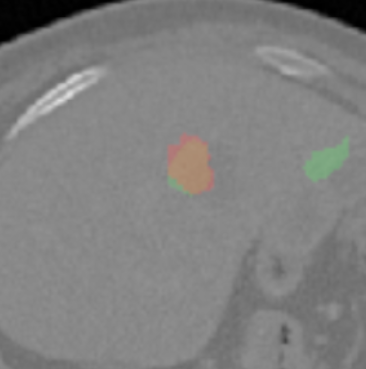 Figure 16
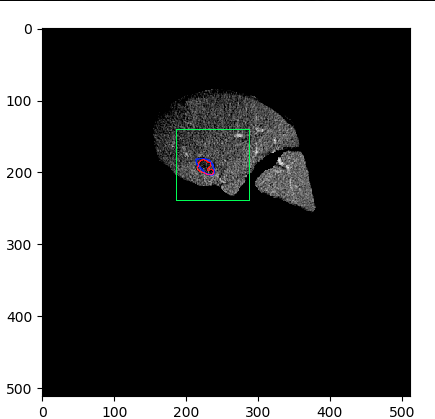 Figure 17
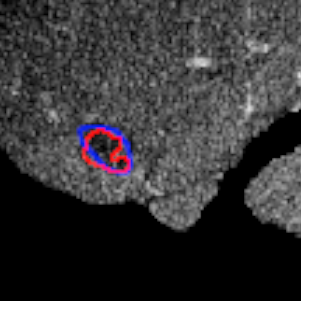 Figure 18
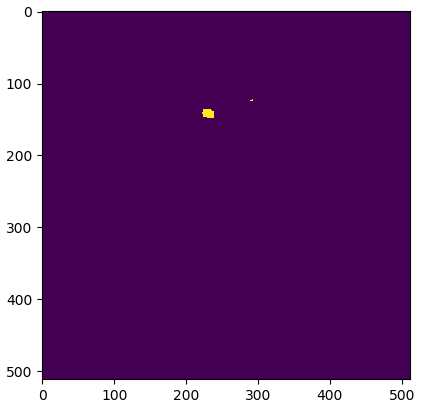 Figure 19
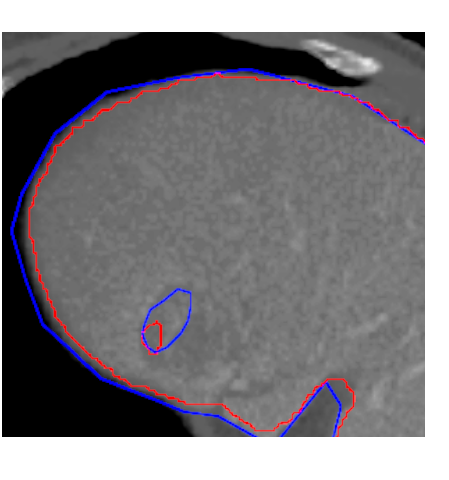 Figure 20
Peer Reviews
No public reviews on file for this paper yet. If you reviewed it on a platform where reviews are public (OpenReview, ICLR, NeurIPS, ICML), you can paste yours below so the community can read it here.
Videos
No videos yet. Explain this paper in a talk, walkthrough, or lecture? Add one.
A Joint Deep Learning Approach for Automated Liver and Tumor Segmentation
Nadja Gruber
Department of Mathematics, University of Innsbruck
Technikerstraße 13, 6020 Innsbruck, Austria
Stephan Antholzer
Department of Mathematics, University of Innsbruck
Technikerstraße 13, 6020 Innsbruck, Austria
Werner Jaschke
Department of Radiology
Medical University of Innsbruck
Anichststraße 35, 6020 Innsbruck
Christian Kremser
Department of Radiology
Medical University of Innsbruck
Anichststraße 35, 6020 Innsbruck
Markus Haltmeier
Department of Mathematics, University of Innsbruck
Technikerstraße 13, 6020 Innsbruck, Austria
(Version 2 (original submission: February 20, 2019))
Abstract
Hepatocellular carcinoma (HCC) is the most common type of primary liver cancer in adults, and the most common cause of death of people suffering from cirrhosis. The segmentation of liver lesions in CT images allows assessment of tumor load, treatment planning, prognosis and monitoring of treatment response. Manual segmentation is a very time-consuming task and in many cases, prone to inaccuracies and automatic tools for tumor detection and segmentation are desirable. In this paper, we compare two network architectures, one that is composed of one neural network and manages the segmentation task in one step and one that consists of two consecutive fully convolutional neural networks. The first network segments the liver whereas the second network segments the actual tumor inside the liver. Our networks are trained on a subset of the LiTS (Liver Tumor Segmentation) Challenge and evaluated on data provided from the radiological center in Innsbruck.
1 Introduction
Liver cancer remains associated with a high mortality rate, in part related to initial diagnosis at an advanced stage of disease. Prospects can be significantly improved by earlier treatment beginning, and analysis of CT images is a main diagnostic tool for early detection of liver tumors. Manual inspection and segmentation is a labor- and time-intensive process yielding relatively imprecise results in many cases. Thus, there is interest in developing automated strategies to aid in the early detection of lesions. Due to complex backgrounds, significant variations in location, shape and intensity across different patients, both, the automated liver segmentation and the further detection of tumors, remain challenging tasks.
Semantic segmentation of CT images has been an active area of research over the past few years. Recent developments of deep learning have dramatically improved the performance of artificial intelligence. Deep learning algorithms, especially deep convolutional neural networks (CNN) have considerably outperformed their competitors in medical imaging. One of the most successful CNNs architectures is the s-called U-Net [1], which has won several competitions in the field of biomedical image segmentation.
We investigate a deep learning strategy that jointly segments the liver and the lesions in CT images. As in [2], we use a network formed of two consecutive U-Nets. The first network performs liver segmentation, while the second one incorporates the output of the first network and segments the lesion. We propose a joint weighted loss function combining the outputs of both networks. The network is trained on a subset of the LiTS (Liver Tumor Segmentation Challenge) and evaluated on different data collected at the radiological center in Innsbruck. For our initial experiments, we perform consecutive training, with which we already obtain quite accurate results.
2 Joint Deep Learning Approach
The overall architecture of the model yielding more accurate results is illustrated in Figure1.1. For the semantic segmentation task of liver and tumor, we propose a model consisting of two modified U-Nets. Related FCN architectures have been proposed in [3, 4, 5, 2].
2.1 One-Step U-Net Architecture
As a first attempt we apply a very intuitively and straight-forward workflow which is visualized in Figure 2.1. The preprocessed images are fed into the network. The depicted segmentation problem can be regarded as multi-class label classification whereas each pixel must be assigned a certain probability of belonging to class tumor, liver or other tissue. Since U-Net is known to handle semantic segmentation tasks of medical images very well, we decided to start with this quite obvious approach. In contrast to the mathematical modelling (see 2.3) of the deep learning approach illustrated in 1.1 we generate segmentation masks representing binary images, where class label stands for tumor, liver and other tissue, respectively. The goal is to find a parameter set such that the network
[TABLE]
fulfils , and .
2.2 Sequential U-Net Architecture
The following approach is to implement a model using two U-Nets , , one on top of the other. The combined network architecture is shown in Figure 1.1. The inputs for both CNNs are grey-scale images of size and their outputs are binary images of size . While the input of the first U-Net is of the form displayed in Figure 3.1, the input of the second U-Net is produced by the output of the first one as explained in Section 2.3.
In both networks, the input passes through an initial convolution layer and is then processed by a sequence of convolution blocks at decreasing resolutions (contracting path). The expanding path of the U-Net then reverses this downsampling process. Skip connections between down- and upsampling path intend to provide local information to the global information while upsampling. As final step the output of the network is passed to a linear classifier that outputs (via sigmoid) a probability for each pixel being within the liver/tumor. The model is implemented in Keras111https://keras.io/ with the TensorFlow backend222https://www.tensorflow.org/.
2.3 Mathematical Modelling
In the following, let and denote the set of training images and the corresponding segmented images, respectively. Here the label stand for liver, for tumor and [math] for background. For the task of semantic liver and tumor segmentation, we generate segmentation masks
[TABLE]
representing binary images where class label 1 stands for the liver or tumor, and binary images where class label stands for tumor.
Our approach is to train two networks
[TABLE]
that separately perform liver and tumor segmentation. In the fist step, the network is applied such that . After decision making by selecting a threshold , we obtain a liver mask that is applied to each input image. Additionally, we applied windowing pointwise to the intensity values, which results in new training data
[TABLE]
These data serve as input and corresponding ground truth for training the second network . By selecting another threshold, a mask for the tumors is given.
The final classification can be performed in assigning a pixel to class label if , to class label if and , and class label 0 otherwise. The goal is to find the high dimensional parameter vectors and such that the overall classification error is small. This is achieved by minimizing a loss function that describes how well the network performs on the training data. Here we propose to use the joint loss function
[TABLE]
where denotes the categorical cross-entropy-loss and the constant weights the importance of the two classification outcomes. It has been demonstrated in [6] that a joint loss function can improve results compared to sequential approaches for joint image reconstruction and segmentation.
2.4 Optimization of the Models
The One-Step architecture introduced in 2.1 is pre-trained for 50 epochs applying categorical-cross-entropy loss and fine-tuned for further 30 epochs using the balanced version of the loss stated (see 2.4). Balanced loss proved very useful in detecting the lesion for both methods.
As already mentioned, the second approach works sequentially, which means that first we optimize and then use the output of as input for . Specifically, for training the second U-Net we minimize
[TABLE]
Here is the value of at pixel , and the indicator function declares whether belongs the the class tumor or not. The weight controls the relative importance assigned to the two classes. The best results for both models are achieved by applying balanced loss, whose weights have the form
[TABLE]
for for the model described in 2.2. The coefficients and computed as
[TABLE]
denote the balanced class weights for tumor, liver and other tissue respectively, applied in the method depicted in 2.1.
Both models have been trained using stochastic gradient decent with momentum for 300 and 600 epochs, respectively. Each iteration takes about 70 seconds on NVIDIA standard GPU. To avoid overfitting, we applied a dropout of in the upsampling path. Both U-Nets were trained with a learning rate of 0.001 and categorical cross-entropy loss. Since the tumor area only accounts for a small area compared to the full size of the image, we applied balanced loss (2.4) in a second optimization of the network and reduced the learning rate to 0.0001. Comparison with the joint loss (2.1) is subject of future work.
3 Experimental Results
3.1 Datasets
The network training is run using a subset of the publicly available LiTS-Challenge333https://competitions.codalab.org/competitions/17094dataset containing variable kinds of liver lesions (HCC, metastasis, …). The dataset consists of CT scans coming from different clinical institutions. Trained radiologists have manually segmented annotation of the liver and tumors. All of the volumes were enhanced with a contrast agent, imaged in the portal venous phase. Each volume contains a variable number of axial slices with a resolution of pixels and an approximate slice thickness ranging from 0.7 to . The training is applied on 765 axial slices, 50 are used for validation and 50 for testing.
Further test data is provided by radiological center at the medical university of Innsbruck. The dataset contains CT scans of patients suffering from HCC and the belonging reference annotations were drafted by medical scientists. Because deep learning algorithms achieve better performance if the data has a consistent scale or distribution, all data are standardized to have intensity values between before starting the optimization.
3.2 Evaluation on Test Data
Each pixel of the image is assigned to one of the two classes liver/other tissue and tumor/other tissue, respectively, with a certain probability. Results of the automated liver and tumor segmentation are visualized in Figure 3.2. Comparison with ground truth and segmented liver and tumor give rise to the assumption that our approach is highly promising for obtaining high performance metrics. To qualitatively evaluate performance, we applied some of the commonly used evaluation metrics in semantic image segmentation. Performance metrics are summarized in Table 1.
3.2.1 AUC metric
Area under ROC Curve (AUC) is a performance metric for binary classification problems. We applied ROC analysis to find the threshold that achieves the best results for the tumor segmentation task. Due to the very low rate of false classified pixels (most of them has probability close to one or close to zero), we decided to restrict the ROC curve to pixels whose probability for belonging to class tumor lies between 0.01 and 0.99.
In Figure 3.4 we can see that the best restricted AUC value (rAUC) conducting is achieved by a very small value of . We further calculated the corresponding threshold and could achieve an improvement of the tumor segmentation results [7].
3.2.2 Intersection over Union
For a more complete evaluation of the segmentation results we use class accuracy in conjunction with the so called IoU metric. The latter is essentially a method to quantify the percent overlap between the ground truth and the prediction output. The IoU measure gives the similarity between predicted and ground-truth regions for the object of interest. The formula for quantifying the IoU score is:
[TABLE]
where TP, FP and FN denote the True Positive Rate, False Positive Rate and False Negative Rate, respectively.
Since the segmentation task can be regarded as clustering of pixels, Rand index [8], which is a measure of the similarity between two data clusterings, has been proposed as a measure of segmentation performance. By and two segmentations are notated. In the following paragraph denotes the ground truth and the segmentation results obtained by the joint network. The function is defined as if pixels and are in same class and otherwise. One can see that small differences in the location of object boundaries will increase the rand error slightly while merging or splitting of objects lead to a big increase of the Rand error.
We evaluate this model under usage of test and validation set from LiTS-Challenge and Innsbruck data ( images). The evaluation metrics are summarized in Table 1. The liver segmentation evaluation scores indicate that our models, especially perform remarkable good, provided that the sequential approach outperforms the One-Step method primarily in the tumor segmentation task. in Pixel accuracy, Intersection over union (IoU) and Rand Index (RI) have values very close to . IoU and Rand Index performance score of the tumor segmentation show that the application of balanced loss with , achieves the best results.
[TABLE]
4 Conclusions
We presented two deep learning frameworks for the automated joint liver and tumor segmentation. Segmentation metrics evaluate the segmentation of detected lesions and are comprised of a restricted AUC, an overlap Index (IoU) and Rand Index (RI). The first model manages segmentation of tumor and lesion in one step and works very convenient and fast but, as becomes clear from visualizations and evaluation metric scores, it is prone to misclassification, especially in the tumor segmentation task. The second model proposed in this paper works sequentially and clearly outperforms the one-step method. Another interesting topic to address is the classification of the tumors detected by a deep learning algorithm.
The reference list from the paper itself. Each links out to its DOI / PubMed record.
- 1[1] O. Ronneberger, P. Fischer, and T. Brox, “U-net: Convolutional networks for biomedical image segmentation,” in International Conference on Medical image computing and computer-assisted intervention . Springer, 2015, pp. 234–241.
- 2[2] P. F. Christ, F. Ettlinger et al. , “Automatic liver and tumor segmentation of ct and mri volumes using cascaded fully convolutional neural networks,” ar Xiv:1702.05970 , 2017.
- 3[3] E. Vorontsov, A. Tang, C. Pal, and S. Kadoury, “Liver lesion segmentation informed by joint liver segmentation,” in Biomedical Imaging (ISBI 2018), 2018 IEEE 15th International Symposium on . IEEE, 2018, pp. 1332–1335.
- 4[4] X. Han, “Automatic liver lesion segmentation using a deep convolutional neural network method,” ar Xiv:1704.07239 , 2017.
- 5[5] G. Chlebus, A. Schenk, J. H. Moltz, B. van Ginneken, H. K. Hahn, and H. Meine, “Deep learning based automatic liver tumor segmentation in ct with shape-based post-processing,” 2018.
- 6[6] J. Adler, S. Lunz, O. Verdier, C.-B. Schönlieb, and O. Öktem, “Task adapted reconstruction for inverse problems,” ar Xiv:1809.00948 , 2018.
- 7[7] R. Kumar and A. Indrayan, “Receiver operating characteristic (roc) curve for medical researchers,” Indian pediatrics , vol. 48, no. 4, pp. 277–287, 2011.
- 8[8] V. Jain, B. Bollmann, M. Richardson, D. R. Berger, M. N. Helmstaedter, K. L. Briggman, W. Denk, J. B. Bowden, J. M. Mendenhall, W. C. Abraham et al. , “Boundary learning by optimization with topological constraints,” in Computer Vision and Pattern Recognition (CVPR), 2010 IEEE Conference on . IEEE, 2010, pp. 2488–2495.