Competing Time Scales Lead to Oscillations in Shear-Thickening Suspensions
J. A. Richards, J. R. Royer, B. Liebchen, B. M. Guy, W. C. K. Poon

TL;DR
This paper demonstrates that the interaction between instrument inertia and particle contact formation causes shear-rate oscillations in shear-thickening suspensions, revealing new insights into flow behavior and contact dynamics.
Contribution
It introduces a model linking instrument inertia and contact formation time scales to oscillations, validated by experiments, and provides a method to measure contact relaxation times.
Findings
Oscillations depend on the interplay of two time scales.
Oscillation frequency measures contact relaxation time.
Flow curve access is extended beyond conventional rheometry.
Abstract
Competing time scales generate novelty. Here, we show that a coupling between the time scales imposed by instrument inertia and the formation of inter-particle frictional contacts in shear-thickening suspensions leads to highly asymmetric shear-rate oscillations. Experiments tuning the presence of oscillations by varying the two time-scales validate our model. The observed oscillations give access to a shear-jamming portion of the flow curve that is forbidden in conventional rheometry. Moreover, the oscillation frequency allows us to quantify an intrinsic relaxation time for particle contacts. The coupling of fast contact network dynamics to a slower system variable should be generic to many other areas of dense suspension flow, with instrument inertia providing a paradigmatic example.
Click any figure to enlarge with its caption.
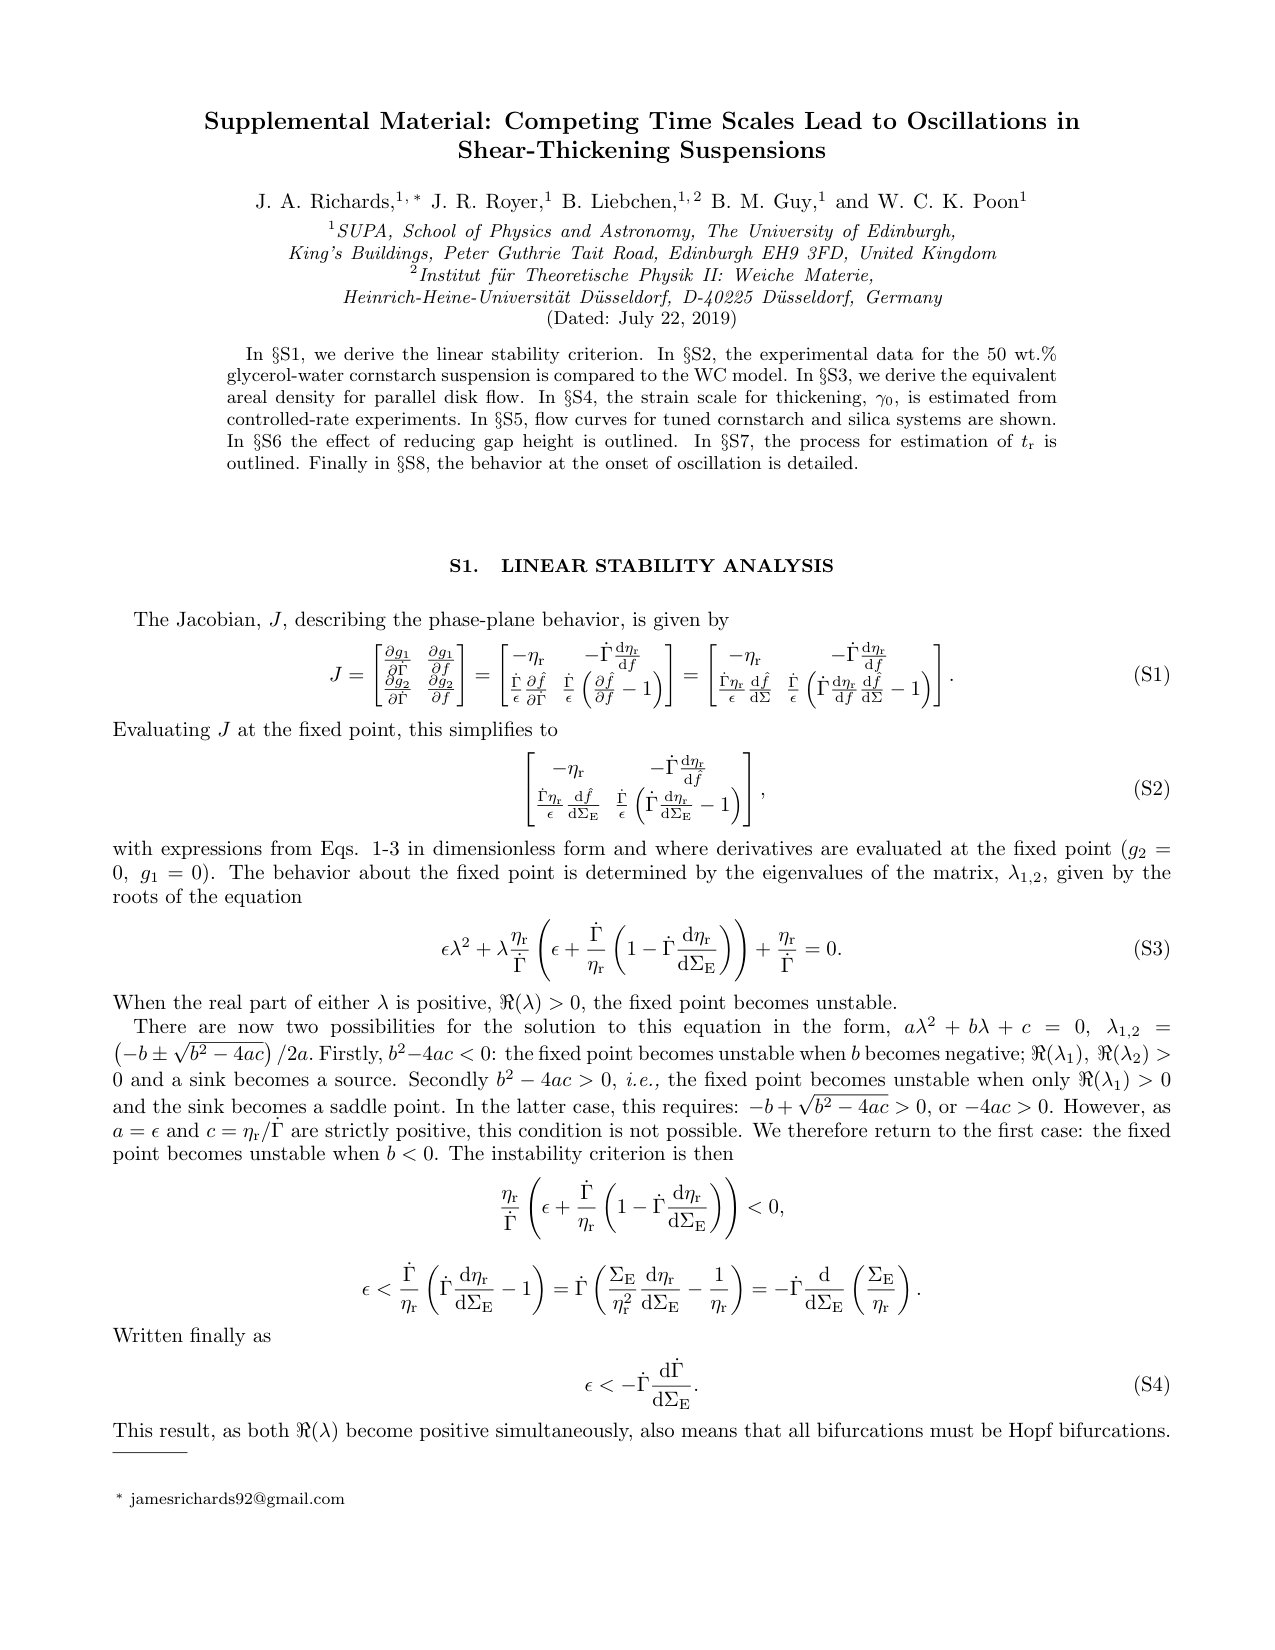 Figure 1
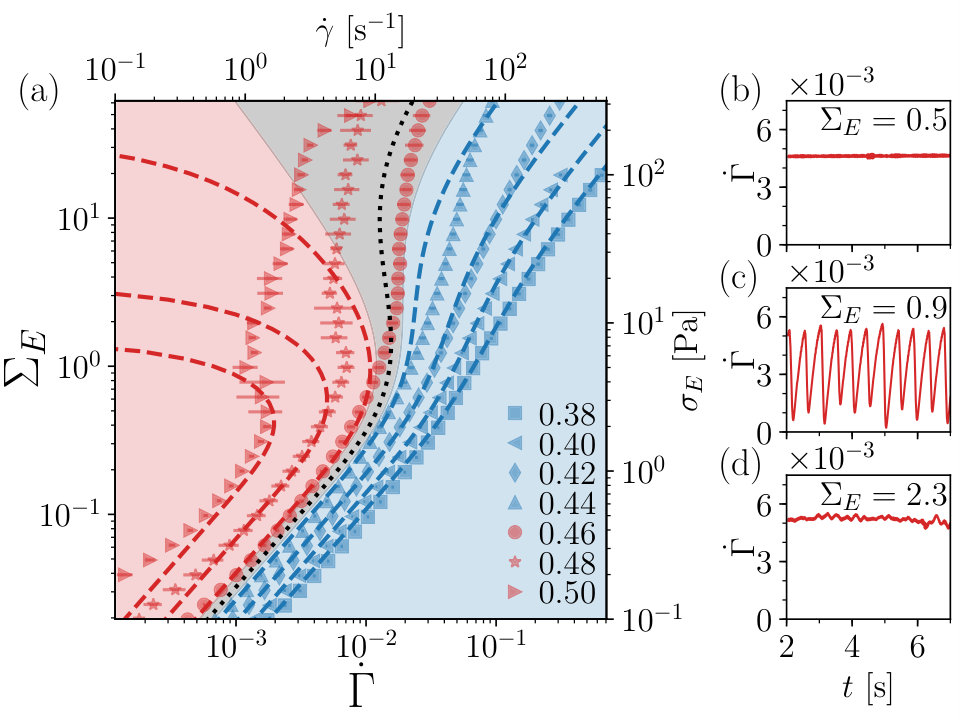 Figure 1
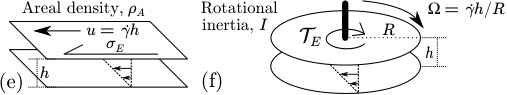 Figure 1
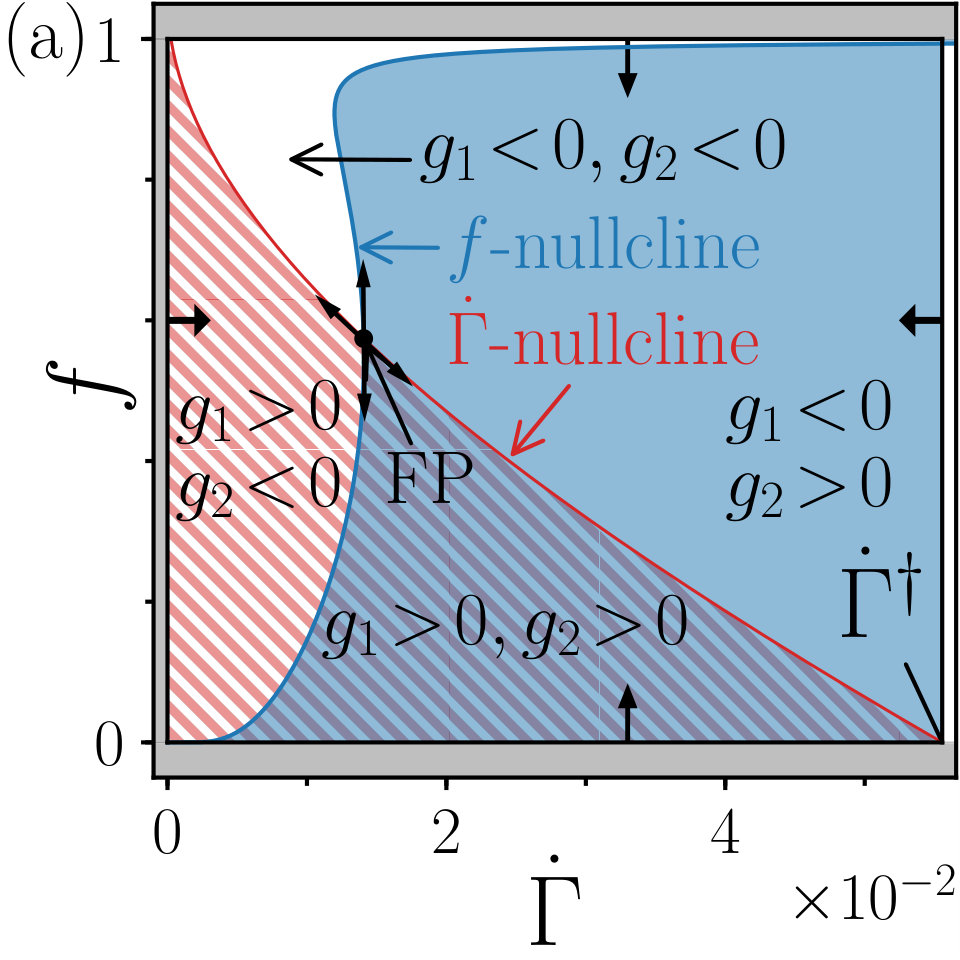 Figure 2
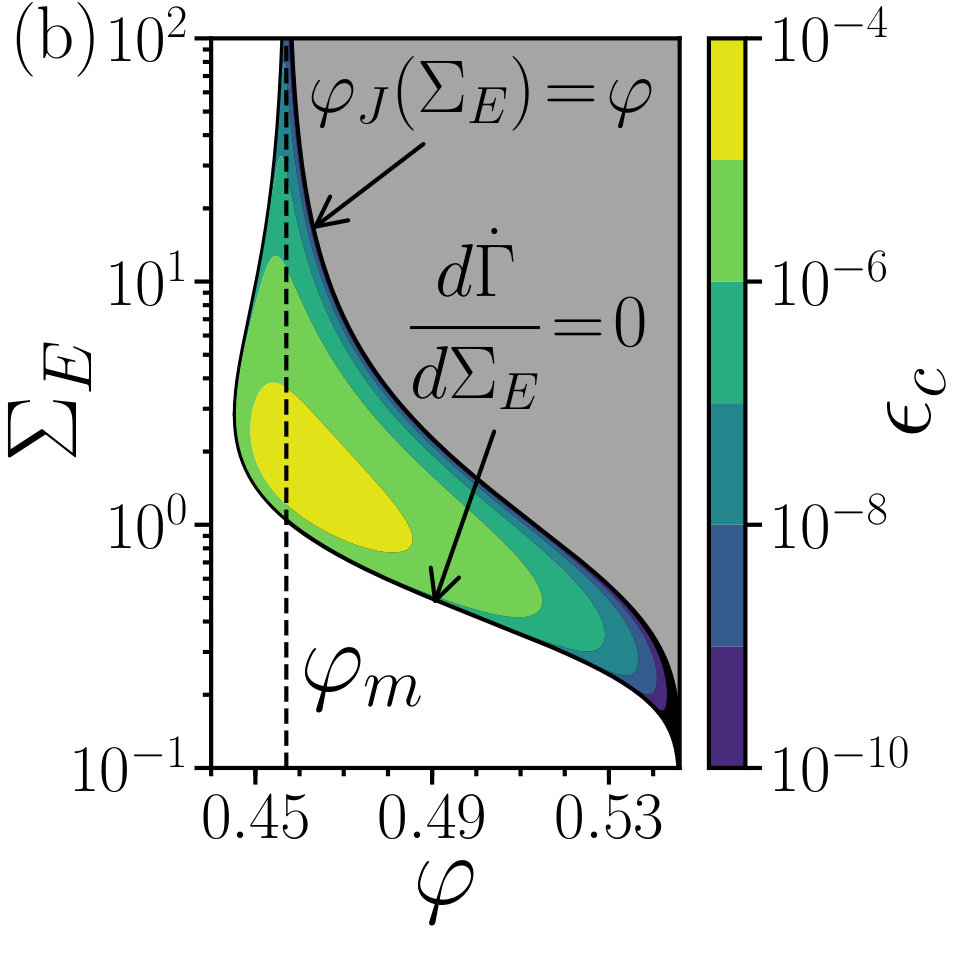 Figure 2
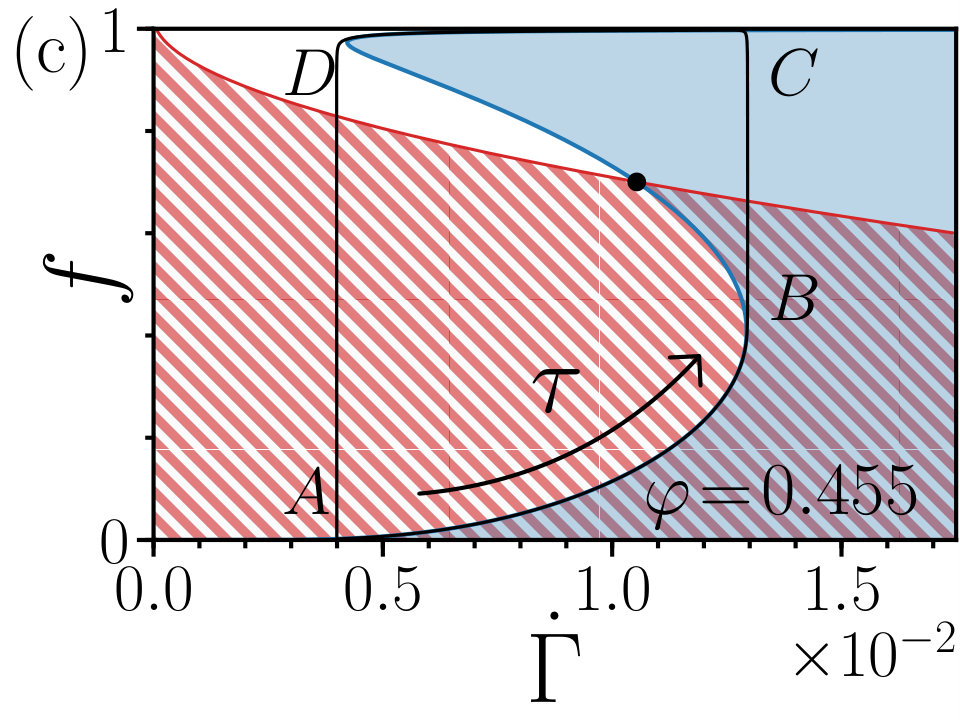 Figure 2
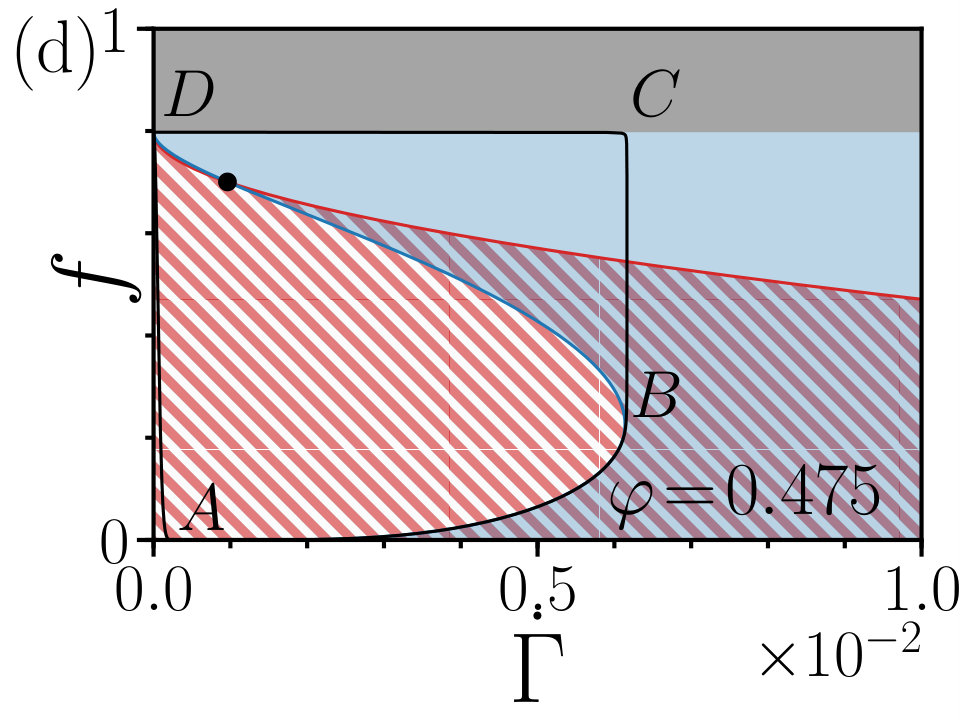 Figure 2
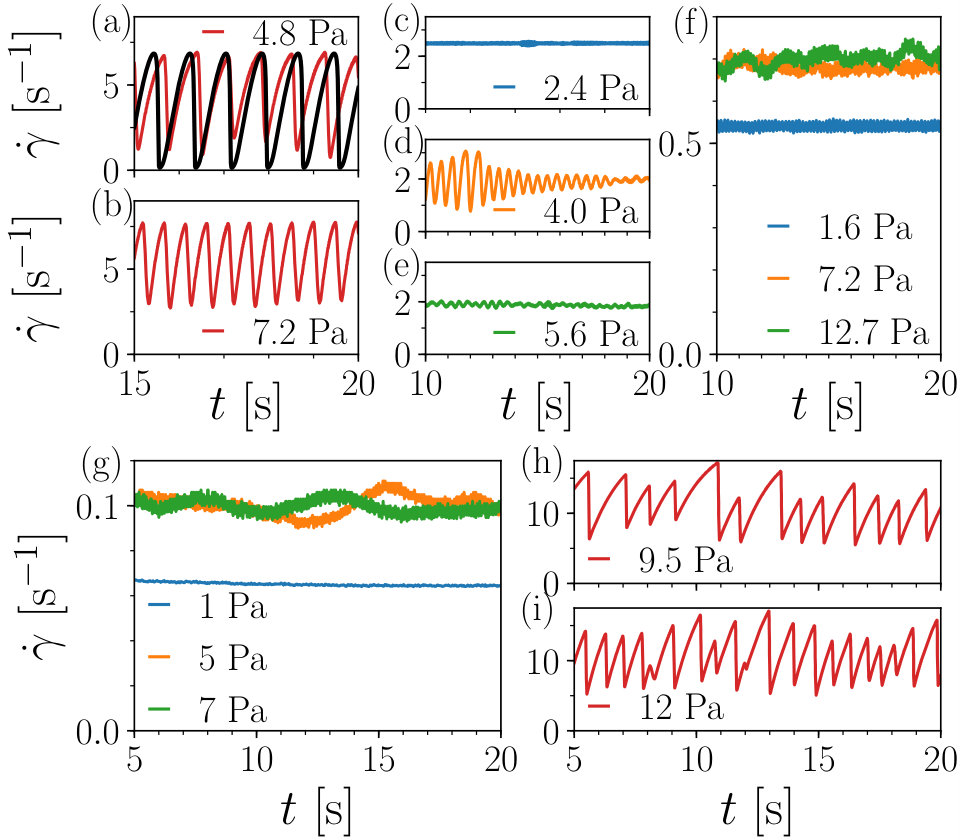 Figure 3
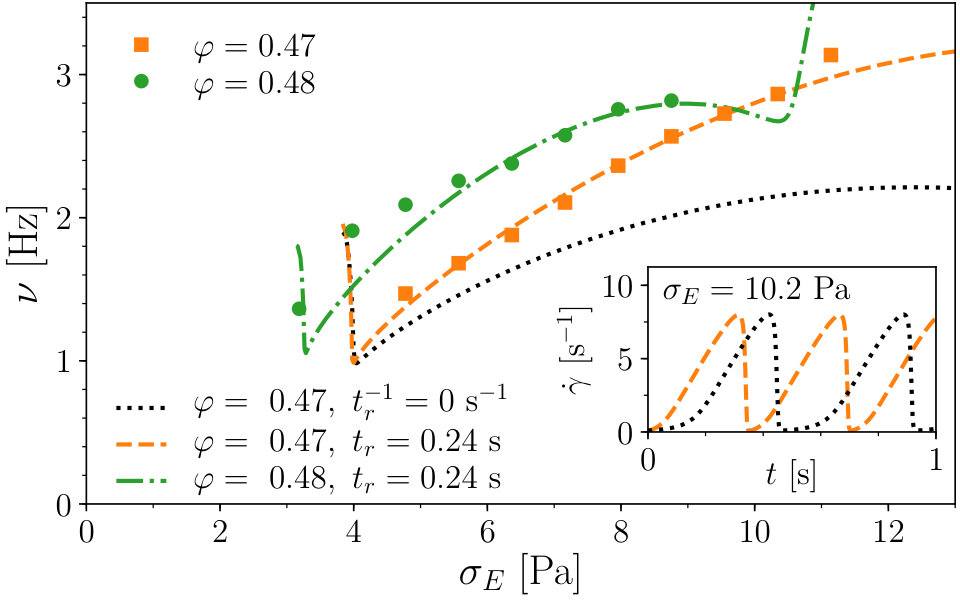 Figure 4
Peer Reviews
No public reviews on file for this paper yet. If you reviewed it on a platform where reviews are public (OpenReview, ICLR, NeurIPS, ICML), you can paste yours below so the community can read it here.
Videos
No videos yet. Explain this paper in a talk, walkthrough, or lecture? Add one.
Competing Time Scales Lead to Oscillations in Shear-Thickening Suspensions
J. A. Richards
J. R. Royer
SUPA, School of Physics and Astronomy, The University of Edinburgh, King’s Buildings, Peter Guthrie Tait Road, Edinburgh EH9 3FD, United Kingdom
B. Liebchen
SUPA, School of Physics and Astronomy, The University of Edinburgh, King’s Buildings, Peter Guthrie Tait Road, Edinburgh EH9 3FD, United Kingdom
Institut für Theoretische Physik II: Weiche Materie, Heinrich-Heine-Universität Düsseldorf, D-40225 Düsseldorf, Germany
B. M. Guy
W. C. K. Poon
SUPA, School of Physics and Astronomy, The University of Edinburgh, King’s Buildings, Peter Guthrie Tait Road, Edinburgh EH9 3FD, United Kingdom
Abstract
Competing time scales generate novelty. Here, we show that a coupling between the time scales imposed by instrument inertia and the formation of inter-particle frictional contacts in shear-thickening suspensions leads to highly asymmetric shear-rate oscillations. Experiments tuning the presence of oscillations by varying the two time-scales support our model. The observed oscillations give access to a shear-jamming portion of the flow curve that is forbidden in conventional rheometry. Moreover, the oscillation frequency allows us to quantify an intrinsic relaxation time for particle contacts. The coupling of fast contact network dynamics to a slower system variable should be generic to many other areas of dense suspension flow, with instrument inertia providing a paradigmatic example.
Concentrated suspensions of non-Brownian (or granular) particles in a Newtonian solvent occur widely in industry, e.g., concrete Van Damme (2018) mine tailings Boger (2009), and chocolate Afoakwa et al. (2007). Their viscosity, , often increases with either shear rate, , or stress, Denn and Morris (2014). Such shear thickening is now understood as a transition from a low-viscosity state, with lubricated particle contacts, to a high-viscosity state, with frictional contacts, as the repulsive force between particles is overcome at a critical onset stress, Mari et al. (2015a); Lin et al. (2015); Comtet et al. (2017); Clavaud et al. (2017).
A phenomenological model of this process by Wyart and Cates (WC) Wyart and Cates (2014) predicts three types of flow curve, . At low volume fraction, , a smooth increase connects two constant-slope (= viscosity) branches in , giving rise to continuous shear thickening (CST). Above a critical , becomes S-shaped, with a backwards-bending (d/d) region connecting the two branches, giving discontinuous shear thickening (DST). Finally, above some , has no flowing upper branch and it bends back to : the system shear jams at high stresses.
In the CST regime, suspensions flow steadily and homogeneously, and the WC model fits data from nearly-monodisperse hard-sphere systems Guy et al. (2015); Royer et al. (2016). In the DST regime, there is a jump in as the imposed is increased Bender and Wagner (1996), while under imposed , neither homogeneous nor shear-banded steady flow is possible Hermes et al. (2016). There is no general model for the system-specific flow in this regime. Recent experiments Saint-Michel et al. (2018); Rathee et al. (2017) and simulations Chacko et al. (2018) focus on banding: spatial variation with high- and low- regions. Many systems also show large temporal fluctuations Lootens et al. (2003), which sometimes begin as ‘relaxation oscillations’: periodically drops precipitously to a nearly-jammed state Larsen et al. (2014); Bossis et al. (2017, 2018), with a frequency that increases with applied stress Nagahiro et al. (2013); Hermes et al. (2016). We extend the WC model to account quantitatively for such oscillations.
The key physics is the competition between the dynamics of frictional contact formation and a ‘system variable’, here the acceleration of the rheometer geometry Larsen et al. (2014); Bossis et al. (2017). When the ratio of the time scale of the former to that of the latter is small, we predict homogeneous flow with relaxation-type oscillations. Fitting the observed -dependence of the oscillation frequency reveals and quantifies an additional time scale, that intrinsic to the relaxation of frictional contacts after formation. Thus, rheometer geometry inertia, often considered an artefact, can be used to probe suspensions near jamming.
WC introduced a stress-dependent steady-state fraction of frictional contacts, ; simulations Mari et al. (2014); Chacko et al. (2018) find
[TABLE]
with . controls the jamming point, , at which . Here we use weight fractions, , due to the porosity of our main model system (cornstarch) Han et al. (2017). At , , and the system jams at random close packing, . When , and the system jams at some . The WC model linearly interpolates between these two limits:
[TABLE]
The distance to jamming then determines via
[TABLE]
with the solvent viscosity. At a given weight fraction, increases with stress, lowering the jamming point, which in turn increases the viscosity, . At , the flow curve, , becomes -shaped, Fig. 1(a) (), with a region where d/d. At , shear jamming (SJ) is predicted, with the flow curve doubling back to when , Fig. 1(a) ( - -).
In non-steady flow, e.g. on reversal Lin et al. (2015); Peters et al. (2016), the contact network of the suspension takes finite time to adapt. Thus, the fraction of frictional contacts at any one instant, , may differ from its steady-state value, , given by Eq. 1, towards which relaxes. Simulations show that evolves with the accumulated strain Mari et al. (2015a); so following previous work Mari et al. (2015a); Nakanishi et al. (2012), we write
[TABLE]
with a characteristic strain, (and ). We now use Eqs. 2 and 3 to relate to , rather than just .
External stress, , is applied through the system boundaries. In a rheometer, this is the ‘geometry’, which has far higher mass than the suspension for a typical gap height, , between the boundaries Läuger and Stettin (2016), Fig. 1(e). In the steady state, , the sample stress, . When , force balance between the geometry and the sample gives
[TABLE]
with the geometry’s areal density. Equations 4 and 5, being two-dimensional, cannot capture aperiodic flow, but can account for -oscillations and elucidate the physics of unsteady flow in shear-thickening suspensions.
Measuring time in units of the geometry inertial time scale, , we rewrite Eqs. 5 & 4 as:
[TABLE]
where . Other dimensionless variables are shear rate, ; applied stress, ; viscosity, ; sample stress, ; and, strain, .
The time scale for contact network formation, , competes with the inertial time, yielding our key dimensionless parameter,
[TABLE]
When , i.e. , Eqs. 6 and 7 form a singular autonomous system Hinch (1991), which may undergo a Hopf bifurcation to show relaxation oscillations as the control parameter is varied Baer and Erneux (1986).
For a given and , a fixed point occurs where the nullclines and intersect, Fig. 2(a). Analysing the Jacobian Scheinerman (1996), , shows that this fixed point is unstable if
[TABLE]
which, since , requires d/d, i.e. a backwards-bending flow curve, see Supplemental Material for derivation SM . Thus, the DST-boundary (d/d=0) forms the lower boundary of our region of potential instability, Fig. 2(b). The upper boundary of this occurs at shear jamming, , where the flow curve touches the vertical axis so that . Above this boundary, no flow is possible. Between these two boundaries, peaks at : instability may occur between DST and shear jamming whenever 111 is found from the maximum numerically calculated in Fig. 2(b) with and .. Physically, at such small (i.e. ), the suspension thickens before the geometry slows, so the sample stress rises, driving higher and causing further thickening in a vicious cycle, pushing the system away from the steady state.
We now describe our dynamical system by phase-plane trajectories that depend parametrically on . Consider the regime with S-shaped flow curves, Fig. 1(a) (- -). The -nullcline, Fig. 2(a), reflects the shape of the steady-state flow curve 222As there is a one-to-one dependence of to on the -nullcline, , see Eq. 7.. Equations 6 and 7 show that trajectories point inwards everywhere on the rectangle defined by , (where the -nullcline intersects the axis), and , Fig. 2(a). However, trajectories point outwards on any infinitesimally-small loop around the fixed point if it is unstable. The Poincaré-Bendixson Theorem Scheinerman (1996) then predicts a limit cycle in the region depicted in Fig. 2(a) if .
A numerically-calculated limit cycle after the onset of DST is shown in Fig. 2(c). To understand this cycle, divide Eq. 7 by Eq. 6 to obtain
[TABLE]
If , Eq. 10 requires dd (vertical lines) or (-nullcline). If , starting at , the system follows the -nullcline (), Fig. 2(c), at a rate controlled by (Eq. 6). At , the system jumps vertically to join the ‘upper branch’ of the -nullcline at . It now follows the ‘upper branch’ of the -nullcline () until it reaches , where it drops vertically to , and the process repeats: we have a limit cycle. As a consistency check, the ‘jump’ and hence the limit cycle relies on not changing () as a large number of frictional contacts form and the suspension shear thickens (), i.e. , as assumed.
At , Fig. 2(d), the ‘jump’ from takes the suspension towards jamming, at , whereupon abruptly goes to zero, giving a horizontal ‘jump’ to , from where the system drops back to on the -nullcline, again giving a limit cycle. Note that the part of our limit cycle probes our system close to jamming. Unlike in conventional steady-state rheology Fall et al. (2010), our system should remain homogeneous: the time needed to traverse is simply too short to allow finite particle migration.
To validate our model, we first characterized a shear-thickening suspension known to show oscillations Hermes et al. (2016). Cornstarch (Sigma Aldrich, particle diameter 14\text{,}\mathrm{\SIUnitSymbolMicro m} and polydispersity $\approx$ 40% from static light scattering Hermes *et al.* ([2016](#bib.bib13))) was dispersed into 50 wt.% glycerol-water ($\eta_{s}=$6\text{\,}\mathrm{m}\mathrm{P}\mathrm{a}\,\mathrm{s}). We used a TA Instruments DHR-2 with roughened parallel plates (radius 20\text{,}\mathrm{m}\mathrm{m} and $h=$1.0\text{\,}\mathrm{m}\mathrm{m} for flow curves, for time dependence), Fig. 1(f). Rim shear rates, , and apparent stresses, , come from the applied torque, , and measured angular velocity, . Cornstarch particles are porous Han et al. (2017); so we quote weight fractions, , using freshly-prepared samples and monitoring reproducibility.
The WC model captures credibly the time-averaged flow curves of this system for , Fig. 1(a) (- -), with , , and determined from fitting the steady-state rheology (see SM SM ), averaging 3 upsweeps at 10pts./decade from to fracture with average and delay, separately ensuring reversibility. At , the WC model works until the predicted flow curve bends backwards, Fig. 1(a) ( - -). Up to this point, the flow is steady: is constant in time, Fig. 1(b). At higher stress, the flow starts to oscillate, Fig. 1(c), before becoming aperiodic, Fig. 1(d) Hermes et al. (2016).
The measured geometry moment of inertia, , gave 175\text{,}\mathrm{kg}\text{,}{\mathrm{m}}^{-2} [SM ](#bib.bib30). Imposed-rate experiments gave $\gamma_{0}=\mathcal{O}(10^{-1})$ [SM ](#bib.bib30). Thus, $t_{c}=$1.1\text{\times}{10}^{-4}\text{\,}\mathrm{s}, 44\text{,}\mathrm{s}$$, and , far below the for observing instability when . Solving Eqs. 6 and 7 numerically at and , we find relaxation oscillations quantitatively matching experiments with no free parameters, Fig. 3(a).
Next, we varied by increasing the solvent glycerol proportion, see SM for time-averaged rheology SM . For 15\text{,}\mathrm{mPa}\text{,}\mathrm{s}, $\epsilon\sim 2\times 10^{-5}\gtrsim\epsilon_{c}^{\max}$, only damped oscillations in a narrow stress range were observed, Fig. [3](#S0.F3)(c)-(e). For $\eta_{s}=$75\text{\,}\mathrm{mPa}\text{\,}\mathrm{s}, , no shear-rate oscillations are seen at stresses and weight fractions in the DST-regime, Fig. 3(f). Oscillations could also be eliminated by only reducing (increasing , see SM SM ), however large variation of is restricted by rheometer design. We also studied shear-thickening silica suspensions (diameter ) Royer et al. (2016), in which oscillations have not been reported before. Experiments were performed using an Anton-Paar MCR302 in a parallel-plate geometry (20\text{,}\mathrm{mm}1.5\text{,}\mathrm{mm}) with $\rho_{A}=$400\text{\,}\mathrm{k}\mathrm{g}\mathrm{m}^{-2}, see SM for details SM . In 87 wt.% glycerol-water with 151\text{,}\mathrm{mPa}\text{,}\mathrm{s}$$ and , no oscillations were seen, Fig. 3(g). Reducing to using a dimethyl sulfoxide-water mixture, giving , we found relaxation oscillations, Figs. 3(h) and 3(i). All our available data are consistent with the predicted for instability.
Figure 3(a) pertains to at the onset of DST. As increases beyond this point, the oscillation frequency, , increases Hermes et al. (2016), and the agreement between model and experiment worsens, Fig. 4. As the system comes ever closer to jamming at each precipitous drop in , the strain-dependent ansatz for -relaxation, Eq. 4, becomes increasingly ineffective. The predicted time taken to traverse in the limit cycle, Fig. 2(d), is lengthened compared to reality (cf. slow onset in Fig. 4 inset).
We therefore infer the existence of an additional intrinsic, strain-independent, mechanism for relaxing towards its steady-state value Maharjan and Brown (2017) and modify Eq. 4 to read
[TABLE]
with a new relaxation time . There are now two contact relaxation mechanisms, dependent on strain () or time (). The latter dominates as , near jamming, so the time taken for shortens, decreasing the period of the limit cycle, as observed.
Fitting the data with this new model, Fig. 4 333The initial frequency spike predicted by the model, associated with small-amplitude limit cycles not seen experimentally SM , is neglected., gives SM . Since , the strain-dependent mechanism dominates away from jamming SM . Interestingly, is comparable to the relaxation time for cornstarch grains pushed into adhesive contact, , so that surface chemistry matters Oyarte Gálvez et al. (2017).
The mechanism we propose for relaxation oscillations in shear-thickening suspensions, depending on flow-curve shape and geometry inertia, appears generic. It is therefore perhaps a puzzle why such oscillations have not been more widely reported. One reason is the use of high-viscosity solvents, thus giving . More prevalent could be the breakdown of simple shear flow where surface tension no longer confines the particles as sample stress peaks Brown and Jaeger (2012); Guy et al. (2015) at in the limit cycle, Fig. 2(d), causing fracture Strivens (1976). With only two dynamical variables, lacking spatial variation, our model cannot capture such inhomogeneous flow. It nevertheless well captures the development of relaxation oscillations en route to aperiodic unsteady flows, which are widely seen Saint-Michel et al. (2018); Rathee et al. (2017); Lootens et al. (2003); Pan et al. (2015).
Our model generalized to Eq. 11 has allowed us to extract an intrinsic contact-relaxation time scale, , which is difficult to access using other methods such as shear reversal Lin et al. (2015) or cessation Maharjan and Brown (2017) due to instrument artifacts. Instead, our method of accessing relies on modelling the coupling with one such artifact, viz., geometry inertia. becomes important in modelling the flow properties whenever the suspension comes close to jamming and the shear rate drops. With our protocol for extracting this relaxation time, future work should be able to clarify the underlying physical mechanism, which may include particle softness Ness and Sun (2016), surface chemistry James et al. (2018) or long-range repulsion Mari et al. (2015b).
Finally, coupling between fast frictional-contact-network dynamics and a slower ‘system variable’, and hence the resulting types of behavior, should be found in many types of dense suspension flow. Thus, for example, in vorticity banding, particle migration is slow Chacko et al. (2018); in micro-channel oscillations, rearrangement due to fluid permeation is slow Isa et al. (2009); Kanehl and Stark (2017); in the settling of a ball in a suspension, the ball’s inertial dynamics are slow von Kann et al. (2011). Interestingly, relaxation-type oscillations, with periodic bursts of brief near-jamming episodes, have been observed in the pipe flow of polymethylmethacralate particles Isa et al. (2009), the settling velocity of a ball in cornstarch von Kann et al. (2011) and the shear rheology of polystyrene particles Larsen et al. (2014) (compare especially data presented in the latter two cases with, e.g., our Fig. 2(c)). It is therefore possible, perhaps likely, that the kind of physics we have modelled may be relevant far beyond the data sets presented here.
The data plotted in this work are available from Edinburgh DataShare Dat (2019).
Acknowledgements.
Acknowledgements: This research was funded by the UK Engineering and Physical Sciences Research Council (EPSRC) [grant numbers EP/J007404/1, EP/N025318/1, EP/L015536/1] and supported in part by the National Science Foundation under Grant No. NSF PHY-1748958 through the KITP program on the Physics of Dense Suspensions. J.A.R. acknowledges funding from the EPSRC Centre for Doctoral Training in Soft Matter and Functional Interfaces (SOFI CDT) and AkzoNobel.
The reference list from the paper itself. Each links out to its DOI / PubMed record.
- 1Van Damme (2018) H. Van Damme, Cem. Concr. Res. 112 , 5 (2018) . · doi ↗
- 2Boger (2009) D. V. Boger, Chem. Eng. Sci. 64 , 4525 (2009) . · doi ↗
- 3Afoakwa et al. (2007) E. O. Afoakwa, A. Paterson, and M. Fowler, Trends Food Sci. Technol. 18 , 290 (2007) . · doi ↗
- 4Denn and Morris (2014) M. M. Denn and J. F. Morris, Annu. Rev. Chem. Biomol. Eng. 5 , 203 (2014) . · doi ↗
- 5Mari et al. (2015 a) R. Mari, R. Seto, J. F. Morris, and M. M. Denn, Phys. Rev. E 91 , 052302 (2015 a) . · doi ↗
- 6Lin et al. (2015) N. Y. C. Lin, B. M. Guy, M. Hermes, C. Ness, J. Sun, W. C. K. Poon, and I. Cohen, Phys. Rev. Lett. 115 , 228304 (2015) . · doi ↗
- 7Comtet et al. (2017) J. Comtet, G. Chatté, A. Niguès, L. Bocquet, A. Siria, and A. Colin, Nat. Commun. 8 , 15633 (2017) . · doi ↗
- 8Clavaud et al. (2017) C. Clavaud, A. Bérut, B. Metzger, and Y. Forterre, Proc. Natl. Acad. Sci. U.S.A. 114 , 5147 (2017) . · doi ↗