The Spectral Energy Distributions of Active Galactic Nuclei
M. J. I. Brown, K. J. Duncan, H. Landt, M. Kirk, C. Ricci, N. Kamraj

TL;DR
This paper constructs and tests spectral energy distributions (SEDs) of active galactic nuclei across multiple wavelengths, demonstrating improved accuracy in photometric redshift estimation compared to previous models.
Contribution
The work introduces a new set of AGN SEDs spanning 0.09 to 30 microns, including Seyfert-like spectra, and benchmarks their effectiveness in photometric redshift determination.
Findings
SEDs outperform previous models in redshift accuracy
Constructed 41 individual and 80 Seyfert-like AGN SEDs
Extended SEDs into X-ray and radio wavelengths
Abstract
We present ongoing work on the spectral energy distributions (SEDs) of active galactic nuclei (AGNs), derived from X-ray, ultraviolet, optical, infrared and radio photometry and spectroscopy. Our work is motivated by new wide-field imaging surveys that will identify vast numbers of AGNs, and by the need to benchmark AGN SED fitting codes. We have constructed 41 SEDs of individual AGNs and 80 additional SEDs that mimic Seyfert spectra. All of our SEDs span 0.09 to 30 microns, while some extend into the X-ray and/or radio. We have tested the utility of the SEDs by using them to generate AGN photometric redshifts, and they outperform SEDs from the prior literature, including reduced redshift errors and flux density residuals.
Click any figure to enlarge with its caption.
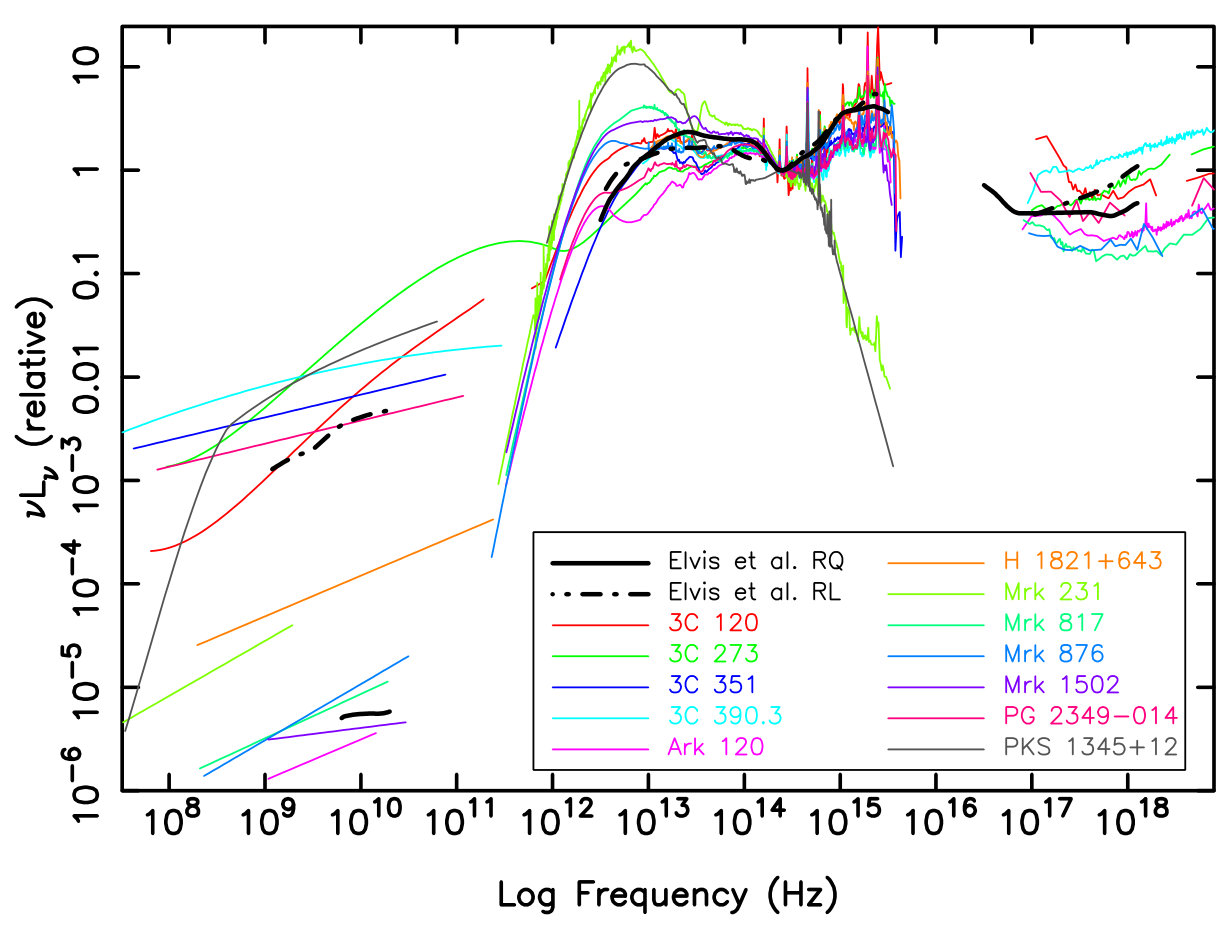 Figure 1
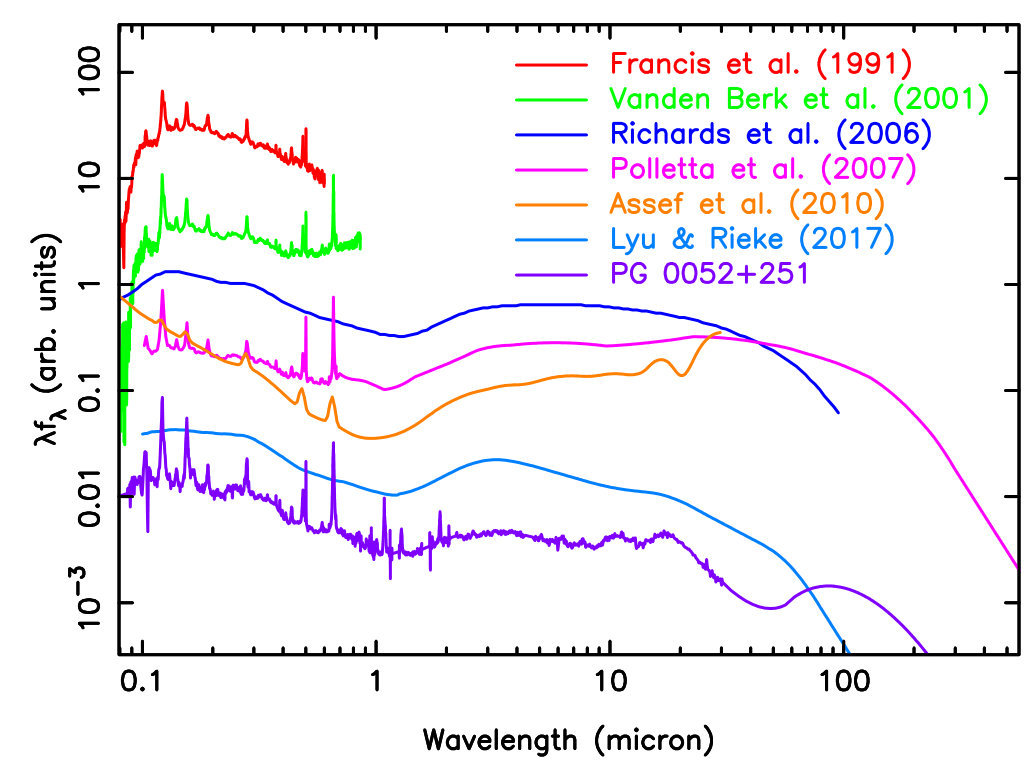 Figure 2
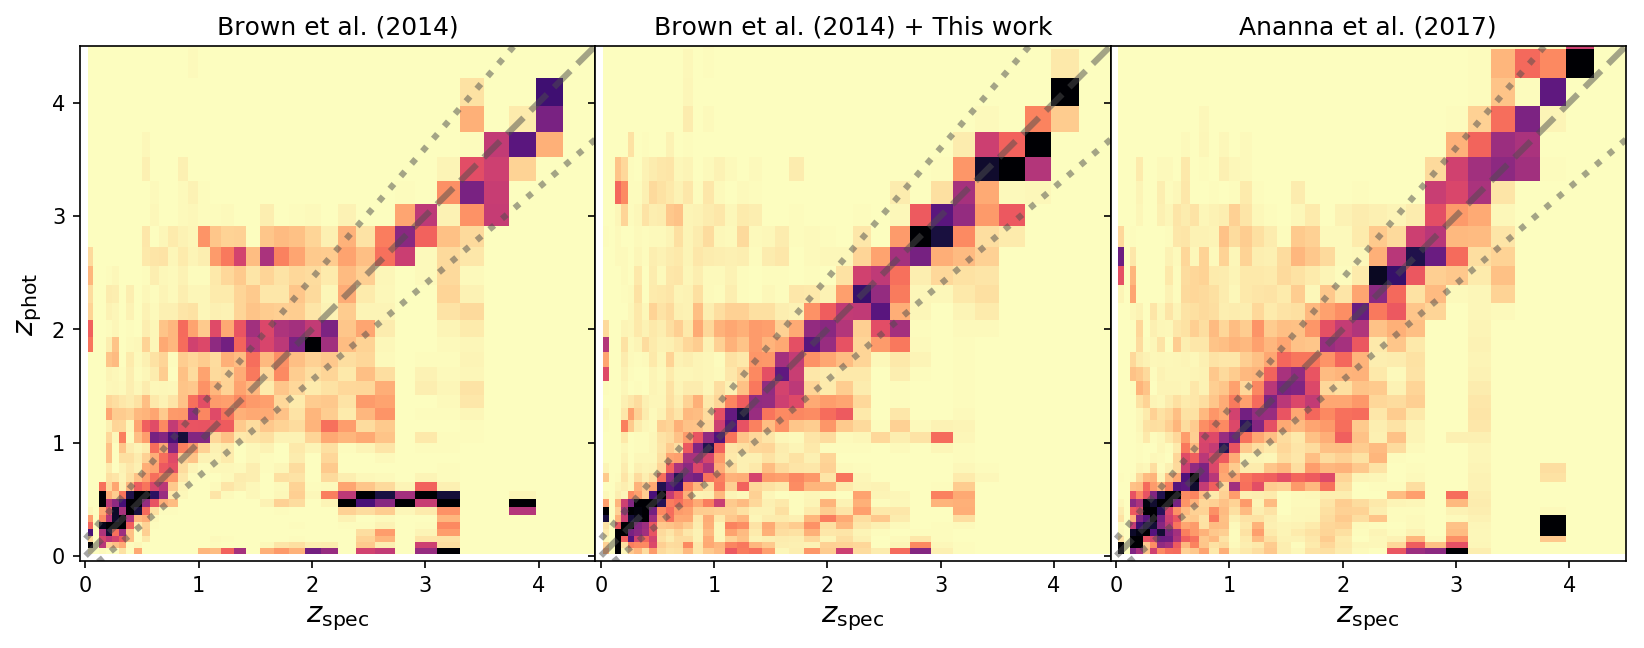 Figure 3
Peer Reviews
No public reviews on file for this paper yet. If you reviewed it on a platform where reviews are public (OpenReview, ICLR, NeurIPS, ICML), you can paste yours below so the community can read it here.
Videos
No videos yet. Explain this paper in a talk, walkthrough, or lecture? Add one.
The Spectral Energy Distributions of Active Galactic Nuclei
M. J. I. Brown
1 K. J. Duncan
2 H. Landt
3 M. Kirk C. Ricci4,5,6 and N. Kamraj7
1School of Physics & Astronomy, Monash University,
Clayton, Victoria 3800, Australia
email: [email protected]
2Leiden Observatory, Leiden University,
NL-2300 RA Leiden, Netherlands
3Department of Physics, Centre for Extragalactic Astronomy, Durham University,
South Road, Durham DH1 3LE, UK
4Núcleo de Astronomía de la Facultad de Ingeniería, Universidad Diego Portales,
Av. Ejército Libertador 441, Santiago, Chile
5Kavli Institute for Astronomy and Astrophysics, Peking University,
Beijing 100871, China
6Chinese Academy of Sciences South America Center for Astronomy,
Camino El Observatorio 1515, Las Condes, Santiago, Chile
7Cahill Center for Astronomy and Astrophysics, California Institute of Technology,
Pasadena, CA 91125, USA
(2015)
Abstract
We present ongoing work on the spectral energy distributions (SEDs) of active galactic nuclei (AGNs), derived from X-ray, ultraviolet, optical, infrared and radio photometry and spectroscopy. Our work is motivated by new wide-field imaging surveys that will identify vast numbers of AGNs, and by the need to benchmark AGN SED fitting codes. We have constructed 41 SEDs of individual AGNs and 80 additional SEDs that mimic Seyfert spectra. All of our SEDs span 0.09 to , while some extend into the X-ray and/or radio. We have tested the utility of the SEDs by using them to generate AGN photometric redshifts, and they outperform SEDs from the prior literature, including reduced redshift errors and flux density residuals.
keywords:
galaxies: active, (galaxies:) quasars: general, galaxies: Seyfert
††volume: xxx††journal: Title of your IAU Symposium††editors: A.C. Editor, B.D. Editor & C.E. Editor, eds.
1 Introduction
Photometric redshifts and AGN SED modelling will be critical for understanding the vast numbers of AGNs identified by wide-field surveys with new facilities such as eROSITA, ASKAP and LOFAR. It is also increasingly common to include AGN components in galaxy SED modelling, so empirical AGN SEDs could also prove critical for benchmarking the performance of SED modelling codes.
AGN SEDs have been developed by various groups over the past three decades, and some illustrative examples of quasar SEDs from the literature are provided in Figure 1. The SEDs in Figure 1 were developed with a variety of data, goals and methods, so some caution is required when comparing them. That said, there is an overall trend towards improved spectrophotometric accuracy, wavelength coverage and spectral resolution.
For this work we have produced AGN SEDs by combining X-ray, ultraviolet, optical, infrared and radio spectroscopy and photometry of individual objects (Brown et al., submitted). This approach can exploit the expanded wavelength range and spectrophotometric accuracy of ground-based telescopes and satellites from the past decade. However, it comes with the risk that variability and wavelength-dependent (extraction) aperture bias will produce unrealistic SEDs. To mitigate this risk we compare our SEDs with photometry and utilise the SEDs to determine AGN photometric redshifts.
2 Constructing AGN SEDs
To produce SEDs of individual AGNS we combine ground-based optical and near-infrared spectra with space-based X-ray, ultraviolet and infrared spectra. The availability (or lack) of near-infrared spectrophotometry strongly limits the building of SEDs, particularly as the near-infrared can include significant contributions from the AGN disk, torus and host galaxy. We mostly use published spectra or reduced spectra provided by archives, with only a few exceptions (NuSTAR, VLT XShooter, VLT SINFONI).
To rescale and verify spectrophotometry, and constrain SED models, we have measured aperture photometry across the ultraviolet to mid-infrared wavelength range using images from GALEX, Swift, SDSS, PanSTARRS, Skymapper, 2MASS and WISE. At longer wavelengths we have used published photometry from Herschel, WMAP, Planck and single-dish radio telescopes.
Most of the AGNs in our sample do not have far-infrared spectra, but the shape of far-infrared spectrum is sufficiently simple that it can often be adequately modelled with a grey-body curve. In the radio, we have modelled SEDs using power-laws and polynomials, which is adequate to model the observed flux densities with an accuracy of . Polynomials are used to interpolate over gaps in spectral coverage, including Akari to Spitzer and gaps in near-infrared spectra caused by atmospheric absorption.
To produce continuous SEDs, the individual spectra are initially scaled using the matched aperture photometry. The multiplicative scaling is then adjusted so neighbouring spectra have consistent flux densities. AGN variability and wavelength dependent (extraction) aperture bias does result in some SEDs being unphysical and inconsistent with the photometry, and these are rejected from our sample. For most of the remaining 41 AGNs, the multiplicative scalings range between 0.3 and 3 in the ultraviolet, and converge towards 1 with increasing wavelength. All of the SEDs span the 0.09 to , but a subset extend into the X-ray, far-infrared and/or radio. Examples of several of our SEDs, along with the [Elvis et al.(1994), Elvis et al. (1994)] radio-loud and radio-quiet quasar SEDs, are shown in Figure 2.
Our 41 SEDs for individual AGNs are biased towards luminous quasars and the central regions of nearby Seyferts, where the light is dominated by the AGN and aperture bias is thus reduced. To approximate the SEDs of Seyferts, including host galaxy light, we mix the SEDs of the central regions of Seyferts with galaxy SEDs taken from the [Brown et al. (2014), Brown et al. (2014)] sample, resulting in 80 additional SEDs spanning 0.09 to to .
3 Photometric redshifts
We have tested the utility of our AGN SEDs by using them (and other SED libraries) to generate photometric redshifts (photo-s) for X-ray selected AGNs in the Boötes. We compare photo-s generated with our SEDs against those generated using the [Brown et al. (2014), Brown et al. (2014)] SEDs, which don’t include powerful AGNs, and the AGN SEDs of [ananna2017, Ananna et al. (2017)], which build upon the [Polletta et al.(2007), Polletta et al. (2007)] SEDs and were recently used to produce photo-s for X-ray selected AGNs in Stripe-82. The photo-s were determined using the EAZY code [brammer2008, (Brammer et al. 2008)] run on optical, near-infrared and mid-infrared photometry using the methods of [Duncan et al. (2018), Duncan et al. (2018)].
Figure 3 illustrates the performance of the various SED libraries. Unsurprisingly, the [Brown et al. (2014), Brown et al. (2014)] galaxy SED library, which lacks powerful AGNs, performs poorly with for quasars. Our new SEDs, in combination with the [Brown et al. (2014), Brown et al. (2014)] galaxy SEDs, produce significantly better quality photo-s than the previous library alone and shows improvements over photo-s using the [ananna2017, Ananna et al. (2017)] SEDs. Our photometric redshifts have a typical scatter of and flux density residuals are , with the exact value varying with wavelength. We attribute this improvement in part to the availability of new spectra, including from Akari and Spitzer. A complete and representative library of AGN SED templates will be vital for producing template-based photo-s that are comparable in precision/reliability to those produced through the latest empirical methods [Duncan et al. (2019), (Duncan et al. 2019)]. Such redshifts will be necessary for as new AGN surveys push into parameter space that currently lacks the spectroscopic training samples required for empirical photo- estimates.
The reference list from the paper itself. Each links out to its DOI / PubMed record.
- 1[Assef et al.(2010)] Assef, R. J., Kochanek, C. S., Brodwin, M., Cool, R., Forman, W., Gonzalez, A. H., Hickox, R. C., Jones, C., et al. 2010, Ap J , 713, 970
- 2[Brammer et al. (2008)] Brammer, G. B., van Dokkum, P. G., & Coppi, P. 2008, Ap J , 686, 1503
- 3[Brown et al. (2014)] Brown, M. J. I., Moustakas, J., Smith, J.-D. T., da Cunha, E., Jarrett, T. H., Imanishi, M., Armus, L., Brandl, B. R., et al. 2014, Ap JS , 212, 18
- 4[Duncan et al. (2018)] Duncan, K. J., Brown, M. J. I., Williams, W. L., Best, P. N., Buat, V., Burgarella, D., Jarvis, M. J., Małek, K., et al. 2018, MNRAS , 473, 2655
- 5[Duncan et al. (2019)] Duncan, K. J, Sabater, J., Röttgering, H. J. A, Jarvis, M. J., Smith, D. J. B., Best, P. N., Callingham, J. R., Cochrane, R., et al. 2019, A&A , Forthcoming article
- 6[Elvis et al.(1994)] Elvis, M., Wilkes, B. J., Mc Dowell, J. C., Green, R. F., Bechtold, J., Willner, S. P., Oey, M. S., Polomski, E., et al. 1994, Ap JS , 95, 1
- 7[Francis et al.(1991)] Francis, P. J., Hewett, P. C., Foltz, C. B., Chaffee, F. H., Weymann, R. J., Morris, S. L., 1991, Ap J , 373, 465
- 8[Lyu et al.(2017)] Lyu, J., Rieke, G. H., & Shi, Y. 2017, Ap J , 835, 257