TL;DR
This study evaluates the reliability of popular online object recognition platforms under various real-world conditions and proposes a feature similarity framework to estimate their performance changes.
Contribution
It introduces a novel framework combining handcrafted and deep learning features to predict recognition performance variations across different acquisition conditions.
Findings
Deep neural network features correlate strongly with recognition performance (correlation 0.94).
Recognition accuracy varies significantly with background, device, and object orientation.
The proposed estimation method effectively predicts performance changes in diverse scenarios.
Abstract
In this paper, we investigate the reliability of online recognition platforms, Amazon Rekognition and Microsoft Azure, with respect to changes in background, acquisition device, and object orientation. We focus on platforms that are commonly used by the public to better understand their real-world performances. To assess the variation in recognition performance, we perform a controlled experiment by changing the acquisition conditions one at a time. We use three smartphones, one DSLR, and one webcam to capture side views and overhead views of objects in a living room, an office, and photo studio setups. Moreover, we introduce a framework to estimate the recognition performance with respect to backgrounds and orientations. In this framework, we utilize both handcrafted features based on color, texture, and shape characteristics and data-driven features obtained from deep neural networks.…
Click any figure to enlarge with its caption.
 Figure 1
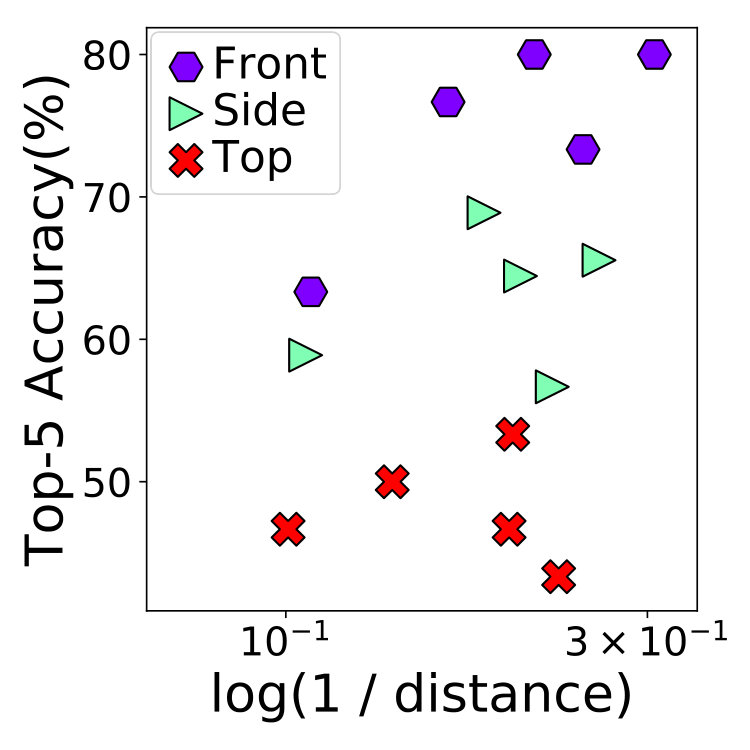 Figure 2
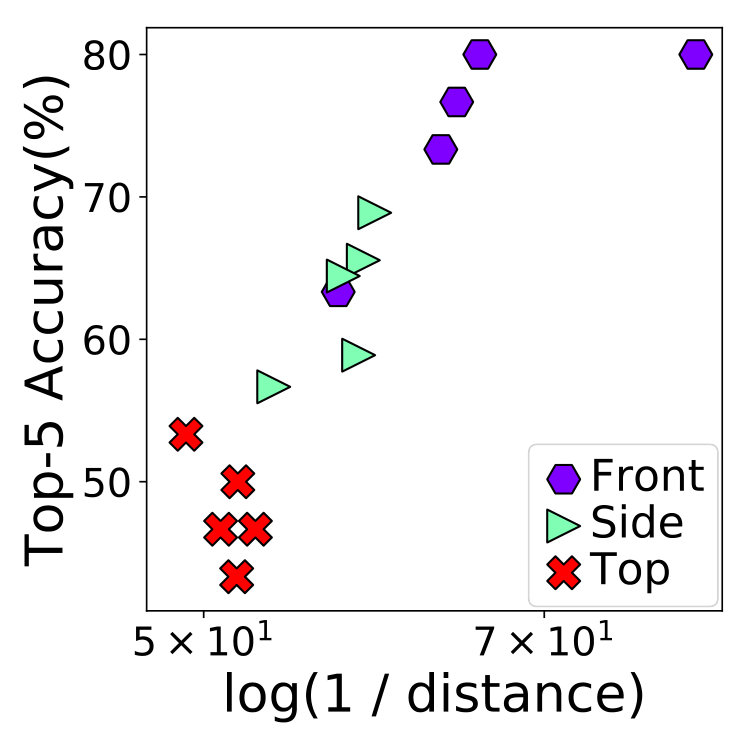 Figure 3
 Figure 4
 Figure 5
 Figure 6
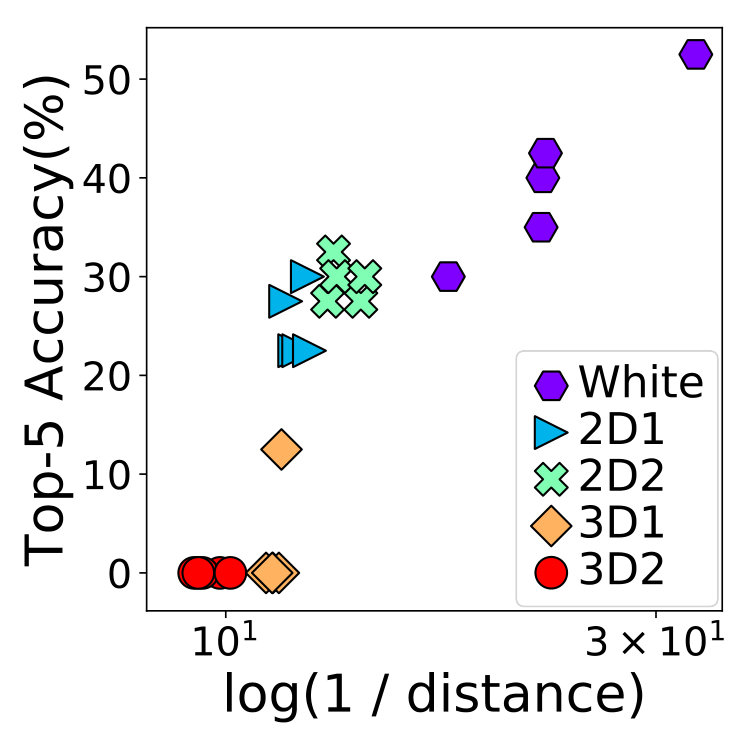 Figure 7
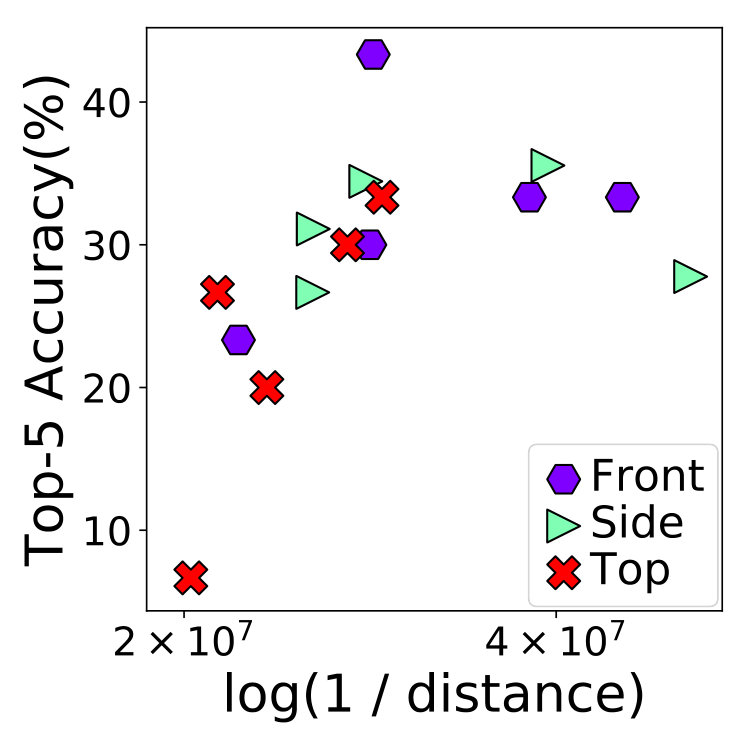 Figure 8
 Figure 9
 Figure 10
 Figure 11
 Figure 12
 Figure 13
 Figure 14
 Figure 15
 Figure 16
 Figure 17
 Figure 18
 Figure 19
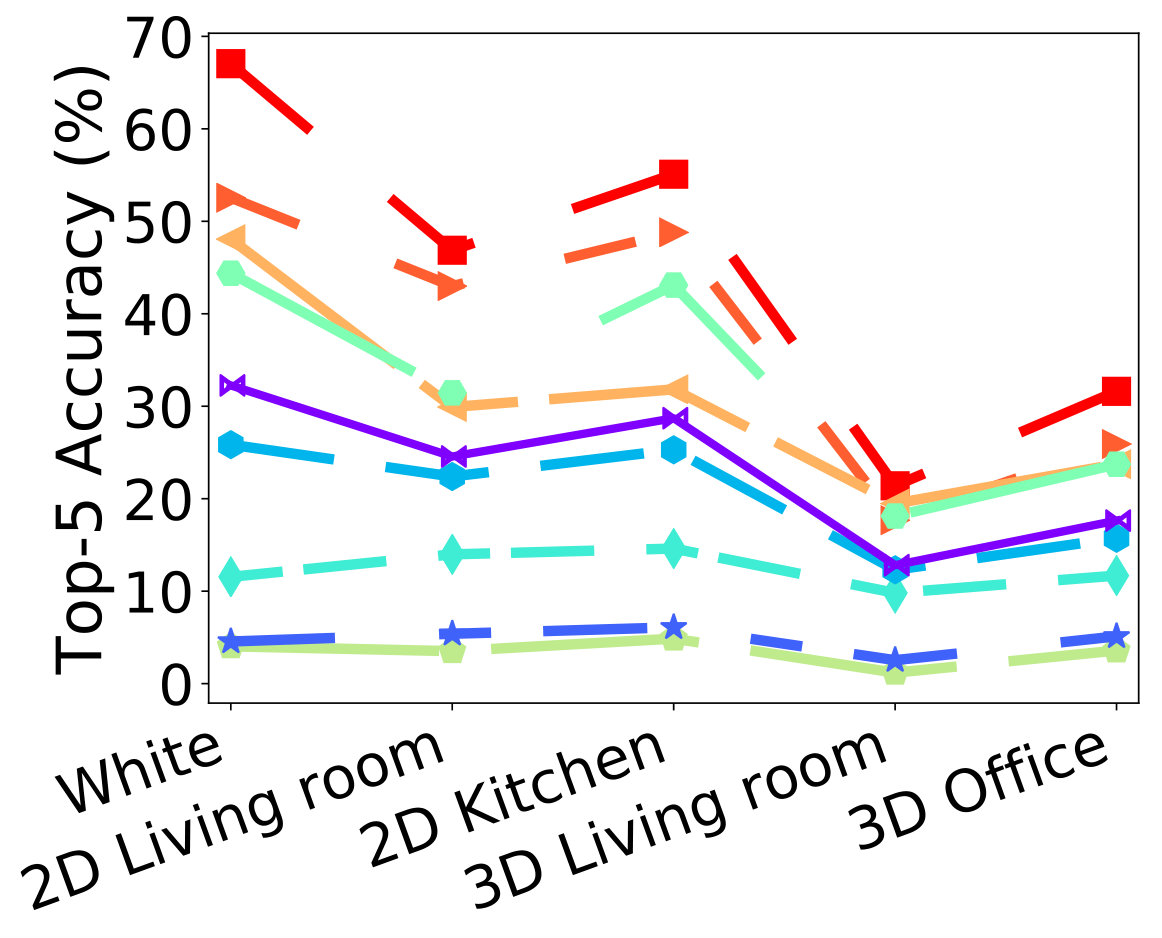 Figure 20
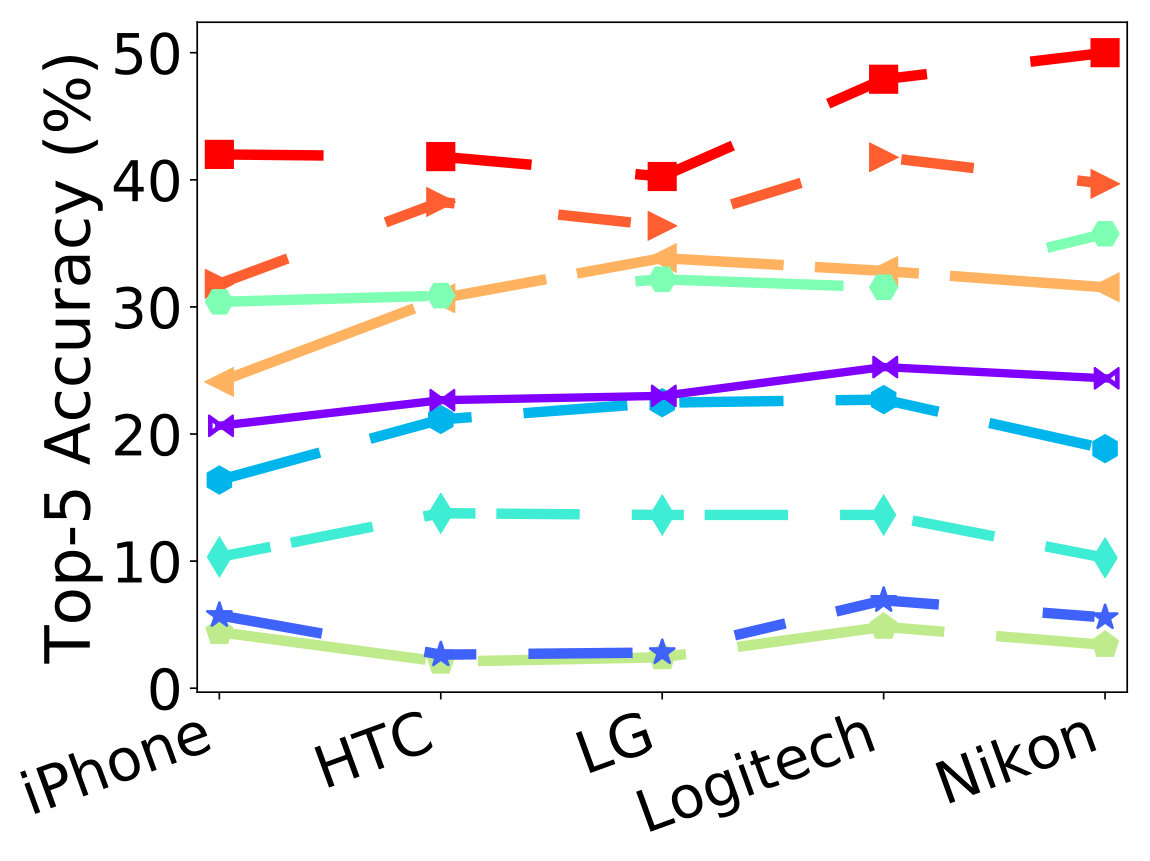 Figure 21
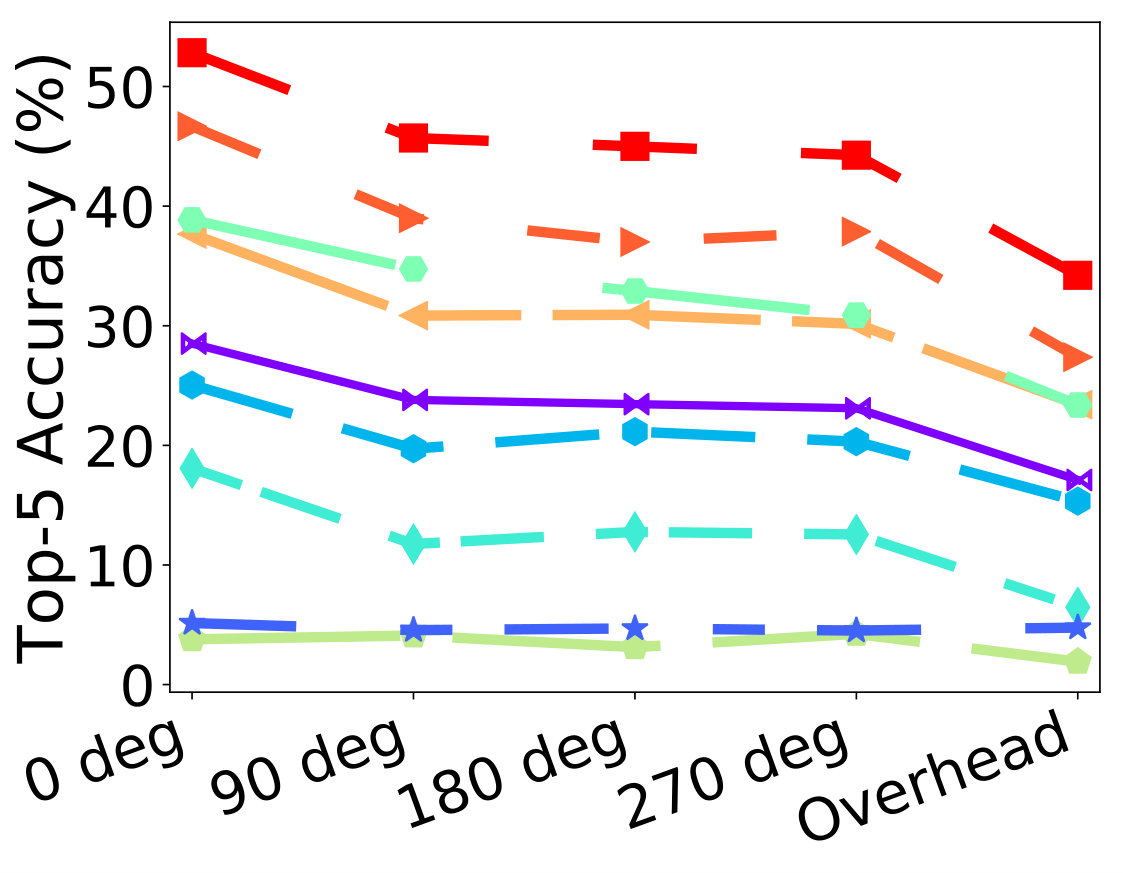 Figure 22
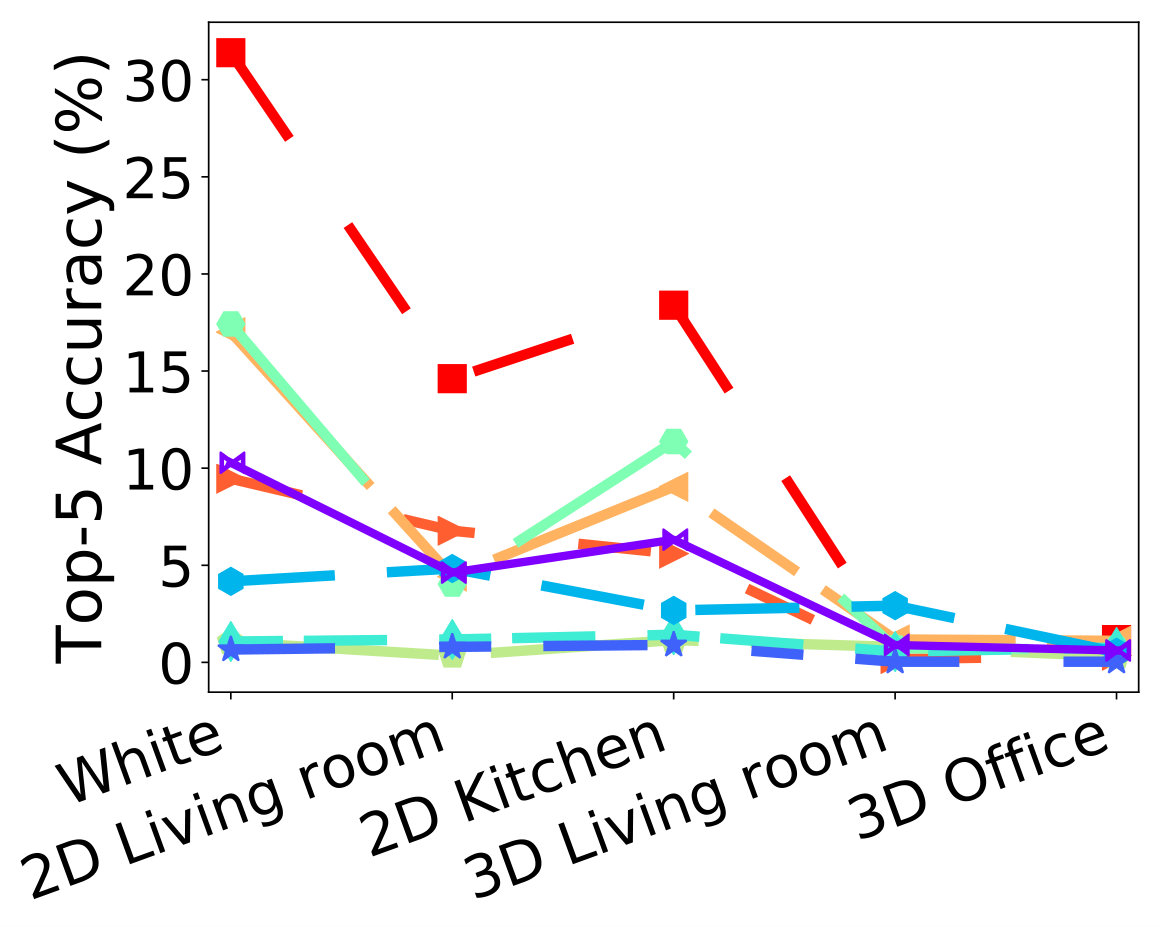 Figure 23
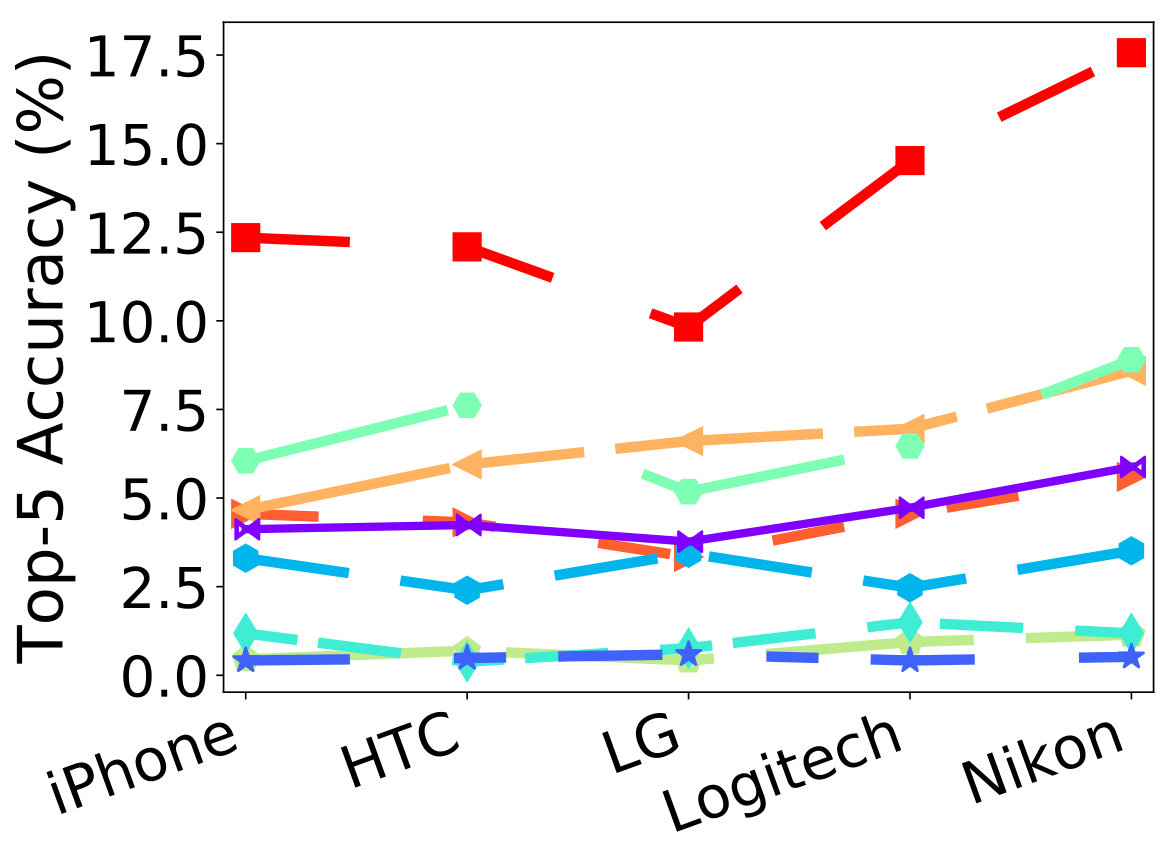 Figure 24
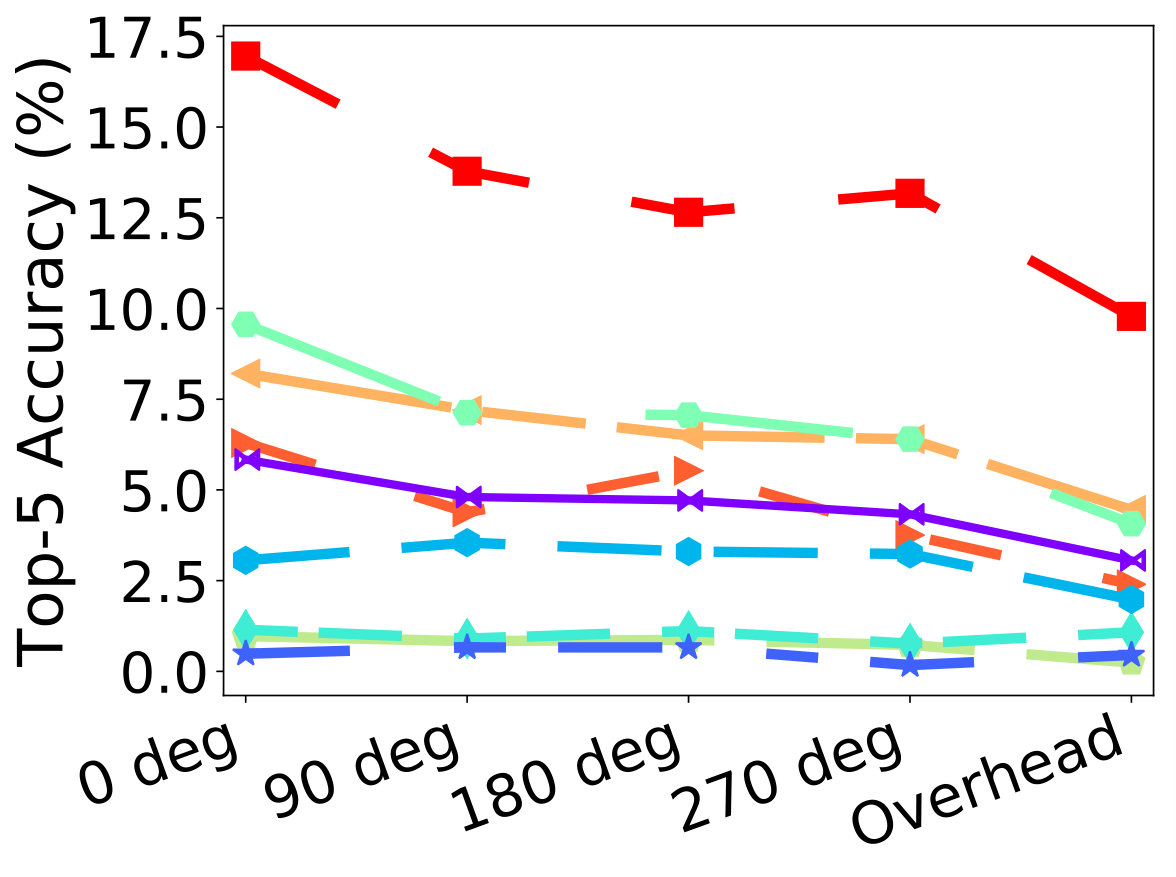 Figure 25
| Condition | Feature Type | Feature | Distance Metric | |||||||||
|---|---|---|---|---|---|---|---|---|---|---|---|---|
| SAD | SSAD | Canberra | Chebyshev | Minkowski | Bray-Curtis | Cosine | ||||||
| Amazon Rekognition (AMZN) | ||||||||||||
| Background | Hand- crafted | Color | 0.14 | 0.30 | 0.29 | 0.10 | 0.29 | 0.88 | 0.01 | 0.30 | 0.14 | 0.20 |
| Daisy | 0.31 | 0.27 | 0.26 | 0.07 | 0.26 | 0.31 | 0.40 | 0.27 | 0.31 | 0.27 | ||
| Edge | 0.18 | 0.08 | 0.12 | 0.19 | 0.07 | 0.66 | 0.04 | 0.08 | 0.45 | 0.17 | ||
| Gabor | 0.77 | 0.76 | 0.76 | 0.35 | 0.76 | 0.58 | 0.71 | 0.76 | 0.77 | 0.71 | ||
| HOG | 0.13 | 0.17 | 0.16 | 0.08 | 0.16 | 0.01 | 0.12 | 0.17 | 0.13 | 0.13 | ||
| Data- driven | VGG11 | 0.85 | 0.85 | 0.85 | 0.10 | 0.85 | 0.93 | 0.84 | 0.85 | 0.85 | 0.85 | |
| VGG13 | 0.85 | 0.85 | 0.83 | 0.01 | 0.83 | 0.92 | 0.69 | 0.85 | 0.85 | 0.86 | ||
| VGG16 | 0.88 | 0.84 | 0.84 | 0.08 | 0.84 | 0.94 | 0.79 | 0.84 | 0.88 | 0.85 | ||
| Orientation | Hand- crafted | Color | 0.28 | 0.41 | 0.41 | 0.54 | 0.41 | 0.04 | 0.48 | 0.41 | 0.28 | 0.16 |
| Daisy | 0.45 | 0.28 | 0.17 | 0.03 | 0.17 | 0.45 | 0.08 | 0.28 | 0.45 | 0.21 | ||
| Edge | 0.71 | 0.66 | 0.69 | 0.19 | 0.63 | 0.67 | 0.65 | 0.66 | 0.65 | 0.45 | ||
| Gabor | 0.05 | 0.06 | 0.09 | 0.39 | 0.09 | 0.24 | 0.02 | 0.06 | 0.05 | 0.06 | ||
| HOG | 0.19 | 0.16 | 0.19 | 0.51 | 0.19 | 0.30 | 0.09 | 0.16 | 0.19 | 0.15 | ||
| Data- driven | VGG11 | 0.86 | 0.92 | 0.91 | 0.34 | 0.91 | 0.69 | 0.94 | 0.92 | 0.86 | 0.89 | |
| VGG13 | 0.91 | 0.90 | 0.84 | 0.01 | 0.84 | 0.65 | 0.78 | 0.90 | 0.91 | 0.88 | ||
| VGG16 | 0.88 | 0.92 | 0.84 | 0.48 | 0.84 | 0.72 | 0.87 | 0.92 | 0.88 | 0.87 | ||
| Microsoft Azure (MSFT) | ||||||||||||
| Background | Hand- crafted | Color | 0.12 | 0.13 | 0.13 | 0.14 | 0.13 | 0.91 | 0.02 | 0.13 | 0.12 | 0.21 |
| Daisy | 0.14 | 0.18 | 0.17 | 0.01 | 0.17 | 0.14 | 0.34 | 0.18 | 0.14 | 0.18 | ||
| Edge | 0.20 | 0.10 | 0.11 | 0.27 | 0.08 | 0.55 | 0.08 | 0.10 | 0.39 | 0.14 | ||
| Gabor | 0.85 | 0.84 | 0.84 | 0.29 | 0.84 | 0.59 | 0.80 | 0.84 | 0.85 | 0.82 | ||
| HOG | 0.30 | 0.32 | 0.31 | 0.17 | 0.31 | 0.11 | 0.18 | 0.32 | 0.30 | 0.10 | ||
| Data- driven | VGG11 | 0.94 | 0.94 | 0.94 | 0.13 | 0.94 | 0.83 | 0.90 | 0.94 | 0.94 | 0.93 | |
| VGG13 | 0.93 | 0.92 | 0.91 | 0.03 | 0.91 | 0.86 | 0.62 | 0.92 | 0.93 | 0.93 | ||
| VGG16 | 0.91 | 0.93 | 0.93 | 0.15 | 0.93 | 0.87 | 0.89 | 0.93 | 0.91 | 0.93 | ||
| Orientation | Hand- crafted | Color | 0.28 | 0.45 | 0.47 | 0.02 | 0.47 | 0.04 | 0.46 | 0.45 | 0.28 | 0.27 |
| Daisy | 0.48 | 0.43 | 0.34 | 0.24 | 0.34 | 0.48 | 0.32 | 0.43 | 0.48 | 0.38 | ||
| Edge | 0.54 | 0.50 | 0.51 | 0.15 | 0.53 | 0.45 | 0.47 | 0.50 | 0.35 | 0.15 | ||
| Gabor | 0.25 | 0.21 | 0.18 | 0.24 | 0.18 | 0.10 | 0.23 | 0.21 | 0.25 | 0.37 | ||
| HOG | 0.11 | 0.06 | 0.11 | 0.36 | 0.11 | 0.22 | 0.13 | 0.06 | 0.11 | 0.38 | ||
| Data- driven | VGG11 | 0.38 | 0.46 | 0.50 | 0.03 | 0.50 | 0.34 | 0.42 | 0.46 | 0.38 | 0.43 | |
| VGG13 | 0.52 | 0.48 | 0.47 | 0.15 | 0.47 | 0.44 | 0.43 | 0.48 | 0.52 | 0.51 | ||
| VGG16 | 0.43 | 0.46 | 0.48 | 0.71 | 0.48 | 0.46 | 0.53 | 0.46 | 0.43 | 0.44 | ||
Peer Reviews
No public reviews on file for this paper yet. If you reviewed it on a platform where reviews are public (OpenReview, ICLR, NeurIPS, ICML), you can paste yours below so the community can read it here.
Code & Models
Videos
No videos yet. Explain this paper in a talk, walkthrough, or lecture? Add one.
Citation
D. Temel, J. Lee and G. AlRegib, ”Object Recognition Under Multifarious Conditions: A Reliability Analysis and A Feature Similarity-Based Performance Estimation,” IEEE International Conference on Image Processing (ICIP), Taipei, Taiwan, 2019.
Dataset
https://ghassanalregib.com/cure-or/
Bib
@INPROCEEDINGS{Temel2019_ICIP,
author={D. Temel and J. Lee and G. AIRegib},
booktitle={IEEE International Conference on Image Processing (ICIP)},
title={Object Recognition Under Multifarious Conditions: A Reliability Analysis and A Feature Similarity-Based Performance Estimation},
year={2019},}
Copyright
©2019 IEEE. Personal use of this material is permitted. Permission from IEEE must be obtained for all other uses, in any current or future media, including reprinting/republishing this material for advertising or promotional purposes, creating new collective works, for resale or redistribution to servers or lists, or reuse of any copyrighted component of this work in other works.
Contact
[email protected] https://ghassanalregib.com/
[email protected] http://cantemel.com/
Object Recognition Under Multifarious Conditions: A Reliability Analysis and A Feature Similarity-Based Performance Estimation
Abstract
In this paper, we investigate the reliability of online recognition platforms, Amazon Rekognition and Microsoft Azure, with respect to changes in background, acquisition device, and object orientation. We focus on platforms that are commonly used by the public to better understand their real-world performances. To assess the variation in recognition performance, we perform a controlled experiment by changing the acquisition conditions one at a time. We use three smartphones, one DSLR, and one webcam to capture side views and overhead views of objects in a living room, an office, and photo studio setups. Moreover, we introduce a framework to estimate the recognition performance with respect to backgrounds and orientations. In this framework, we utilize both handcrafted features based on color, texture, and shape characteristics and data-driven features obtained from deep neural networks. Experimental results show that deep learning-based image representations can estimate the recognition performance variation with a Spearman’s rank-order correlation of 0.94 under multifarious acquisition conditions.
**Index Terms— ** object dataset, controlled experiment with recognition platforms, performance estimation, deep learning, feature similarity
1 Introduction
In recent years, the performance of visual recognition and detection algorithms have considerably advanced with the progression of data-driven approaches and computational capabilities [1, 2]. These advancements enabled state-of-the-art methods to achieve human-level performance in specific recognition tasks [3, 4]. Despite these significant achievements, it remains a challenge to utilize such technologies in real-world environments that diverge from training conditions. To identify the factors that can affect recognition performance, we need to perform controlled experiments as in [5, 6, 7, 8, 9]. Even though these studies shed a light on the vulnerability of existing recognition approaches, investigated conditions are either limited or unrealistic. Recently, we introduced the CURE-OR dataset and analyzed the recognition performance with respect to simulated challenging conditions [10]. Hendrycks and Dietterich [11] also studied the effect of similar conditions by postprocessing the images in ImageNet [1]. In [12, 13, 14, 15], performance variation under simulated challenging conditions were analyzed for traffic sign recognition and detection. Aforementioned studies overlooked the acquisition conditions and investigated the effect of simulated conditions. In contrast to the literature [5, 6, 7, 8, 9, 12, 13, 15, 11] and our previous work [10], the main focus of this study is to analyze the effect of real-world acquisition conditions including device type, orientation and background. In Fig. 1, we show sample images obtained under different acquisition conditions.
If we consider ideal acquisition conditions as reference conditions that lead to the highest recognition rate, any variation would decrease the recognition performance and affect visual representations. Based on this assumption, we hypothesize that recognition performance variations can be estimated by variations in visual representations. Overall, the contributions of this manuscript are five folds. First, we investigate the effect of background on object recognition by performing controlled experiments with different backgrounds. Second, we analyze the effect of acquisition devices by comparing the recognition accuracy of images captured with different devices. Third, we analyze the recognition performance with respect to different orientation configurations. Fourth, we introduce a framework to estimate the recognition performance variation under varying backgrounds and orientations. Fifth, we benchmark the performance of handcrafted and data-driven features obtained from deep neural networks in the proposed framework. The outline of this paper is as follows. In Section 2, we analyze the objective recognition performance with respect to acquisition conditions. In Section 3, we describe the recognition performance estimation framework and benchmark hand-crafted and data-driven methods. Finally, we conclude our work in Section 4.
2 Recognition Under Multifarious Conditions
Based on scalability, user-friendliness, computation time, service fees, access to labels and confidence scores, we assessed off-the-shelf platforms and decided to utilize Microsoft Azure Computer Vision (MSFT) and Amazon Rekognition (AMZN) platforms. As a test set, we use the recently introduced CURE-OR dataset that includes one million images of 100 objects captured with different devices under various object orientations, backgrounds, and simulated challenging conditions. Objects are classified into 6 categories: toys, personnel belongings, office supplies, household items, sport/entertainment items, and health/personal care items as described in [10]. We identified 4 objects per category for each platform for testing, but because Azure only identified 3 objects correctly in one category, we excluded an object with the lowest number of correctly identified images from Amazon for fair comparison. Therefore, we used objects while assessing the robustness of the recognition platforms. Original images (challenge-free) in each category were processed to simulate realistic challenging conditions including underexposure, overexposure, blur, contrast, dirty lens, salt and pepper noise, and resizing as illustrated in [10]. We calculated the top-5 accuracy for each challenge category to quantify recognition performance. Specifically, we calculated the ratio of correct classifications for each object in which ground truth label was among the highest five predictions.
We report the recognition performance of online platforms with respect to varying acquisition conditions in Fig. 2. Each line represents a challenge type, except the purple line that shows the average of all challenge types. In terms of object backgrounds, white background leads to the highest recognition accuracy in both platforms as shown in Fig. 2(a-b), which is followed by 2D textured backgrounds of kitchen and living room, and then by 3D backgrounds of office and living room. Objects are recognized more accurately in front of the white backdrop because there is not any texture or color variation in the background that can resemble other objects. The most challenging scenarios correspond to the real-world office and living room because of complex background structure. Recognition accuracy in front of 2D backdrops is higher than the real-world setups because foreground objects are more distinct when background is out of focus.
In terms of orientations, front view (0 deg) leads to the highest recognition accuracy as shown in Fig. 2(c-d), which is expected because the objects in CURE-OR face forward with their most characteristic features. In contrast, these characteristic features are highly self-occluded in the overhead view, which leads to the lowest recognition performance. In case of left, right, and back views, characteristic features are not as clear as in front view but self-occlusion is not as significant as in overhead view. Therefore, these orientations lead to a medium recognition performance compared to front and overhead views. Recognition performances with respect to acquisition devices are reported in Fig. 2(e-f), which shows that performance variation based on device types is less significant than backgrounds and orientations. However, there is still a performance difference between images obtained from different devices. Overall, Nikon D80 and Logitech C920 lead to highest recognition performance in both platforms, which highlights the importance of image quality for recognition applications.
3 Recognition Performance Estimation under Multifarious Conditions
Based on the experiments reported in Section 2, the reference configuration that leads to the highest recognition performance is front view, white background, and Nikon DSLR. We conducted two experiments to estimate the recognition performance with respect to changes in background and orientation. We utilized the 10 common objects of both platforms for direct comparison. In the background experiment, we grouped images captured with a particular device (5) in front of a specific background (5), which leads to 25 image groups with front and side views of the objects. In the orientation experiment, we grouped images captured with a particular device (5) from an orientation (3) among front, top, and side views, which leads to 15 image groups with images of the objects in front of white, living room, and kitchen backdrops. For each image group, we obtained an average recognition performance per recognition platform and an average feature distance between the images in the group and their reference image. Finally, we analyzed the relationship between recognition accuracy and feature distance with correlations and scatter plots. We extracted commonly used handcrafted and data-driven features as follows:
- ▪
Color: Histograms of color channels in RGB.
- ▪
Daisy: Local image descriptor based on convolutions of gradients in specific directions with Gaussian filters [16].
- ▪
Edge: Histogram of vertical, horizontal, diagonal, and non-directional edges.
- ▪
Gabor: Frequency and orientation information of images extracted through Gabor filters.
- ▪
HOG: Histogram of oriented gradients over local regions.
- ▪
VGG: Features obtained from convolutional neural networks that are based on stacked convolutional layers [17]. The VGG index indicates the number of weighted layers in which last three layers are fully connected layers.
We calculated the distance between features with norm, norm, norm, sum of absolute differences (SAD), sum of squared absolute differences (SSAD), weighted norm (Canberra), norm (Chebyshev), Minkowski distance, Bray-Curtis dissimilarity, and Cosine distance. We report the recognition accuracy estimation performance in Table 1 in terms of Spearman correlation between top-5 recognition accuracy scores and feature distances. We highlight the top data-driven and hand-crafted methods with light blue for each recognition platform and experiment.
In the background experiment, color characteristics of different backgrounds are distinct from each other as observed in Fig. 1. In terms of low level characteristic features including Daisy, Edge, and HOG, edges in the backgrounds can distinguish highly textured backgrounds from less textured backgrounds. However, edges would not be sufficient to distinguish lowly textured backgrounds from each other. Moreover, edges of the foreground objects can dominate the feature representations and mask the effect of changes in the backgrounds. To distinguish differences in backgrounds overlooked by edge characteristics, frequency and orientation characteristics can be considered with Gabor features. Data-driven methods including VGG utilize all three channels of images while extracting features, which can give them an inherent advantage with respect to solely color or structure based methods. Overall, data-driven method VGG leads to the highest performance in the background experiment for both recognition platforms. In terms of hand-crafted features, color leads to the highest performance followed by Gabor whereas edge-based methods result in inferior performance.
Distinguishing changes in orientation is more challenging compared to backgrounds because region of interest is limited to a smaller area. Therefore, overall recognition accuracy estimation performances are lower for orientations compared to backgrounds as reported in Table 1. Similar to the background experiment, VGG architectures lead to the highest performance estimation in the orientation experiment. However, hand-crafted methods are dominated by edge features instead of Gabor representations. We show the scatter plots of top performing data-driven and hand-crafted methods in Fig. 3 in which x-axis corresponds to average distance between image features and y-axis corresponds to top-5 accuracy. Image groups corresponding to different configurations are more distinctly clustered in terms of background as observed in Fig. 3(a-b, e-f). In terms of orientation, VGG leads to a clear distinction of configurations for Amazon Rekognition as observed in Fig. 3(c) whereas image groups are overlapping in other experiments as shown in Fig. 3(d, g-h). Clustering configurations is more challenging in the orientation experiment because it is not even possible to easily separate orientation configurations based on their recognition accuracy.
4 Conclusion
In this paper, we analyzed the robustness of recognition platforms and reported that object background can affect recognition performance as much as orientation whereas tested device types have minor influence on recognition. We also introduced a framework to estimate recognition performance variation and showed that color-based features capture background variations, edge-based features capture orientation variations, and data-driven features capture both background and orientation variations in a controlled setting. Overall, recognition performance can significantly change depending on the acquisition conditions, which highlights the need for more robust platforms that we can confide in our daily lives. Estimating recognition performance with feature similarity-based metrics can be helpful to test the robustness of algorithms before deployment. However, the applicability of such estimation frameworks can drastically increase if we design no-reference approaches that can provide a recognition performance estimation without a reference image similar to the no-reference algorithms in image quality assessment field.
The reference list from the paper itself. Each links out to its DOI / PubMed record.
- 1[1] J. Deng, W. Dong, R. Socher, L. J. Li, Kai Li, and Li Fei-Fei, “Image Net: A large-scale hierarchical image database,” in IEEE Conference on Computer Vision and Pattern Recognition (CVPR) , June 2009, pp. 248–255.
- 2[2] T.-Y. Lin, M. Maire, S. Belongie, J. Hays, P. Perona, D. Ramanan, P. Dollár, and C. L. Zitnick, “Microsoft COCO: Common objects in context,” in European Conference on Computer Vision (ECCV) , D. Fleet, T. Pajdla, B. Schiele, and T. Tuytelaars, Eds., Cham, 2014, pp. 740–755, Springer International Publishing.
- 3[3] K. He, X. Zhang, S. Ren, and J. Sun, “Delving deep into rectifiers: Surpassing human-level performance on imagenet classification,” in IEEE International Conference on Computer Vision (ICCV) , Washington, DC, USA, 2015, pp. 1026–1034, IEEE Computer Society.
- 4[4] R. Wu, S. Yan, Y. Shan, Q. Dang, and G. Sun, “Deep Image: Scaling up Image Recognition,” in ar Xiv:1501.02876 , 2015.
- 5[5] S. Dodge and L. Karam, “Understanding how image quality affects deep neural networks,” in International Conference on Quality of Multimedia Experience (Qo MEX) , June 2016, pp. 1–6.
- 6[6] Y. Zhou, S. Song, and N. Cheung, “On classification of distorted images with deep convolutional neural networks,” in IEEE International Conference on Acoustics, Speech and Signal Processing (ICASSP) , March 2017, pp. 1213–1217.
- 7[7] H. Hosseini, B. Xiao, and R. Poovendran, “Google’s cloud vision api is not robust to noise,” in 16th IEEE International Conference on Machine Learning and Applications (ICMLA) , Dec 2017, pp. 101–105.
- 8[8] J. Lu, H. Sibai, E. Fabry, and D Forsyth, “No need to worry about adversarial examples in object detection in autonomous vehicles,” in IEEE Conference on Computer Vision and Pattern Recognition (CVPR) Workshop , 2017.
