The linear bias of radio galaxies at z~0.3 via cosmic microwave background lensing
C. Devereux (Hertfordshire), J. E. Geach, M. J. Hardcastle

TL;DR
This study measures the linear bias of radio-loud active galactic nuclei at redshift 0.3 using CMB lensing cross-correlation, revealing their typical environment as rich groups or clusters.
Contribution
First measurement of RLAGN bias at z~0.3 via CMB lensing cross-correlation, providing insights into their typical dark matter halo masses and environments.
Findings
Detected cross-power signal at 3σ significance.
Estimated RLAGN bias as 2.5 ± 0.8, corresponding to halo mass ~10^14 M_sun.
Removing cluster-associated RLAGN lowers the bias estimate.
Abstract
We present a new measurement of the linear bias of radio loud active galactic nuclei (RLAGN) at and selected from the Best & Heckman (2012) sample, made by cross-correlating the RLAGN surface density with a map of the convergence of the weak lensing field of the cosmic microwave background from Planck. We detect the cross-power signal at a significance of and use the amplitude of the cross-power spectrum to estimate the linear bias of RLAGN, , corresponding to a typical dark matter halo mass of . When RLAGN associated with optically-selected clusters are removed we measure a lower bias corresponding to . These observations support the view that powerful RLAGN typically inhabit rich group and…
Click any figure to enlarge with its caption.
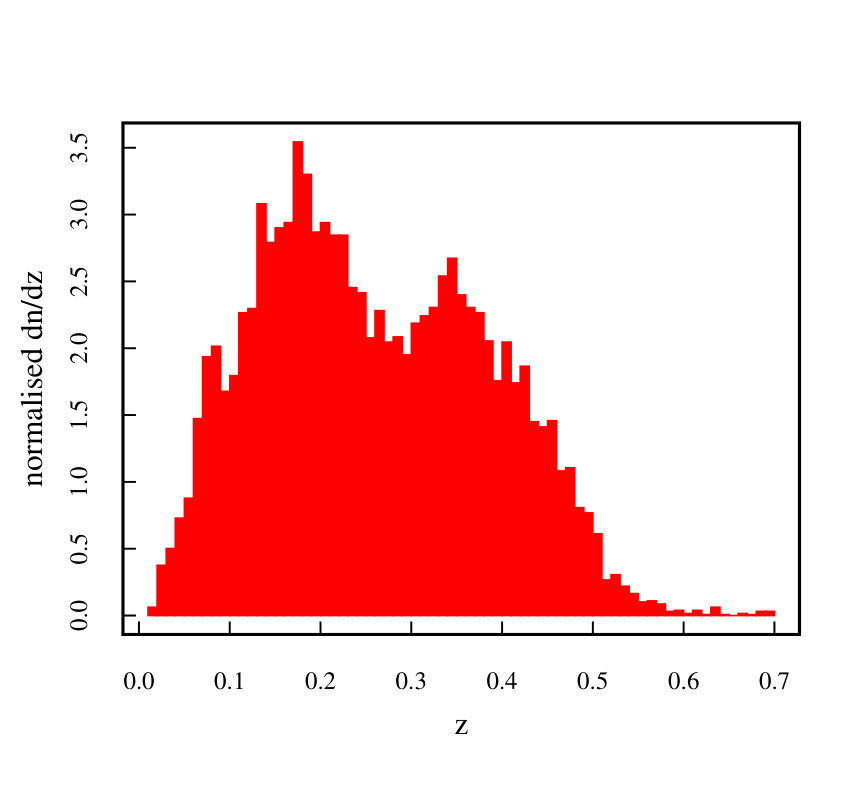 Figure 1
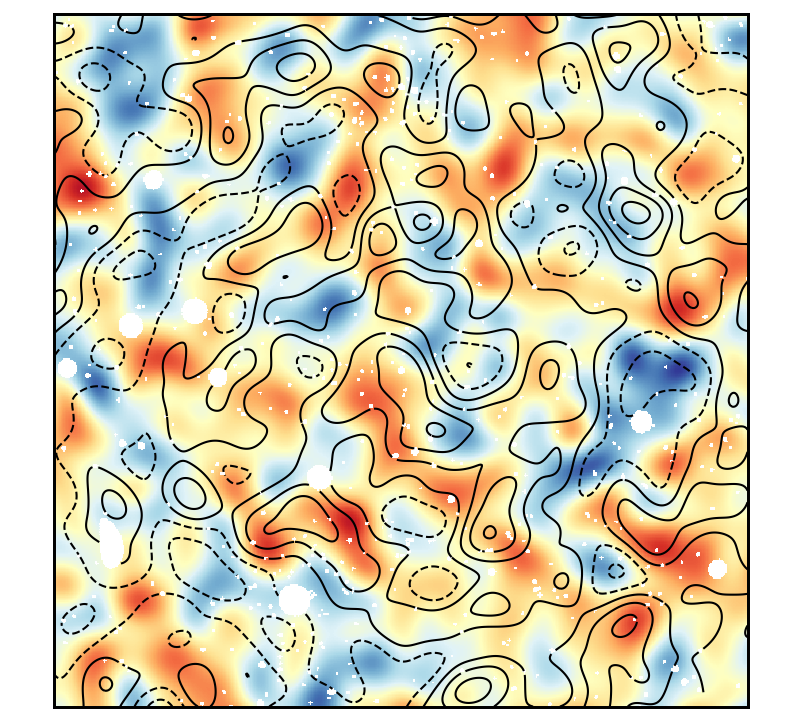 Figure 2
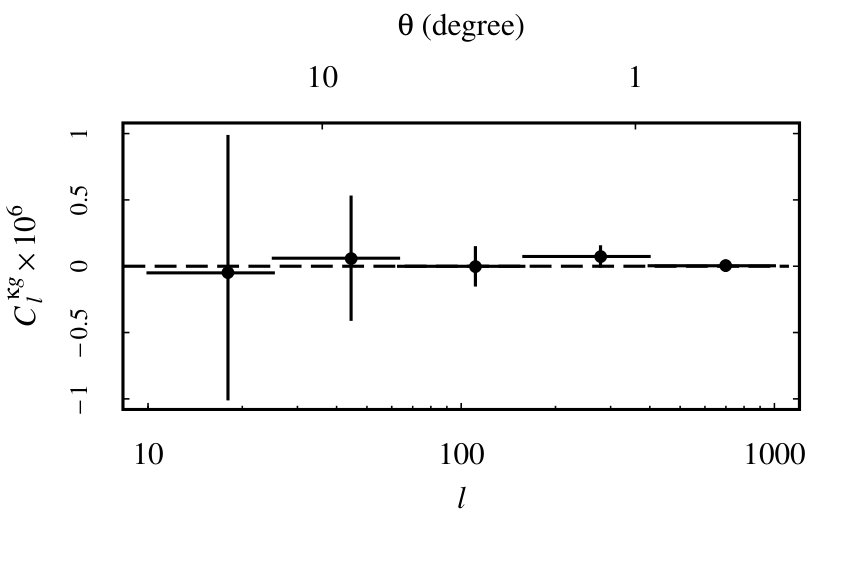 Figure 3
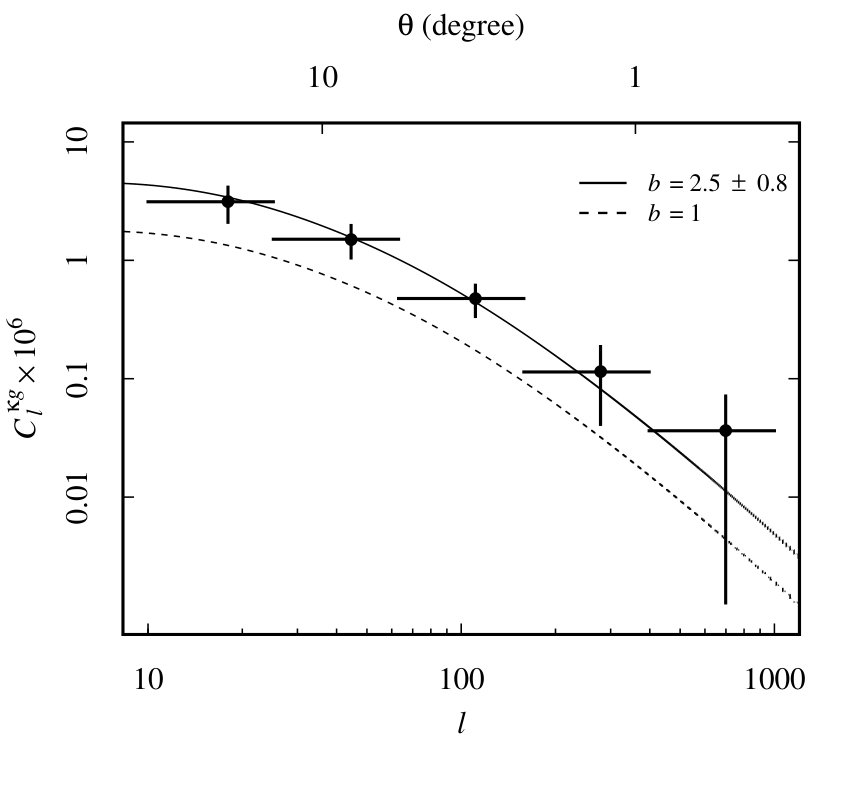 Figure 4
Peer Reviews
No public reviews on file for this paper yet. If you reviewed it on a platform where reviews are public (OpenReview, ICLR, NeurIPS, ICML), you can paste yours below so the community can read it here.
Videos
No videos yet. Explain this paper in a talk, walkthrough, or lecture? Add one.
The linear bias of radio galaxies at via cosmic microwave background lensing
C. Devereux, J. E. Geach & M. J. Hardcastle
Centre for Astrophysics Research, School of Physics, Astronomy & Mathematics, University of Hertfordshire, Hatfield, AL10 9AB E-mail: [email protected]
Abstract
We present a new measurement of the linear bias of radio loud active galactic nuclei (RLAGN) at and selected from the Best & Heckman (2012) sample, made by cross-correlating the RLAGN surface density with a map of the convergence of the weak lensing field of the cosmic microwave background from Planck. We detect the cross-power signal at a significance of and use the amplitude of the cross-power spectrum to estimate the linear bias of RLAGN, , corresponding to a typical dark matter halo mass of . When RLAGN associated with optically-selected clusters are removed we measure a lower bias corresponding to . These observations support the view that powerful RLAGN typically inhabit rich group and cluster environments.
keywords:
galaxies:active - galaxies:haloes - large-scale structure of Universe - gravitational lensing:weak
††pubyear: 2018††pagerange: The linear bias of radio galaxies at via cosmic microwave background lensing–References
1 Introduction
Active galactic nuclei (AGN) play a fundamental role in galaxy evolution: they return vast amounts of energy into the interstellar and intergalactic medium through feedback, which can quench star formation and curtail cooling flows (see e.g. Hardcastle et al. (2007); McNamara & Nulsen (2012), and reviews by Fabian (2012) and Heckman & Best (2014)). It is now well known that the mass of central supermassive black holes (SMBHs) that power AGN is strongly correlated with the stellar mass of their host (Ferrarese & Merritt, 2000; Häring & Rix, 2004; Best et al., 2005) which in turn is correlated with local environment, for the most massive galaxies tend to reside in the most massive halos. The details of the link between stellar mass growth in galaxies, its dependence on local environment, and the role of AGN in regulating galaxy growth is hard to disentangle. A simple question that can provide important clues is in what environments do the most powerful AGN reside at ?
Radio-loud AGN (RLAGN) have high radio luminosities, , and reside in massive galaxies, (Yates et al., 1989; Hill & Lilly, 1991; Magliocchetti & Brüggen, 2007). RLAGN are often hosted by giant elliptical galaxies which preferentially sit within galaxy clusters (Donoso et al., 2010; Ineson et al., 2013) although it is not clear whether a high density environment is necessary for the RLAGN to be triggered (Pasquali et al., 2009). It has also been shown that RLAGN sit in more clustered environments than optically-selected quasars (Magliocchetti et al., 2017; Retana-Montenegro & Röttgering, 2017). In particular, there is evidence that optically-selected quasars reside in halos of typical mass of poor galaxy groups (Croom et al., 2005; Sherwin et al., 2012; Geach et al., 2013) and that RLAGN reside in halos consistent with rich galaxy groups and clusters () (Magliocchetti et al., 2004; Hickox et al., 2009).
The two-point angular correlation is most commonly used to determine the clustering of local radio galaxies, which generally indicate typical halo masses of for RLAGN, consistent with the picture described above. The recent high redshift work () of Magliocchetti et al. (2017), Retana-Montenegro & Röttgering (2017) and Hale et al. (2018) estimate similar halo masses to the low redshift work of Magliocchetti et al. (2004) (), implying little evolution in the typical host halos of RLAGN (although see Lindsay et al. (2014)). The technique of galaxy weak lensing has also been used to measure the projected mass density of the halo through the lensing shear of background galaxies by Mandelbaum et al. (2009) who measured a halo mass of for RLAGN at z<0.3, mainly an Fanaroff-Riley type I (FRI) (Fanaroff & Riley, 1974) sample, that are not known to reside in galaxy clusters. In yet another approach, Ineson et al. (2013, 2015) measured the X-ray luminosity of the intra-cluster medium (ICM) as a way of characterising the environments of RLAGN, estimating masses of order . This study identified a weak correlation between environment and AGN type, with evidence that high-excitation radio galaxies (HERGs) avoid richer environments compared to those of low excitation radio galaxies (LERGs). Evidence that the RLAGN preferentially inhabit the most massive halos was presented by Hickox et al. (2009), who again used a clustering analysis of a high redshift (z<0.8) sample, to measure a typical halo mass for RLAGN of compared to for X-ray selected AGN at the same redshift (see also Mountrichas et al. (2013) and Leauthaud et al. (2015)).
Here we approach the question using a relatively new method, cross-correlation of galaxy populations with the CMB weak lensing field to measure the bias of the population (Sherwin et al., 2012; Bleem et al., 2012; Geach et al., 2013; Planck-Collaboration et al., 2014; DiPompeo et al., 2015; DiPompeo et al., 2016). Previously, Allison et al. (2015) measured RLAGN using CMB lensing from the Atacama Cosmology Telescope (ACT), yielding a halo mass of with a high redshift sample. In this work we use a clean sample of RLAGN originally selected by Best & Heckman (2012) and the most recent CMB lensing map from Planck (Planck-Collaboration et al., 2018). We describe the sample and methodology in Section 2.1 & 2.2, and the main result in Section 2.3. Section 3 presents a discussion of the result and our conclusions. Throughout we adopt a Planck 2018 cosmology with , , , , and .
2 Analysis
2.1 The Radio-loud AGN sample
Best & Heckman (2012) present a catalogue of RLAGN chosen from NVSS (Condon et al., 1998) and FIRST (Becker et al., 1995) with mJy, which has been methodically separated from star forming galaxies. This gives a sample that has less contamination than the full catalogues. Each RLAGN has been optically classified from Sloan Digital Sky Survey (SDSS) spectroscopy (Data Release 7) (Abazajian et al., 2009) and, since matter bias is redshift dependent, having good spectroscopic redshift data makes the result more reliable than estimating the redshift distribution (Allison et al., 2015). From the parent sample, we select 12,820 sources classified as AGN, resulting in a sample of RLAGN with . Figure 1 shows the redshift distribution of the sample, which has a mean . We generate a healpix map (Górski et al., 2005) of the RLAGN surface density through a counts-in-cells method, simply summing the number of sources falling within a particular healpix nside = 2048 pixel and normalising by the solid angle subtended by that pixel, giving the local surface density . We then evaluate the fractional overdensity , where is the average density of radio galaxies over the survey. For the latter we determine the total area of the survey mask, which is defined by the union of the SDSS and FIRST survey footprints. This results in a region roughly bounded by Declinations from to and Right Ascension to . The total solid angle is deg2.
2.2 CMB weak lensing cross-correlation
The lensed CMB temperature in direction is related to the unlensed temperature:
[TABLE]
where the deflection angle and is the projected lensing potential. The lensing convergence is . In this analysis we use the Planck 2018 baseline lensing map (Planck-Collaboration et al., 2018) which estimates using a minimum variance quadratic estimator (Zaldarriaga & Seljak, 1999; Okamoto & Hu, 2003). An associated mask (Planck-Collaboration et al., 2014) removes approximately a third of the sky due to contamination from the Galactic foreground, bright Sunyaev-Zel’dovich Effect clusters and point sources, resulting in a lensing estimate over 67 per cent of the sky. We combine the Planck lensing mask with the RLAGN survey mask described in section 2.1 to create a union mask which we use in the following analysis.
In Figure 2 we show a flat-sky projection of the lensing map with the RLAGN overdensity map overlaid as contours (both maps smoothed with a Gaussian of width ). In the following we quantify the cross-power between the RLAGN density and lensing full (partial sky) maps.
We calculate the cross-power spectrum using polspice (Challinor et al., 2011), which employs fast spherical harmonic transforms and allows for a cut-sky approach using a ‘pseudo-’ estimator technique (Peebles (1973), Wandelt et al. (2001), Efstathiou (2004)). The maps are apodized using a cosine weighting function (). In Figure 3 we present the -binned cross-power spectrum. To estimate the uncertainty on the cross-power spectrum, we use the ensemble of 300 noise realisations released as part of the Planck 2018 lensing package. These are based on the unlensed CMB power spectrum combined with artificial lensing potentials to produce maps with projected distributions uncorrelated with the real CMB in the presence of realistic noise (including instrumental noise, Gaussian simulations of foreground power, point-source shot noise). We perform identical cross-correlations between the RLAGN density map and the noise realisations, constructing a covariance matrix:
[TABLE]
where run over bins in and indicates the average over all noise realisations per bin.
To model the observed cross-power spectrum, we follow the formalism of Bleem et al. (2012), Geach et al. (2013) and others, where is modelled using the Limber approximation (Limber, 1953; Kaiser, 1992), which is accurate to about 10% for scales larger than a few degrees (Simon, 2007):
[TABLE]
where is the linear matter power spectrum (Eisenstein & Hu, 1999), is the lensing convergence kernel, is the RLAGN distribution kernel and is the comoving distance to redshift . The lensing kernel is given by (Cooray & Hu, 2000; Song et al., 2003)
[TABLE]
where is the cosmological scale factor, with Gpc. The convergence along a particular line-of-sight is related to by
[TABLE]
Similarly, fluctuations in the RLAGN density field can be represented by
[TABLE]
where the AGN distribution kernel is given by
[TABLE]
and is the integral-normalized redshift distribution of the sample. Finally, is the linear bias of the galaxies.
2.3 Results
The bias sets the amplitude of the cross-power spectrum, and we can estimate it by minimizing
[TABLE]
We measure with . For the null hypothesis , the significance of the detection is given by . We measure , indicating a detection significance of 3.2 for the cross-power signal. The cross-power spectrum for is shown in Figure 3. We perform an additional check by rotating the CMB lensing map by to misalign the maps before measuring the RLAGN-lensing cross-correlation, confirming a null detection (see Figure 3).
We use the bias to estimate the characteristic or average halo mass, , using the bias-halo fitting function of Tinker et al. (2010), and assuming the halo mass is defined as the total mass enclosed with a radius within which the average density is 200 times the mean density of the Universe. The function is defined in terms of the ratio of the critical density for spherical collapse and the variance of the matter field on scales of the halo, , where and is the mean density of the Universe. Using our measured bias, we find a characteristic RLAGN halo mass of at .
3 Discussion & Conclusions
The initial implications of these results is that RLAGN reside in rich galaxy groups and clusters. This supports the hypothesis (Magliocchetti et al., 2017) that RLAGN require massive galaxies, since the most massive galaxies will preferentially sit in group/cluster-scale halos. How does our measurement compare to the literature? Using the ACT CMB lensing map Allison et al. (2015) measured a halo mass of for a similar RLAGN sample, albeit with a higher average redshift . Magliocchetti et al. (2004) estimate a halo mass of at through a clustering analysis for a RLAGN sample also selected through FIRST. Although our measurement is at the high end, the results are statistically consistent.
Measuring a single ‘average’ halo mass hides information about the more complex luminosity and redshift relationships that may exist, and the intrinsic halo mass distribution at fixed redshift and luminosity. For example, Magliocchetti et al. (2004) infer that there is a halo mass cut-off for RLAGN with an estimate of at . We can actually test the influence of massive clusters on our halo mass estimate by removing RLAGN that coincide with the positions of known clusters with . Using the redMaPPer catalogue (Rykoff et al., 2014) we repeated our analysis after removing RLAGN that lie within 1-arcminutes of an optically-selected cluster, corresponding to 15% of the sample. Excluding these, the resulting bias drops to (at the same redshift) corresponding to an average halo mass of , comparable to the results of Magliocchetti et al. (2004) and Allison et al. (2015) and indicating that RLAGN populate the massive end of the halo mass function.
Although we find broadly consistent results, a key difference between our sample and Magliocchetti et al. (2004) and Allison et al. (2015) is a higher luminosity cut. The flux density limit of mJy selects galaxies with at and our RLAGN sample is classified via spectroscopy. Allison et al. (2015) select with mJy and assume that sources at are RLAGN. Magliocchetti et al. (2004) also probe a lower luminosity range and identify all the RLAGN as FRI, however, they found little dependency of RLAGN halo mass on luminosity. Unfortunately, the current sample is too small to probe any redshift or luminosity dependence in the lensing cross-power signal, although this will become possible with future large radio surveys with LOFAR, ASKAP, MeerKAT and eventually the SKA, provided reliable redshifts and classifications can be made.
Acknowledgements
CD is grateful to the Daphne Jackson Trust and the UK Science and Technology Facilities Council (STFC) who fund and support this work through a Daphne Jackson Research Fellowship. JEG acknowledges the support of the Royal Society through a University Research Fellowship. MJH acknowledges support from STFC [ST/M001008/1]. This research has made use of the University of Hertfordshire high-performance computing facility http://uhhpc.herts.ac.uk. This research made use of astropy, a community-developed core Python package for astronomy (Astropy-Collaboration et al., 2018), and of topcat (Taylor, 2005). The work is based on observations obtained with Planck http://www.esa.int/Planck, an ESA science mission with instruments and contributions directly funded by ESA Member States, NASA, and Canada.
The reference list from the paper itself. Each links out to its DOI / PubMed record.
- 1Abazajian et al. (2009) Abazajian K. N., et al., 2009, Ap JS, 182, 543
- 2Allison et al. (2015) Allison R., et al., 2015, MNRAS, 451, 849
- 3Astropy-Collaboration et al. (2018) Astropy-Collaboration et al., 2018, A & A (preprint ar Xiv)
- 4Becker et al. (1995) Becker R. H., White R. L., Helfand D. J., 1995, Ap J, 450, 559
- 5Best & Heckman (2012) Best P. N., Heckman T. M., 2012, MNRAS, 421, 1569
- 6Best et al. (2005) Best P. N., Kauffmann G., Heckman T. M., Brinchmann J., Charlot S., Ivezić Ž., White S. D. M., 2005, MNRAS, 362, 25
- 7Bleem et al. (2012) Bleem L. E., et al., 2012, Ap J, 753, L 9
- 8Challinor et al. (2011) Challinor A., Chon G., Colombi S., Hivon E., Prunet S., Szapudi I., 2011, Astrophysics Source Code Library, p. ascl:1109.005