Measurement of $B^+$, $B^0$ and $\Lambda_b^0$ production in $p\mkern 1mu\mathrm{Pb}$ collisions at $\sqrt{s_\mathrm{NN}}=8.16\,{\rm TeV}$
LHCb Collaboration: R. Aaij, C. Abell\'an Beteta, B. Adeva, M., Adinolfi, C.A. Aidala, Z. Ajaltouni, S. Akar, P. Albicocco, J. Albrecht, F., Alessio, M. Alexander, A. Alfonso Albero, G. Alkhazov, P. Alvarez Cartelle,, A.A. Alves Jr, S. Amato, S. Amerio, Y. Amhis, L. An

TL;DR
This paper measures the production rates of $B^+$, $B^0$, and $ olinebreak \\Lambda_b^0$ hadrons in proton-lead collisions at 8.16 TeV, revealing nuclear suppression effects and comparing baryon-to-meson production ratios.
Contribution
It provides the first detailed double-differential cross-section measurements of these hadrons in pPb collisions at this energy, including nuclear modification factors and production ratios.
Findings
Significant nuclear suppression at positive rapidity.
Measured $ olinebreak \\Lambda_b^0$ to $B^0$ production ratio consistent with proton-proton collisions.
Forward-to-backward cross-section ratios indicate nuclear effects.
Abstract
The production of , and hadrons is studied in proton-lead collisions at a centre-of-mass energy per nucleon pair of recorded with the LHCb detector at the LHC. The measurement uses a dataset corresponding to an integrated luminosity of for the case where the proton beam is projected into the LHCb detector (corresponding to measuring hadron production at positive rapidity) and for the lead beam projected into the LHCb detector (corresponding to measuring hadron production at negative rapidity). Nuclear effects are probed through double-differential cross-sections, forward-to-backward cross-section ratios and nuclear modification factors of the beauty hadrons. The double-differential cross-sections are measured as a function of the beauty-hadron transverse momentum…
Click any figure to enlarge with its caption.
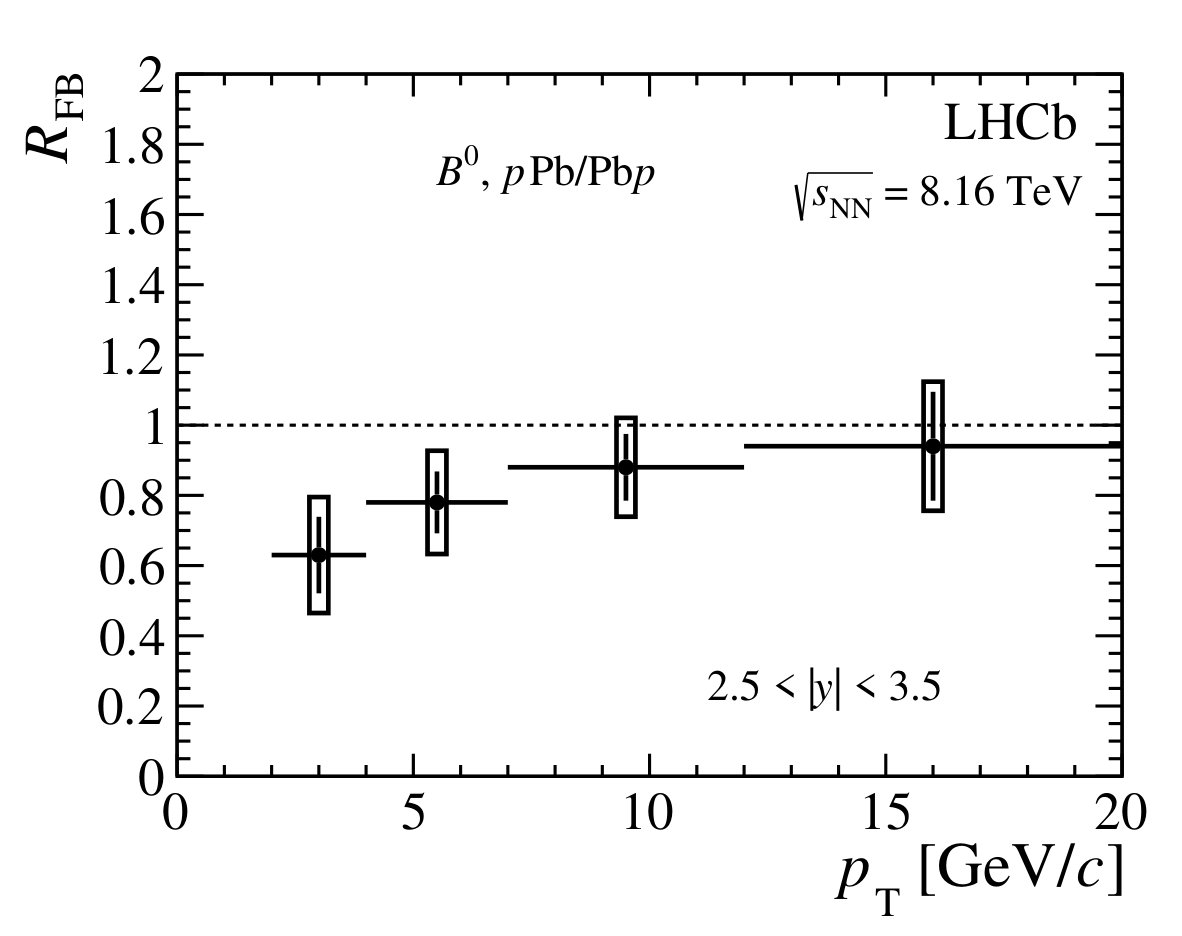 Figure 10
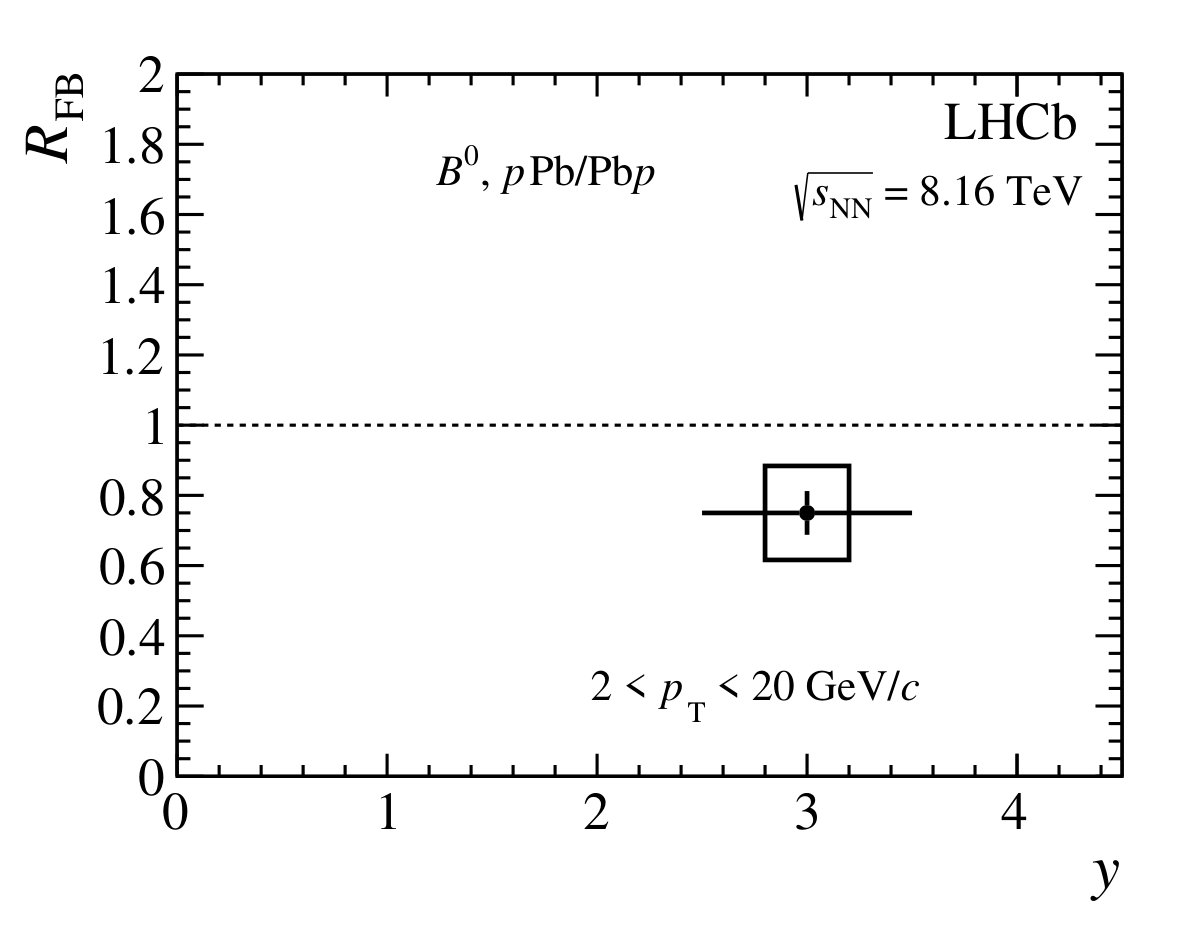 Figure 10
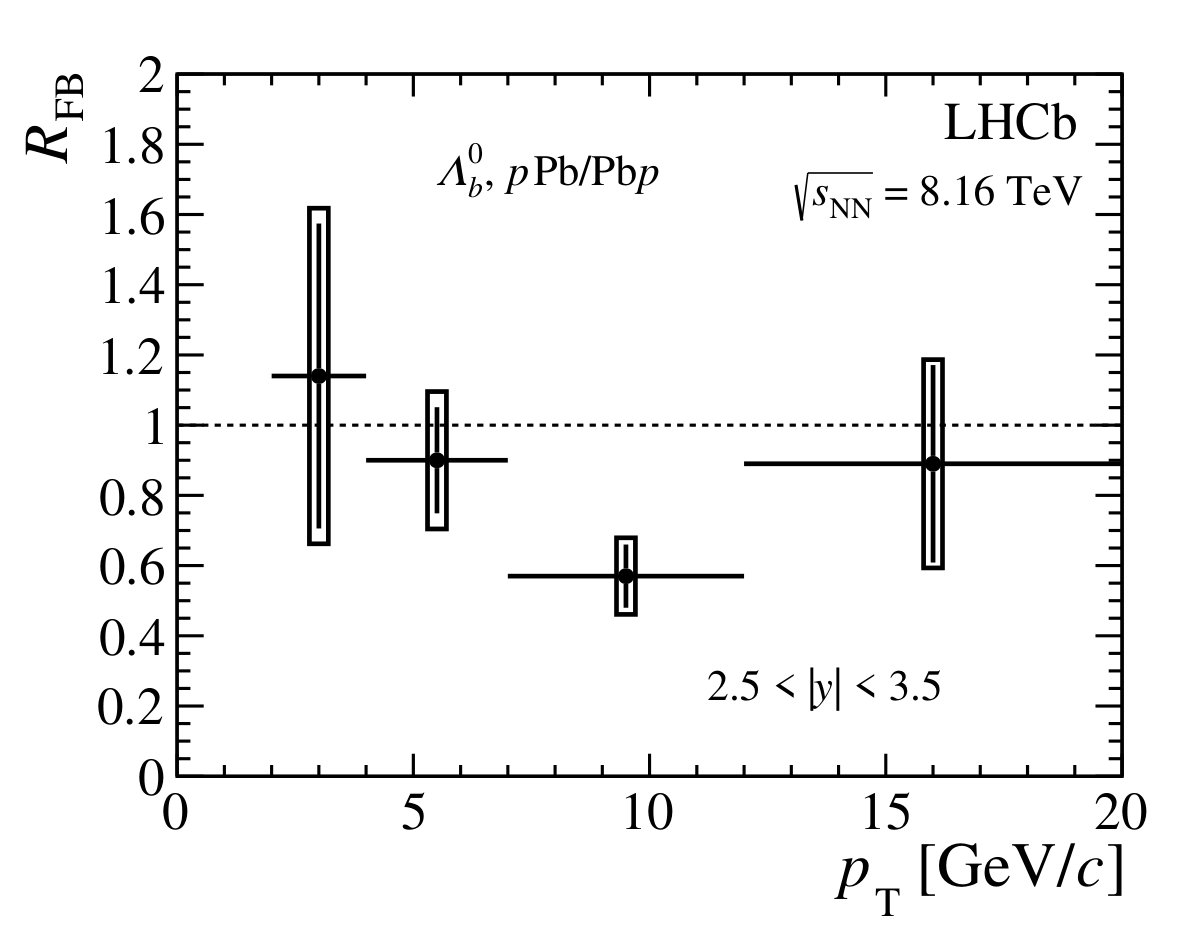 Figure 11
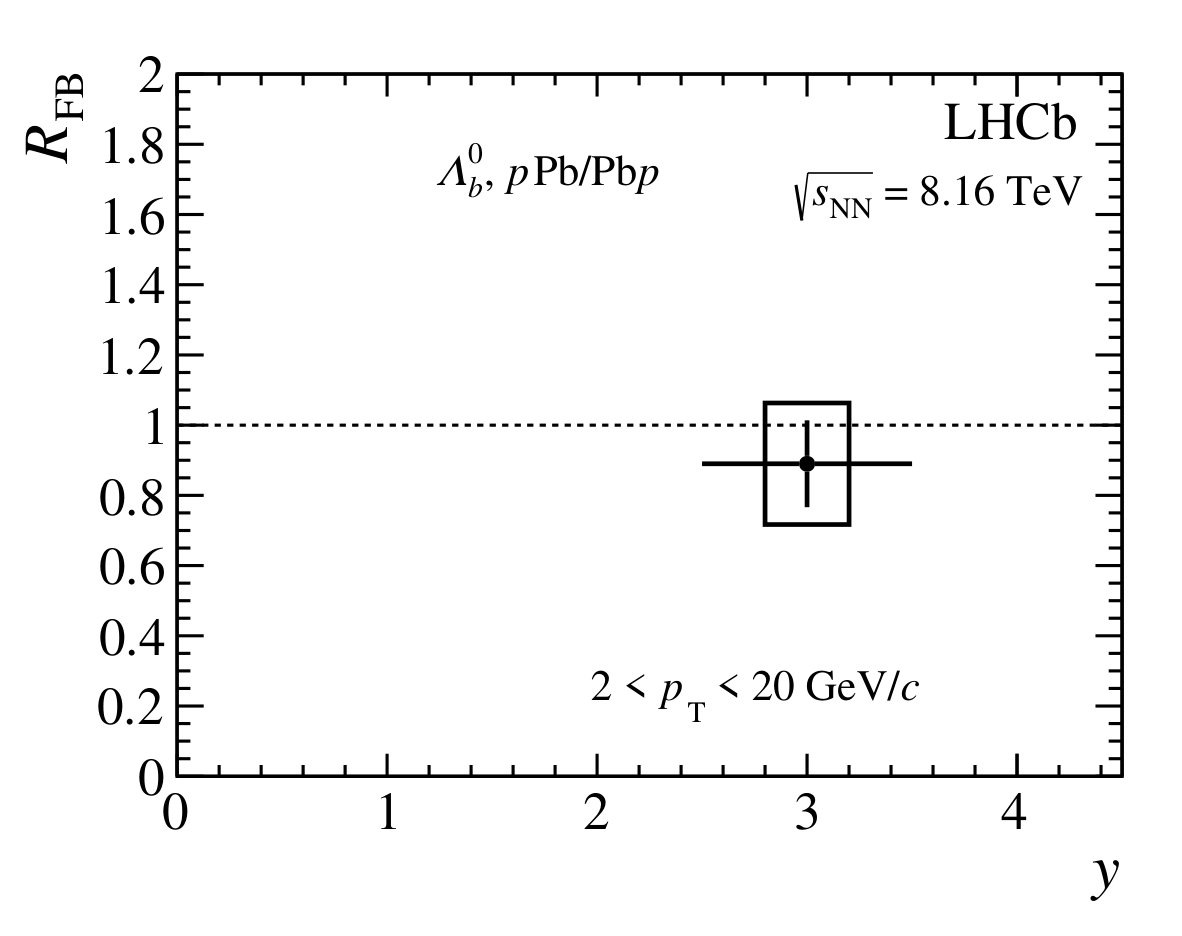 Figure 11
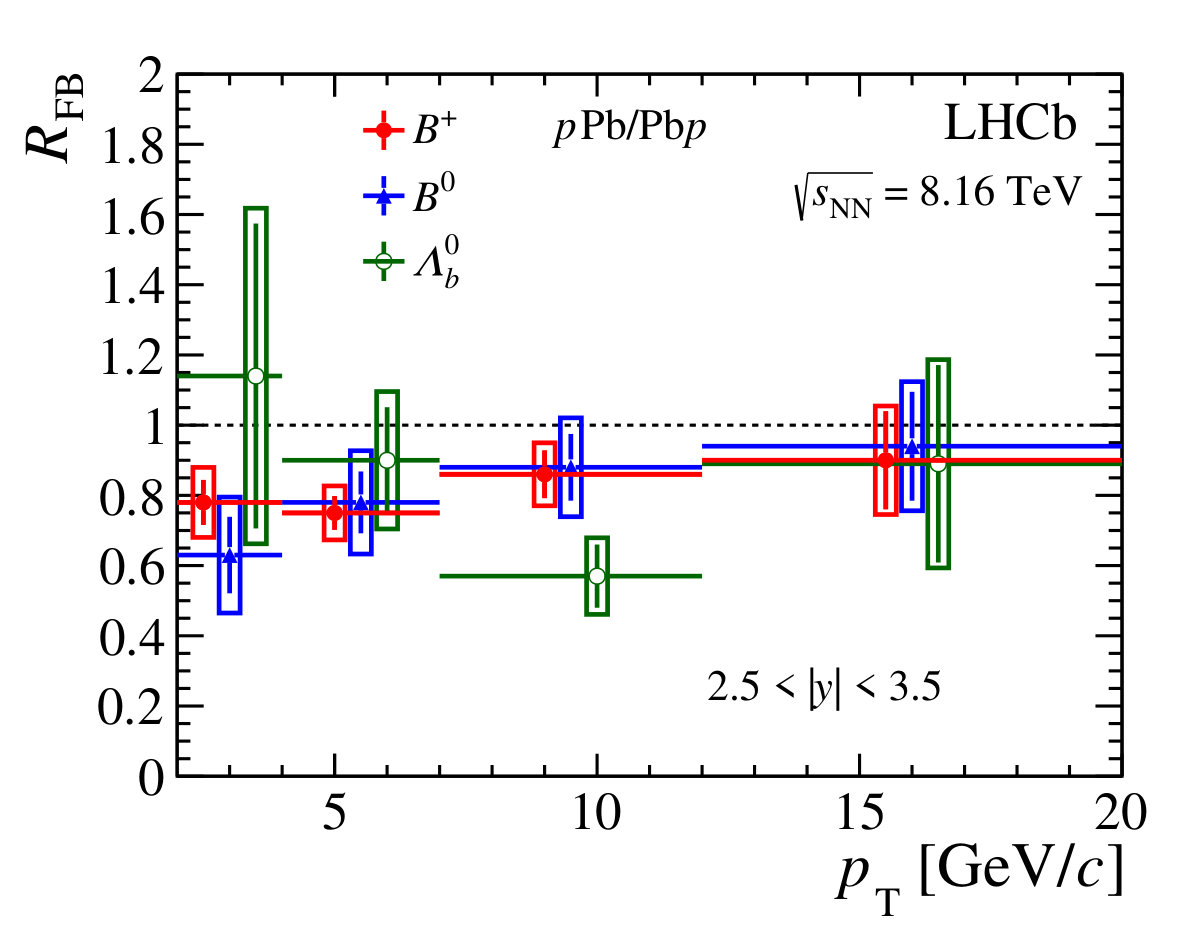 Figure 12
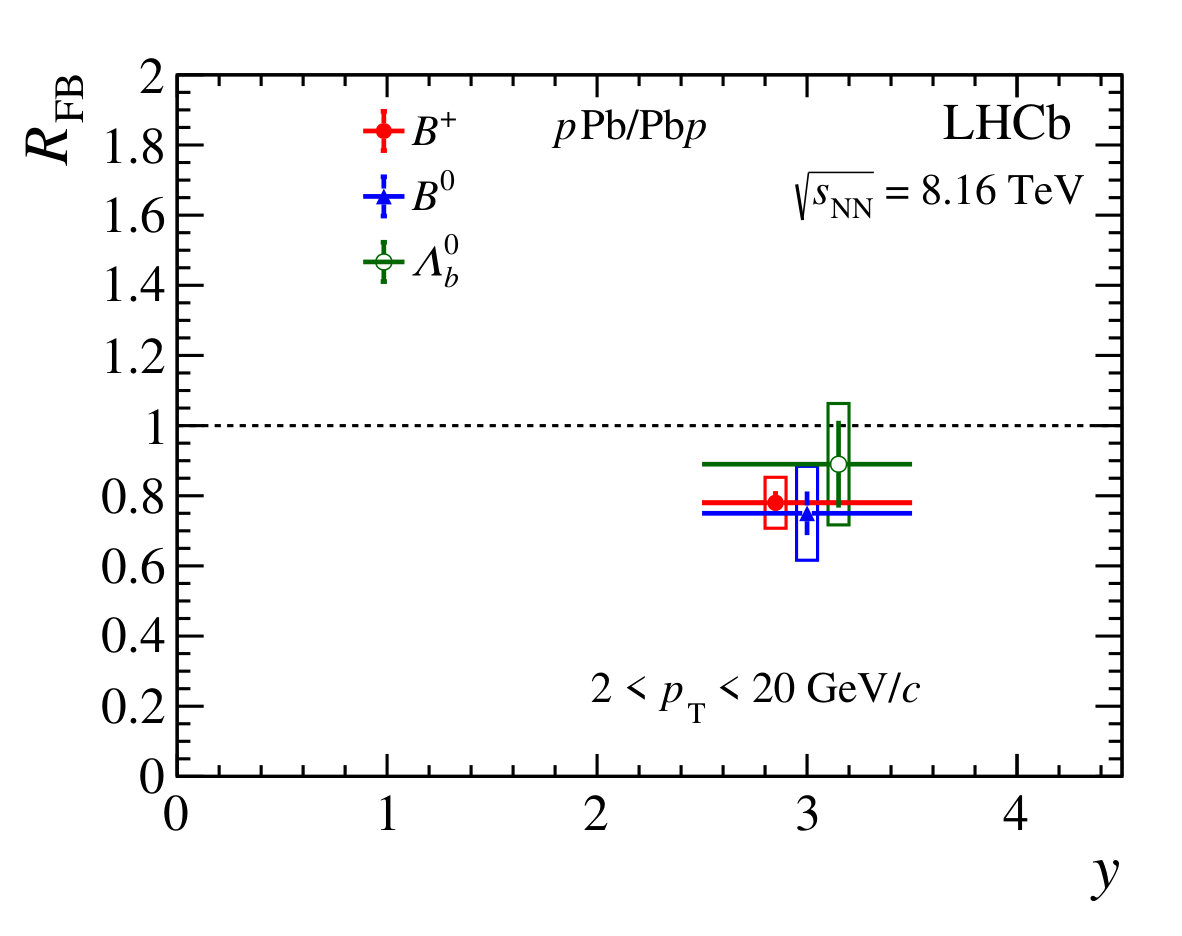 Figure 12
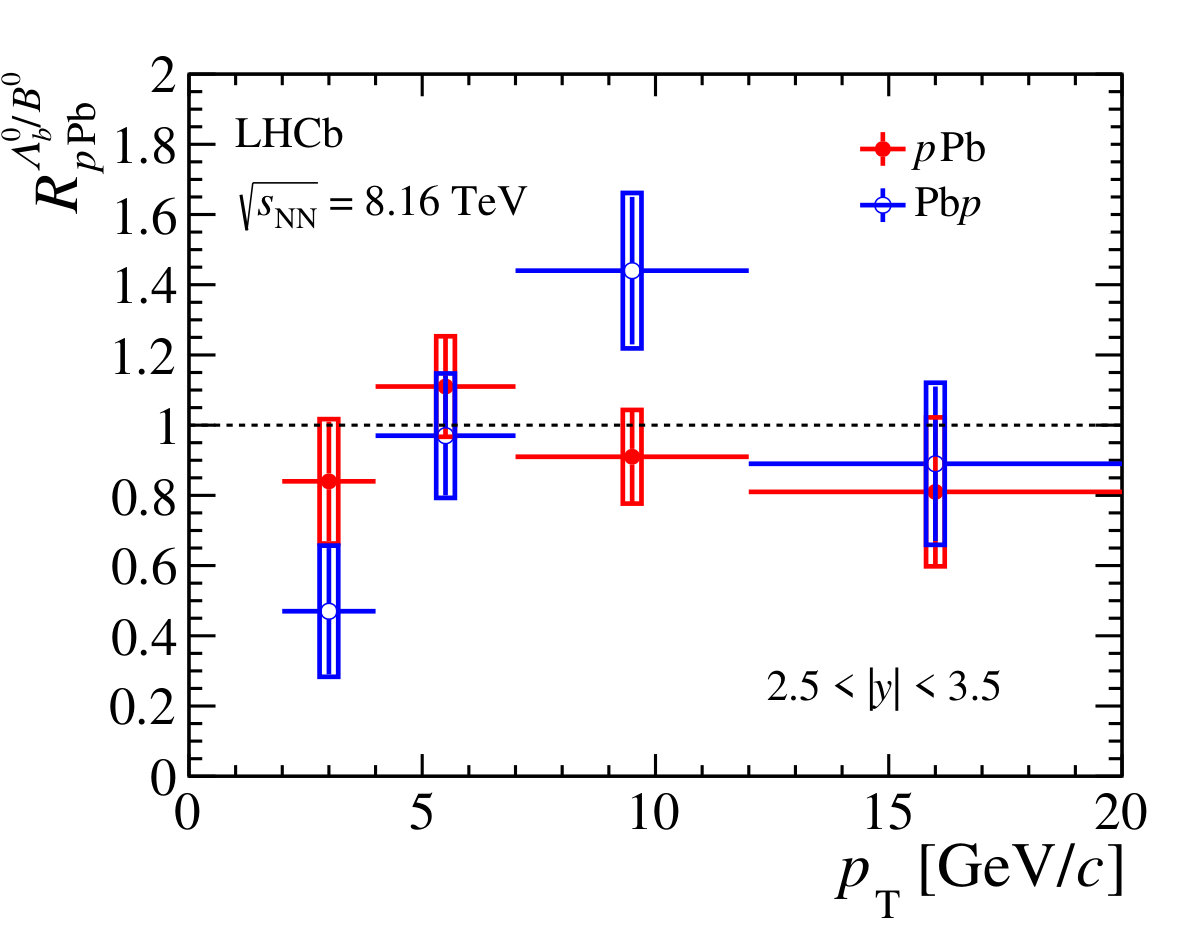 Figure 13
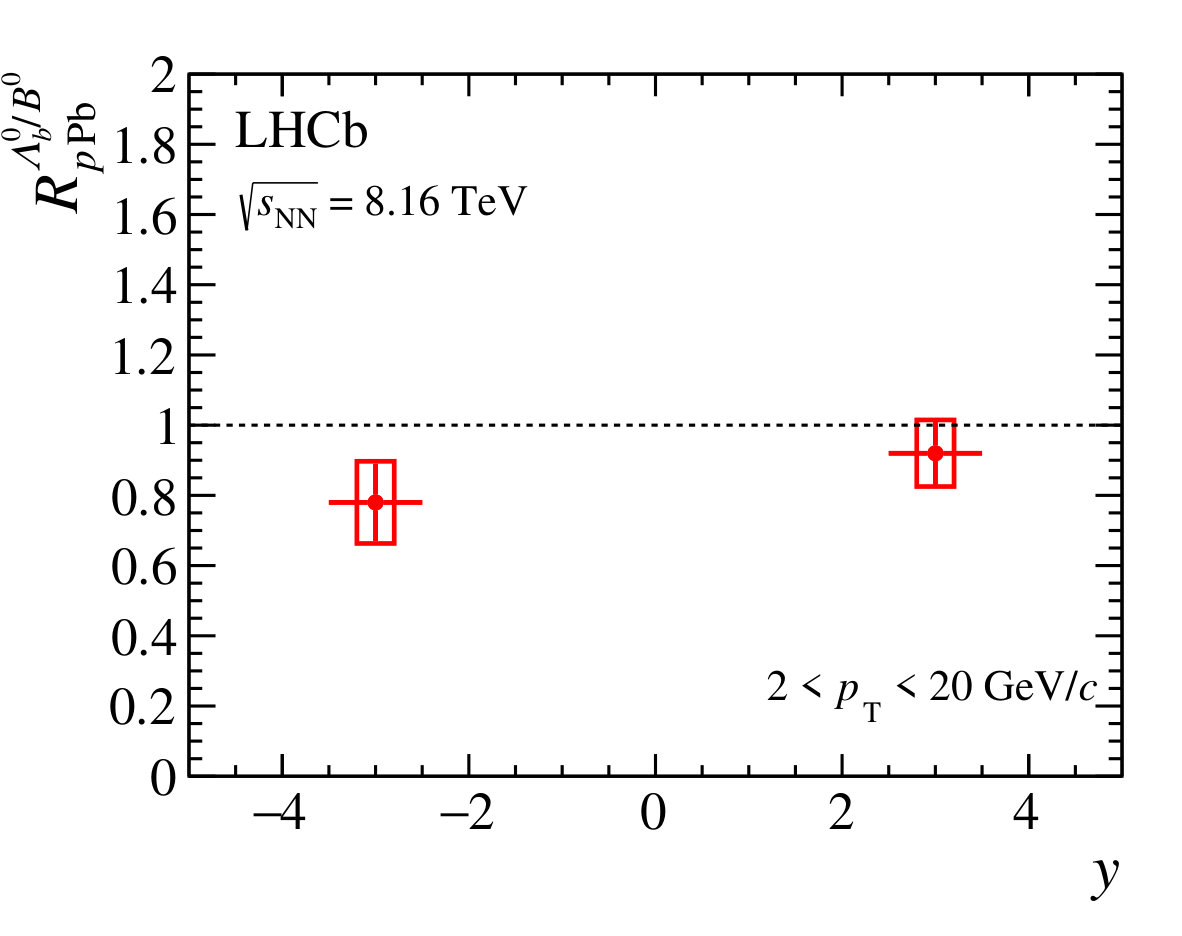 Figure 13
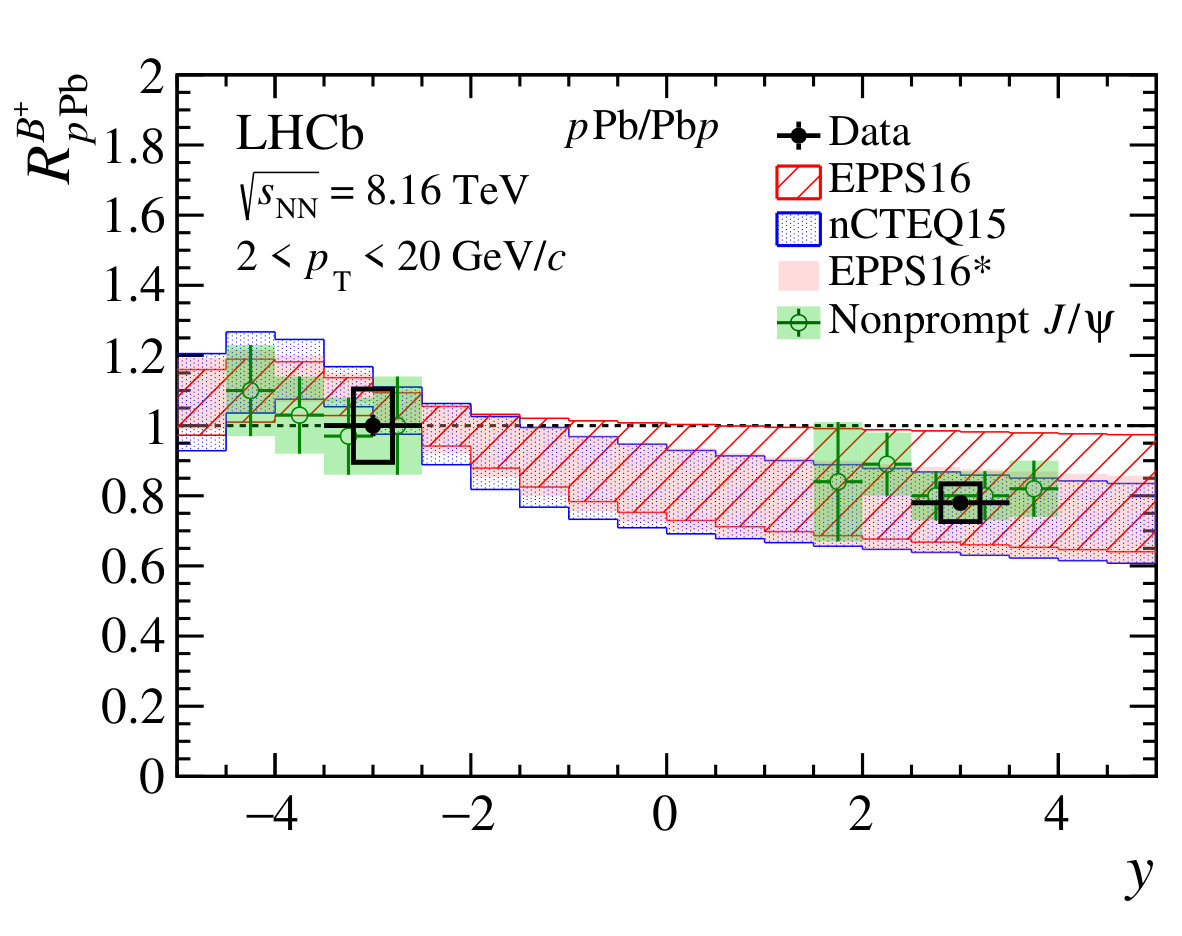 Figure 14
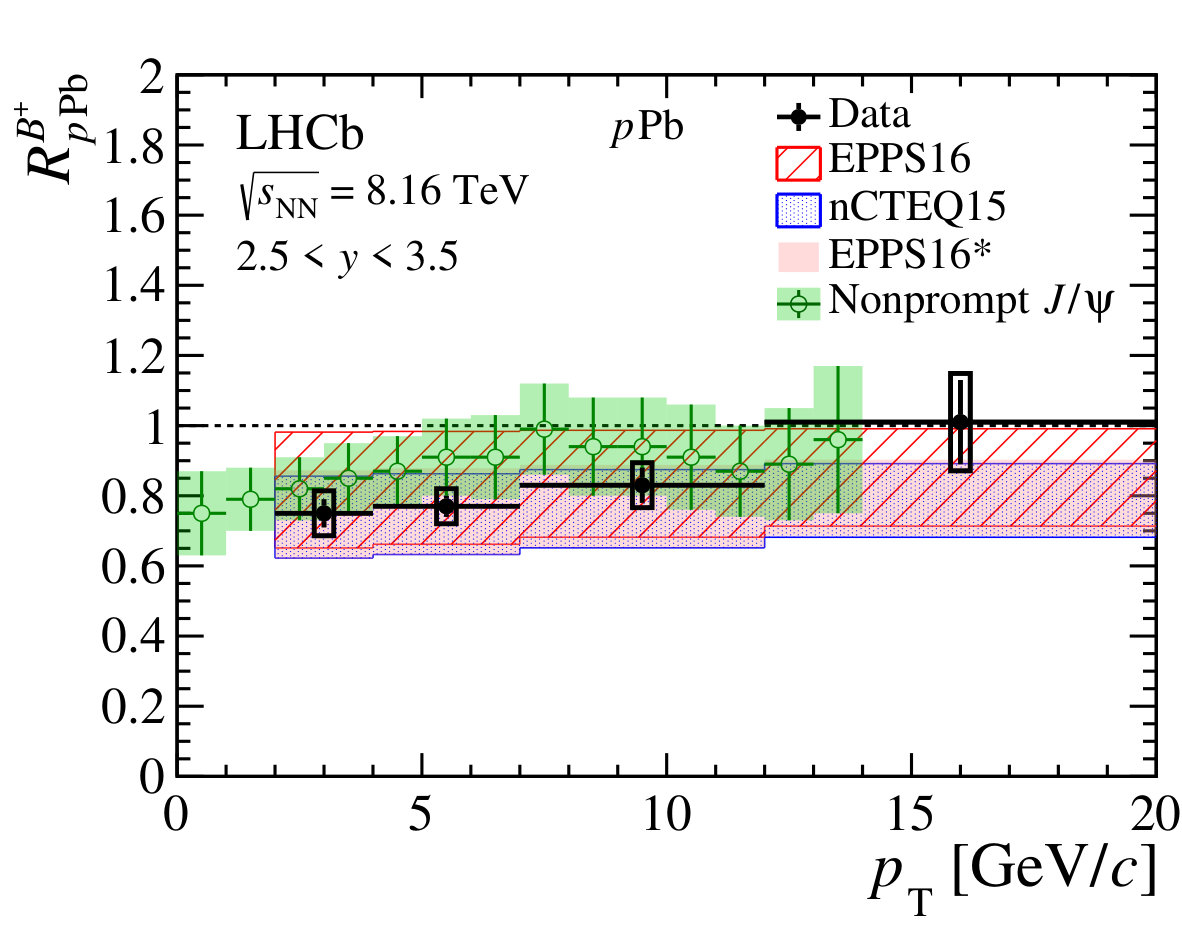 Figure 14
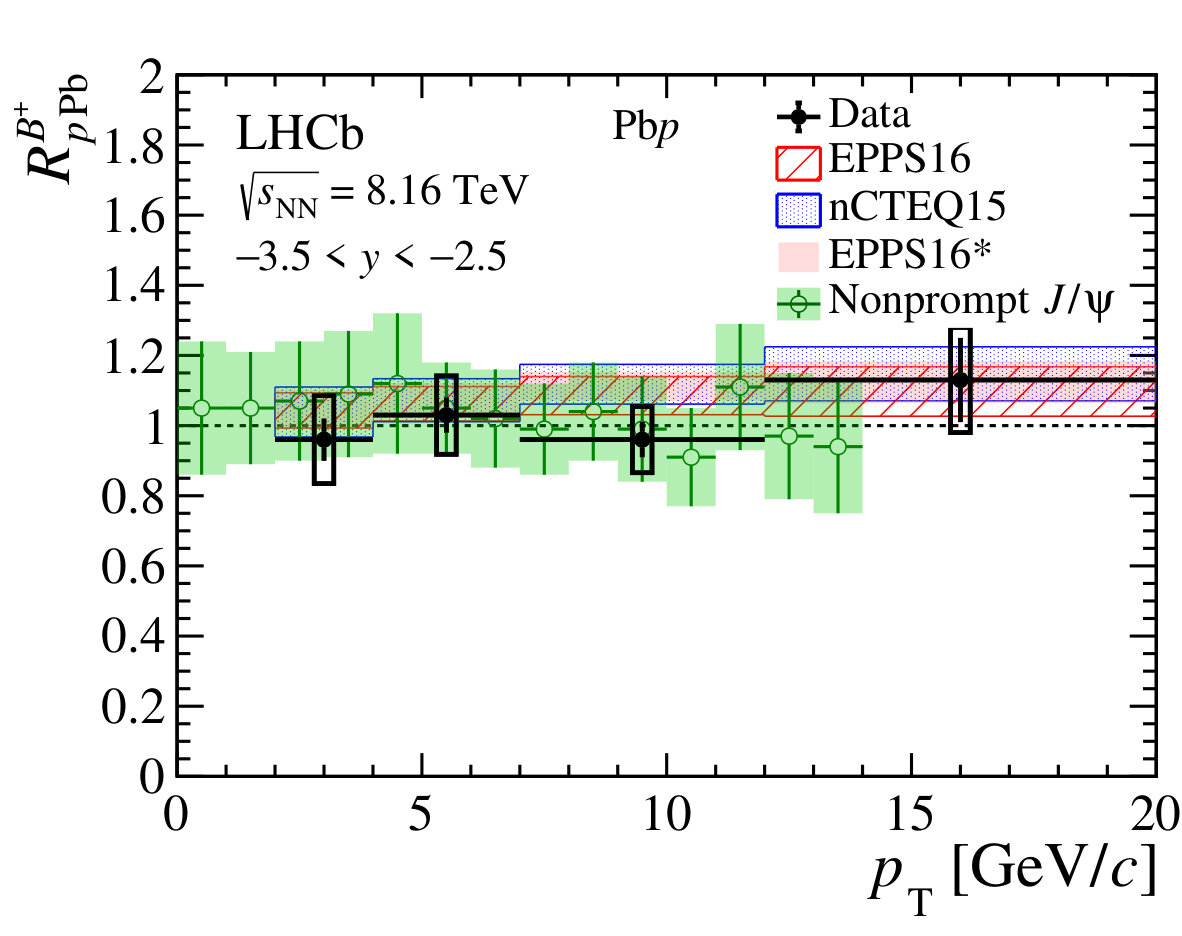 Figure 14
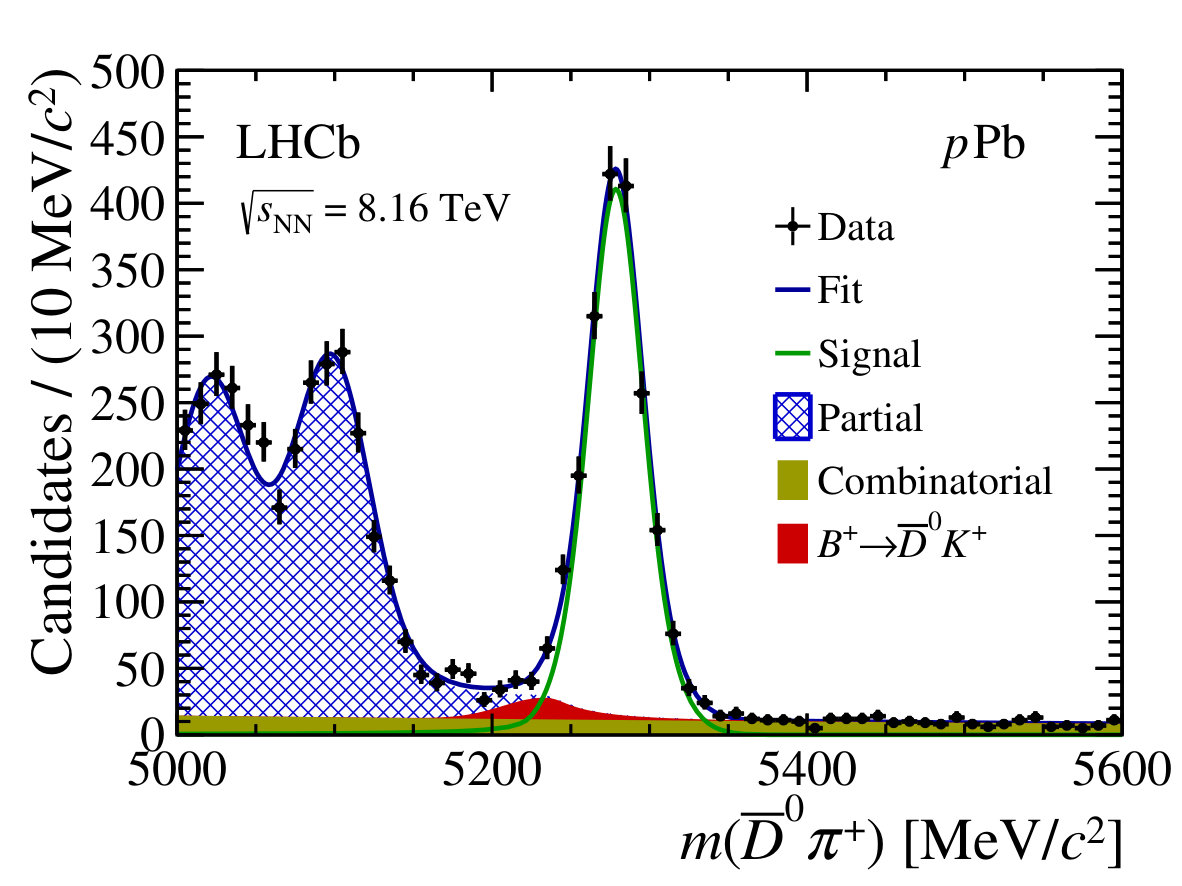 Figure 1
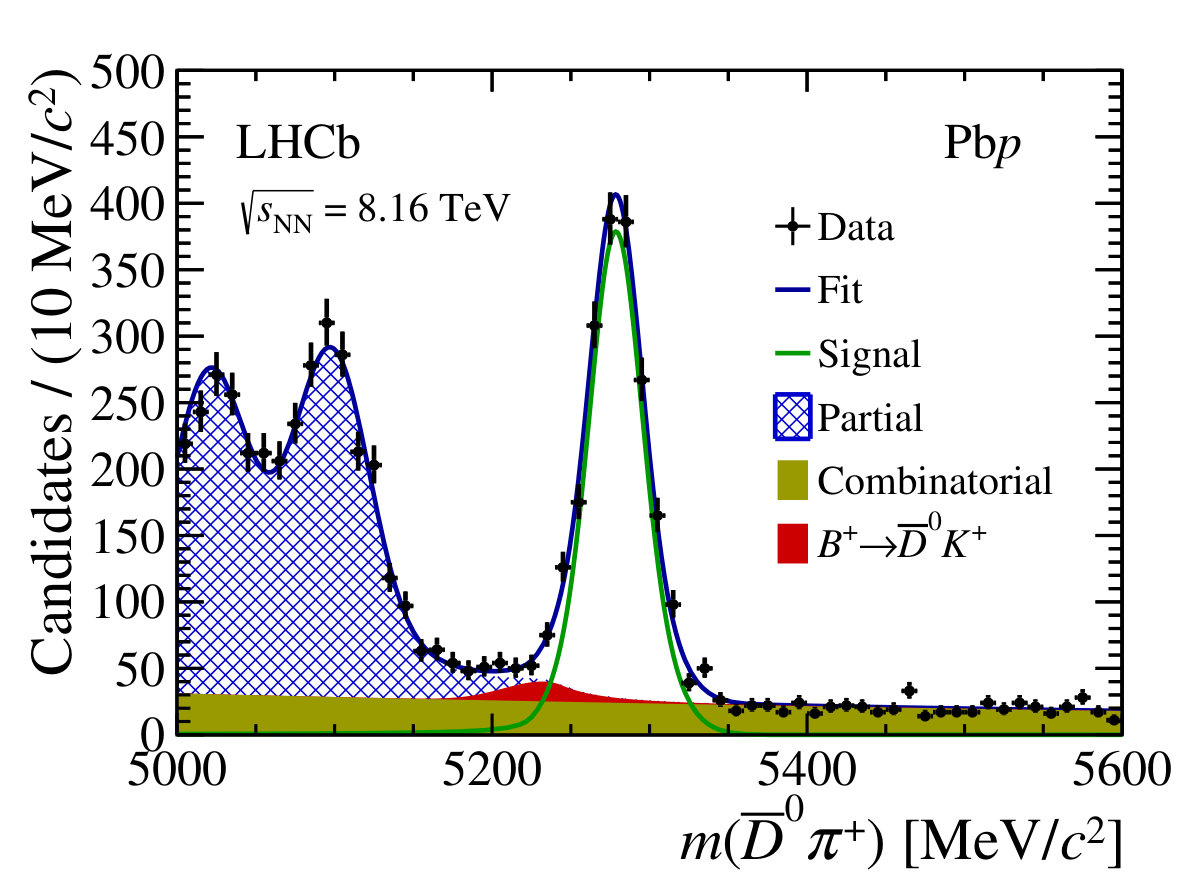 Figure 1
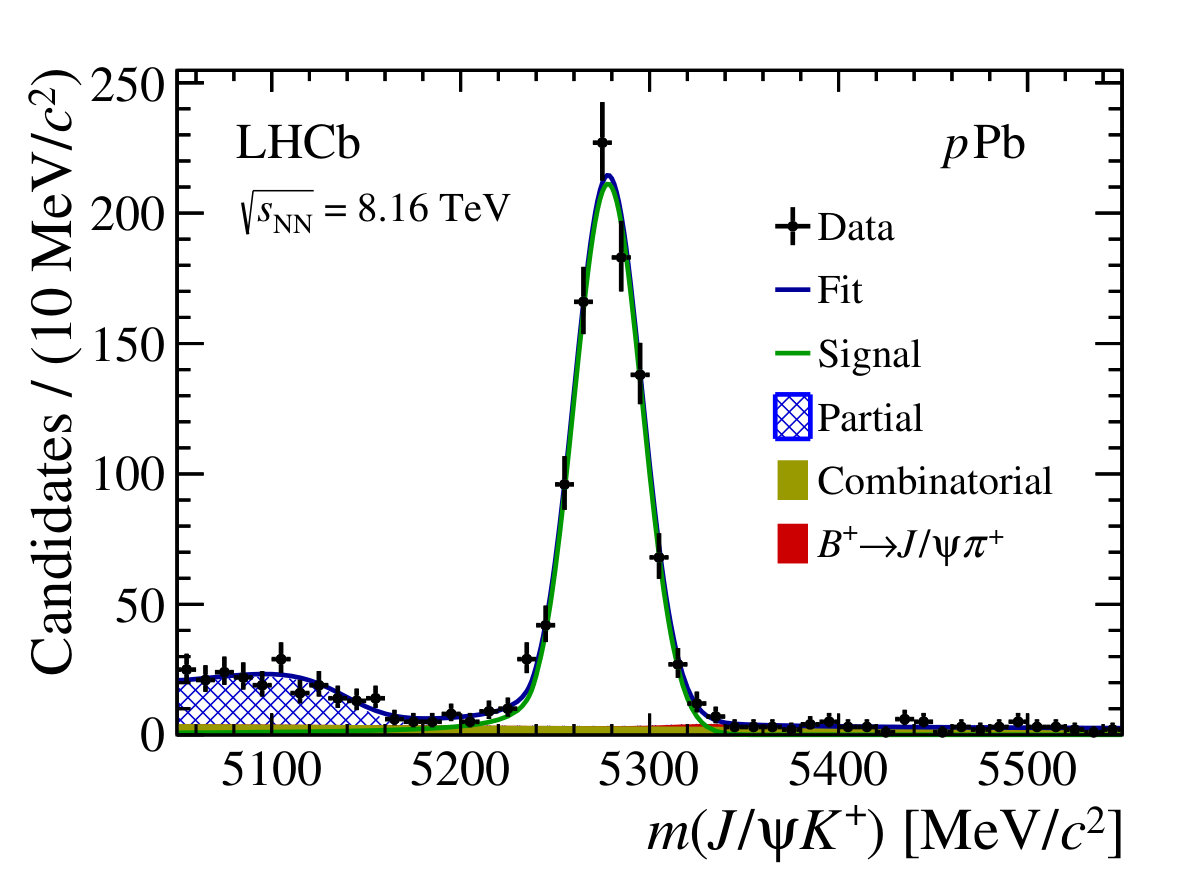 Figure 2
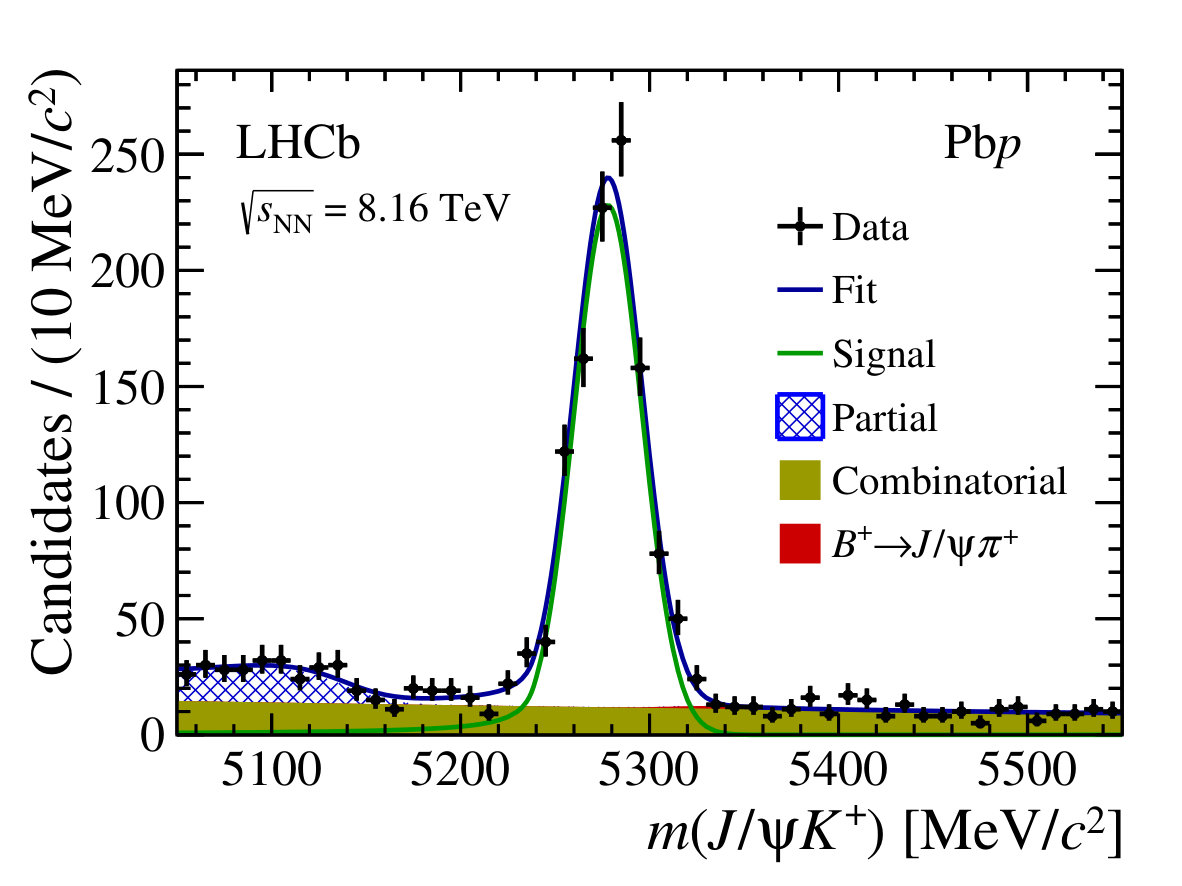 Figure 2
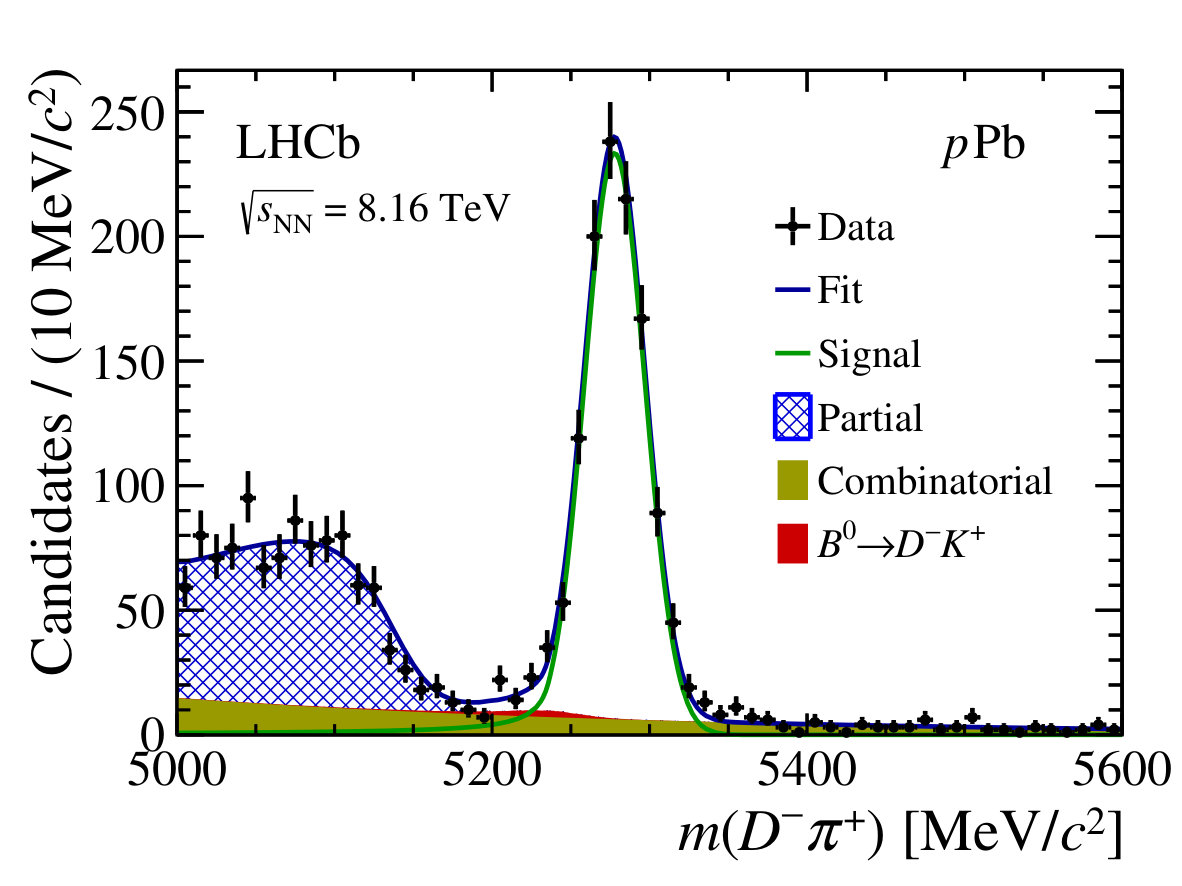 Figure 3
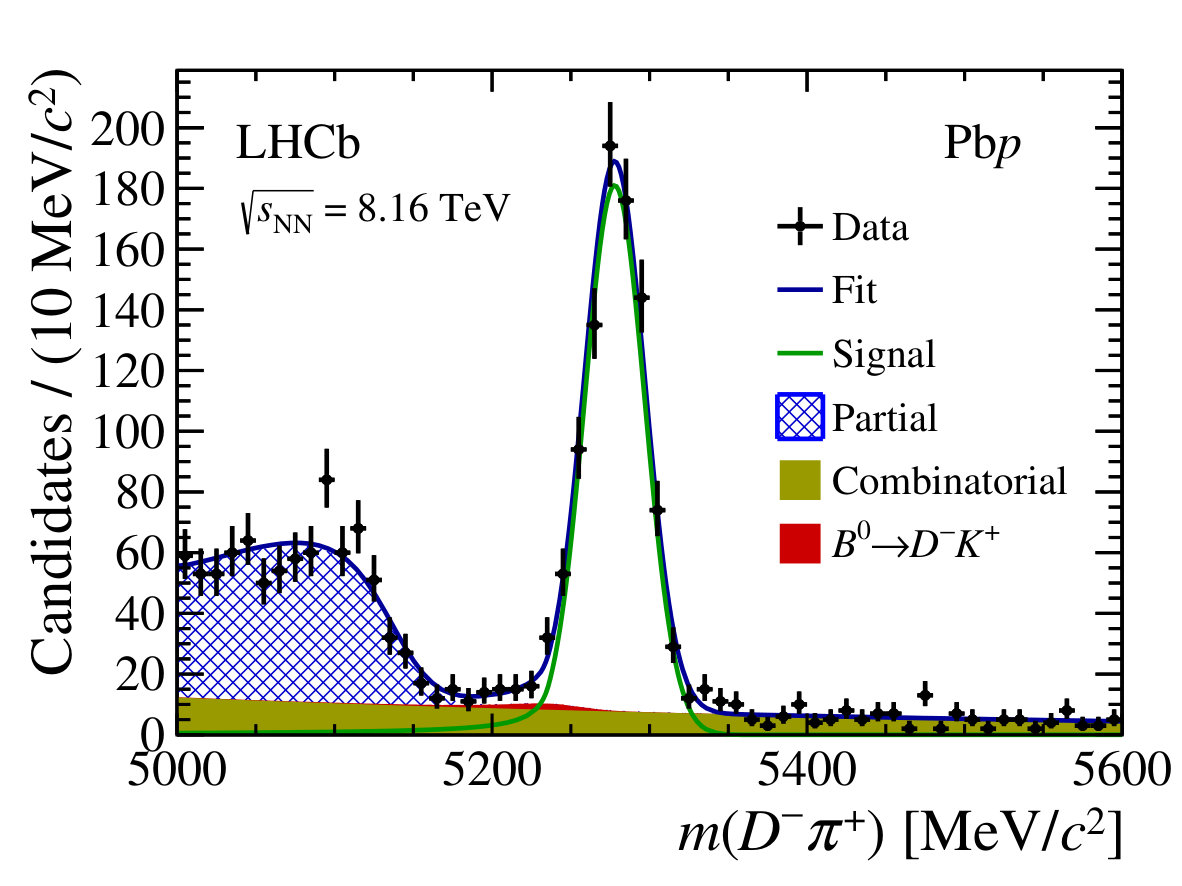 Figure 3
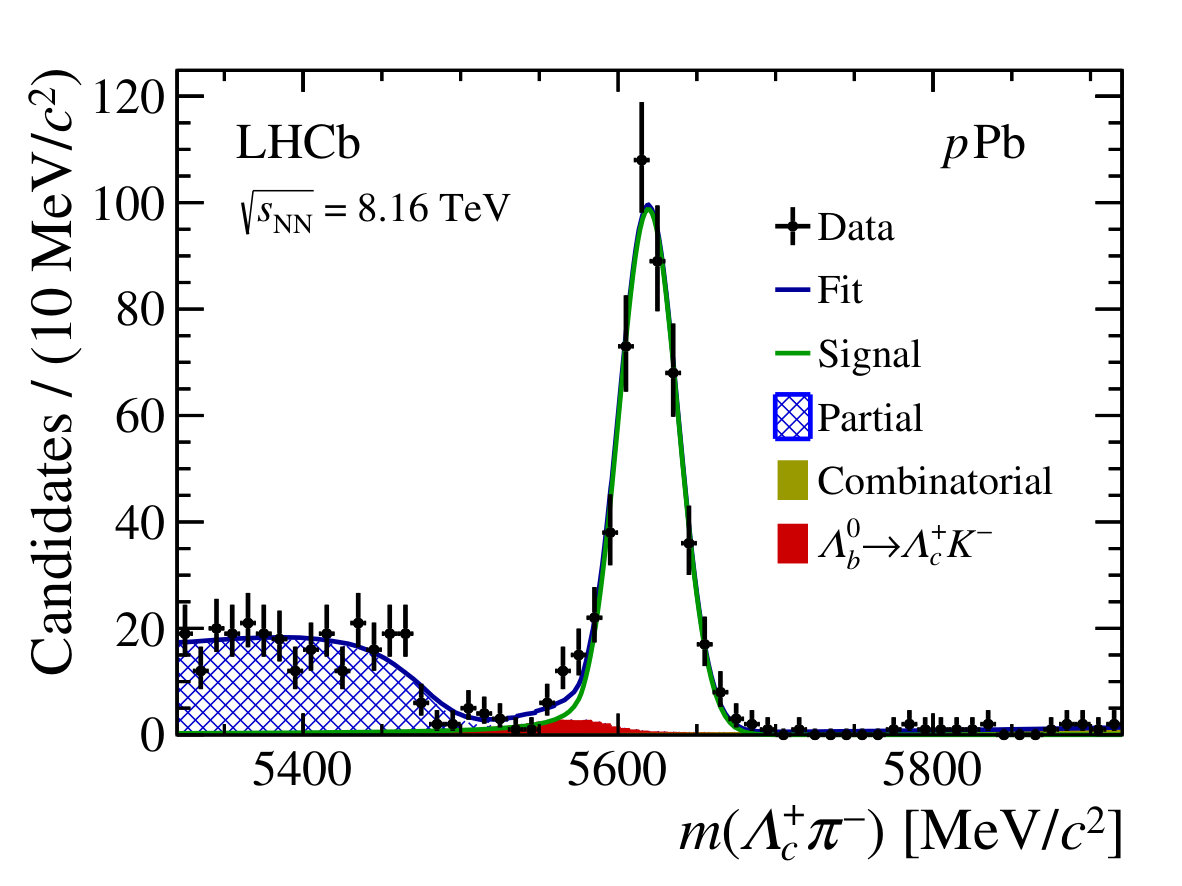 Figure 4
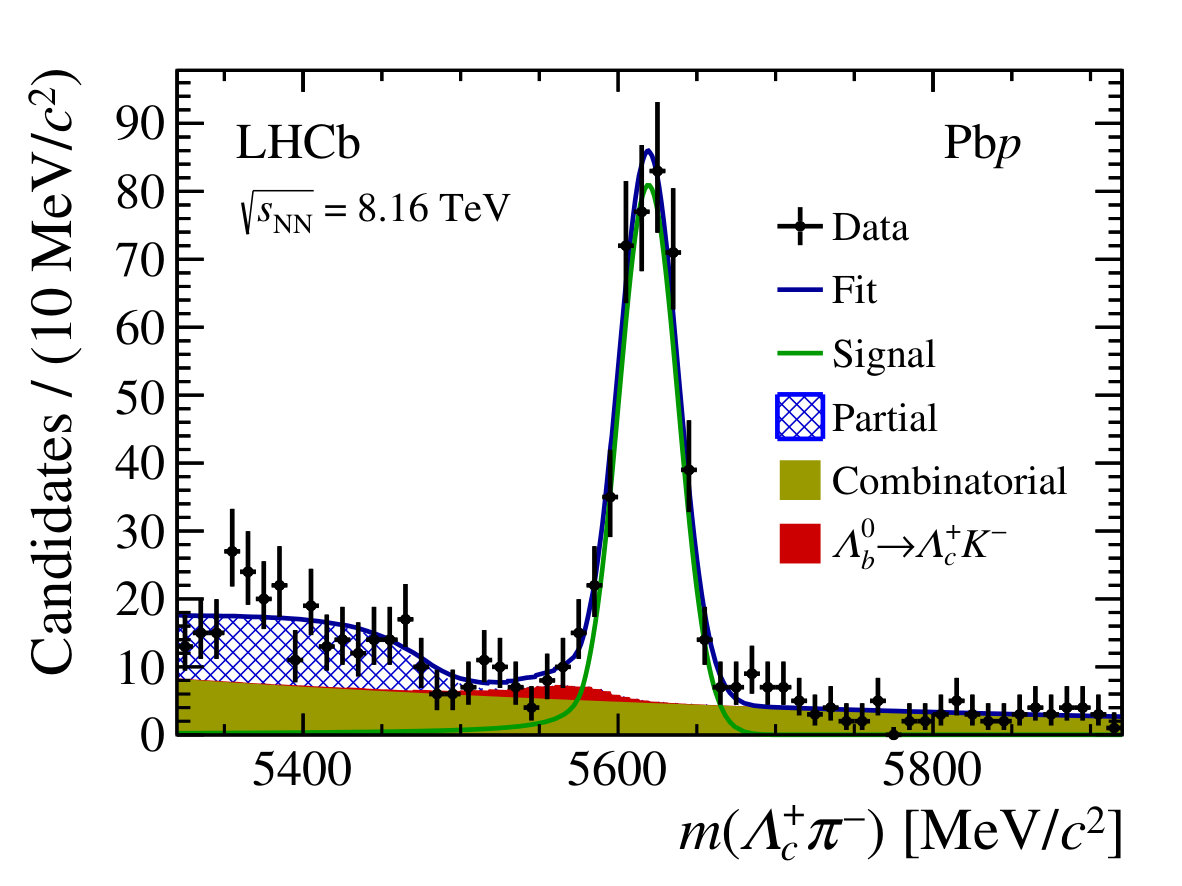 Figure 4
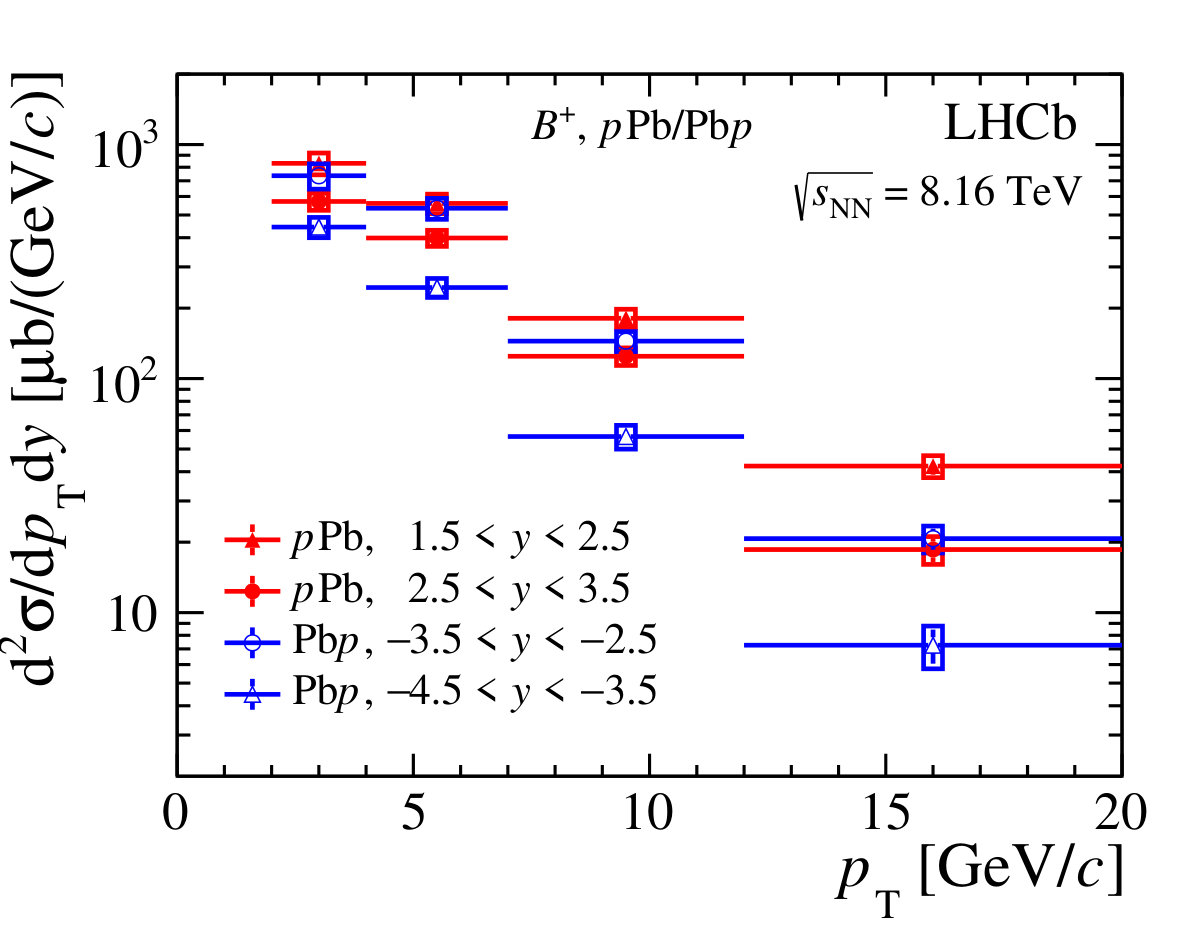 Figure 5
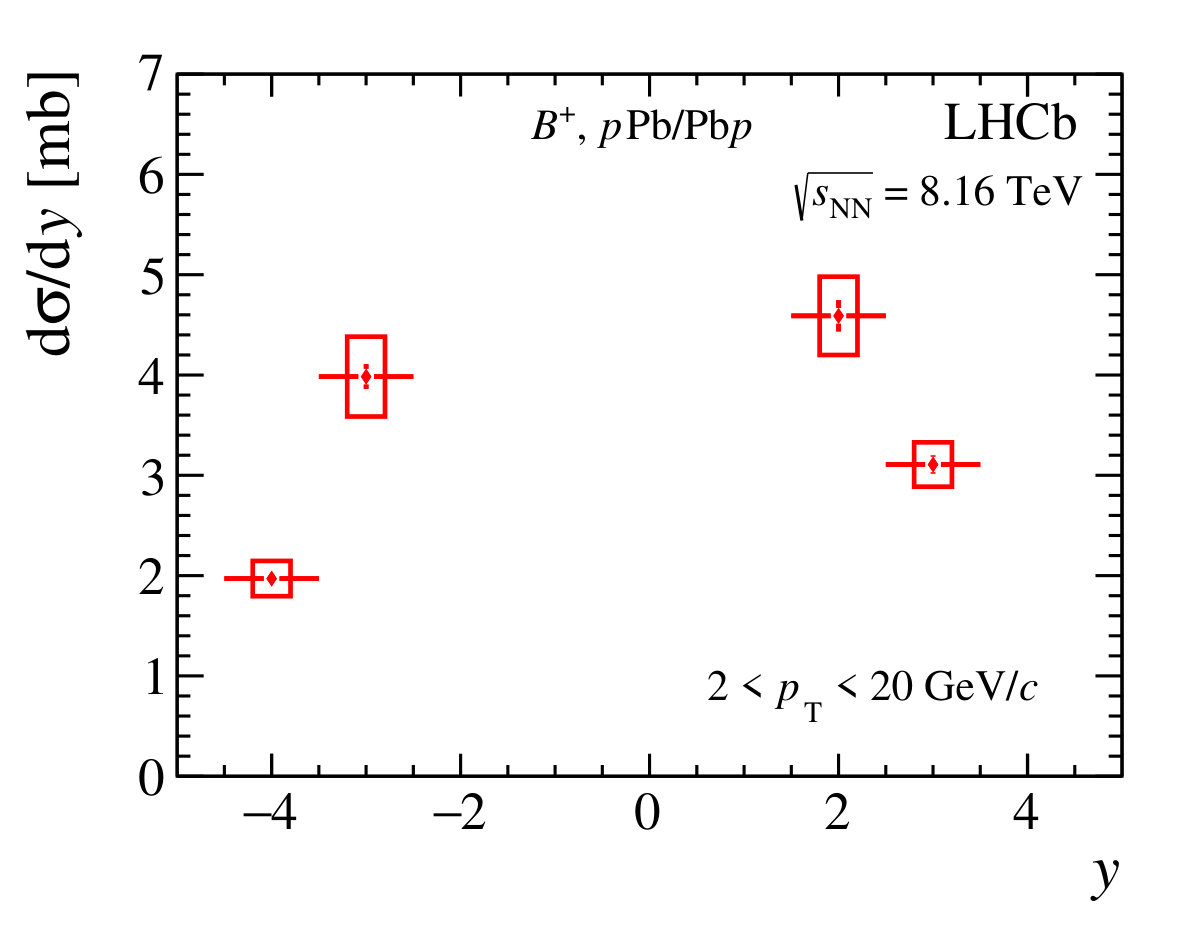 Figure 5
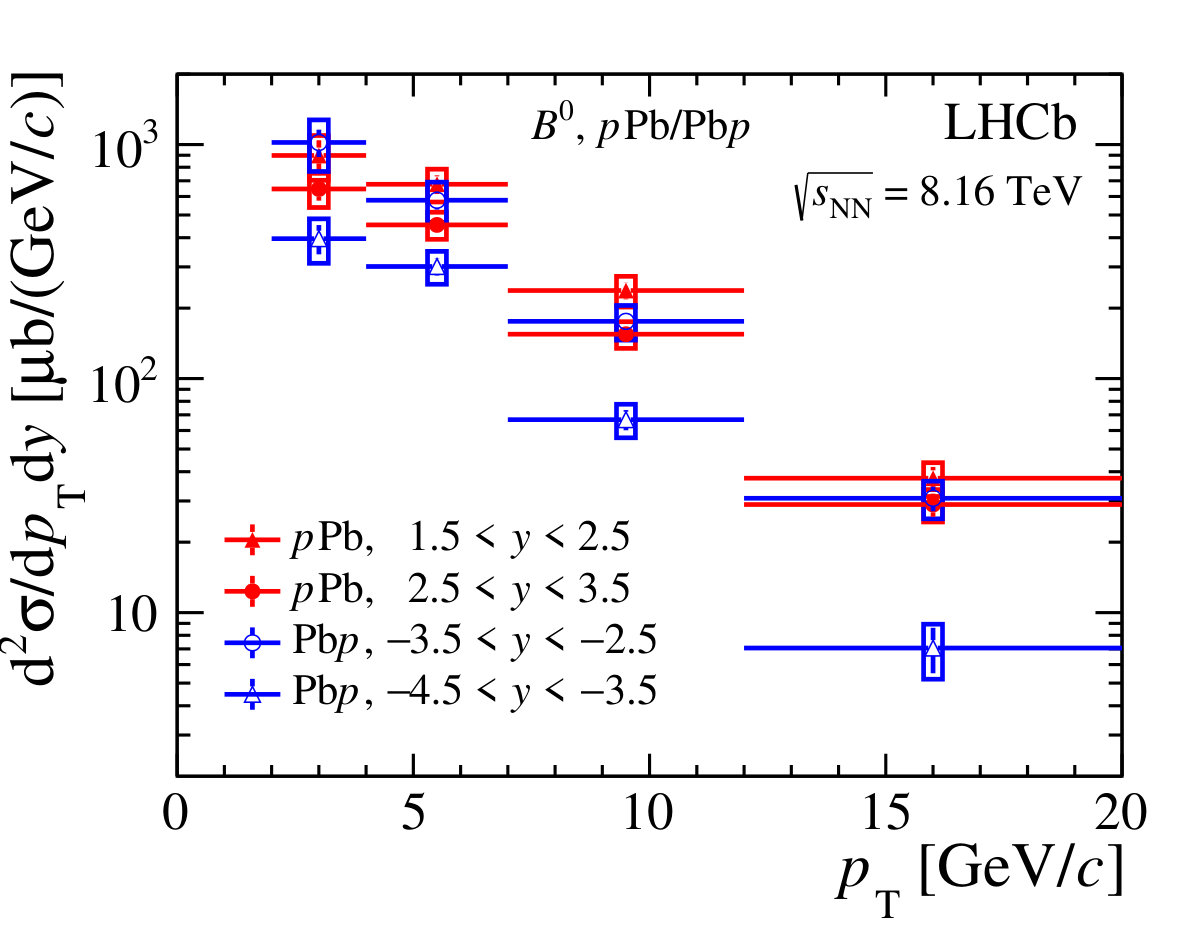 Figure 6
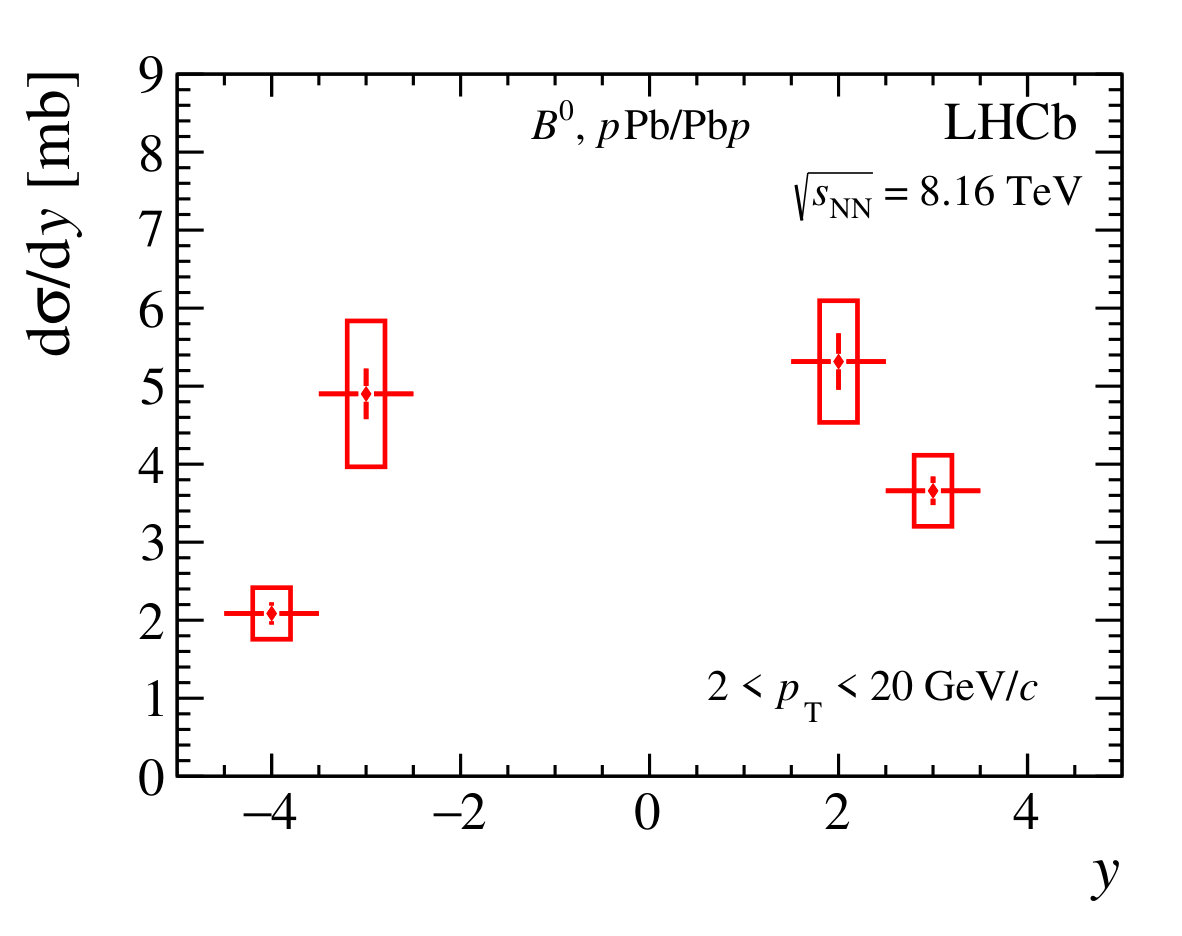 Figure 6
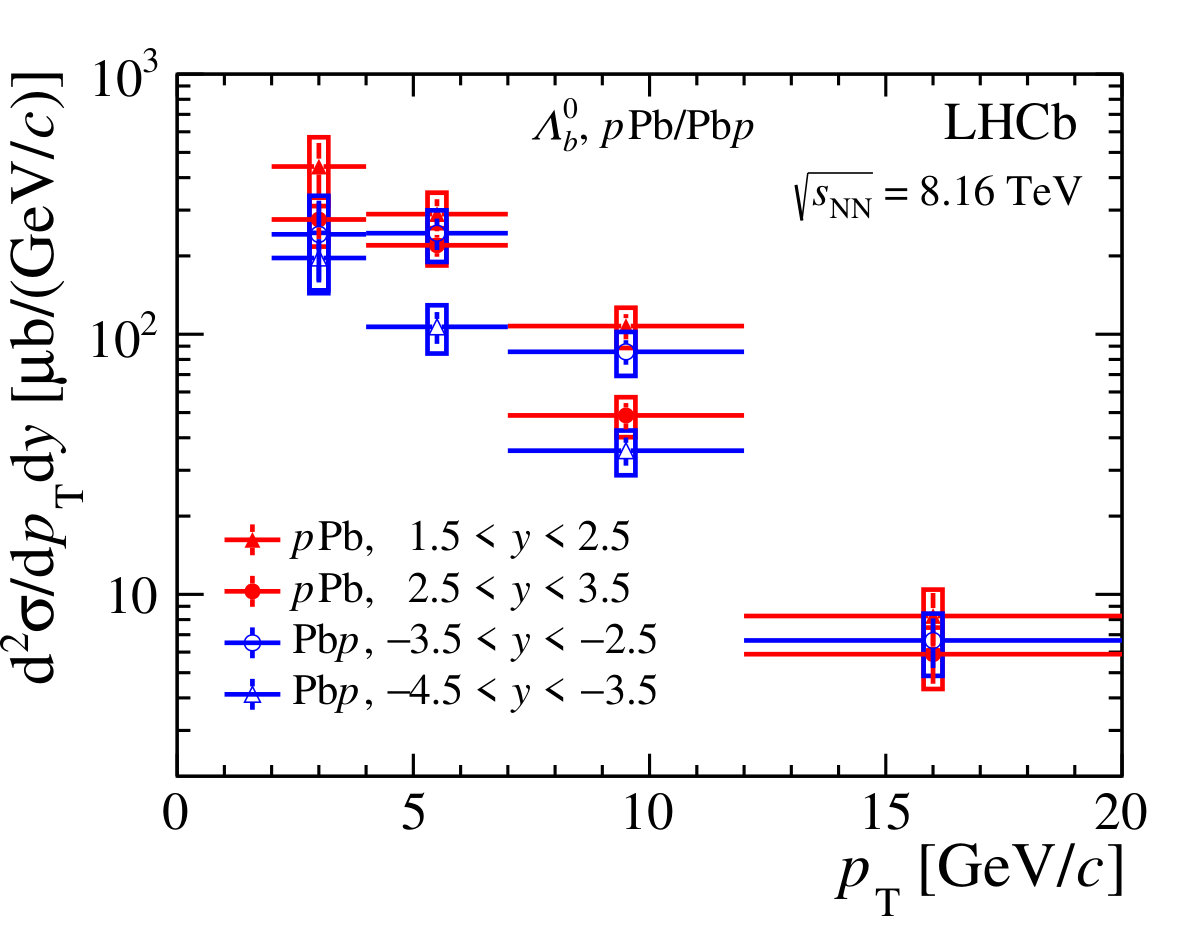 Figure 7
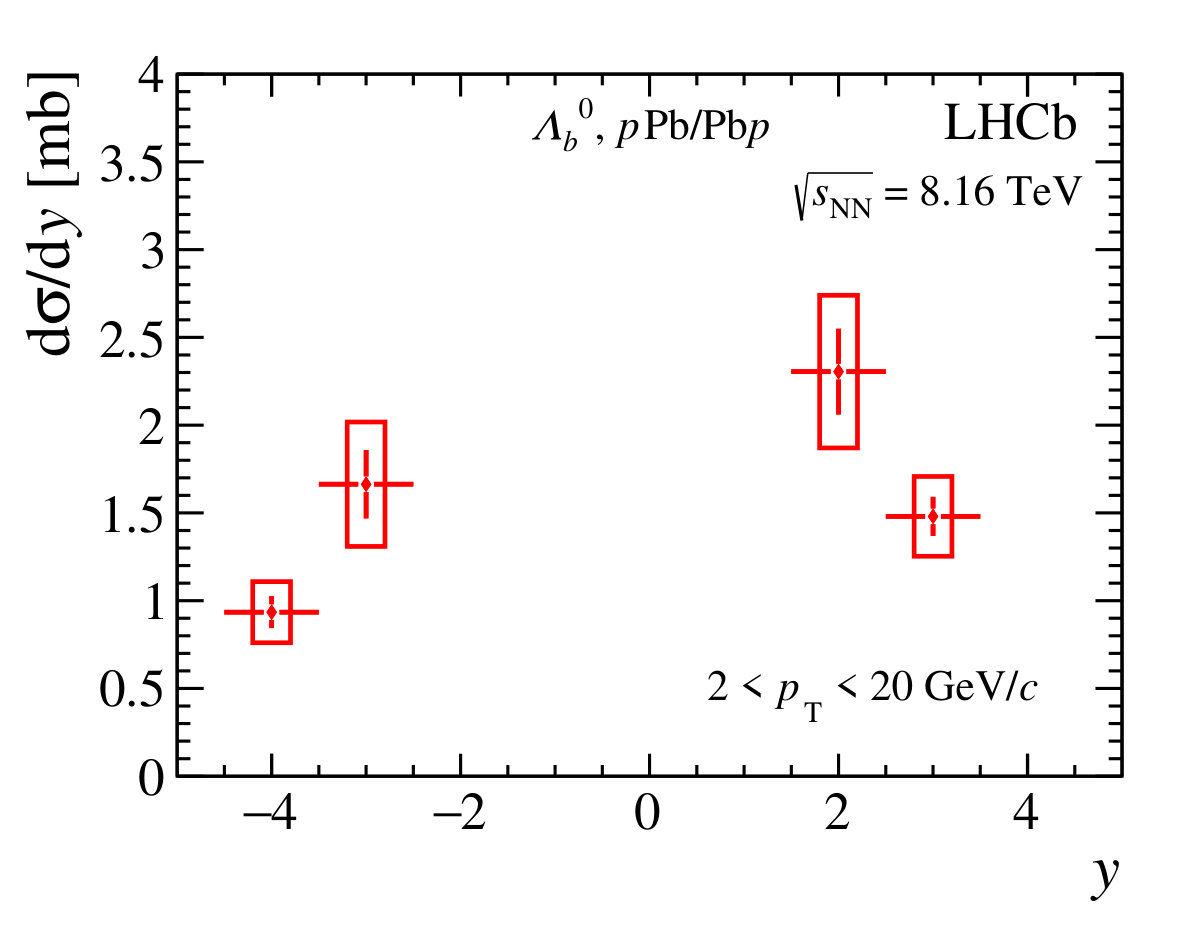 Figure 7
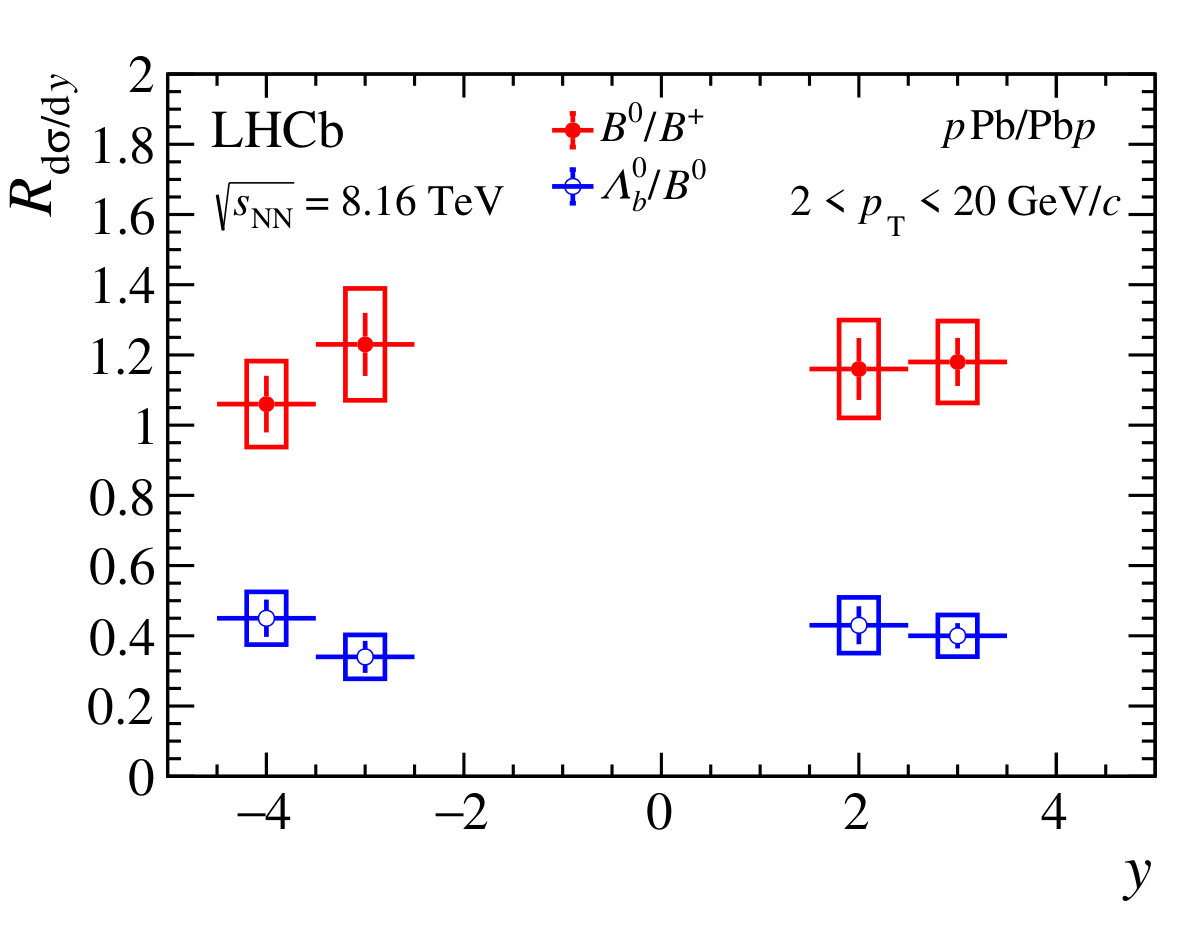 Figure 8
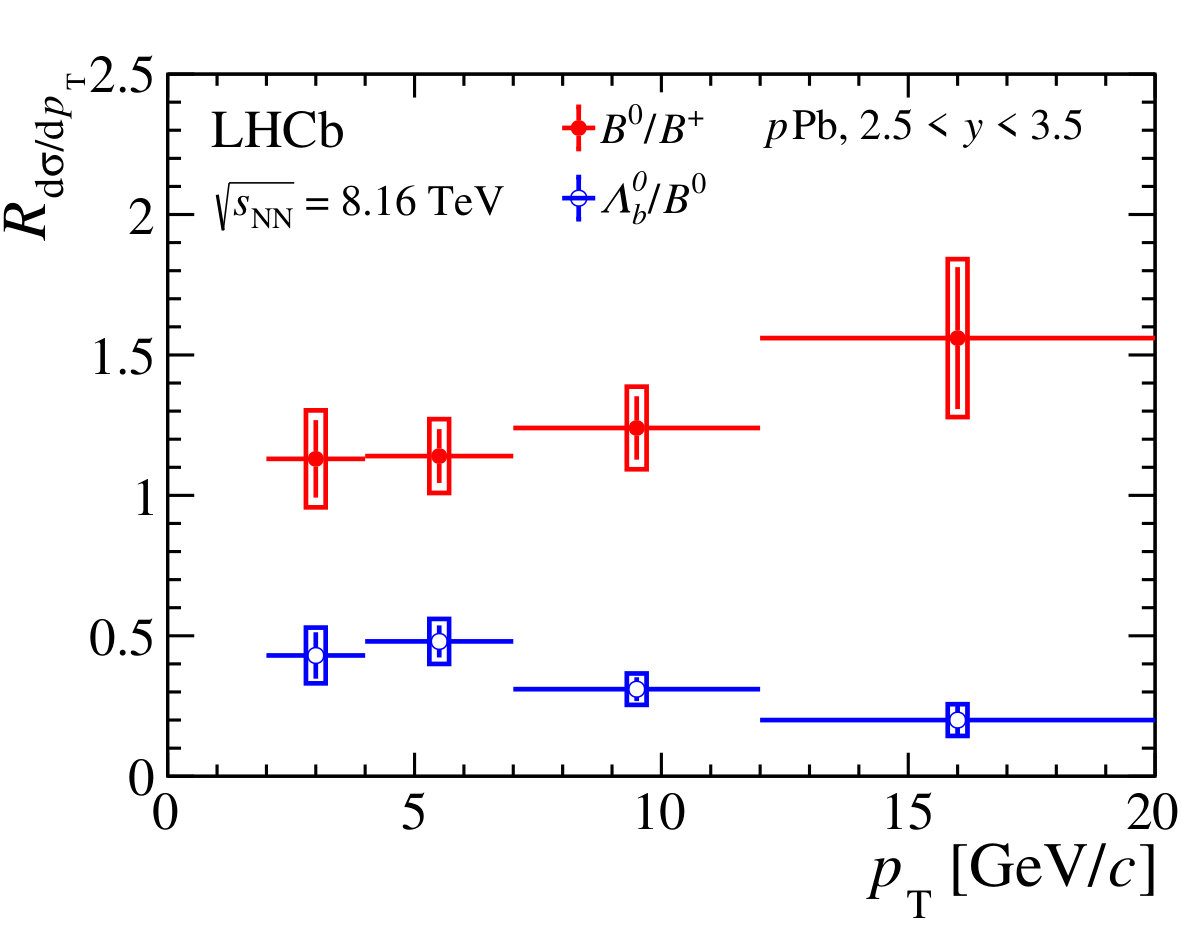 Figure 8
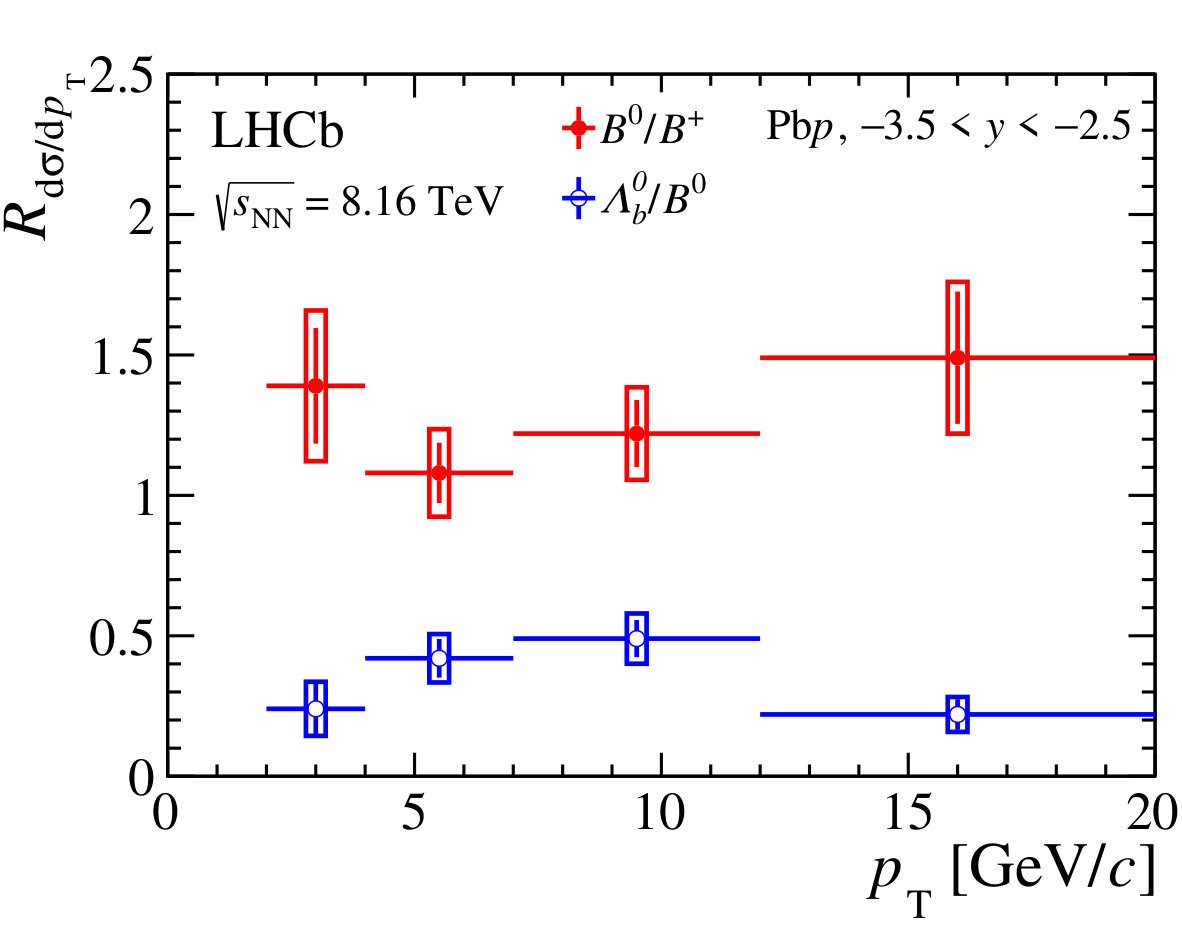 Figure 8
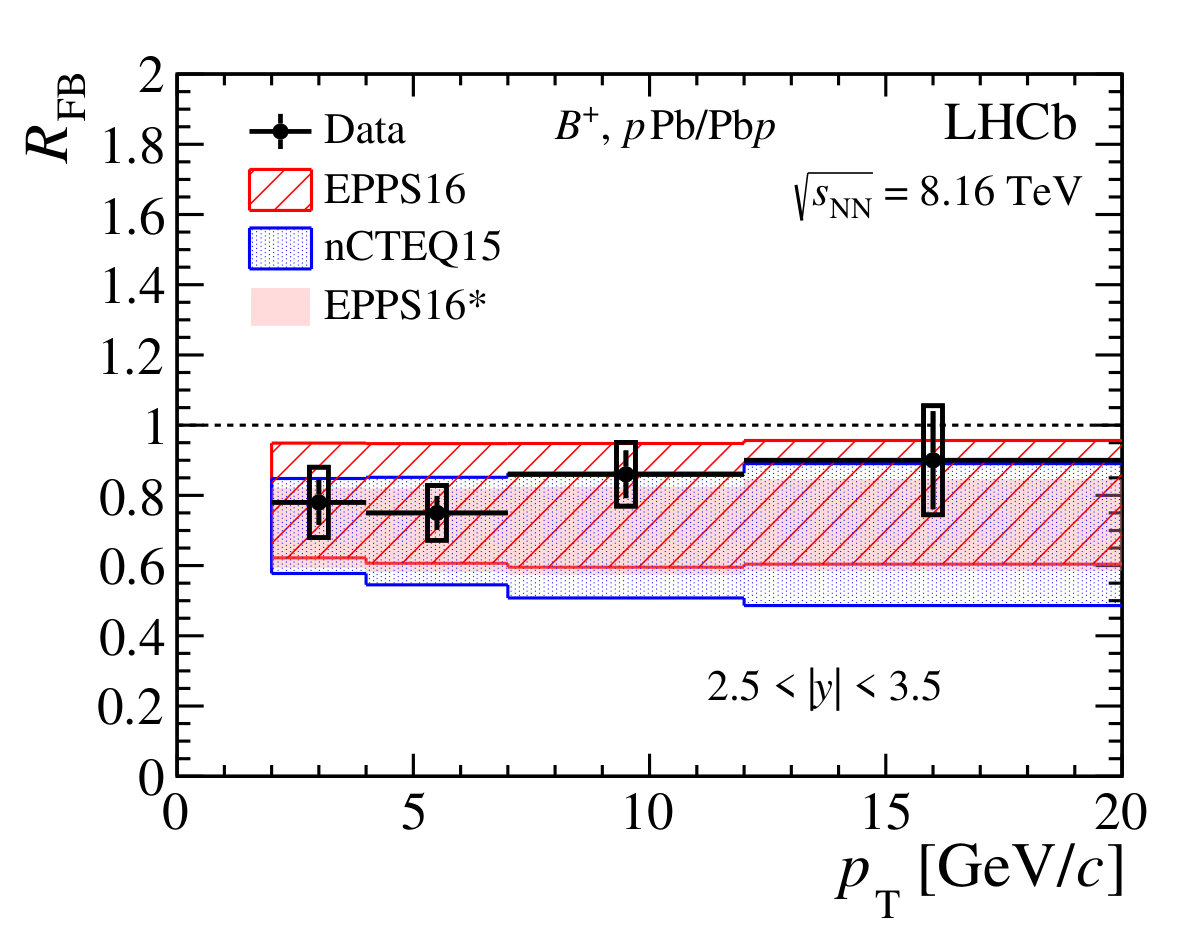 Figure 9
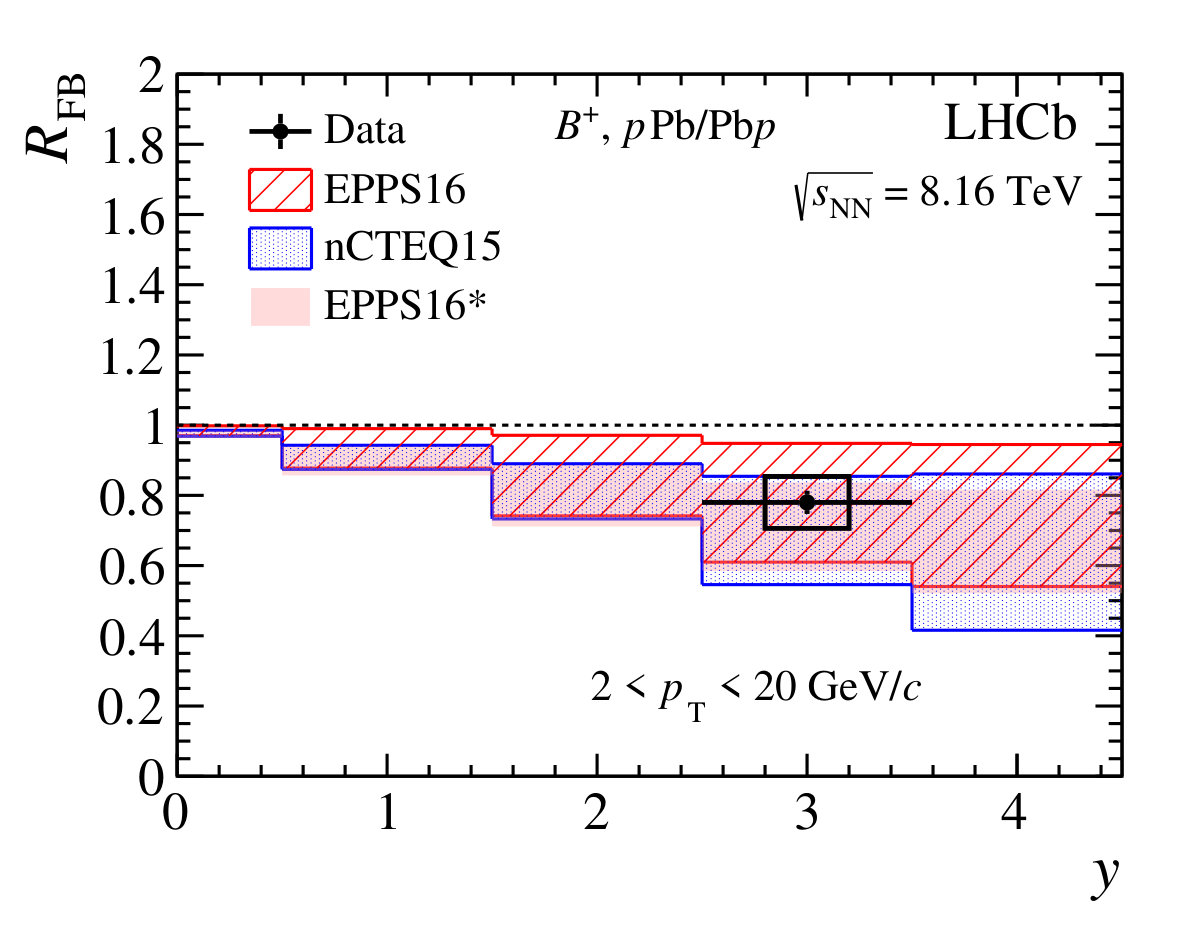 Figure 9
| Decay | ||||
|---|---|---|---|---|
| 1958 | 54 | 1806 | 55 | |
| 883 | 32 | 907 | 33 | |
| 1151 | 38 | 889 | 34 | |
| 484 | 24 | 399 | 23 | |
| Source | ||||
|---|---|---|---|---|
| Luminosity | 2.6 | 2.6 | 2.6 | 2.6 |
| Trigger | 1.0 | 1.0 | 1.0 | 1.0 |
| Signal yield | 2.0 | 2.0 | 2.0 | 2.0 |
| Selection | 1.0 | 1.0 | 3.0 | 2.0 |
| Hadron tracking | 1.5 | 4.5 | 6.0 | 6.0 |
| Tracking efficiency method | 2.4 | 2.4 | 3.2 | 3.2 |
| Tracking sample size | – | – | – | – |
| Branching fraction | 3.1 | 3.2 | 6.0 | 9.6 |
| PID binning | – | – | – | – |
| PID sample size | – | – | – | – |
| Kinematics | – | – | – | – |
| Dalitz structure | – | – | – | – |
| Simulation sample size | – | – | – | – |
| Total | – | – | – | – |
| Source | ||||
|---|---|---|---|---|
| Luminosity | 2.5 | 2.5 | 2.5 | 2.5 |
| Trigger | 1.0 | 1.0 | 1.0 | 1.0 |
| Signal yield | 2.0 | 2.0 | 2.0 | 2.0 |
| Selection | 1.0 | 1.0 | 3.0 | 2.0 |
| Hadron tracking | 1.5 | 4.5 | 6.0 | 6.0 |
| Tracking efficiency method | 2.4 | 2.4 | 3.2 | 3.2 |
| Tracking sample size | – | – | – | – |
| Branching fraction | 3.1 | 3.2 | 6.0 | 9.6 |
| PID binning | – | – | – | – |
| PID sample size | – | – | – | – |
| Kinematics | – | – | – | – |
| Dalitz structure | – | – | – | – |
| Simulation sample size | – | – | – | – |
| Total | – | – | – | – |
| 441.1 | 25.8 | 36.0 | 735.7 | 45.6 | 78.7 | 831.1 | 54.8 | 69.8 | 571.3 | 30.8 | 36.6 | |
| 244.9 | 12.5 | 19.1 | 534.2 | 24.6 | 49.1 | 560.3 | 30.8 | 43.7 | 398.7 | 17.9 | 25.9 | |
| 56.6 | 4.2 | 5.0 | 144.5 | 8.1 | 11.7 | 181.0 | 10.5 | 13.2 | 124.5 | 7.0 | 8.2 | |
| 7.3 | 1.2 | 0.9 | 20.7 | 2.1 | 1.7 | 42.3 | 3.5 | 3.0 | 18.6 | 2.2 | 1.3 | |
| 1971 | 69 | 162 | 3984 | 124 | 378 | 4590 | 156 | 358 | 3108 | 90 | 202 | |
| 396.2 | 56.7 | 63.8 | 1020.8 | 136.8 | 213.3 | 898.0 | 144.6 | 130.2 | 645.9 | 70.4 | 81.4 | |
| 301.3 | 25.6 | 41.0 | 578.2 | 50.9 | 100.6 | 676.6 | 62.2 | 88.6 | 453.6 | 32.2 | 50.8 | |
| 66.8 | 6.6 | 8.7 | 175.7 | 14.2 | 26.0 | 237.8 | 19.7 | 29.7 | 154.8 | 11.1 | 16.9 | |
| 7.1 | 1.6 | 1.0 | 30.8 | 3.7 | 4.3 | 37.5 | 4.4 | 4.4 | 29.0 | 3.3 | 3.2 | |
| 2086 | 142 | 298 | 4890 | 323 | 875 | 5332 | 357 | 693 | 3658 | 183 | 417 | |
| 196.3 | 35.7 | 33.4 | 242.1 | 84.0 | 51.1 | 441.2 | 102.4 | 80.7 | 276.1 | 43.6 | 39.5 | |
| 106.8 | 14.9 | 16.8 | 244.6 | 33.7 | 43.3 | 289.5 | 40.8 | 44.6 | 219.7 | 21.1 | 29.0 | |
| 35.7 | 4.4 | 5.4 | 85.6 | 9.2 | 13.6 | 107.5 | 11.9 | 14.7 | 48.7 | 5.7 | 6.4 | |
| 1.6 | 0.6 | 0.2 | 6.7 | 1.4 | 1.1 | 8.3 | 1.9 | 1.1 | 5.9 | 1.4 | 0.8 | |
| 935 | 91 | 149 | 1658 | 194 | 293 | 2305 | 244 | 360 | 1480 | 111 | 198 | |
| 0.78 | 0.06 | 0.08 | 0.63 | 0.11 | 0.12 | 1.14 | 0.43 | 0.20 | |
| 0.75 | 0.05 | 0.06 | 0.78 | 0.09 | 0.12 | 0.90 | 0.15 | 0.13 | |
| 0.86 | 0.07 | 0.06 | 0.88 | 0.10 | 0.10 | 0.57 | 0.09 | 0.06 | |
| 0.90 | 0.14 | 0.07 | 0.94 | 0.16 | 0.10 | 0.89 | 0.28 | 0.10 | |
| 0.78 | 0.03 | 0.07 | 0.75 | 0.06 | 0.12 | 0.89 | 0.12 | 0.12 | |
| 0.84 | 0.17 | 0.05 | 0.47 | 0.18 | 0.05 | |
| 1.11 | 0.14 | 0.03 | 0.97 | 0.17 | 0.05 | |
| 0.91 | 0.13 | 0.03 | 1.44 | 0.21 | 0.07 | |
| 0.81 | 0.21 | 0.03 | 0.89 | 0.22 | 0.07 | |
| 0.92 | 0.09 | 0.03 | 0.78 | 0.11 | 0.04 | |
| 0.75 | 0.04 | 0.05 | 0.96 | 0.06 | 0.11 | |
| 0.77 | 0.03 | 0.04 | 1.03 | 0.05 | 0.10 | |
| 0.83 | 0.05 | 0.04 | 0.96 | 0.05 | 0.08 | |
| 1.01 | 0.12 | 0.07 | 1.13 | 0.12 | 0.09 | |
| 0.78 | 0.02 | 0.05 | 1.00 | 0.03 | 0.10 | |
Peer Reviews
No public reviews on file for this paper yet. If you reviewed it on a platform where reviews are public (OpenReview, ICLR, NeurIPS, ICML), you can paste yours below so the community can read it here.
Videos
No videos yet. Explain this paper in a talk, walkthrough, or lecture? Add one.
EUROPEAN ORGANIZATION FOR NUCLEAR RESEARCH (CERN)
CERN-EP-2019-010
LHCb-PAPER-2018-048
14 February 2019
**Measurement of , and production in collisions at **
LHCb collaboration†††Authors are listed at the end of this paper.
The production of , and hadrons is studied in proton-lead collisions at a centre-of-mass energy per nucleon pair of recorded with the LHCb detector at the LHC. The measurement uses a dataset corresponding to an integrated luminosity of for the case where the proton beam is projected into the LHCb detector (corresponding to measuring hadron production at positive rapidity) and for the lead beam projected into the LHCb detector (corresponding to measuring hadron production at negative rapidity). Double-differential cross-sections are measured and used to determine forward-backward ratios and nuclear modification factors, which directly probe nuclear effects in the production of beauty hadrons. The double-differential cross-sections are measured as a function of the beauty-hadron transverse momentum and rapidity in the nucleon-nucleon centre-of-mass frame. Forward-to-backward cross-section ratios and nuclear modification factors indicate a significant nuclear suppression at positive rapidity. The ratio of over production cross-sections is reported and is consistent with the corresponding measurement in collisions.
Submitted to Phys. Rev. D99 (2019) 052011
© 2024 CERN for the benefit of the LHCb collaboration. CC-BY-4.0 licence.
1 Introduction
Charm and beauty quarks provide a unique probe of nuclear matter in heavy-ion collisions [1]. They are produced at early times of the collisions and experience the whole evolution of the nuclear medium before hadronization [2]. Their kinematics and hadronization provide information on the extent of thermalization effects and on transport coefficients. The hard scale provided by the heavy-quark mass is larger than the Quantum Chromodynamics (QCD) scale, . Therefore, heavy-quark production can be addressed with perturbative QCD down to zero transverse momentum ().
The characterization of the extended color-deconfined thermodynamic system, the quark-gluon plasma, using heavy-quark observables in heavy nucleus-nucleus collisions, requires an understanding of background effects. Therefore, it is mandatory to identify and constrain other QCD effects that may appear in nuclear collisions. Among these effects, the modification of the parton distribution functions [3, 4, 5, 6, 7] or, alternatively, the breakdown of collinear factorization in the gluon-dense nuclear wave function [8, 9] are discussed most extensively. Besides the modification of the nuclear wave function compared to that of free nucleons, coherent gluon radiation at small angles may modify final-state heavy-quark kinematic distributions [10]. Furthermore, the nuclear effect that is responsible for the change of hadronization patterns as a function of final-state particle multiplicities in small collision systems ( and proton-nucleus collisions), first observed for strange-hadron production [11], is not yet fully understood. Measurements sensitive to hadronization fractions in the heavy-flavor sector can contribute to a better understanding. Studies of hadronization in heavy nuclear collisions may help to explain the puzzle of heavy-flavor hadron collective behaviour that was observed recently in and proton-lead collisions [12, 13, 14]. These measurements in small collision systems still require a common reconciliation with the global theoretical picture of heavy-ion collisions based on fluid dynamics, or might result in modifications to the fluid-based description.
Observables related to charm hadrons have been extensively studied at the high-energy frontier of heavy-ion collisions at RHIC and the LHC [1]. Recently, the first measurements of baryon111The inclusion of charge-conjugated state is implicit throughout unless explicitly noted. production in proton-lead collisions have been performed at the LHC [15, 16]. The measurements of charm-baryon production were the last important step towards the evaluation of the total charm production cross-section without relying on assumptions about charm fragmentation functions based on measurements made before the start of the LHC.222Other charm baryons have a negligible contribution to the total charm production. Beauty hadrons are not yet explored experimentally to the same extent in heavy-ion collisions due to lower production rates. Theoretically, computations of the production of beauty hadrons are more reliable than charm hadrons since the larger beauty-quark mass allows for a better separation of energy scales with respect to . The LHCb collaboration has recently studied the production of mesons from beauty-hadron decays (nonprompt ) in proton-lead collisions [17]. This measurement is sensitive to beauty-quark production down to vanishing transverse momentum with good precision.
This article presents measurements of the production cross-sections of fully reconstructed , and hadrons in proton-lead collisions recorded by the LHCb experiment, as a function of the hadron kinematics down to , which is lower than the hadron masses. The measurement of heavy-quark production at low helps to constrain the gluon wave function in the nucleus in the small Bjorken region [18, 19, 20, 21], where is the fraction of the nucleon momentum carried by the interacting gluon. In addition, production measurements of fully reconstructed beauty hadrons in heavy-ion collisions can test whether the hadronization fractions in nuclear collisions are the same as those measured in collisions [22, 23, 24, 25].
2 Detector, data samples and observables
The LHCb detector [26, 27] is a single-arm forward spectrometer covering the pseudorapidity range , designed for the study of particles containing or quarks. The detector includes a high-precision tracking system consisting of a silicon-strip vertex detector (VELO) surrounding the initial beam interaction region [28], a large-area silicon-strip detector located upstream of a dipole magnet with a bending power of about , and three stations of silicon-strip detectors and straw drift tubes [29] placed downstream of the magnet. The tracking system provides a measurement of the momentum, , of charged particles with a relative uncertainty that varies from 0.5% at low momentum to 1.0% at 200. The minimum distance of a track to a primary vertex (PV), the impact parameter (IP), is measured with a resolution of , where is in . Different types of charged hadrons are distinguished using information from two ring-imaging Cherenkov detectors [30]. Photons, electrons and hadrons are identified by a calorimeter system consisting of scintillating-pad and preshower detectors, an electromagnetic calorimeter and a hadronic calorimeter. Muons are identified by a system composed of alternating layers of iron and multiwire proportional chambers [31].
The online event selection is performed by a trigger [32], which consists of a hardware stage, based on information from the calorimeter and muon systems, followed by a two-stage software trigger. The first stage of the software trigger selects displaced high- tracks or pairs of high- muons, while the second stage searches for pairs consistent with decays and two-, three- or four-track secondary vertices with a full event reconstruction. Between the two stages of the software trigger, an alignment and calibration of the detector is performed in near real-time [33] and updated constants are made available for the trigger reconstruction. The same alignment and calibration information is propagated to the offline reconstruction, ensuring consistent and high-quality particle identification (PID) information between the trigger and offline software. The identical performance of the online and offline reconstruction offers the opportunity to perform physics analyses directly using the pairs reconstructed in the trigger [32, 34], which the present analysis also exploits.
Simulation is required to model the effects of the detector geometrical acceptance and the efficiency of the selection requirements. In the simulation, minimum bias proton-lead collisions are generated using the EPOS LHC generator [35]. Beauty hadrons () are generated in collisions at the same center-of-mass energy using Pythia8 [36, 37] and are embedded in the minimum bias proton-lead collision events. Decays of particles are described by EvtGen [38], in which final-state radiation is generated using Photos [39]. The interaction of the generated particles with the detector, and its response, are implemented using the Geant4 toolkit [40, *Agostinelli:2002hh] as described in Ref. [42].
The measurement of the production of beauty hadrons in this analysis uses data recorded in 2016 during the LHC proton-lead run at a centre-of-mass energy per nucleon pair of . The measurement is performed in bins of beauty-hadron and rapidity, . The rapidity is defined in the nucleon-nucleon centre-of-mass frame, using the proton beam direction as the direction of the -axis of the coordinate system. Since the energy per nucleon in the proton beam is larger than in the lead beam, the nucleon-nucleon centre-of-mass system has a rapidity in the laboratory frame of . During the data taking in 2016, the LHC provided collisions with two configurations, inverting the direction of the proton and lead beams. The LHCb forward spectrometer covers the positive (negative) rapidity ranges when the proton (lead) beam direction is projected into the detector from the interaction region, denoted as “” (“”) configuration.
The dataset corresponds to an integrated luminosity of for the configuration and for the configuration, calibrated using dedicated luminosity runs [43]. The double-differential cross-section of the production of a hadron as a function of and is computed as
[TABLE]
where, for a given interval of and , is the sum of the observed signal yields in a particular decay mode and its charge-conjugated decay mode, is the product of the branching fractions for the beauty decay and the subsequent charm decay, is the integrated luminosity, and is the total detection efficiency of the final state particles. The measurements are carried out in the kinematic range and for the configuration, and in the range and for the configuration. The intervals used to study the efficiency and signal yield are –, –, – and –, and the rapidity regions are split into two equal size intervals, and for the configuration, and and for the configuration. The range is not considered due to the small signal yield with the current sample. This restriction is not related to any detector limitation specific to the collision system, but to the limited integrated luminosity and the small production cross-section.
Nuclear effects are quantified by the nuclear modification factor, ,
[TABLE]
where is the mass number of the lead ion, the production cross-section in proton-lead collisions as defined in Eq. (1), and the reference production cross-section in collisions at the same nucleon-nucleon centre-of-mass energy. In the absence of nuclear effects, the nuclear modification factor is equal to unity.
To quantify the relative forward-to-backward production rates, the forward-to-backward ratio, , is measured, which is the ratio of cross-sections in the positive and negative intervals corresponding to the same absolute value range,
[TABLE]
3 Selections, signal yields and efficiency
3.1 Candidate reconstruction and selection
The cross-section is measured in the mode, with , and in the purely hadronic mode , with . The cross-sections of the and hadrons are studied in the hadronic decays with and with .
For the , and hadronic modes, the candidates are reconstructed from a sample selected by a hardware trigger requiring a minimum activity in the scintillating-pad detector. This hardware trigger selection has an efficiency of 100% for the signal. The intermediate charm-hadron candidates are reconstructed using tracks that are identified as pion, kaon and proton candidates by the LHCb particle identification system [27]. The tracks used to form the ( and ) candidates are required to have , and at least one of them has to satisfy (). They must also have momentum ( for protons) and pseudorapidity in the range . In addition, they are required to be separated from any primary vertex by requiring , where is the difference between the values of a given PV reconstructed with and without the considered track. The tracks are required to form a vertex of good quality. Further requirements are imposed to ensure that this vertex is consistent with charm-hadron decays by requiring a minimum reconstructed decay time and a reconstructed mass within an interval centred on the known values of the hadron mass [44]: , and for , and candidates, respectively. Each mass interval corresponds to six times the experimental resolution on the reconstructed mass. A charm-hadron candidate, inconsistent with originating from the PVs as ensured by the requirement , is then combined with a positively identified pion of the appropriate charge to form a beauty hadron. This pion is required to have and to be separated from any PV with the condition . Reconstructed beauty hadrons with a good-quality vertex and a significant displacement from any PV are selected and are further required to point back to a PV by imposing . The offline selected beauty-hadron candidates are also required to match an online vertex, reconstructed from two, three or four tracks, with a large sum of the transverse momenta of the tracks and a significant displacement from the PVs.
The candidates studied with the decay are obtained from a data sample that contains candidates reconstructed by the online software trigger [34]. The muons used to reconstruct a meson are identified by the muon detector and information from all subsystems combined by a neural network. The candidate must have a well-reconstructed vertex, a mass in the range , and pass the hardware trigger that selects muons with . The candidate with a reconstructed decay vertex significantly separated from all PVs is combined with a kaon track to form a candidate. The candidate must be positively identified and is required to have a transverse momentum and to be separated from all PVs with the requirement . The reconstructed candidate is required to have a good-quality vertex, be displaced from the PVs and point back to a PV by requiring .
3.2 Signal yield determination
The signal yields for each decay mode are determined from extended unbinned maximum-likelihood fits to their mass distributions. The fits are used to calculate per-candidate weights with the sPlot method [45]. The weights are then used to determine the signal yields in each and bin. As a cross-check, fits are also performed in individual and bins, and the results are consistent with those obtained using the sPlot method.
The signal mass distribution is described by a Crystal Ball (CB) function [46] for the , and decays. For the decay an additional Gaussian function, which shares the peak position with the CB function, is necessary to achieve a satisfactory fit quality. The tail parameters for the CB function and the fractions of the CB and the Gaussian components are fixed to values obtained from fits to mass spectra of simulated signal decays. The mean and width of the Gaussian core in the CB function, and the width of the separate Gaussian component are free parameters determined from data. The combinatorial background is described by an exponential function, with parameters allowed to vary in the fits.
The contribution of misidentified background from , and () decays, where the () meson is reconstructed as a () candidate, is described by an empirical function obtained using simulation. Due to the small branching fraction of the misidentified background compared to the signal and the suppression from the PID requirement, the contribution relative to the signal mode in the selected sample is expected to be around or below 5% depending on the decay mode.
For the decay, the partially reconstructed backgrounds of with or , and decays with , where only the in the final states are reconstructed, are modelled with polynomials convolved with a Gaussian resolution function, following the method described in Ref. [47]. The partially reconstructed backgrounds of and () decays, with (), in the and () mass distributions are described by a threshold function [48] convolved with a Gaussian function to account for resolution effects. The resolution function is the same as that of the Gaussian kernel for the signal component.
The shape for each component, except that of the combinatorial background, is constrained to be the same for the fits to and data. The yields for each contribution in the fit model are free parameters determined from data with the constraint that the ratio of misidentified background to signal yield is the same in and data. The signal yields for each decay model considered in this analysis are summarized in Table 1 for the kinematic range and () in the () sample. The mass distributions and the fit projections are shown in Figs. 1 to 4 for the decays , , and , respectively. The higher combinatorial background level in the sample compared to the sample is due to higher charged track multiplicities seen by the LHCb detector in the beam configuration.
3.3 Efficiency
The total efficiency is the product of the geometrical acceptance of the detector and the efficiencies of the reconstruction, the selection, the PID and the trigger requirements. It is about a few percent in the low- region, and 20% in the high- region. These efficiencies, except for the PID, are evaluated using samples of simulated signal decays, in bins of the beauty-hadron and . The reconstruction efficiency obtained from simulated signals is corrected using a data-driven method which is detailed in the next paragraph. The occupancy distribution in the minimum bias simulation sample is weighted to reproduce that in data, in order to model correctly the PV reconstruction efficiency. For the decays , and and subsequent charm-hadron decays, the angular distributions of the final state particles are well described by EvtGen. For the decay, the Dalitz-plot distribution of the decay in simulation is described by a mixture of uniform phase space and resonant contributions of and . The Dalitz-plot distribution in the simulation is corrected to match that in the background subtracted data.
The track reconstruction efficiency from simulation is corrected using a tag-and-probe approach. For this method, candidates in data are formed combining a fully reconstructed “tag” track with a “probe” track reconstructed using a subset of the tracking detectors [49, 27]. The single-track reconstruction efficiency is obtained as the fraction of the probe tracks that are matched to fully reconstructed tracks, in bins of the track momentum and pseudorapidity. The ratio of the tag-and-probe efficiency between proton-lead data and simulation is used to correct the simulation efficiencies. The correction factors are determined for the and samples separately.
The PID efficiency for each track is determined with a tag-and-probe method [50, 51] using calibration samples of proton-lead data. The track PID efficiency depends on the detector occupancy. Since the occupancy distribution is found to be consistent between the calibration samples and the beauty-signal events, the efficiency is parametrized as a function of track momentum and pseudorapidity. The pion and kaon PID efficiencies are calibrated using decays, where the flavor is tagged by the charge of the pion in decays, the proton PID efficiency is studied using decays and the PID efficiency for muons is obtained using decays. For each beauty candidate, the product of the single-track PID efficiencies, measured as a function of the track momenta and pseudorapidity, gives the combined PID efficiency for all the tracks in the final state. The efficiency is then averaged over all beauty-hadron candidates for each bin of and .
4 Systematic uncertainties
The various sources of systematic uncertainties, and their quadratic sum, on the cross-sections for , and hadrons are summarized in Tables 2 and 3 for the and data samples, respectively. The ranges in the tables correspond to the minimum and maximum values over the and bins of the measurement. The cross-section of the hadron is measured in the two decay modes, and , which give consistent results within statistical uncertainties.
The uncertainty on the -hadron signal yields is studied by using alternative fit models or different fitting ranges for the mass distributions. The nominal CB function for the signal mass distribution is replaced by a combination of a Gaussian function plus a CB function or vice-versa for the decay, giving a relative change of 2% on the signal yields for all the decay modes. A second-order polynomial is employed to replace the exponential function for the combinatorial background, which results in a difference of 1% for the signal yields at the maximum. The effect of partially reconstructed background is studied by fitting the mass distribution in a smaller region where its contribution is reduced or absent. The signal yields change by at most 1% for all the decay channels. The effect of the misidentified background is studied by fixing its branching fraction relative to that of the signal [44], corrected by the PID selection efficiency. The change in signal yields amounts to 0.1%. The maximum value among all these effects, 2%, is quoted as the systematic uncertainty, and is considered as a global uncertainty for all decay modes and all and bins.
The corrections to the track reconstruction efficiency are limited in precision by the size of the calibration data sample, which results in a systematic uncertainty dominating in most of the analysis bins. This effect is studied by generating sets of correction factors according to Gaussian distributions centered on their nominal values and with widths equal to the statistical uncertainties. The standard deviation of the variations of the corrected efficiency in simulation is assigned as uncertainty, labelled as “Tracking sample size” in the summary tables. It ranges from 2.0% to 9.5% for and from 4.6% to 17.8% for , depending on the decay modes and the beauty-hadron and bins. The larger uncertainty for the sample, where the LHCb detector accepts particles produced in the lead beam direction, is due to higher background that makes the signal yield determination in the calibration data sample more difficult. The tag-and-probe method used to calculate the tracking efficiency has an uncertainty estimated to be 0.8% per track [49], giving a total value of 2.4% (3.2%) for a three- (four-)track decay mode. Since the tracking efficiency is measured using muons, an additional uncertainty of 1.5% per track is introduced for hadrons, to account for the possible imperfect modeling of the amount of interactions with the detector material. Labelled as “Hadron tracking” in the summary tables, the result is equal to for and to 4.5% (6%) for three- (four-)track hadronic decays. The uncertainties related to the track reconstruction efficiency method and to the hadron-detector interactions are fully correlated among different hadron species and between the , and datasets.
Several sources of systematic uncertainties are associated with the PID efficiencies. The contribution due to the limited size of the data calibration samples is determined by varying the single-track PID efficiencies within their uncertainties for all momentum and pseudorapidity bins simultaneously, and calculating the resulting spread of the PID efficiencies on the -hadron signal decays. Since large samples are available for the kaon, pion, and proton calibration, the resulting systematic uncertainties are found to be small and in the range of – (–) for the decay, and decays in () collisions. They are labelled as “PID sample size” in the summary tables. For decays, the smaller size of the muon calibration samples results in a systematic uncertainty between 1.4% and 2.7% for the data and between 0.7% and 2.1% for the data. For each bin of track momentum and pseudorapidity, the possible difference in track kinematics between the PID sample and the -hadron sample is counted as a second source of systematic uncertainty. The effect is studied by varying the default binning scheme using finer bins, and determining the changes of the PID efficiencies on the -hadron signal decays. The result is labelled as “PID binning” in the summary tables and is found to be at most 1.4%. The systematic uncertainty related to a possible difference of detector occupancy between the PID samples and the -hadron samples is studied by weighting the occupancy in the PID samples to match that of the signal beauty sample, and the resulting change of the efficiency is found to be negligible.
The imperfect modeling of -hadron kinematic distributions and decay properties in the simulation introduces systematic uncertainties on the reconstruction and selection efficiencies. The two-body invariant mass distributions of the decay products, or Dalitz-plot distribution, for the mode in simulation is weighted to match data, and the uncertainty on the Dalitz-plot distribution is counted as a source of systematic uncertainty. Its magnitude is studied by pseudoexperiments. For each pseudoexperiment, a sample is constructed by randomly sampling candidates from data allowing for repetition, and this sample is used to correct the Dalitz-plot distribution in the simulation. The root-mean-square value of the efficiencies corrected with multiple pseudoexperiments is quoted as the systematic uncertainty. It is found to be in the range – for the different and bins and is labelled as “Dalitz structure” in the summary tables.
The distributions of variables used to select candidates show good agreement between data and simulation. The effect of the residual differences is quantified by weighting the reconstructed -hadron decay-time distribution in simulation to match that in data, and studying the corresponding variation of the selection efficiency. The result, labelled as “Selection” in the summary tables, amounts to 1% for the two decay modes, and to 3% and 2% for the and decay modes.
Simulation and data also show reasonable agreement in the beauty-hadron and distribution, even if a modest discrepancy in the distribution is observed, especially for the baryon. Due to the limited data sample size it is not possible to accurately determine the -hadron and distributions from data directly. However, as the cross-section is measured differentially in bins of and , the small discrepancy on these kinematic distributions has a reduced impact. A systematic uncertainty is evaluated as the change in the reconstruction efficiency after reweighting the and distributions in simulation to match data using a finer binning scheme. The result, labelled as “Kinematics” in the summary tables, ranges from a fraction of a percent to a few percent depending on the decay modes and the beauty-hadron and bins.
The muon trigger efficiency is validated using a large sample of decays obtained with an unbiased trigger selection [32]. The result is compared with the trigger efficiency estimated in simulation, showing a difference of at most 1%, which is quoted as the systematic uncertainty due to the trigger selection for the decay. Thanks to the loose requirement applied by the online event selection, the overall trigger efficiency for the purely hadronic decay modes is found to be above 99% for the offline selected candidates. A systematic uncertainty of 1% is assigned.
The finite sizes of the simulated -hadron signal samples introduce uncertainties on the efficiency, which are propagated to the cross-section. Labelled as “Simulation sample size”, these uncertainties range from subpercent to a few percent depending on the decay modes and the and bins. The uncertainties due to the integrated luminosity of the and datasets are of 2.6% and 2.5%, respectively. The uncertainties on the branching fractions of the -hadron decays and of the intermediate charm-hadron decays are also sources of systematic uncertainty, and are evaluated using the uncertainties on the measured values [44].
The dominant systematic effect is the uncertainty on the track reconstruction efficiency which, however, largely cancels in the cross-section ratios. For the decay, the branching fraction is also a large source of systematic uncertainty, but cancels for the nuclear modification factor measurements. The systematic uncertainties are considered to be fully correlated among all kinematic bins for a particular decay mode, except that labelled as “Simulation sample size” which is uncorrelated.
5 Results
5.1 Cross-sections
The cross-sections measured in the and decay modes are consistent and their weighted average is reported. The weights are calculated using the statistical uncertainties combined with the systematic uncertainty due to the limited sample size of the simulation samples. The systematic uncertainties due to luminosity, kinematics, track reconstruction efficiency and kaon PID efficiency are entirely or strongly correlated, while those due to simulation sample size, muon and pion PID efficiencies, trigger selection and branching fractions are uncorrelated between the two decay modes. The double-differential cross-section of the averaged production in four rapidity bins as a function of and integrated over as a function of rapidity are shown in Fig. 5 and reported in Table 4. The same quantities for production are displayed in Fig. 6 and listed in Table 4. The measured cross-sections increase towards central rapidity both at positive and at negative rapidity. A good precision is achieved in the sample due to the averaging over two decay channels, which allows for improved precision with respect to the measurement in each single decay mode.
The double-differential cross-section of production is shown in Fig. 7 in four rapidity bins as a function of and integrated over as a function of rapidity, and is listed in Table 4. The trend observed as a function of the two variables is similar to that of the mesons.
In order to probe the hadronization in proton-lead collisions, ratios of over and over production cross-sections are studied with results shown in Fig. 8. Both ratios show no significant rapidity dependence within experimental uncertainties. The ratio between meson species is consistent with being independent of and of the beauty hadrons. Most interestingly, the baryon-to-meson ratio shows a dependence with a significantly lower value at the highest compared to the -integrated measurement. However, the current uncertainties do not allow to draw firm conclusions. The production ratio, averaged over the kinematic range in the analysis, is measured to be () for the () sample. The value is consistent with that measured by the LHCb collaboration in collisions [22, 23, 24, 25].
The cross-sections are used to calculate forward-backward ratios and nuclear modification factors. In the following, the experimental results on these nuclear modification observables are compared with calculations using the HELAC-onia generator [52, 53, 54] with two different nuclear parton distribution function (nPDF) sets, nCTEQ15 [6] and EPPS16 [7]. For these calculations, the model parameters are tuned to reproduce cross-section measurements at the LHC. The uncertainties reflect those from the corresponding nPDF parameterizations, and correspond to a 68% confidence interval. A weighting of the current nPDF sets with heavy-flavor measurements at the LHC was performed [19] under the assumption that the modification of the nPDF is the main mechanism of nuclear modification of heavy-flavor production. The corresponding predictions are shown together with their uncertainty bands under the label EPPS16∗ [19]. In the HELAC-onia framework, the nuclear matter effects are similar for the , and hadrons, i.e. those possibly affecting the -quark hadronization are not included. For this reason, in the following the predictions are only compared with production.
5.2 Forward-backward ratios
The forward-backward production ratio of mesons is shown in Fig. 9 as a function of and , while the corresponding values are reported in Table 5. A significant suppression of the production in the sample with respect to that in the data is measured at the level of 20% when integrating over . Within the experimental uncertainty, no dependence as a function of is observed. The HELAC-onia calculations using EPPS16 and nCTEQ15 are in agreement with the experimental data. The EPPS16∗ set exhibits the smallest uncertainties and is also in agreement with data.
The ratio as a function of for mesons and the -integrated value is shown in Fig. 10 and given in Table 5. A significant suppression is observed when integrating over the considered range, consistent with the value measured for mesons. No significant dependence on is seen within the current experimental uncertainties.
In Fig. 11, the forward-backward cross-section ratio, , of production is shown. The numerical values are summarized in Table 5. The observed central value of for the baryon is consistent with the measured value for the two -meson species and with the no-suppression hypothesis. A significant suppression of production in data compared to data is observed for the most precisely measured bin, between 7 and 12. The measurement of baryons is consistent with the modifications observed for the beauty mesons within the uncertainties for all kinematic bins. In Fig. 12, the values of as a function of and as a function of for the three hadrons are compared directly.
5.3 Nuclear modification factors
In order to gain insight into potential modifications of the -quark hadronization in and collisions with respect to collisions, the cross-section ratio shown in Fig. 8 is divided by the corresponding measurement in collisions at [23]. Neglecting the dependence on the collision energy of the hadronization with respect to the experimental uncertainties, the quantity corresponds to the ratios of nuclear modification factors
[TABLE]
If the overall nuclear effects for mesons and baryons are identical, is expected to be unity. This double ratio is presented as a function of and in Fig. 13 and in Table 6. At positive rapidity, the value of the ratio in all kinematic bins is consistent with unity. At negative rapidity (), the lowest bin exhibits a value smaller than one by more than two standard deviations and the third bin exceeds one by about two standard deviations. The -integrated value in the rapidity range is about two standard deviations away from unity. However, more data are required to test whether there are different nuclear effects in beauty mesons and baryons. It would be interesting to check from the theory side whether deviations from unity are expected from models of quark recombination effects in heavy-flavor production in heavy-ion collisions.
The modification factor for production is shown in Fig. 14, with the numerical values given in Table 7. The values are reported integrated over the considered range for the two intervals, and . They are also given as a function of for both and collisions. For the reference cross-section, an interpolation between existing cross-section measurements by the LHCb collaboration at 7 TeV [55] and 13 TeV [56] is performed. A power-law function is used following the approach of Refs. [57, 58, 17], which yields a prediction of production at consistent with an extrapolation of the measured value at using a FONLL calculation [59, 60]. The interpolation takes into account the correlations provided in Ref. [56]. The measurement of for nonprompt production at the same collision energy by the LHCb collaboration [17] is also shown.
At positive rapidity, a significant suppression by more than 20% is observed integrating over the whole range, whereas at negative rapidity, the result is consistent with unity. The measurement is also consistent with that of nonprompt production obtained in a similar kinematic range. The -differential result at positive rapidity shows a significant suppression, at the level of 25% for the lowest bin. The ratio tends to increase for high , however, the current experimental uncertainties that grow also with do not allow to establish a significant dependence. At negative rapidity, all values are consistent with a nuclear modification factor of one. The experimental data points are in good agreement with the three considered nPDF sets. At positive rapidity, the experimental uncertainties are smaller than the nPDF ones for the integrated values as well as for the three lowest bins, whereas the experimental uncertainties are typically larger at negative rapidity. Under the assumption that the dominance of nuclear modification is via nPDFs, the results in the sample provide constraints that can be used in future nPDF fits.
6 Conclusions
The differential production cross-sections of , mesons and baryons in proton-lead collisions at are measured in the range within the rapidity ranges and . The cross-sections and the derived nuclear modification factors and forward-backward ratios of -hadron production are measured for the first time with exclusive decay modes at transverse momenta smaller than the mass of the hadrons. They represent the first measurement of beauty-hadron production with different exclusive decay channels in nuclear collisions in that kinematic regime. The results with fully reconstructed beauty hadrons confirm the significant nuclear suppression of beauty-hadron production at positive rapidity measured via nonprompt mesons. The observed experimental uncertainties at positive rapidity are smaller than those achieved in a weighting of nPDFs with heavy-flavor data. Therefore, this measurement can serve as a valuable input for future fits of nPDF, assuming that modifications of nPDFs are the dominant source of nuclear effects in proton-lead collisions at the LHC. Finally, the unique measurement of production constrains the fragmentation of the beauty quark in a nuclear environment. The baryon-to-meson cross-section ratio in proton-lead collisions is found to be compatible with the equivalent ratio measured in collisions, and more data will be needed to study whether nuclear effects modify beauty baryon and meson production differently. These findings are important steps towards a better understanding of heavy-flavor production in nuclear collision systems and will serve as an input for the characterization of the quark-gluon plasma with heavy-flavor observables.
Acknowledgements
We would like to thank Huasheng Shao for providing the HELAC-Onia theoretical predictions. We express our gratitude to our colleagues in the CERN accelerator departments for the excellent performance of the LHC. We thank the technical and administrative staff at the LHCb institutes. We acknowledge support from CERN and from the national agencies: CAPES, CNPq, FAPERJ and FINEP (Brazil); MOST and NSFC (China); CNRS/IN2P3 (France); BMBF, DFG and MPG (Germany); INFN (Italy); NWO (Netherlands); MNiSW and NCN (Poland); MEN/IFA (Romania); MSHE (Russia); MinECo (Spain); SNSF and SER (Switzerland); NASU (Ukraine); STFC (United Kingdom); NSF (USA). We acknowledge the computing resources that are provided by CERN, IN2P3 (France), KIT and DESY (Germany), INFN (Italy), SURF (Netherlands), PIC (Spain), GridPP (United Kingdom), RRCKI and Yandex LLC (Russia), CSCS (Switzerland), IFIN-HH (Romania), CBPF (Brazil), PL-GRID (Poland) and OSC (USA). We are indebted to the communities behind the multiple open-source software packages on which we depend. Individual groups or members have received support from AvH Foundation (Germany); EPLANET, Marie Skłodowska-Curie Actions and ERC (European Union); ANR, Labex P2IO and OCEVU, and Région Auvergne-Rhône-Alpes (France); Key Research Program of Frontier Sciences of CAS, CAS PIFI, and the Thousand Talents Program (China); RFBR, RSF and Yandex LLC (Russia); GVA, XuntaGal and GENCAT (Spain); the Royal Society and the Leverhulme Trust (United Kingdom); Laboratory Directed Research and Development program of LANL (USA).
The reference list from the paper itself. Each links out to its DOI / PubMed record.
- 1[1] A. Andronic et al. , Heavy-flavour and quarkonium production in the LHC era: from proton-proton to heavy-ion collisions , Eur. Phys. J. C 76 (2016) 107 , ar Xiv:1506.03981 · doi ↗
- 2[2] M. Bedjidian et al. , Heavy flavor physics , in Hard probes in heavy ion collisions at the LHC , CERN, Geneva, 2004, ar Xiv:hep-ph/0311048
- 3[3] M. Hirai, S. Kumano, and T.-H. Nagai, Determination of nuclear parton distribution functions and their uncertainties in next-to-leading order , Phys. Rev. C 76 (2007) 065207 , ar Xiv:0709.3038 · doi ↗
- 4[4] K. J. Eskola, H. Paukkunen, and C. A. Salgado, EPS 09: A new generation of NLO and LO nuclear parton distribution functions , JHEP 04 (2009) 065 , ar Xiv:0902.4154 · doi ↗
- 5[5] D. de Florian, R. Sassot, P. Zurita, and M. Stratmann, Global analysis of nuclear parton distributions , Phys. Rev. D 85 (2012) 074028 , ar Xiv:1112.6324 · doi ↗
- 6[6] K. Kovarik et al. , n CTEQ 15 - Global analysis of nuclear parton distributions with uncertainties in the CTEQ framework , Phys. Rev. D 93 (2016) 085037 , ar Xiv:1509.00792 · doi ↗
- 7[7] K. J. Eskola, P. Paakkinen, H. Paukkunen, and C. A. Salgado, EPPS 16: Nuclear parton distributions with LHC data , Eur. Phys. J. C 77 (2017) 163 , ar Xiv:1612.05741 · doi ↗
- 8[8] F. Gelis, E. Iancu, J. Jalilian-Marian, and R. Venugopalan, The Color Glass Condensate , Ann. Rev. Nucl. Part. Sci. 60 (2010) 463 , ar Xiv:1002.0333 · doi ↗