Exploring circumstellar effects on the lithium and calcium abundances in massive Galactic O-rich AGB stars
V. P\'erez-Mesa, O. Zamora, D. A. Garc\'ia-Hern\'andez, Y. Osorio, T., Masseron, B. Plez, A. Manchado, A. I. Karakas, M. Lugaro

TL;DR
This study investigates how circumstellar environments influence lithium and calcium abundances in massive Galactic O-rich AGB stars, finding minimal impact on observed abundances and confirming lithium enrichment due to hot bottom burning.
Contribution
First application of pseudo-dynamical models to determine Li and Ca abundances in AGB stars, showing minimal circumstellar effects and supporting HBB activation.
Findings
Li abundances confirm Li-rich nature of stars, supporting HBB activation.
Ca abundances are mostly solar, consistent with s-process models.
Some stars show unexpected Ca depletion, with potential explanations.
Abstract
We previously explored the circumstellar effects on the Rb and Zr abundances in massive Galactic O-rich AGB stars. Here we are interested in the role of the extended atmosphere in the case of Li and Ca. Li is an important indicator of HBB while the total Ca in these stars could be affected by neutron captures. The Li abundances were previously studied with hydrostatic models, while the Ca abundances have been determined for the first time. We use a modified version of Turbospectrum and consider the presence of a gaseous circumstellar envelope and radial wind. The new Li abundances derived with the pseudo-dynamical models are very similar to those obtained from hydrostatic models (the average difference is 0.18 dex), with no difference for Ca. The Li and Ca content in these stars is only slightly affected by the presence of a circumstellar envelope. We also found that the Li I and Ca I…
Click any figure to enlarge with its caption.
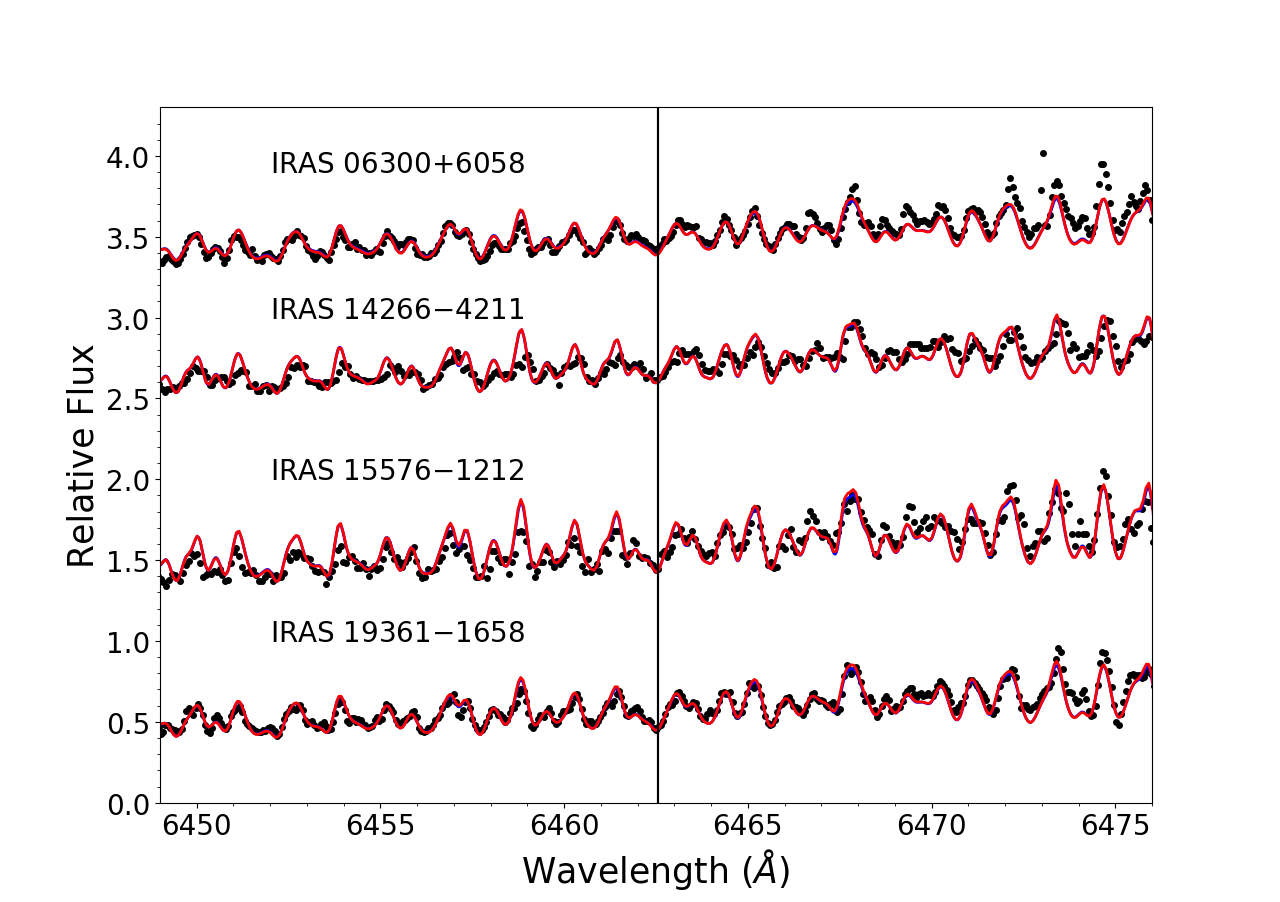 Figure 1
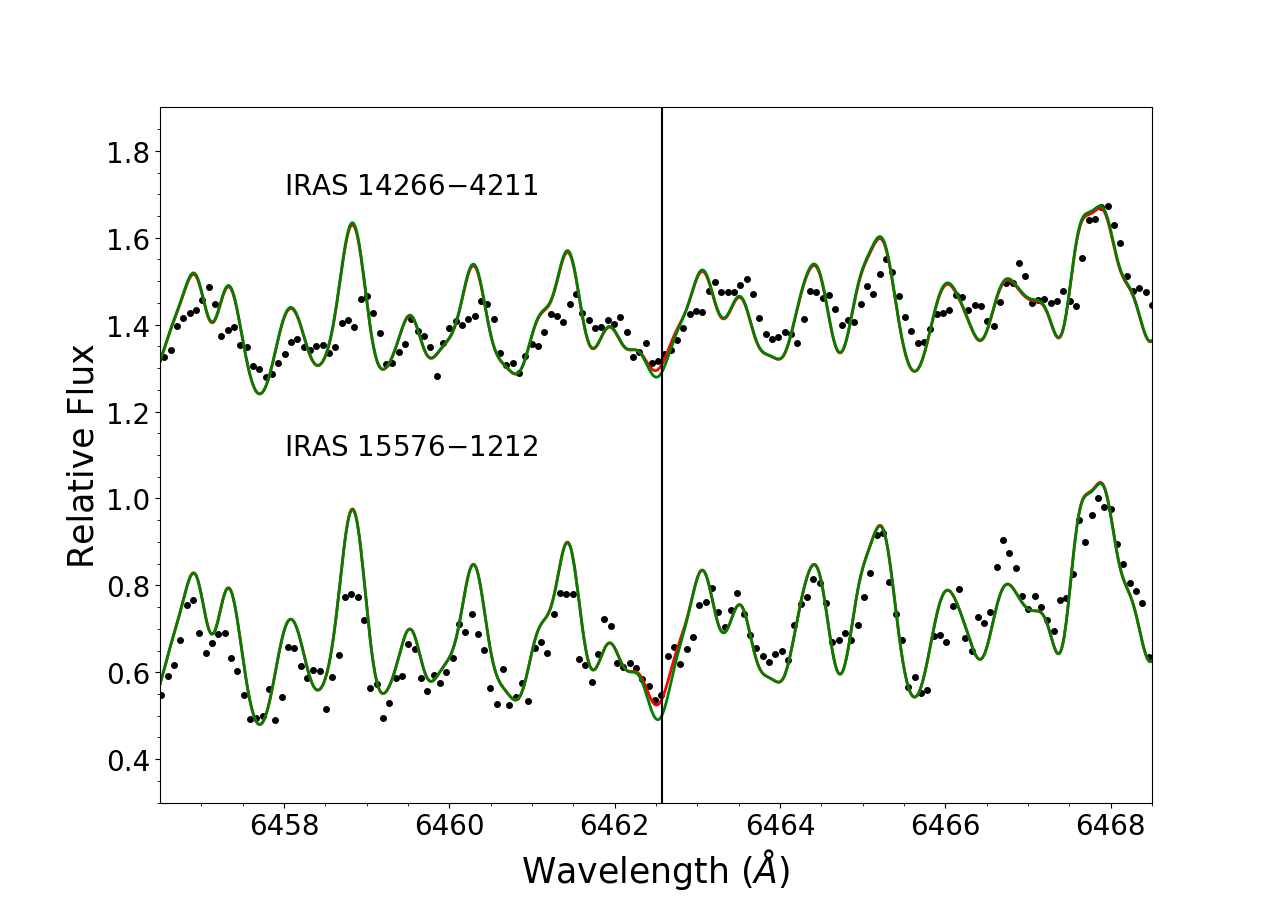 Figure 2
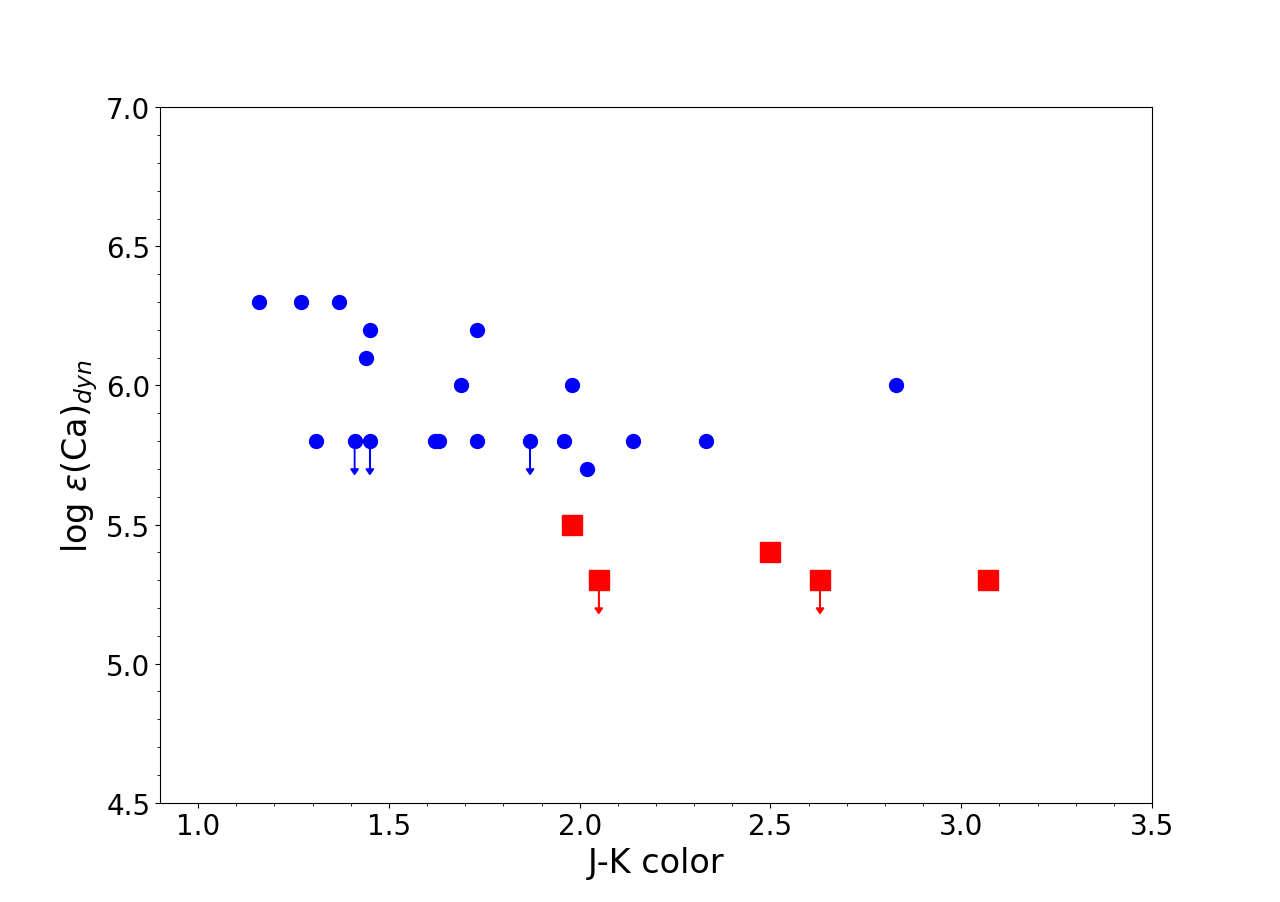 Figure 3
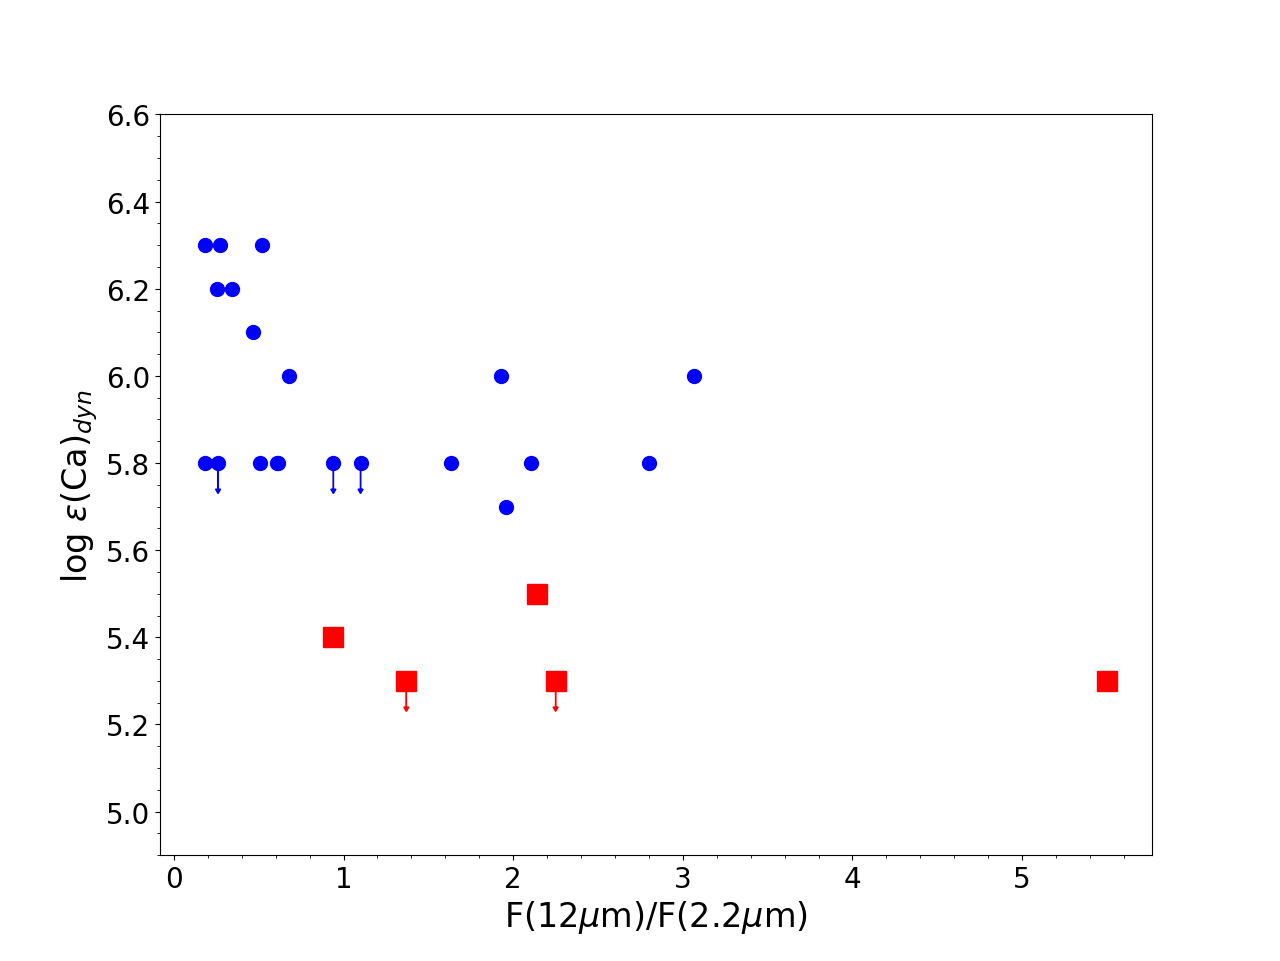 Figure 4
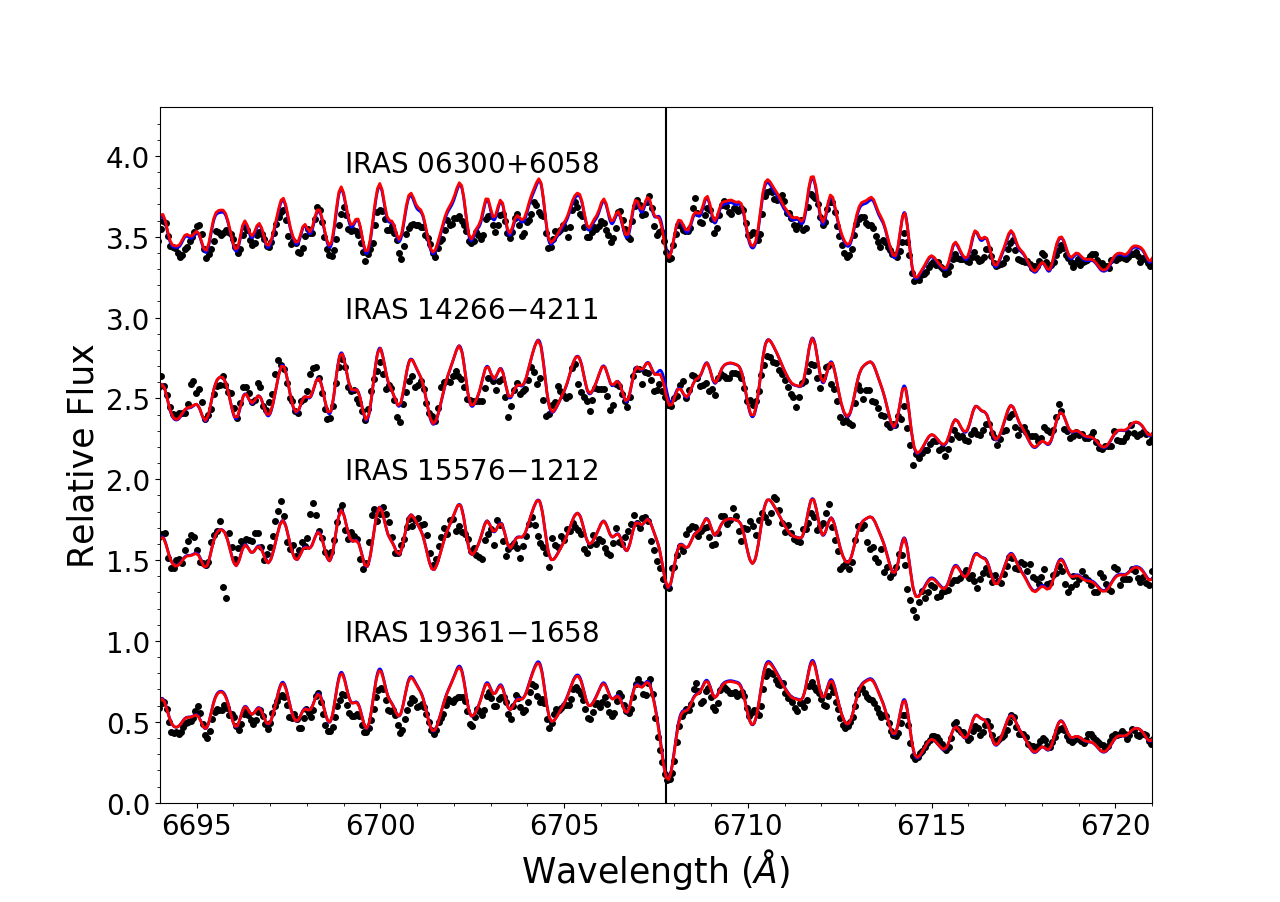 Figure 5
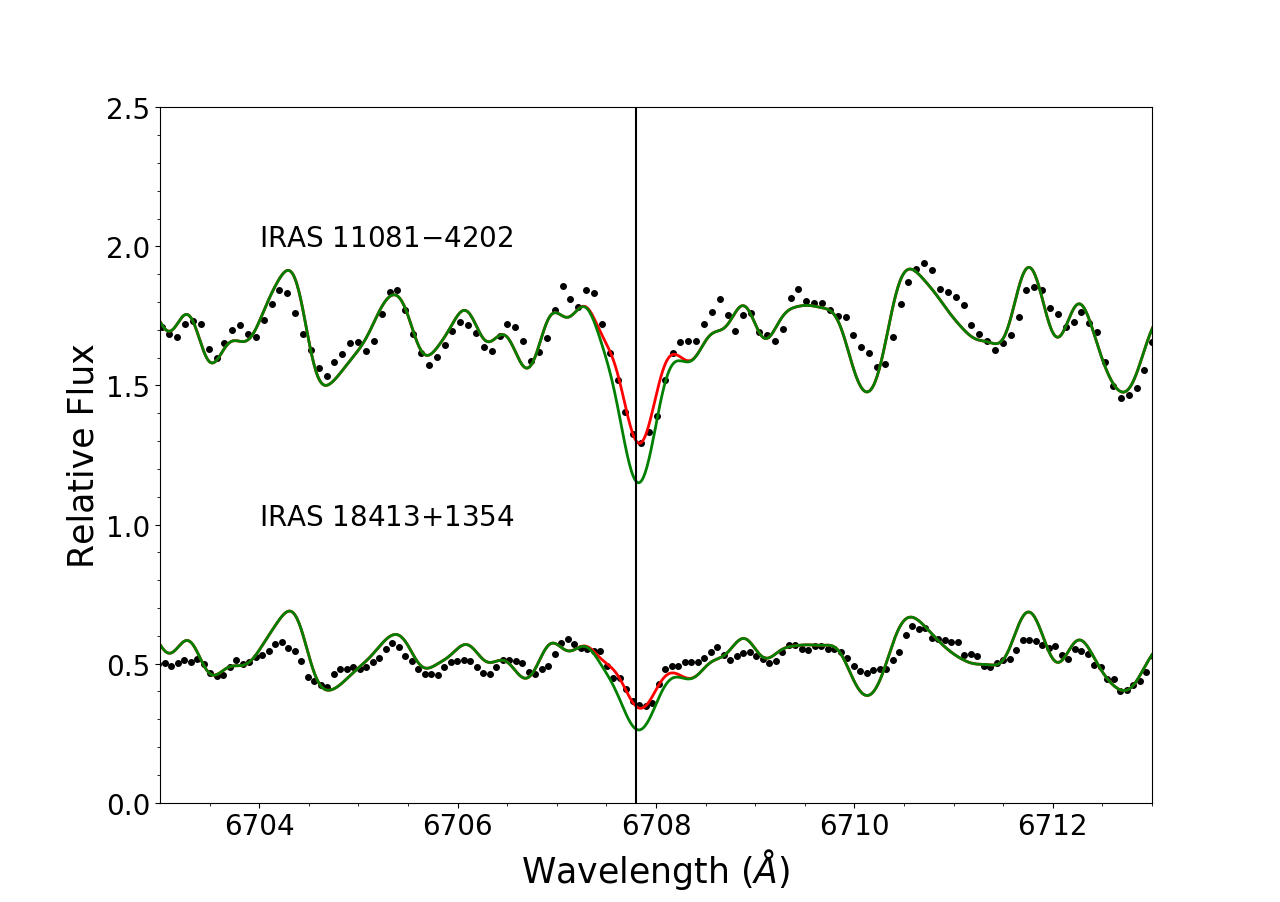 Figure 6
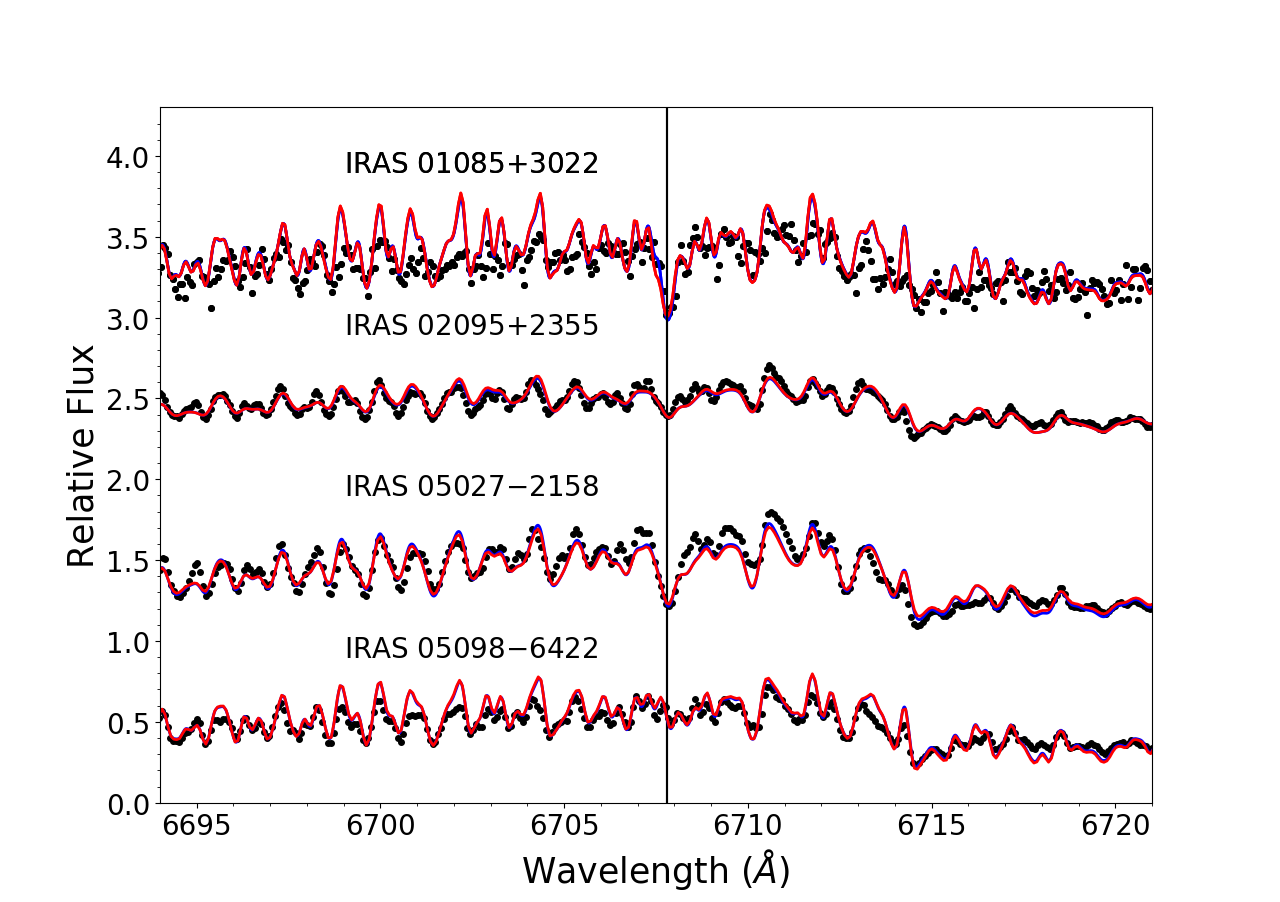 Figure 7
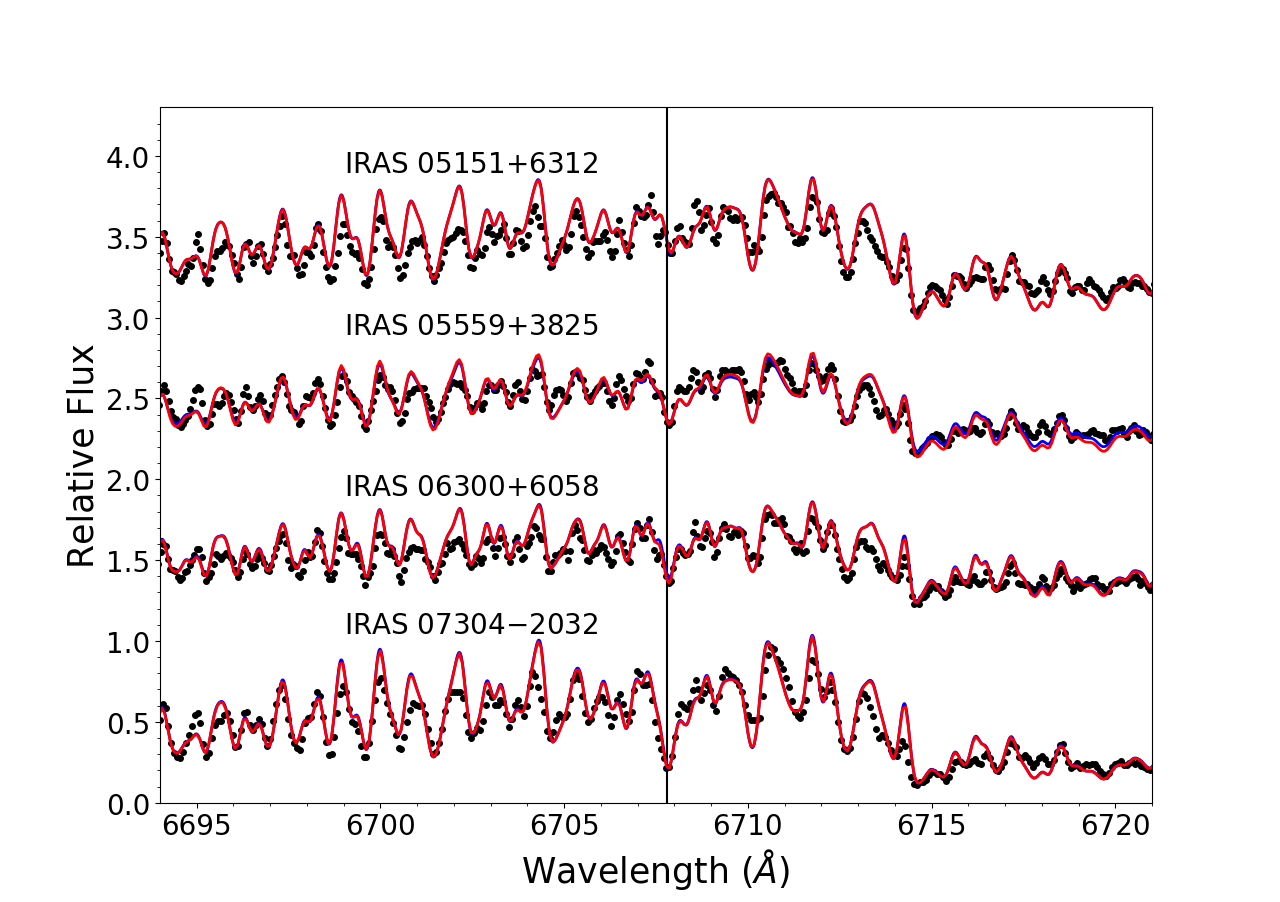 Figure 8
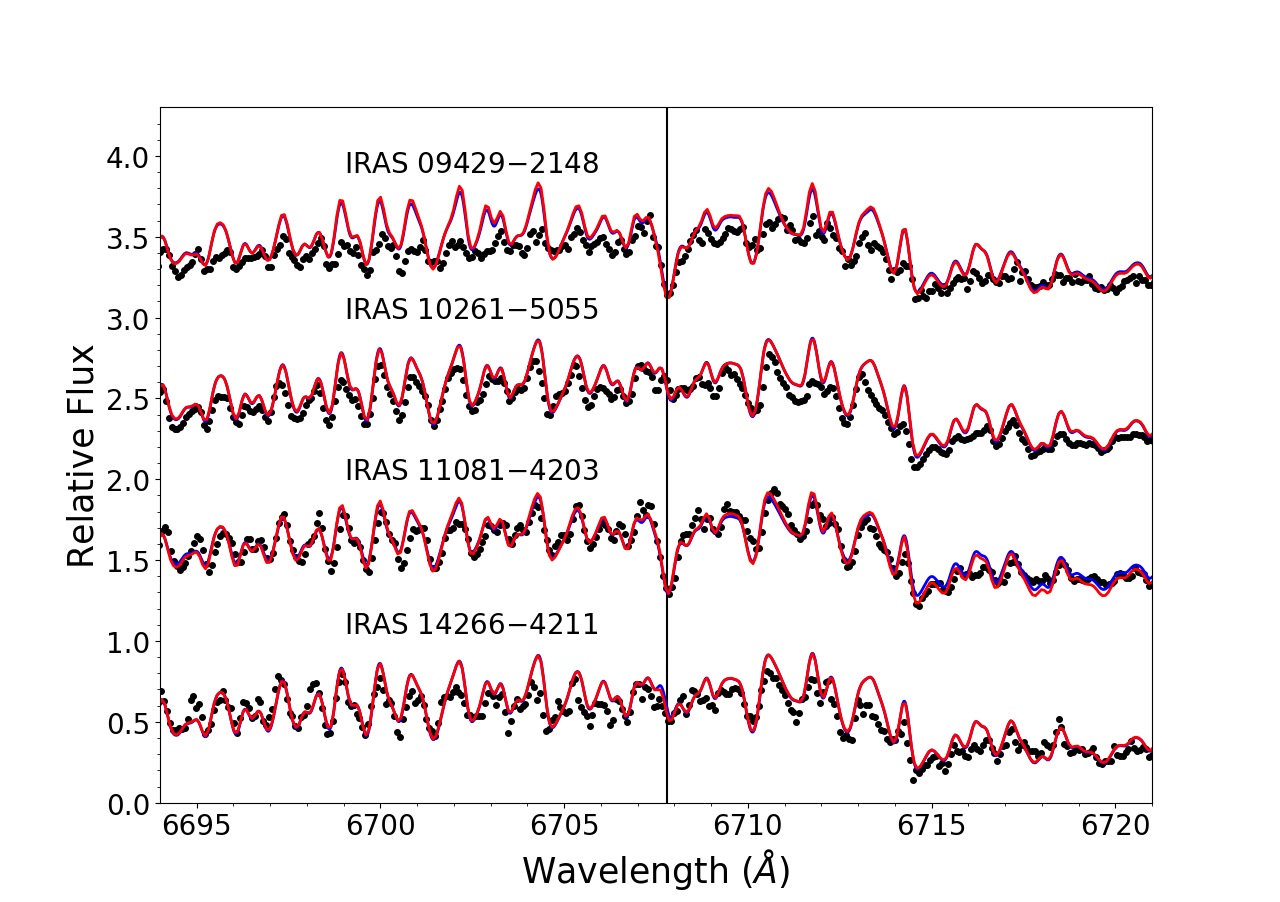 Figure 9
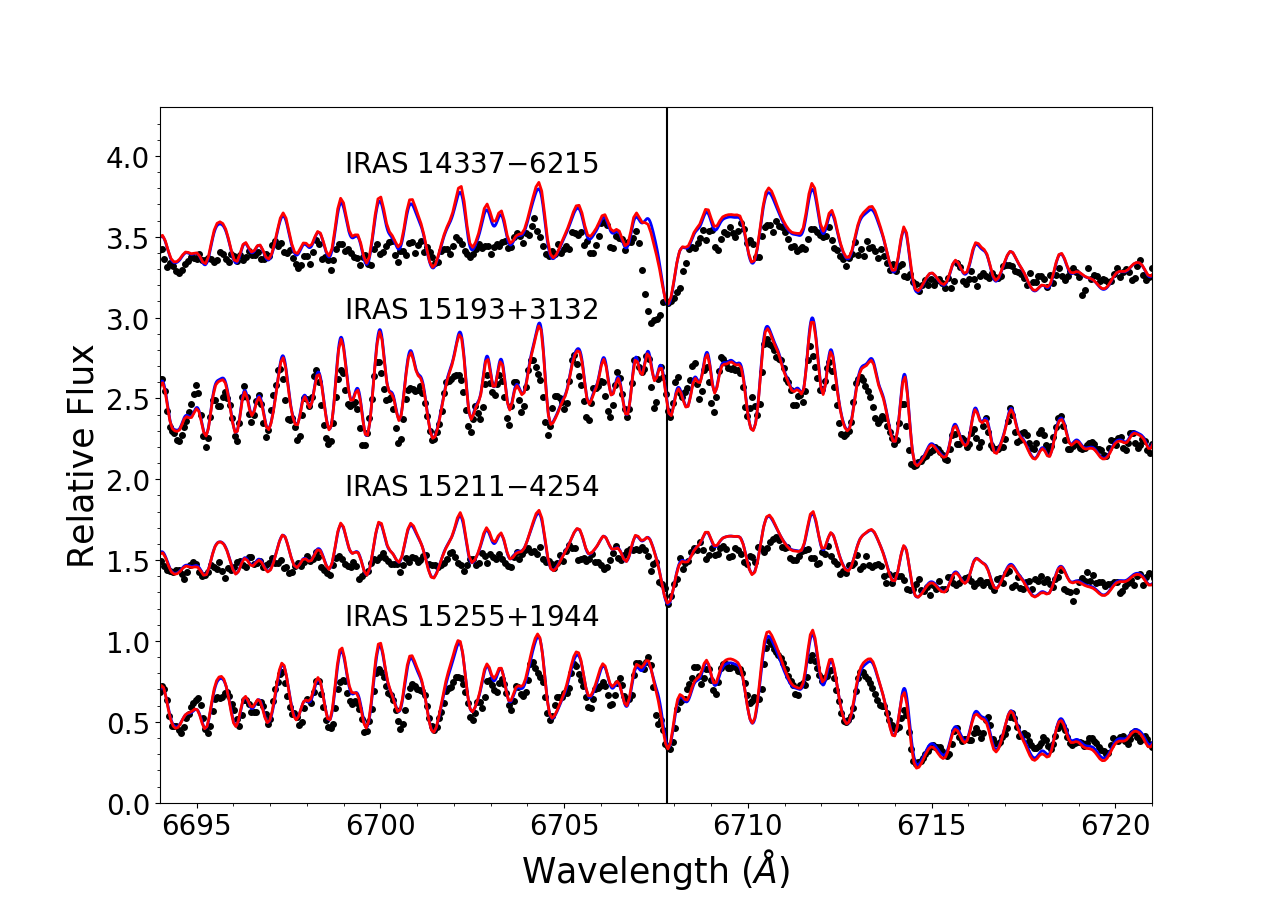 Figure 10
 Figure 11
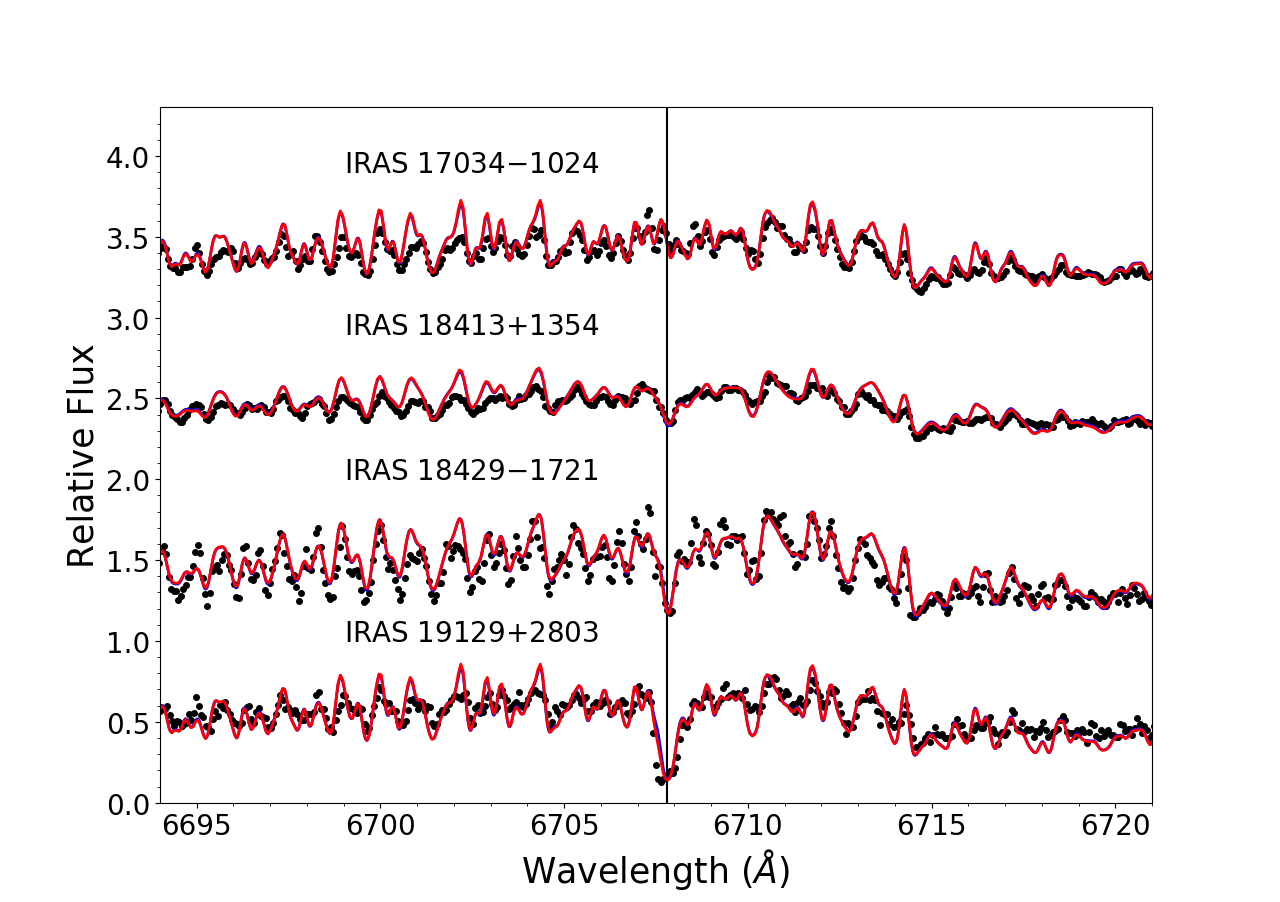 Figure 12
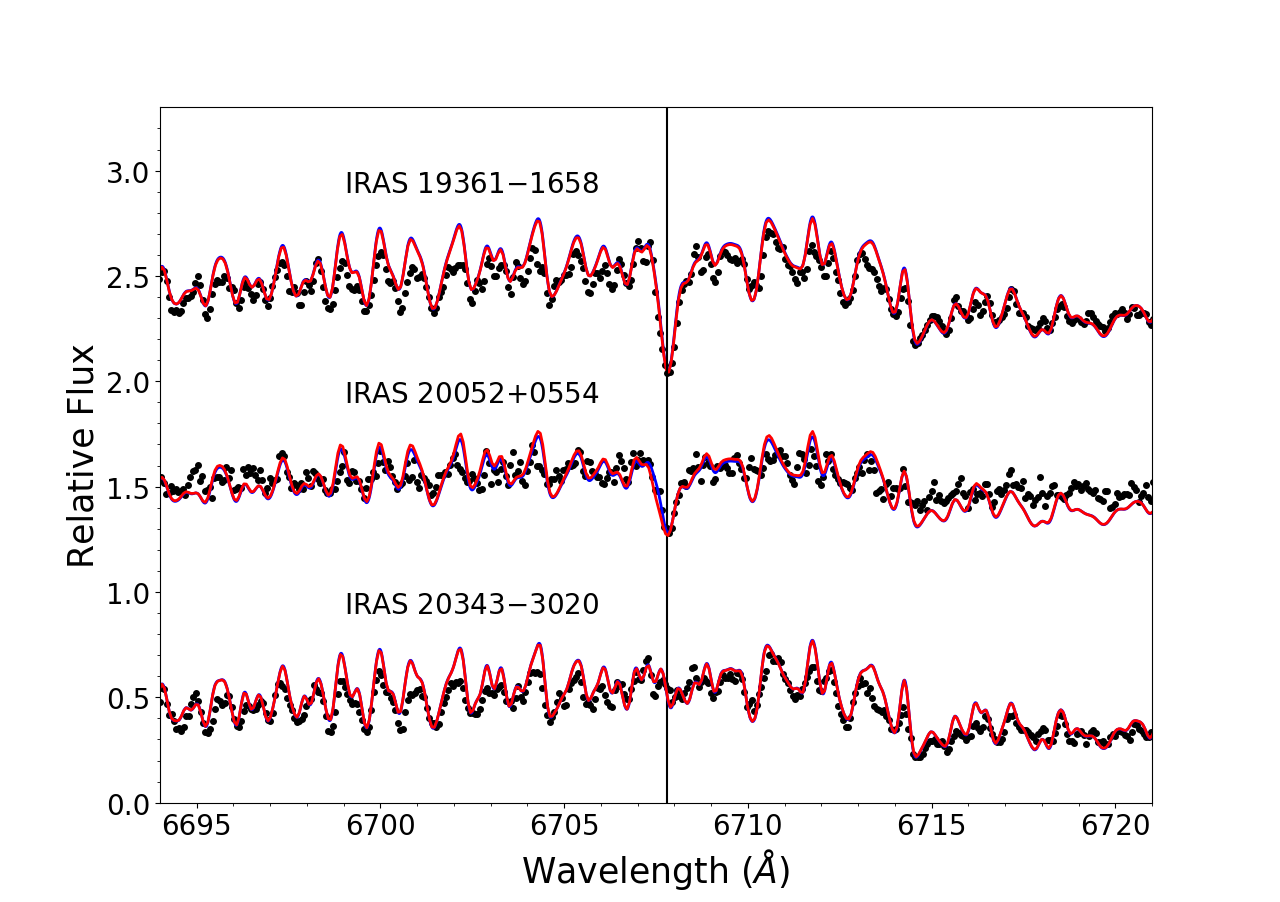 Figure 13
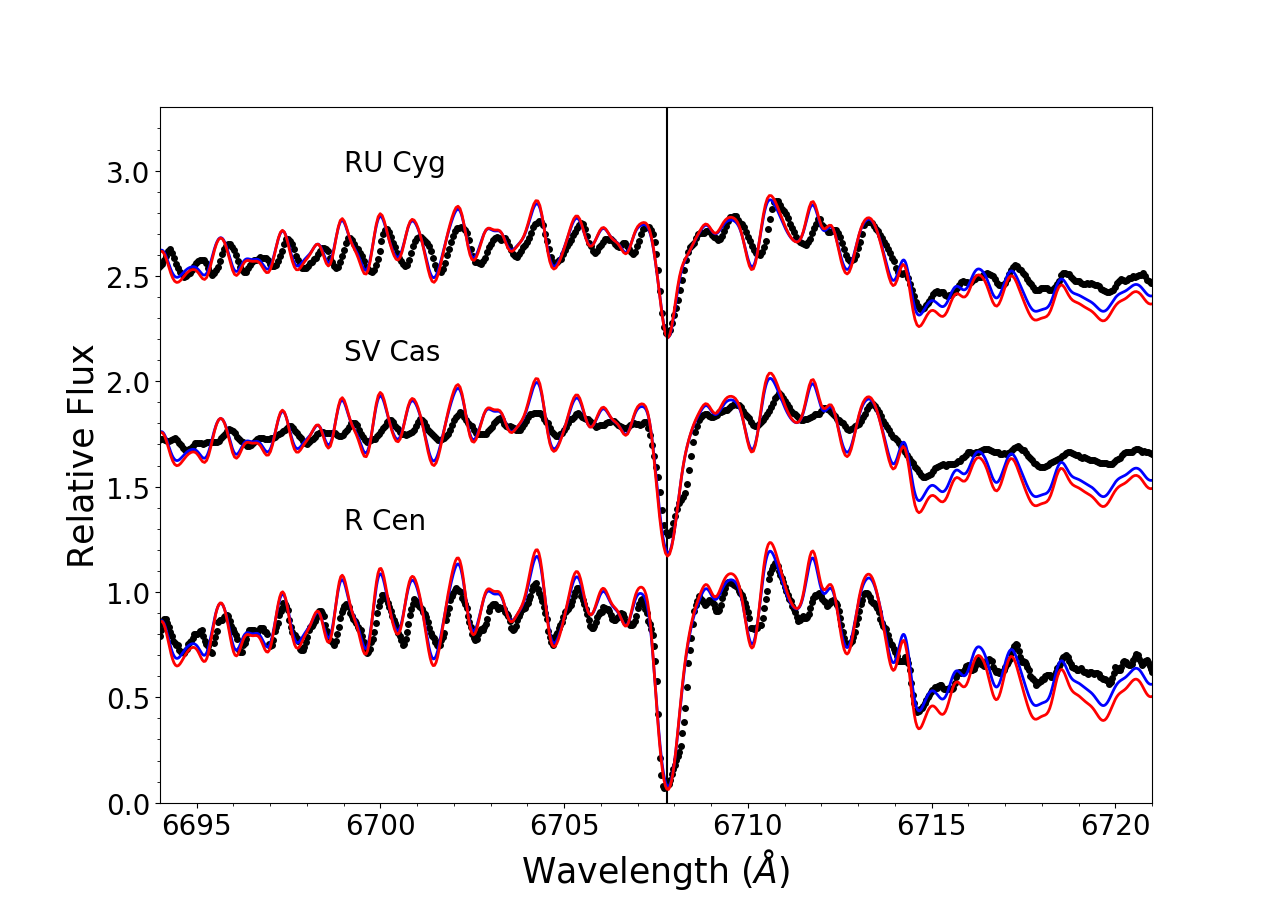 Figure 14
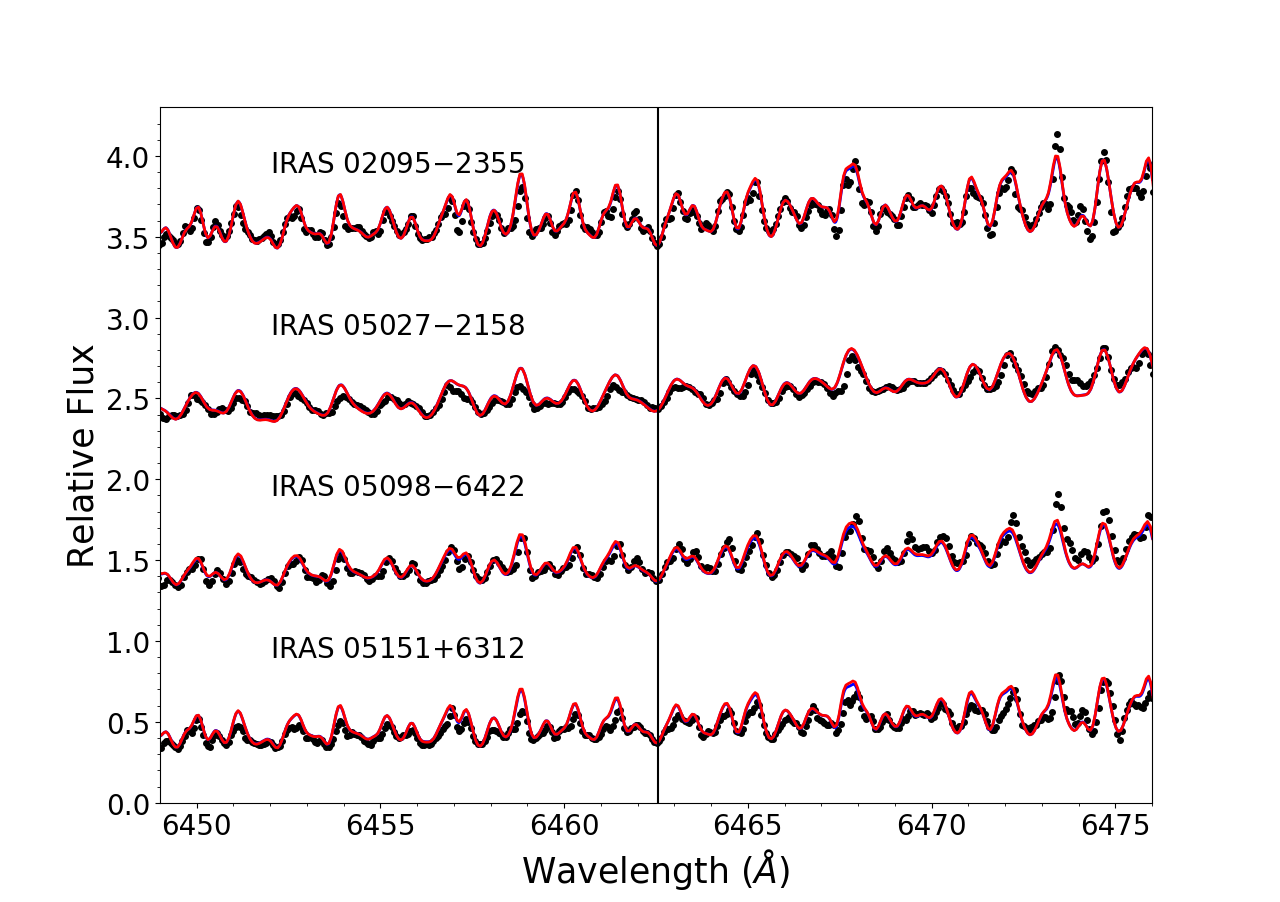 Figure 15
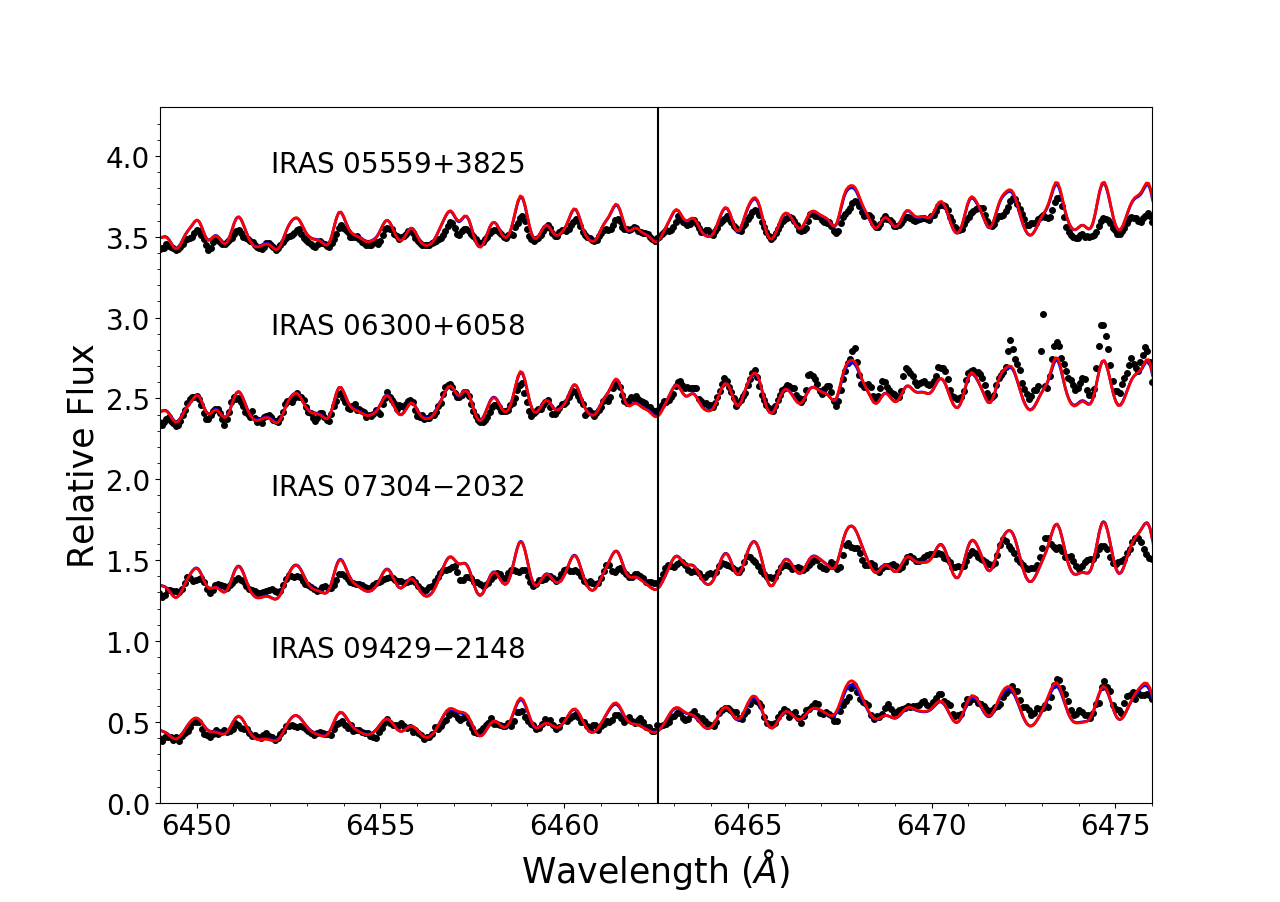 Figure 16
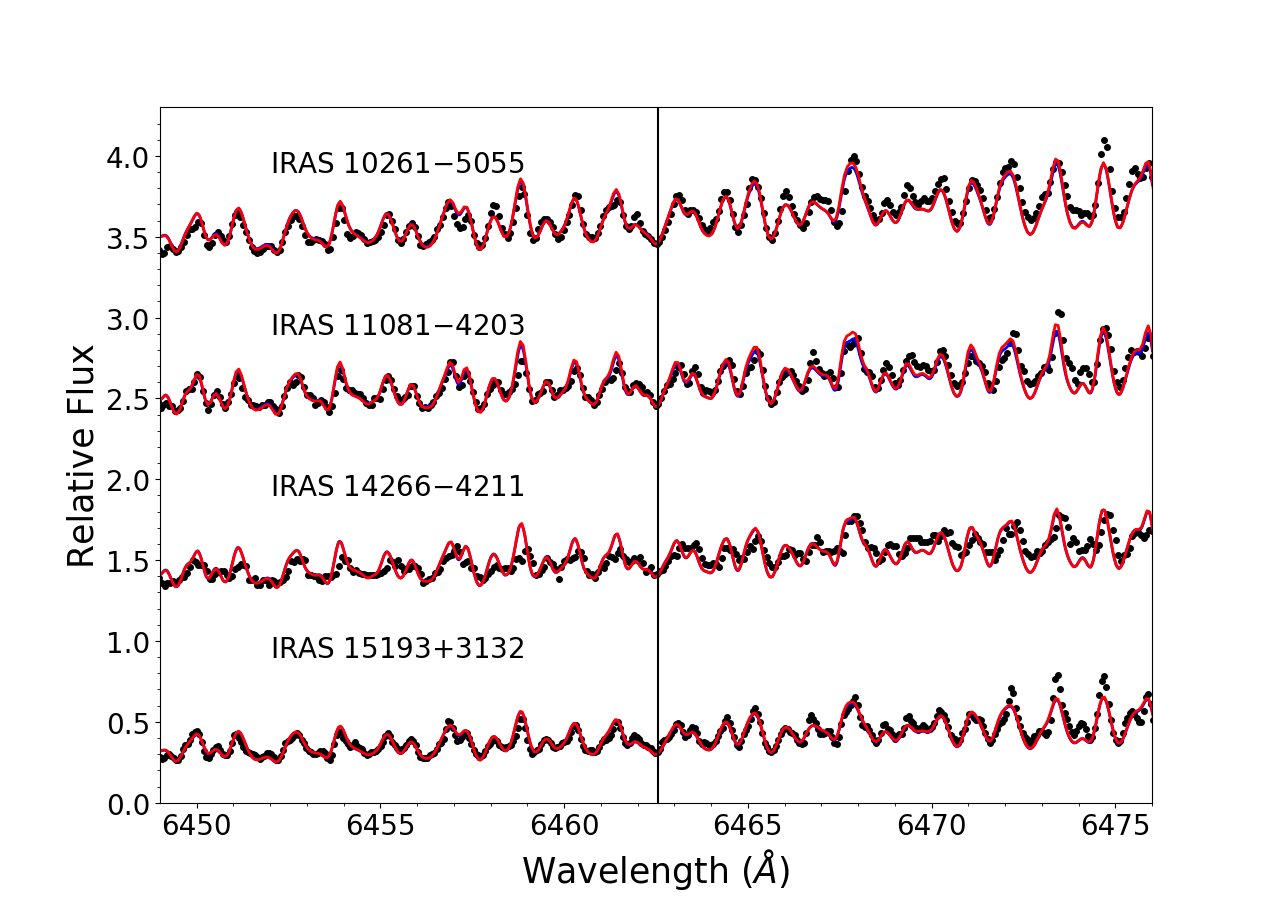 Figure 17
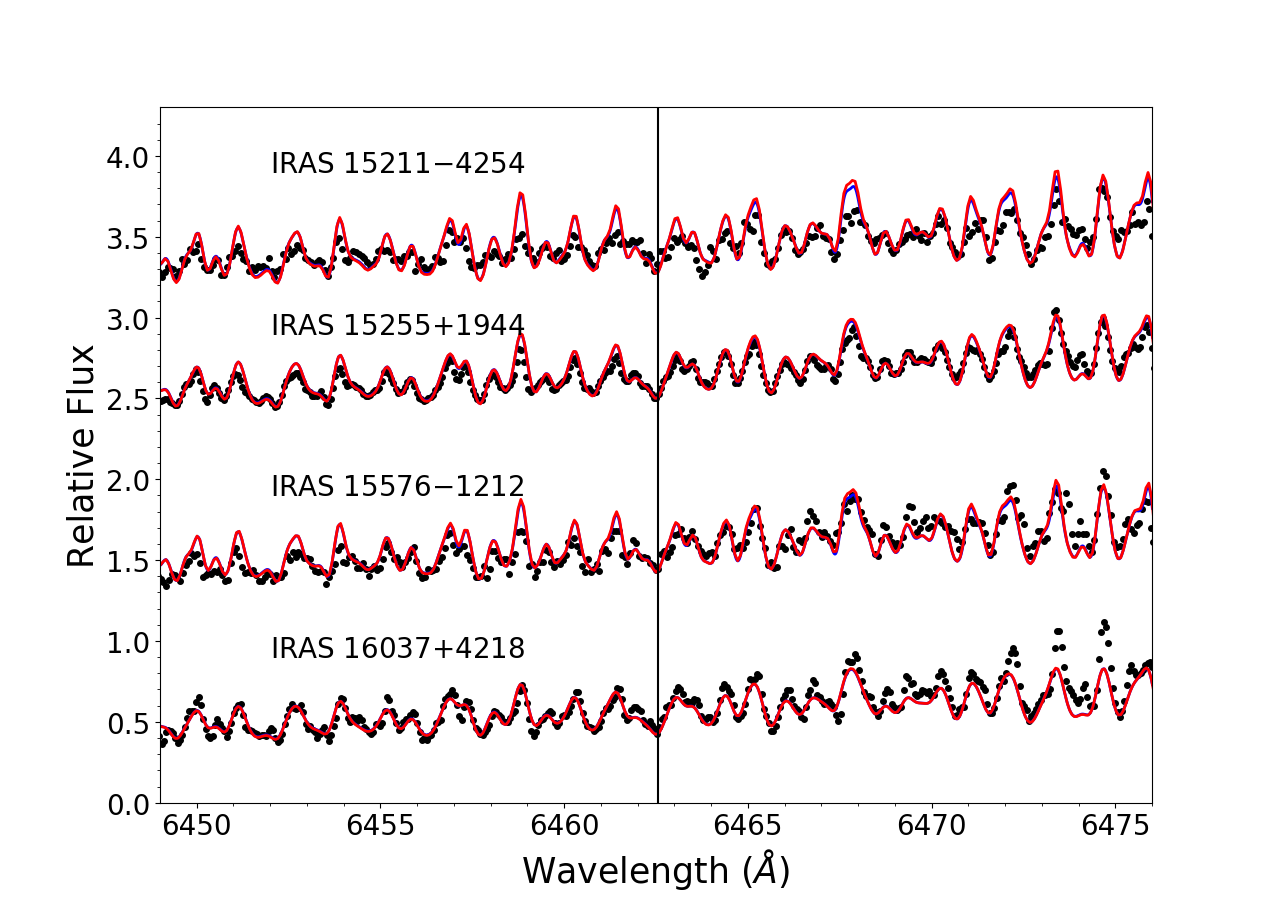 Figure 18
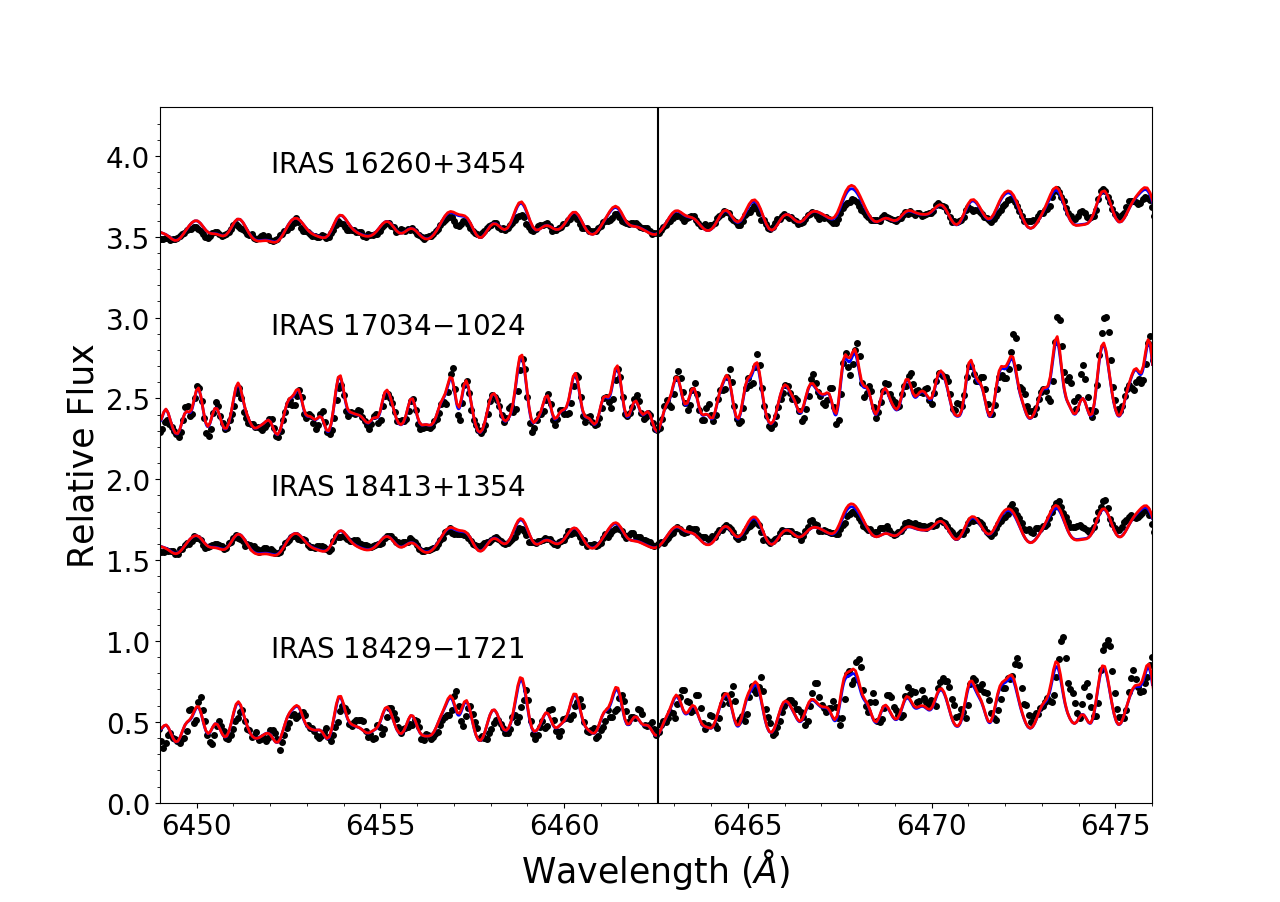 Figure 19
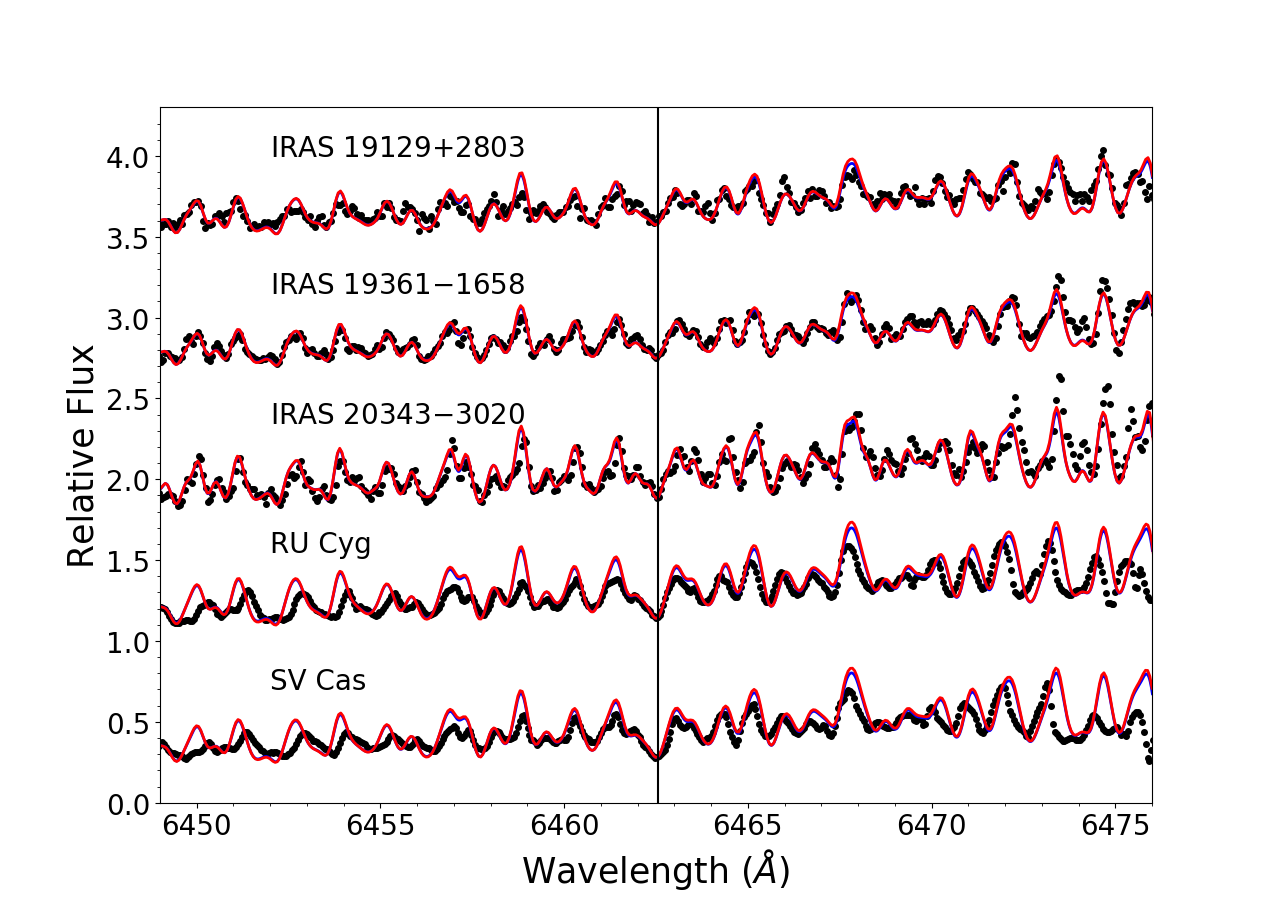 Figure 20
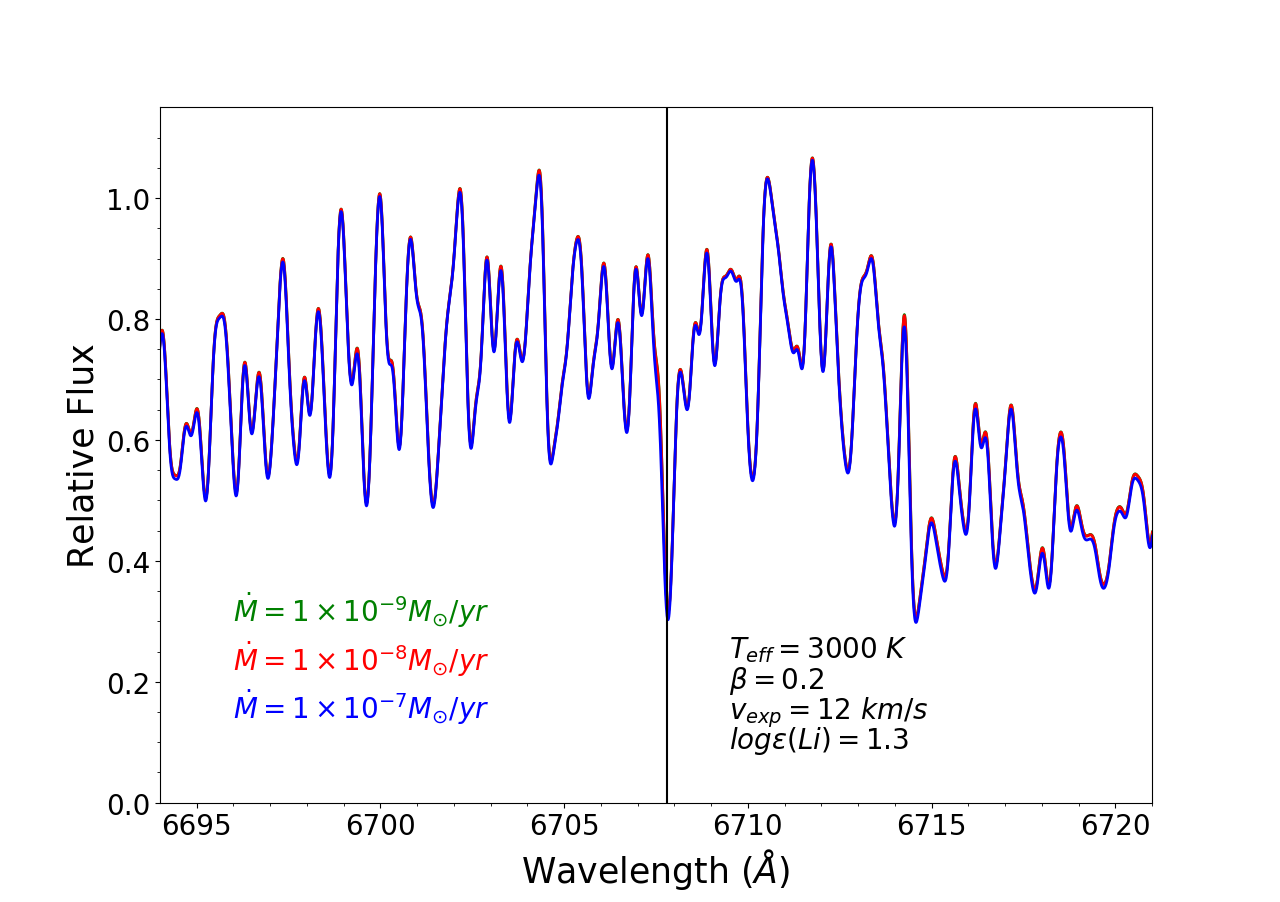 Figure 21
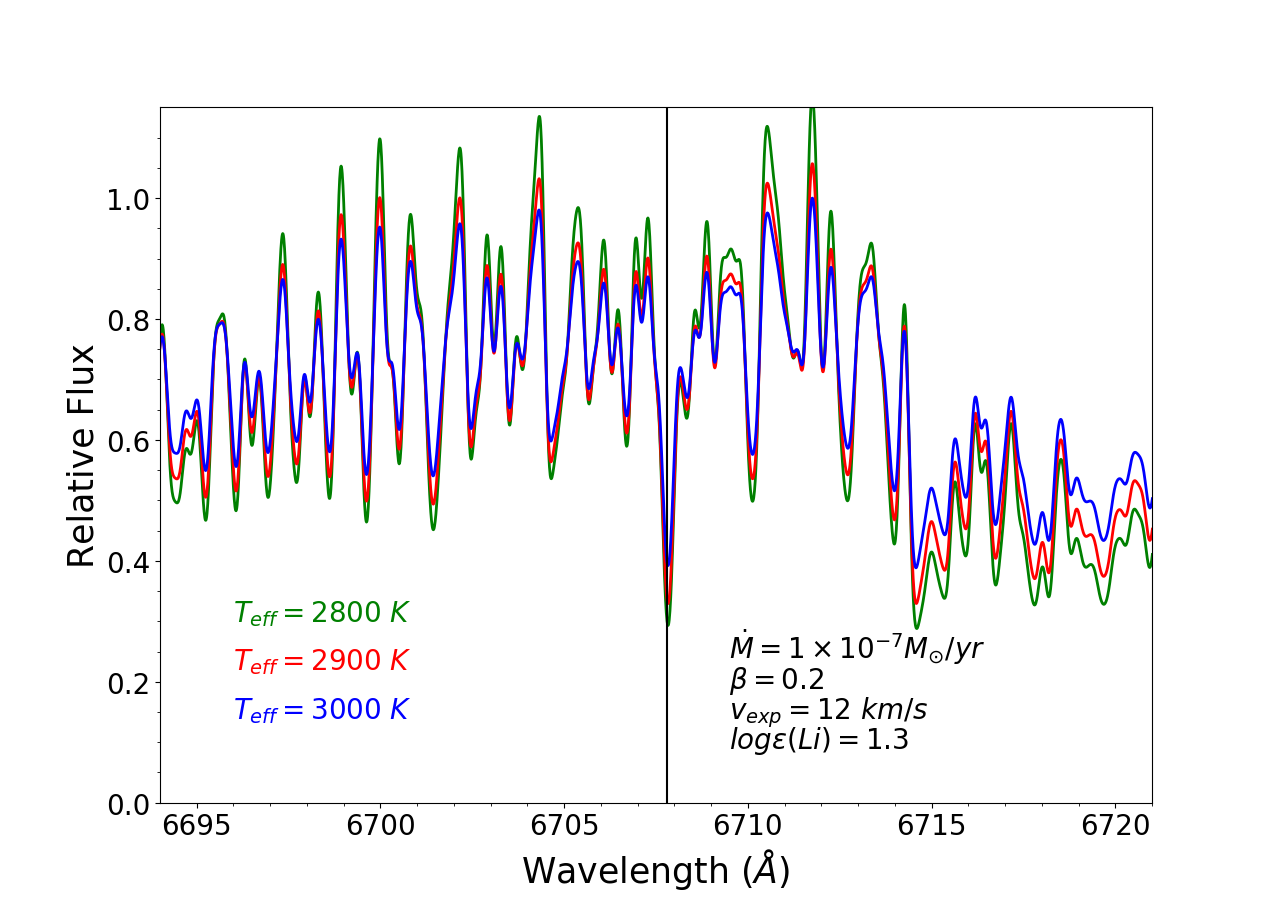 Figure 22
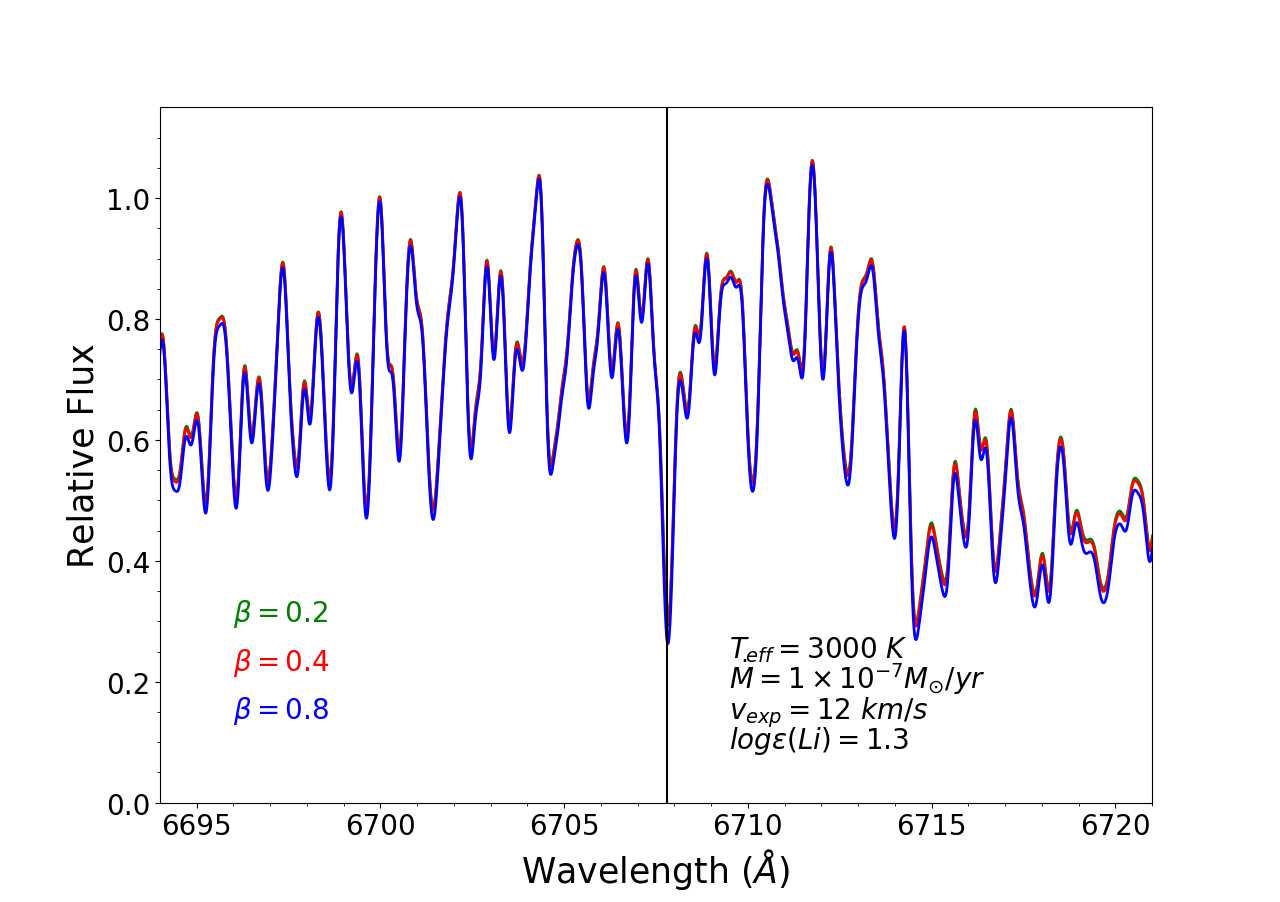 Figure 23
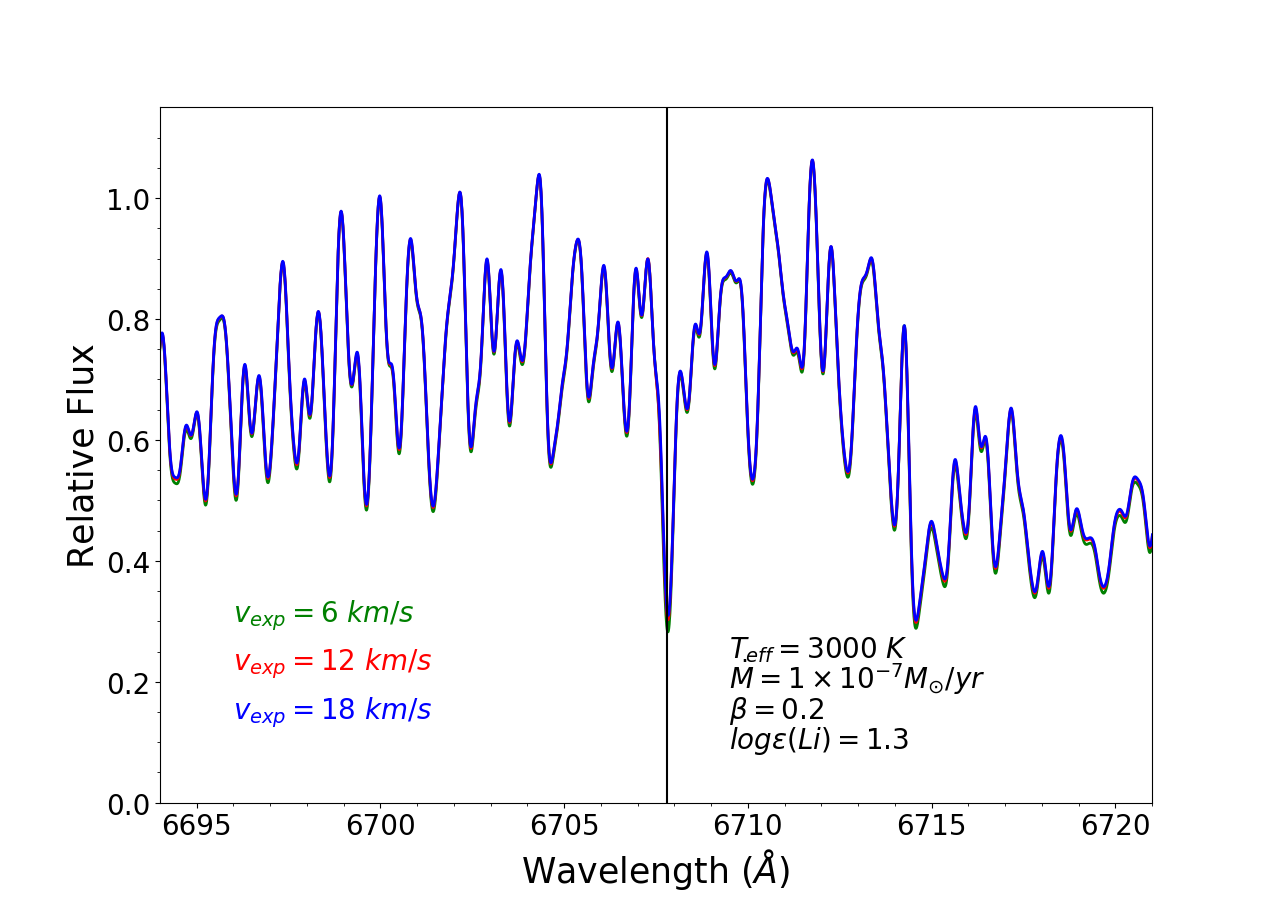 Figure 24
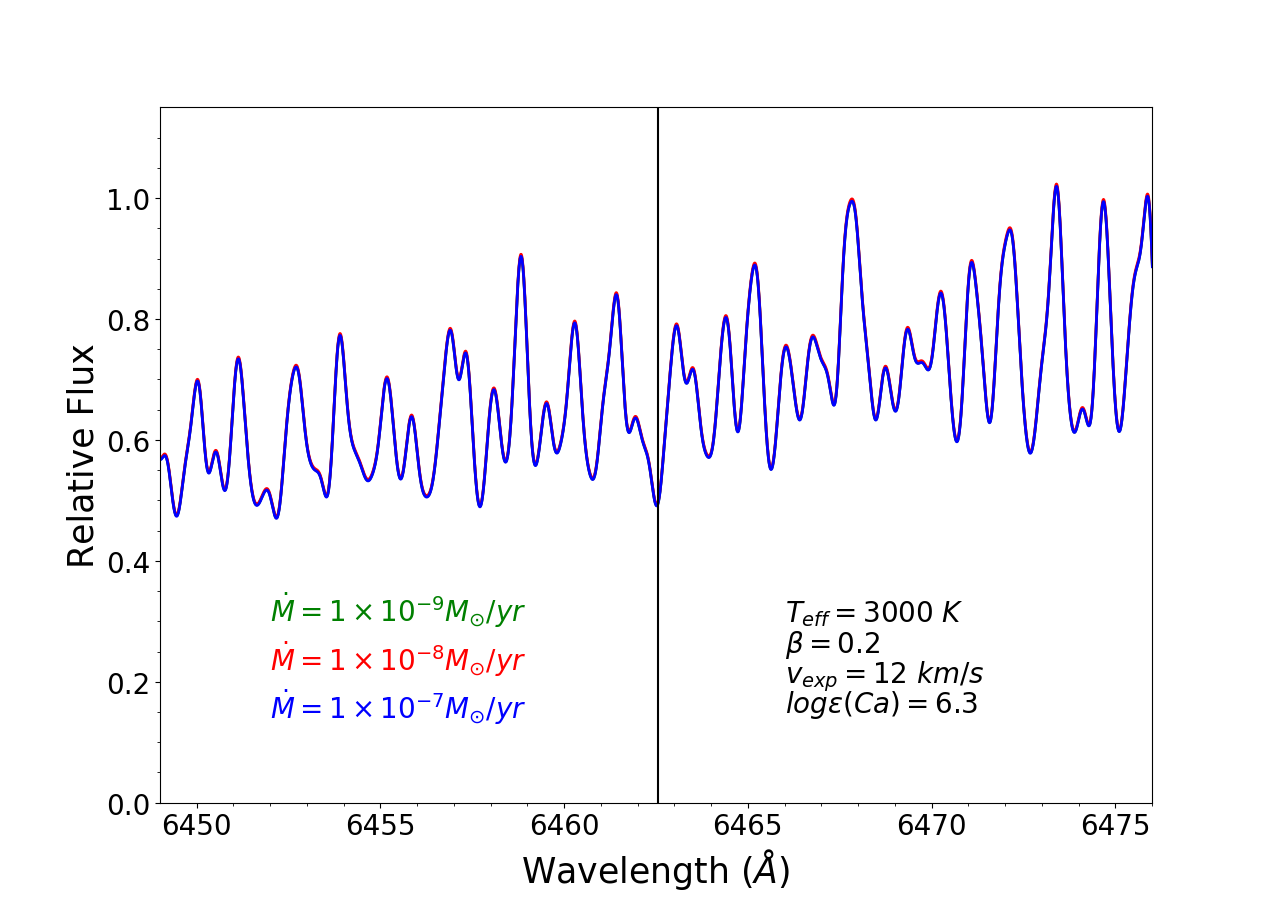 Figure 25
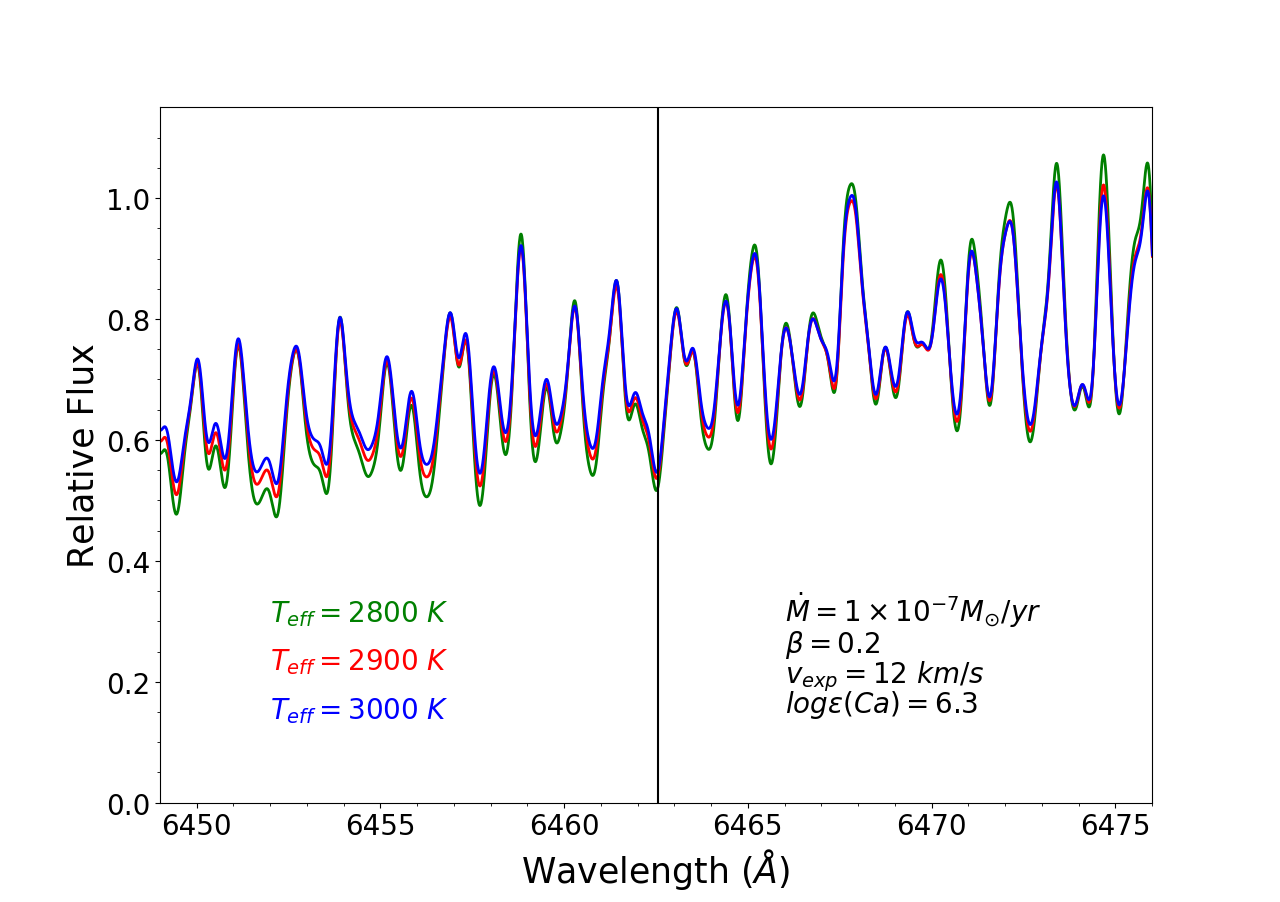 Figure 26
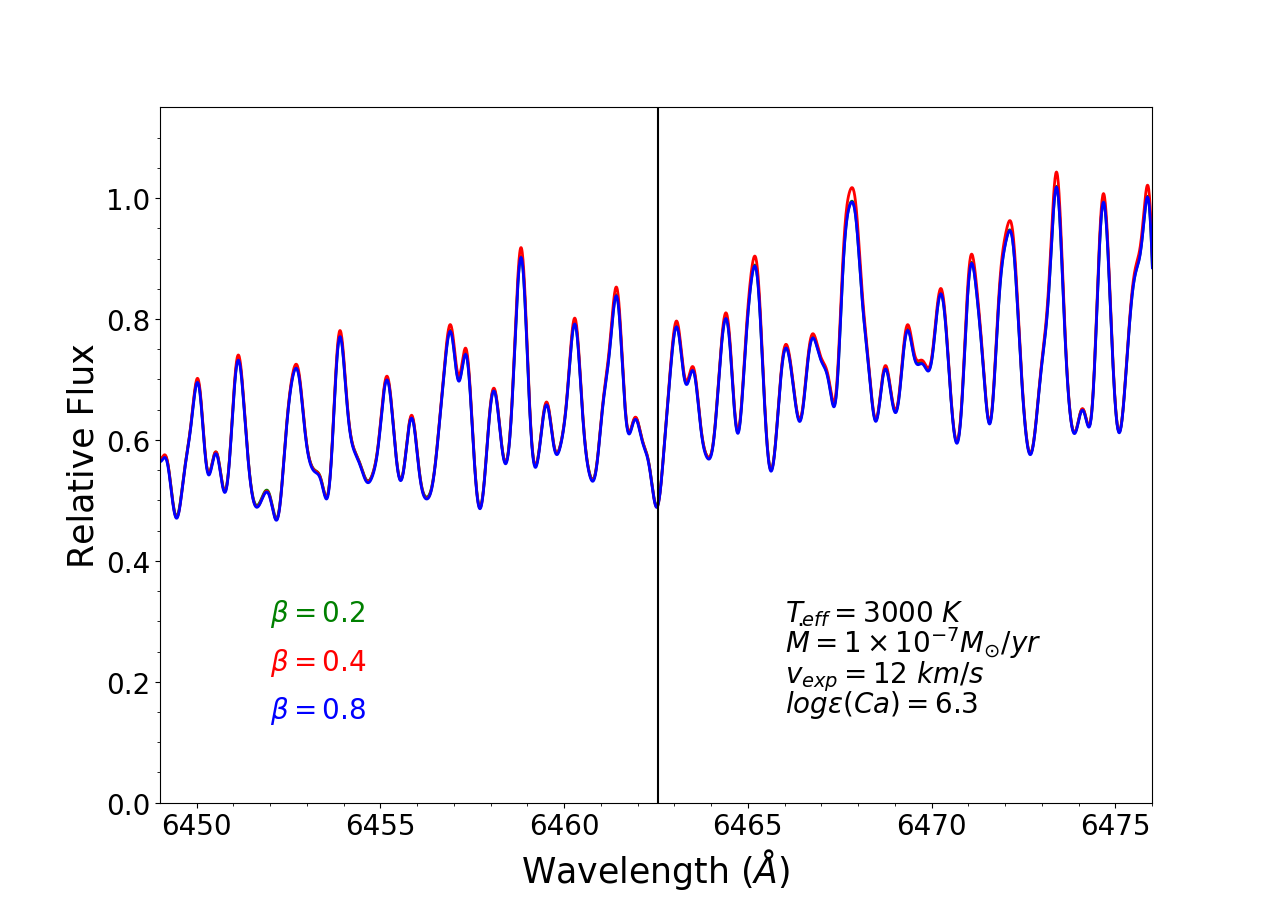 Figure 27
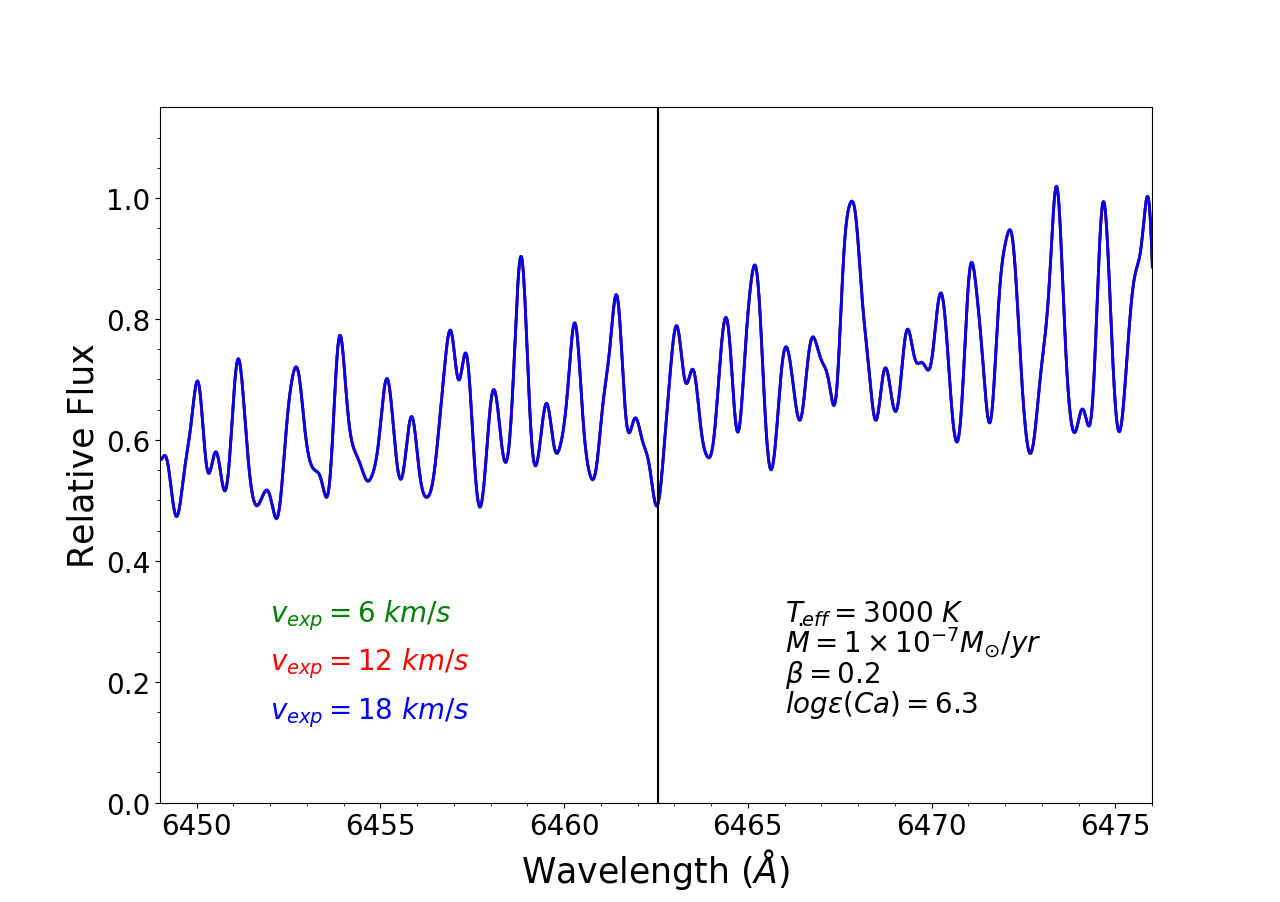 Figure 28
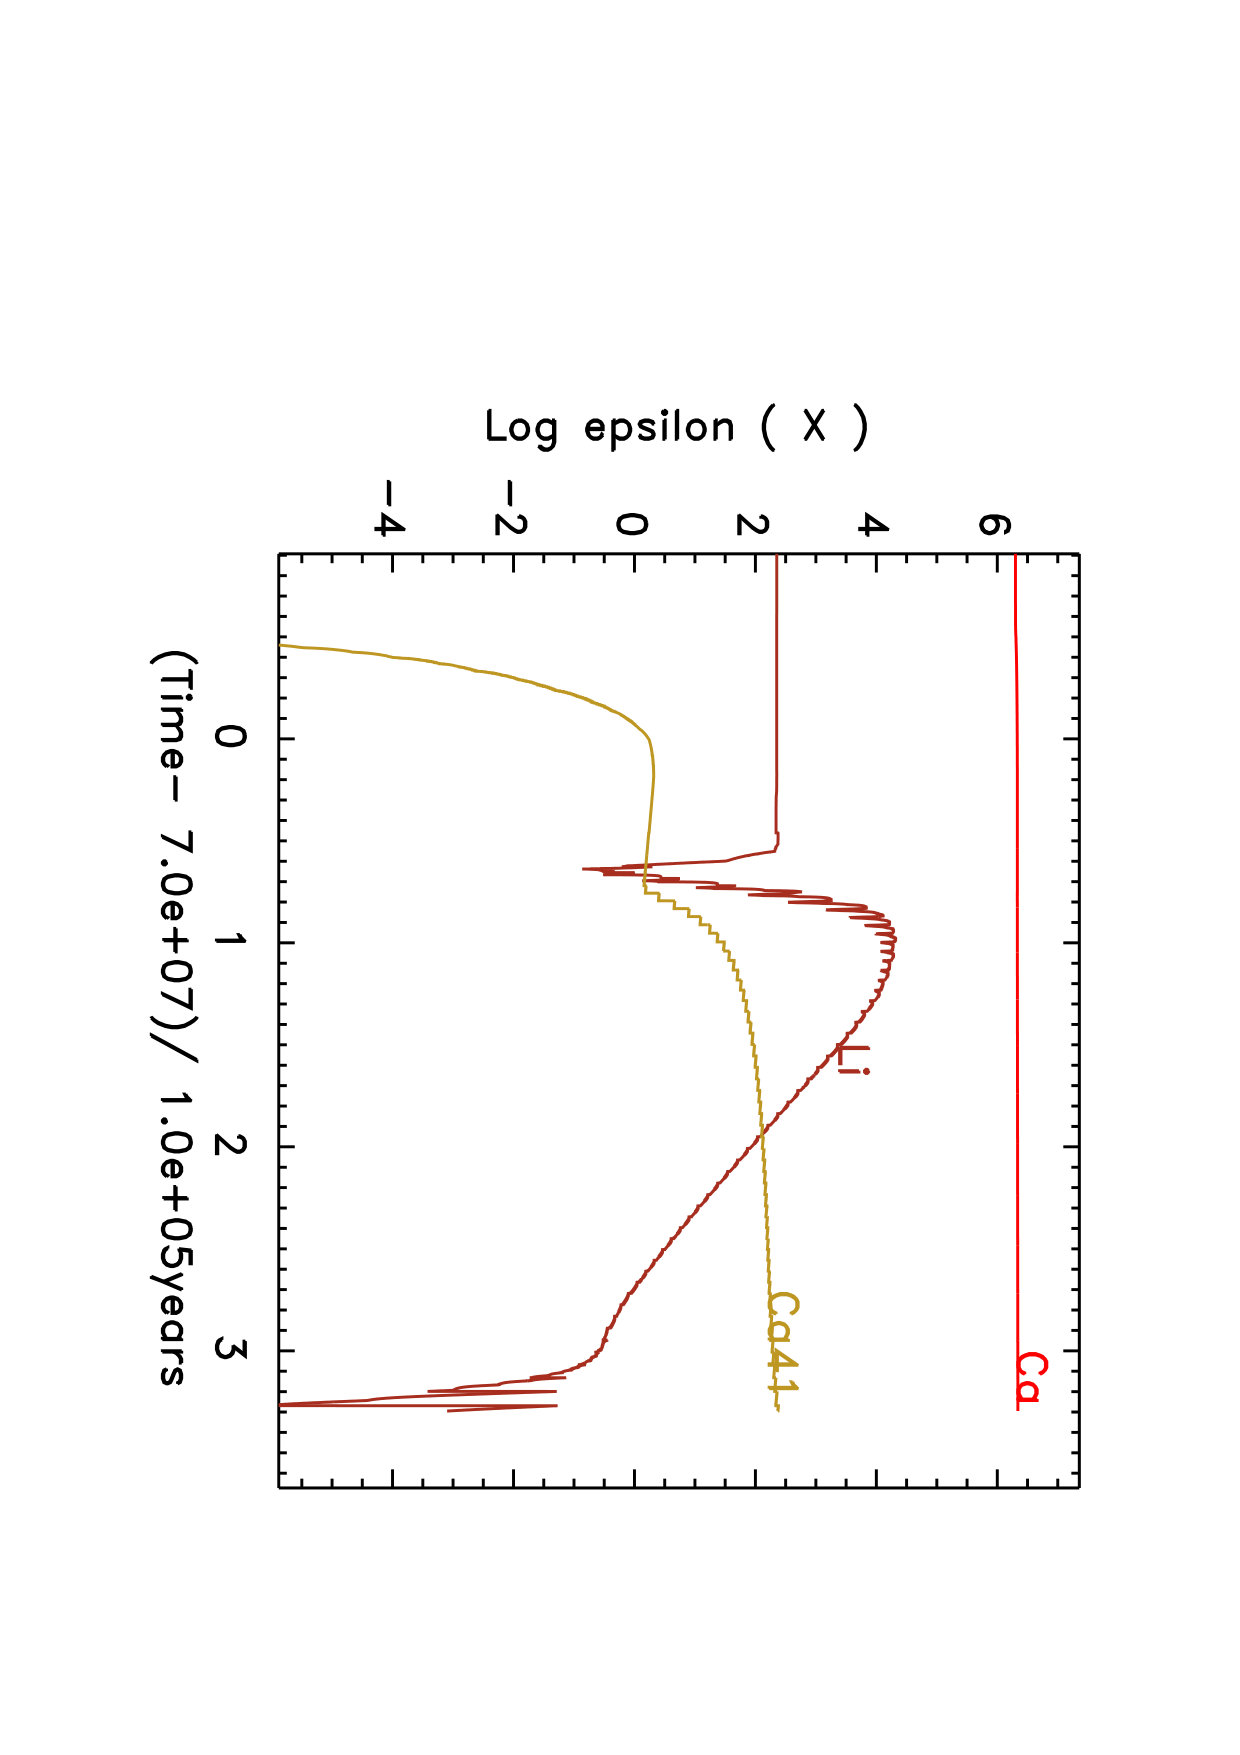 Figure 29
| IRAS name | (K) | log | vexp(OH) (km s-1) | Ref. | Period (days) | Ref. | log |
|---|---|---|---|---|---|---|---|
| 010853022 | 3300 | 0.5 | 13 | 1 | 560 | 1 | 2.4 |
| 020952355 | 3300 | 0.5 | 12 | … | 659 | 2 | 1.6 |
| 050272158 | 2800 | 0.5 | 8 | 2 | 368 | 1 | 1.1 |
| 050986422 | 3000 | 0.5 | 6 | 3 | 394 | 3 | 1.0 |
| 051516312 | 3000 | 0.5 | 15 | 3 | 628 | 4 | 0.0 |
| 055593825 | 2900 | 0.5 | 12 | 6 | 590 | 5 | 0.6 |
| 063006058 | 3000 | 0.5 | 12 | 3 | 440 | 6 | 0.7 |
| 073042032 | 2700 | 0.5 | 7 | 4 | 509 | 1 | 0.9 |
| 094292148 | 3300 | 0.5 | 12 | 3 | 650 | 1 | 2.2 |
| 102615055 | 3000 | 0.5 | 4 | 2 | 317 | 1 | 1.0 |
| 110814203 | 3000 | 0.5 | 8 | 2 | 332 | 8 | 1.3 |
| 142664211 | 2900 | 0.5 | 9 | 2 | 389 | 8 | 0.0 |
| 143376215 | 3300 | 0.5 | 20 | 5 | … | … | 2.41 |
| 151933132 | 2800 | 0.5 | 3 | 3 | 360 | 1 | 0.0 |
| 152114254 | 3300 | 0.5 | 11 | 2 | … | … | 2.3 |
| 152551944 | 2900 | 0.5 | 7 | 3 | 425 | 1 | 1.0 |
| 155761212 | 3000 | 0.5 | 10 | 3 | 415 | 1 | 1.1 |
| 160305156 | 3000 | 0.5 | 10 | 2 | 579 | 9 | 1.5 |
| 160374218 | 2900 | 0.5 | 4 | 2 | 360 | 10 | 1.0 |
| 162603454 | 3300 | 0.5 | 12 | 3 | 475 | 1 | 2.7 |
| 170341024 | 3300 | 0.5 | 8 | 2 | 346 | 1 | 0.0 |
| 184131354 | 3300 | 0.5 | 15 | 6 | 590 | 5 | 1.8 |
| 184291721 | 3000 | 0.5 | 7 | 2 | 481 | 8 | 1.2 |
| 191292803 | 3300 | 0.5 | 11 | 2 | 420 | 10 | 3.11 |
| 193611658 | 3000 | 0.5 | 8 | 2 | … | … | 1.9 |
| 200520554 | 3300 | 0.5 | 16 | 7 | 450 | 5 | 2.6 |
| 203433020 | 3000 | 0.5 | 8 | 2 | 349 | 1 | 1.0 |
| RU Cyg | 3000 | 0.5 | 12 | … | 442 | 11 | 2.0 |
| SV Cas | 3000 | 0.5 | 12 | … | 456 | 11 | 3.5 |
| R Cen | 3000 | 0.5 | 5 | … | 251 | 11 | 4.3 |
| IRAS name | (K) | log | (M⊙ yr-1) | vexp(OH) (km s-1) | log | log | log | log | |
|---|---|---|---|---|---|---|---|---|---|
| 010853022* | 3300 | 0.5 | 0.2 | 1.010-7 | 13 | 2.4 | 2.2 | … | … |
| 020952355 | 3300** | 0.5 | 0.8 | 1.010-9 | 12 | 1.6 | 1.6 | 6.3 | 6.3 |
| 050272158 | 2800 | 0.5 | 0.4 | 1.010-7 | 8 | 1.1 | 1.1 | 5.8 | 5.8 |
| 050986422 | 3000 | 0.5 | 1.4 | 1.010-8 | 6 | 1.0 | 0.0 | 6.1 | 6.1 |
| 051516312 | 3000 | 0.5 | 1.0 | 1.010-8 | 15 | 0.0 | 0.2 | 6.0 | 6.0 |
| 055593825 | 2900 | 0.5 | 1.6 | 1.010-7 | 12 | 0.6 | 0.5 | 5.8 | 5.8 |
| 063006058 | 3000 | 0.5 | 0.2 | 1.010-7 | 12 | 0.7 | 0.8 | 5.8 | 5.8 |
| 073042032 | 2700 | 0.5 | 0.4 | 1.010-7 | 7 | 0.9 | 1.0 | 5.8 | 5.8 |
| 094292148 | 3300** | 0.5 | 1.6 | 1.010-8 | 12 | 2.2 | 2.2 | 5.3 | 5.3 |
| 102615055 | 3000 | 0.5 | 0.2 | 1.010-9 | 4 | 1.0 | 0.0 | 5.8 | 5.8 |
| 110814203 | 3000 | 0.5 | 1.6 | 5.010-8 | 8 | 1.3 | 1.1 | 5.8 | 5.8 |
| 142664211 | 2900 | 0.5 | 0.2 | 5.010-8 | 9 | 0.0 | 0.2 | 5.3 | 5.3 |
| 143376215* | 3300 | 0.5 | 0.2 | 5.010-8 | 20 | 2.41 | 2.41 | … | … |
| 151933132 | 2800 | 0.5 | 1.6 | 1.010-9 | 3 | 0.0 | 0.0 | 5.8 | 5.8 |
| 152114254 | 3300** | 0.5 | 1.6 | 1.010-9 | 11 | 2.3 | 2.3 | 5.8 | 5.8 |
| 152551944 | 2900 | 0.5 | 0.2 | 5.010-7 | 7 | 1.0 | 0.9 | 6.0 | 6.0 |
| 155761212 | 3000 | 0.5 | 0.2 | 1.010-8 | 10 | 1.1 | 1.2 | 5.7 | 5.7 |
| 160305156* | 3000 | 0.5 | 0.2 | 1.010-8 | 10 | 1.5 | 1.5 | … | … |
| 160374218 | 2900 | 0.5 | 1.2 | 1.010-8 | 4 | 1.0 | 0.0 | 6.3 | 6.3 |
| 162603454 | 3300** | 0.5 | 0.2 | 1.010-9 | 12 | 2.7 | 2.6 | 5.4 | 5.4 |
| 170341024 | 3300** | 0.5 | 0.8 | 1.010-8 | 8 | 0.0 | 0.0 | 6.2 | 6.2 |
| 184131354 | 3300** | 0.5 | 1.2 | 1.010-8 | 15 | 1.8 | 1.7 | 5.3 | 5.3 |
| 184291721 | 3000 | 0.5 | 0.2 | 1.010-8 | 7 | 1.2 | 1.1 | 5.8 | 5.8 |
| 191292803 | 3300** | 0.5 | 0.2 | 1.010-8 | 11† | 3.11 | 3.11 | 5.5 | 5.5 |
| 193611658 | 3000 | 0.5 | 0.2 | 1.010-9 | 8 | 1.9 | 2.0 | 5.8 | 5.8 |
| 200520554* | 3300 | 0.5 | 0.2 | 1.010-7 | 16 | 2.6 | 2.3 | … | … |
| 203433020 | 3000 | 0.5 | 1.2 | 1.010-9 | 8 | 1.0 | 0.0 | 6.0 | 6.0 |
| RU Cyg | 3000 | 0.5 | 1.6 | 1.010-7 | 12† | 2.0 | 1.7 | 6.2 | 6.2 |
| SV Cas | 3000 | 0.5 | 1.6 | 1.010-7 | 12† | 3.5 | 3.3 | 6.3 | 6.3 |
| R Cen2 | 3000 | 0.5 | 1.6 | 1.010-7 | 5† | 4.3 | 4.0 | … | … |
Peer Reviews
No public reviews on file for this paper yet. If you reviewed it on a platform where reviews are public (OpenReview, ICLR, NeurIPS, ICML), you can paste yours below so the community can read it here.
Videos
No videos yet. Explain this paper in a talk, walkthrough, or lecture? Add one.
11institutetext: Instituto de Astrofísica de Canarias (IAC), E-38205 La Laguna, Tenerife, Spain
11email: vperezme@iac 22institutetext: Universidad de La Laguna (ULL), Departamento de Astrofísica, E-38206 La Laguna, Tenerife, Spain 33institutetext: Laboratoire Univers et Particules de Montpellier, Université de Montpellier2, CNRS, 34095 Montpellier, France 44institutetext: Consejo Superior de Investigaciones Científicas (CSIC), E-28006 Madrid, Spain 55institutetext: Monash Centre for Astrophysics, School of Physics and Astronomy, Monash University, VIC3800, Australia 66institutetext: Konkoly Observatory, Research Centre for Astronomy and Earth Sciences, Hungarian Academy of Sciences, 1121 Budapest, Hungary
Exploring circumstellar effects on the lithium and calcium abundances in massive Galactic O-rich AGB stars
V. Pérez-Mesa 1122
O. Zamora 1122
D. A. García-Hernández 1122
Y. Osorio 1122
T. Masseron 1122
B. Plez 33
A. Manchado 112244
A. I. Karakas 55
M. Lugaro 5566
(Received November 9, 2018; accepted February 7, 2019)
Abstract
*Context. *We previously explored the circumstellar effects on the Rb and Zr abundances in massive Galactic O-rich AGB stars. Here we are interested in clarifying the role of the extended atmosphere in the case of Li and Ca. Li is an important indicator of hot bottom burning (HBB) while the total Ca abundances in these stars could be affected by neutron captures.
*Aims. *We report new Li and Ca abundances in massive Galactic O-rich AGB stars by using extended model atmospheres. The Li abundances were previously studied with hydrostatic models, while the Ca abundances have been determined here for the first time.
*Methods. *We use a modified version of Turbospectrum and consider the presence of a gaseous circumstellar envelope and radial wind. The Li and Ca abundances are obtained from the 6708 Li I and 6463 Ca I resonance lines, respectively. In addition, we study the sensitivity of the pseudo-dynamical models to variations of the stellar and wind parameters.
*Results. *The Li abundances derived with the pseudo-dynamical models are very similar to those obtained from hydrostatic models (the average difference is 0.18 dex, = 0.02), with no difference for Ca. The Li and Ca content in these stars is only slightly affected by the presence of a circumstellar envelope. We also found that the Li I and Ca I line profiles are not very sensitive to variations of the model wind parameters.
*Conclusions. *The new Li abundances confirm the Li-rich (and super Li-rich) nature of the sample stars, supporting the activation of HBB in massive Galactic AGB stars. This is in good agreement with the theoretical predictions for solar metallicity AGB models from ATON, Monash, and NuGrid/MESA but is at odds with the FRUITY database, which predicts no hot bottom burning leading to the production of Li. Most sample stars display nearly solar (within the estimated errors and considering possible NLTE) Ca abundances that are consistent with the available s-process nucleosynthesis models for solar metallicity massive AGB stars, which predict overproduction of 46Ca relatively to the other Ca isotope and the creation of the radiactive isotope 41Ca but no change in the total Ca abundance. A minority of the sample stars seem to show a significant Ca depletion (by up to 1.0 dex). Possible explanations are offered to explain their apparent and unexpected Ca depletion.
Key Words.:
**stars: AGB and post-AGB – stars: abundances – stars: evolution – nuclear reactions, nucleosynthesis, abundances – stars: atmospheres – stars: late-type **
1 Introduction
Stars with initial masses in the range between 0.8 and 8 M*⊙* end their lives with a phase of strong mass loss and thermal pulses (TP) on the asymptotic giant branch (AGB; e.g. Herwig 2005; Karakas & Lattanzio 2014). AGB stars are one of the main contributors to the chemical enrichment of the interstellar medium (ISM) of light elements (e.g. Li, C, N, F) and heavy (slow neutron capture, s-process; e.g. Busso et al., 2001) elements (e.g. Rb, Zr, Tc, etc.) and so to the chemical evolution of complex stellar systems such as galaxies and globular clusters.
AGB stars are also an important source of dust in galaxies and the site of origin of the vast majority of meteoritic stardust grains (e.g. Hoppe & Ott, 1997; Nittler et al., 1997; Lugaro et al., 2017). The low-mass AGB stars (M 34 M*⊙) are C-rich stars (C/O 1) because 12C is produced during the TP-AGB phase and carried to the stellar surface via the third dredge-up (TDU), transforming O-rich stars into C-rich ones (Herwig, 2005; Karakas & Lattanzio, 2007; Lugaro & Chieffi, 2011). On the other hand, the more massive AGB stars (M 4-5 M⊙*) are O-rich (C/O 1) due to the activation of the so-called ”hot bottom burning” (hereafter, HBB) process. HBB converts 12C into 13C and 14N through the CN cycle via proton captures at the base of the convective envelope, preventing the formation of a carbon star (e.g. Sackmann & Boothroyd, 1992; Mazzitelli et al., 1999). The HBB models (e.g. Sackmann & Boothroyd, 1992; Mazzitelli et al., 1999) predict also the production of 7Li via the ”7Be transport mechanism” (Cameron & Fowler, 1971), where Li should be detectable at the stellar surface regions (at least for a short time; see below).
Regarding the s-process, the 13C(,n)16O reaction operates during the interpulse period and is the preferred neutron source in low-mass AGB stars (e.g. Lambert et al., 1995; Abia et al., 2001). The neutrons are captured by iron nuclei and other heavy elements forming s-elements that can later be dredged to the stellar surface (e.g. Busso et al., 2001; Karakas & Lattanzio, 2014). Another neutron source, 22Ne(,n)25Mg, requires higher temperatures and produces higher neutron densities (up to 1013 n/cm3) than the 13C(,n)16O reaction (see e.g. van Raai et al., 2012; Fishlock et al., 2014). The 22Ne(,n)25Mg reaction operates during the convective TP and dominates the production of s-process elements in the more massive (M 4-5 M*⊙) AGB stars (e.g. García-Hernández et al., 2006, 2009, 2013). A different s-elements pattern is expected depending on the dominant neutron source; in particular a higher amount of Rb compared with neighboring elements like Zr and Sr. Interestingly, the free neutrons can drive neutron captures also on the light elements including the Ca isotopes. While the total abundance of Ca is predicted not to vary in AGB stars by more than roughly 10% (e.g. Karakas & Lugaro, 2016), the isotopic composition of Ca can be affected, mostly resulting in an overproduction of 46Ca relatively to the other Ca isotopes (see also Wasserburg et al., 2015). Furthermore, the models predict the production of the radionuclide 41Ca (half life 0.1 Myr), which can also be carried up to the stellar surface from the intershell region via the TDU, with maximum 41Ca/40Ca ratios at the stellar surface of the order of 10-4* (see e.g. Trigo-Rodríguez et al., 2009; Lugaro et al., 2012, 2014). This isotope decays via electron captures and is also destroyed by neutron captures via 41Ca(n,)38Ar and 41Ca(n,p)41K. All of these interaction channels are uncertain (see Lugaro et al., 2018, for a discussion), so the production of 41Ca could in principle lead to a decrease in the total Ca abundance. However, the cross section of the production channel of 41Ca, the 40Ca(n,)41Ca reaction is well determined (Dillmann et al., 2009) and we do not expect major changes in the model predictions if any of the input physics related to 41Ca will be modified.
The first photometric identification of massive O-rich AGB stars was done in the Magellanic Clouds (MCs) about 30 years ago (Wood et al., 1983). These stars were found to be long-period variables (500-800 days) of Mira type and enriched in heavy neutron-rich s-process elements (see Wood et al., 1983, for more details). Subsequent high-resolution optical spectroscopic observations of AGB stars in both MCs (LMC and SMC) discovered that these stars are Li-rich, confirming the activation of HBB (see e.g. Smith & Lambert, 1989, 1990; Plez et al., 1993; Smith et al., 1995). More detailed chemical analysis show that the Li-rich HBB stars in the SMC display low C isotopic ratios, near to the equilibrium values, as expected from HBB models; these stars, however, are not rich in Rb but rich in other s-process elements like Zr and Nd (Plez et al., 1993). This observation suggests that these low-metallicity HBB stars mainly produce s-process elements via the 13C neutron source (e.g. Abia et al., 2001; García-Hernández et al., 2009; Karakas et al., 2018). More recently, candidate HBB stars have been identified in the very low metallicity ([Fe/H] 1.6) dwarf galaxy IC 1613, but they are likely younger and more metal-rich than the average IC 1613 metallicity; one of these stars displays a strong Li I 6708Å line and it is probably Li-rich (Menzies et al., 2015). In our own Galaxy, high-resolution optical spectroscopic surveys of very luminous OH/IR stars show that most of the stars with long periods and high OH expansion velocities are Li-rich, which confirm them as truly massive HBB-AGB stars. The strong Rb overabundaces coupled with mild Zr enhancements (García-Hernández et al., 2006, 2007a) confirm the activation of the 22Ne neutron source in the more massive O-rich AGB stars. More recently, observations of a few massive Galactic AGB stars at the beginning of the TP phase have confirmed that HBB is strongly activated at the early AGB stages and that the s-process is dominated by the 22Ne neutron source (García-Hernández et al., 2013). The latter stars are super Li-rich (log(Li) up to 4 dex) together with the lack of s-process elements (Rb, Zr and Tc), as predicted by the theoretical models (e.g. van Raai et al., 2012; Karakas et al., 2012). On the other hand, the Ca abundances have never been previously measured in massive Galactic AGB stars; here we report for the first time the Ca abundances in a complete sample of such stars.
The chemical abundance analyses of the massive AGB stars of our Galaxy and the MCs (generally OH/IR stars; García-Hernández et al., 2006, 2007a, 2009) were made by using classical MARCS hydrostatic atmospheres (Gustafsson et al., 2008). The analysis confirm that the 22Ne neutron source dominates the production of s-elements in these stars but the theoretical models cannot explain the extremely high Rb abundances and [Rb/Zr] ratios observed (especially in the lower metallicity MC-AGB stars). Zamora et al. (2014) constructed new pseudo-dynamical MARCS model atmospheres in which the presence of a gaseous circumstellar envelope and radial wind are considered and applied them to a small sample of O-rich AGB stars. The Rb abundances and [Rb/Zr] ratios obtained by Zamora et al. (2014) are much lower; in better agreement with the AGB nucleosynthesis models. More recently, Pérez-Mesa et al. (2017) reported the pseudo-dynamical Rb and Zr abundances in a larger sample of massive Galactic AGB stars, previoulsy studied with hydrostatic models (see García-Hernández et al., 2006, 2007a), by using the more realistic Zamora et al. (2014) extended model atmospheres. The new Rb abundances and [Rb/Zr] ratios obtained by Pérez-Mesa et al. (2017) are much lower and in much better agreement with the AGB theoretical predictions, significantly resolving the mismatch between the observations and the nucleosynthesis models, and confirming the earlier Zamora et al. (2014) preliminary results on a smaller sample of massive O-rich AGBs (see Pérez-Mesa et al., 2017, for more details). In this paper, we explore the circumstellar effects on the Li and Ca abundances by applying the Zamora et al. (2014) pseudo-dynamical model atmospheres to the sample of massive Galactic AGB stars of García-Hernández et al. (2007a) and the super Li-rich AGBs of García-Hernández et al. (2013). These new Li and Ca abundances are then compared with several AGB nucleosynthesis theoretical predictions: ATON (Ventura & D’Antona, 2009), Monash (Karakas & Lugaro, 2016), NuGrid/MESA (Ritter et al., 2018) and FRUITY (Cristallo et al., 2015) models.
2 Observational data
We have used the high S/N (at least 3050 around Li I 6708 ; see below) and high-resolution (R50,000) optical (40009000 ) echelle spectra for the García-Hernández et al. (2006) sample (15 stars) of massive Galactic AGB stars, for which Rb and Zr abundances could be derived by Pérez-Mesa et al. (2017) as well as for the García-Hernández et al. (2007a) subsample (12 stars) of Li-detected stars not analysed by Pérez-Mesa et al. (2017). In addition, we have analysed the high-quality optical echelle spectra of the three (RU Cug, SV Cas and R Cen) massive Galactic AGB stars, two of them (SV Cas and R Cen) super Li-rich, reported by García-Hernández et al. (2013). The high-resolution spectra were obtained using the Utrecht Echelle Spectrograph (UES) at the 4.2 m William Herschel Telescope, the CAsegrain Echelle SPECtrograph (CASPEC) at the ESO 3.6 m telescope, the Tull spectrograph at the 2.7 m Harlan J. Smith (HJS) Telescope and the UVES spectrograph at the ESO-VLT (see García-Hernández et al., 2007a, 2013, for more observational details). Our final sample is thus composed by 30 stars; all of them with previous hydrostatic Li abundance determinations. It is to be noted here that our subsample of stars with previous Rb abundance determinations slightly differs from the Pérez-Mesa et al. (2017) sample mentioned above because the observed spectra are extremely red and the S/N ratios achieved for a given star can strongly vary from the blue to the red spectral regions (e.g. 1020 at Ca I 6463 Å while 50100 at Rb I 7800 ; see also below); i.e. six stars from Pérez-Mesa et al. (2017) display a too low S/N at Li I 6708Å to estimate their Li abundances and were removed from the present sample.
We first carried out an exhaustive study of the Li and Ca absorption spectral lines that can be useful for the extraction of the Li and Ca abundances in these stars. As previouly found by García-Hernández et al. (2007a), we find the Li I 6708 line to be the best one for the abundance analysis; e.g. we discarded the subordinate and weaker Li I 8216 line because the synthetic spectra do not properly reproduce the observed stellar pseudo-continuum in this spectral region. Regarding the Ca absorption lines, we checked the strongest Ca I lines like those at 6122, 6162, 6439, 6463 and 6573 as well as the Ca II triplet at longer wavelengths ( 8500 ). The Ca I 6463 line turned out to be the best Ca abundance indicator. This is because the synthetic fits around the Ca I 6463 line (i.e. the stellar pseudo-continuum) are much better than for the rest of Ca I lines; the stronger Ca I 6573 line also displays saturation effects. As we have mentioned in the Introduction, the isotopic Ca composition is theoretically expected to be affected by neutron captures. The Ca isotope ratios cannot be measured from the atomic Ca absorption lines (the atomic lines are intrinsically too broad; even at very high-resolution). To comfort our Ca measurement from atomic lines, we additionally explored the possibility of detecting the most intense CaH Shayesteh, Ram & Bernath (2013); Alavi & Shayesteh (2018) and CaO Yurchenko et al. (2016) bandheads (around 6850-6950 and 8650-8850 , respectively) in the optical spectra of our sample stars. Unfortunately, spectral synthesis show that no CaH and CaO molecular lines are detectable in these spectral regions, which are completely dominated by TiO.
Thus, the Li and Ca abundances were determined from the Li I 6708 and Ca I 6463 lines, respectively, by using extended model atmospheres developed by us (see Zamora et al., 2014; Pérez-Mesa et al., 2017, for further information). The atmospheric parameters (Teff and log), additional observational information (variability period and OH expansion velocity) and the Li abundance derived from hydrostatic models are listed in Table 1 for our sample stars (see García-Hernández et al., 2007a, 2013, for more details).
3 Pseudo-dynamical models
In the chemical abundance analysis, we have followed the previous work by Pérez-Mesa et al. (2017). In short, we have used the v12.2 modified version of the spectral synthesis code Turbospectrum (Alvarez & Plez, 1998; Plez, 2012), in which the presence of a circumstellar gas envelope and a radial wind are considered. In the analysis of the stars in our sample, we have assumed the atmosphere parameters (e.g. Teff, log, C/O, [Fe/H], macroturbulence) from García-Hernández et al. (2007a, 2013) and the solar abundances from Grevesse et al. (2007). Hydrodynamical wind models for AGB stars have been developed through the years (see the review by Höfner, & Olofsson, 2018, and references therein). Recent pulsation-enhanced dust-driven outflow type models include time-dependent gas dynamics and dust formation, with polychromatic radiative transfer (e.g. Eriksson et al., 2014; Höfner et al., 2016). Their predictive power for a particular star is however limited by the use of free parameters, e.g. the piston velocity and amplitude driving the pulsations. We therefore chose to use generic empirical models, based on observational determinations of the velocity-law and simple physical hypotheses. The pseudo-dynamical models were constructed from the original MARCS hydrostatic model structure and the atmosphere radius was extended by a wind out to 5 stellar radii and a radial velocity field. We have computed the stellar wind following mass conservation, radiative thermal equilibrium and a classical -velocity law (see Zamora et al., 2014; Pérez-Mesa et al., 2017, for more details).
By adopting the atmospheric parameters from García-Hernández et al. (2006, 2007a, 2013), we genereted a mini-grid of synthetic spectra for each sample star. Some parameters are fixed: stellar mass M = 2 M*⊙111The stellar mass was in all cases selected to be 2 M⊙* because the temperature and pressure structure of the model atmosphere is pratically identical for a 1 M*⊙* and 10 M*⊙* model atmosphere and the output synthetic spectra are not sensitive to the mass of the star (see Fig. 1 in Plez, 1990)., gravity log = 0.5, microturbulent velocity = 3 km/s, metallicity [Fe/H] = 0.0 and C/O = 0.5 dex (see García-Hernández et al., 2007a, for more details). However, for the mass-loss rate and parameters, we use values between 222Massive AGB stars with mass-loss rates higher than 10*-6* M are completely obscured in the optical, while our sample stars, still visible in the optical, should have lower mass-loss rates (see Zamora et al., 2014; Pérez-Mesa et al., 2017, for more details). in steps of and in steps of 0.2, respectively. Finally, for the Li and Ca abundances we used values between log 0.0 to 2.8 dex and log 5.0 to 7.0 dex, in steps of 0.1 dex. The parameters of the synthetic spectra that best fit the 6708 Å Li I and the 6463 Å Ca I profiles and their adjacent pseudocontinua are listed in Table 2.
For the subsample of stars (15) from Pérez-Mesa et al. (2017) we have used the stellar and wind parameters obtained from the Rb I 7800 Å spectral region fits for consistency and because the synthetic spectra are much less sensitive to variations of the model parameters in the Li I 6708 Å and Ca I 6463 Å spectral regions (see Section 3.1 below).
3.1 Sensitivity of the synthetic spectra to variations of the model parameters
We have analyzed the influence of variations in the stellar (Teff) and wind (, and (OH)) parameters in the output synthetic spectra. Figures 1 and 2 show, respectively, synthetic spectra in the spectral regions around the 6708 Li I and 6463 Ca I lines for different stellar and wind parameters.
The Li I profile is not very sensitive to the wind parameters (, and (OH)). The Li I line is only slightly stronger with increasing (Figure 1; top-left panel) and (Figure 1; bottom-left panel), while it is slightly weaker with increasing (OH) (Figure 1; bottom-right panel). In addition, the Li I absorption line is stronger with decreasing Teff (Figure 1; top-right panel), with the pseudo-continuum (e.g. the TiO molecular bands) being also affected, as expected (see e.g. García-Hernández et al., 2007a). In the Ca case, the sensitivity of the synthetic spectra to variations in , and (OH) (Figure 2; top-left, bottom-left and bottom-right panel, respectively) is even smaller than the Li case. The Ca I 6463 Å spectral region displays TiO molecular bands weaker than the Li I 6708 Å spectral region and, consequently, the Ca I line and the pseudo-continuum are less affected by Teff variations (Figure 2; top-right panel) than in the Li I region.
4 Abundance results
The parameters of the best fits of García-Hernández et al. (2006, 2007a, 2013) to the observations and the hydrostatic Li abundances are listed in Table 1. In these fits, the static models have used the solar abundances from Grevesse & Sauval (1998) for computing the Li abundances, while the new pseudo-dynamical models and the hydrostatic values shown in Table 2 use the more recent solar abundances from Grevesse et al. (2007). The Li hydrostatic abundances obtained by using Grevesse & Sauval (1998) and Grevesse et al. (2007) are practically the same.
In Figure 3 we display the hydrostatic and pseudo-dynamical fits in the 6708 Li I and 6463 Ca I regions in four sample stars. The pseudo-dynamical models are similar to the hydrostatic ones, and reproduce properly the Li and Ca regions. The Li and Ca line profiles are not strongly affected by the presence of a circumstellar envelope and a radial wind. The rest of spectral fits are shown in Figure 7 and 8 in Appendix A. In addition, Figure 4 displays in more detail the Li and Ca regions for some sample stars, showing that the Ca I line is less sensitive (but still useful) to abundance variations than the Li one. In seven stars (IRAS 020952355, IRAS 094292148, IRAS 152114254, IRAS 162603454, IRAS 170341024, IRAS 184131354 and IRAS 191292803) the best spectral fit is different in the Li and Ca regions. In all cases, around the 6708 Li I line the best spectral fits give = 3300 K, while around the 6463 Ca I line the best spectral fits provide cooler of 3000 K. A similar finding, this time when comparing the Li I 6708 and Rb I 7800 regions was previously found by García-Hernández et al. (2006, 2007a).
In addition, for some sample stars in which the OH expansion velocity is unknown (IRAS 020952355, IRAS 055593825, IRAS 110814203, IRAS 160305156, IRAS 170341024, IRAS 191292803, RU Cyg, SV Cas and R Cen), we explored the OH expansion velocity range displayed by other sample stars with similar variability periods. Due to the similar spectral fits that are obtained for slightly different OH expansion velocities, for these stars we thus adopted the average OH expansion velocities from the values displayed by the sample stars with similar periods (see Table 1).
The atmospheric and wind parameters as well as the Li and Ca abundances (or upper limits) from the best fits to the observed spectra are shown in Table 2. The new Li abundances determined from the extended models are very similar to those obtained with the hydrostatic models (see Table 2). A maximum difference, between the hydrostatic and dynamical abundances ((log(Li))), of 0.3 dex is found for IRAS 200520554 and R Cen, while an average difference of 0.18 dex is found in our entire AGB sample. This indicates that the Li content in these stars is not strongly affected by the presence of a circumstellar envelope. It is to be noted here that the latter number does not consider the four stars (IRAS 050986422, IRAS 102615055, IRAS 160374218 and IRAS 203433020) for which we get more conservative pseudo-dynamic Li upper limits (0.0 dex) than from the hydrostatic models (-1.0 dex). In addition, the Ca abundances from the hydrostatic and pseudo-dynamical models are practically identical and the presence of a circumstellar envelope does not affect at all the derived Ca abundances.
We have estimated the uncertainties in the derived Li and Ca abundances for the sample stars. For this, we have made small changes in the atmosphere parameters = 100 K, log = 0.5, = 0.2, t = 0.5 km s*-1* and = 50 m for the hydrostatic models, and also in the wind parameters = 0.2, (yr*-1*) = 0.5 and (OH) = 5 km s*-1* for the pseudo-dynamic models. These small changes result in Li formal errors of 0.3 and 0.2 dex for the hydrostatic and pseudo-dynamic abundances, respectively, while the estimated Ca formal uncertainties are 0.5 dex for both the hydrostatic and pseudo-dynamic abundances.
5 Non-LTE effects on the Li I and Ca I lines
Due to the fact that the classical hydrostatic and our pseudo-dynamical synthetic spectra are constructed by considering a local thermodynamic equilibrium (LTE) treatment in the (extended) stellar atmosphere, we have explored the possible non-LTE (NLTE) effects on the 6708 Å Li I and 6463 Å Ca I resonance lines in order to clarify the sign and magnitude of the corrections to be applied to the hydrostatic and pseudo-dynamic Li and Ca abundances.
The NLTE radiative transfer calculations for the 6708 Å Li I line were performed using the MULTI code (Carlsson, 1986, 1992) with the same Li atom model as in Osorio et al. (2011). This Li atom model includes quantum mechanical calculations of electron and hydrogen collisional excitation as well as charge exchange with hydrogen (see more details in Osorio et al., 2011). The calculations were performed in the same grid of MARCS models used in Osorio & Barklem (2016) and the models are hydrostatic. For this study we focused on atmospheric models with log , [Fe/H] = 0.0 and five different effective temperatures, Teff = 2500, 2600, 2700, 3300 and 3400 K. For the three coolest models, the NLTE abundance corrections (log(Li)) are 0.2 dex, reaching 0.3 dex at log(Li)=0.0. The warmer model atmospheres display smaller NLTE abundance corrections of (log(Li)) 0.0 dex at log(Li) 2.0 and (log(Li)) 0.1 dex around log(Li) 3.0 and log(Li) 0.5. Our updated NLTE Li calculations thus confirm the Li-rich character of our massive O-rich AGB sample stars and that the adoption of LTE in Li-rich AGB stars is likely to result in an underestimation of the Li abundances (e.g. Kiselman & Plez, 1995; Abia et al., 1999).
For the NLTE calculations of the 6463 Å Ca I line, the MULTI code was used with the same Ca atom model as in Osorio et al. (2018). This Ca atom model includes also updated data for electron and hydrogen collisional excitation and charge exchange with hydrogen. The calculations were performed in two atmospheric hydrostatic models with Teff/log/[Fe/H] = 3000/0.5/0.0 and 3300/0.5/0.0 for which we found positive NLTE abundance corrections of 0.06 and 0.02 dex, respectively. In short, our NLTE Ca calculations show that the use of LTE in massive O-rich AGB stars would translate into a slight underestimation of the real Ca abundances (see Subsection 6.2).
6 Discussion
6.1 Lithium
Our Li results in massive Galactic AGB stars, including a circumstellar component in the analysis, do not reflect a dramatic change in the derived abundances, contrary to our previous findings on the Rb abundances in these stars (Zamora et al., 2014; Pérez-Mesa et al., 2017). The Rb abundances obtained with pseudo-dynamical models are much lower (sometimes even by 1-2 dex) than the hydrostatic ones, being strongly affected by the presence of a circumstellar envelope. We have made several tests by changing the wind parameters (mass loss rate , parameter and the terminal velocity (OH)) in the models; e.g. not fixing and or by assuming the wind model parameters from the best fits of the Rb I 7800 line (Pérez-Mesa et al., 2017) but the Li abundances remain very similar (within 0.1 dex). As we have mentioned before, for consistency, we have fixed and to those values obtained by Pérez-Mesa et al. (2017) from the Rb spectral fits (when available) because the synthetic spectra around 7800 are more sensitive to variations in the model wind parameters than the Li I 6708Å spectral region. Our finding of the circumstellar effects being not so important for the Li I 6708Å line could be somehow surprising because the atomic parameters (e.g. excitation potential) of the Li I 6708 and Rb I 7800 resonance lines are quite similar. The lower Li abundance as compared with Rb, and therefore lower Li I column-density in the circumstellar envelope, however, likely explains the small abundance differences obtained between the pseudo-dynamical and hydrostatic models. In addition, other factors such as the molecular blends in each wavelength range and the line depth formation could influence the different sensitivity to the circumstellar effects between Rb and Li. In particular, the line depth formation is extremely important because the velocity field could change the -scale of the lines (see Nowotny, Höfner & Aringer, 2010).
We have compared our new Li abundances with up-to-date solar metallicity massive AGB nucleosynthesis models with very different prescriptions for mass loss and convection: (i) ATON models (Ventura et al., 2018) with the Blöecker (1995) recipe for mass loss and the full spectrum of turbulence convective mixing (FST; e.g. Mazzitelli et al., 1999); (ii) Monash models (Karakas & Lugaro, 2016) with the Vassiliadis & Wood (1993) mass-loss prescription and the mixing length theory of convection (MLT; Böhm-Vitense, 1958); (iii) FRUITY333FUll-Network Repository of Updated Isotopic Tables and Yields: http://fruity.oa-abruzzo.inaf.it/. models (Cristallo et al., 2015) with a pulsationally-driven mass-loss rate (see Straniero et al., 2006) and the MLT of convection but under the formulae from Straniero et al. (2006); and (iv) NUGrid/MESA models (Ritter et al., 2018) with the mass-loss formula from Blöecker (1995) and assuming convective boundary mixing (CBM; e.g. Ritter et al., 2018).
The evolution of Li in massive HBB-AGB stars is strongly affected by several stellar parameters such as progenitor mass, metallicity, mass loss and convection model (see e.g. Mazzitelli et al., 1999; van Raai et al., 2012). During the AGB phase, the mass loss and the treatment of the convection are the most important factors in the determination of the duration of HBB and the variation of the surface chemistry during the AGB phase. For example, i) the massive AGB nucleosynthesis ATON models show strong Li abundance oscillations (by orders of magnitude) on timescales as short as 104 years (see e.g. Mazzitelli et al., 1999) and there may be negligible Li in the envelope for a significant (at least 20%) period of time; and ii) the Li minima and the duration of the Li-rich phase in the Monash models are less deep and longer, respectively, than in the ATON models (see García-Hernández et al., 2013, for more details). This complex theoretical evolution of the Li abundance implies that the Li abundances distribution derived from the spectroscopic observations (e.g. the exact progenitor mass and evolutionary status are not known) can only be analyzed in a statistical way (García-Hernández et al., 2007a).
Regarding the peak surface Li abundances during the AGB, the ATON models predict that it goes from log(Li) = 3.8 dex for M = 3.5 M*⊙* to 4.3 dex for M = 6.0 and 7.5 M*⊙, while in the Monash models it changes from log(Li) = 3.8 dex for M = 4.25 M⊙* to log(Li) = 4.4 dex for M = 8 M*⊙. In the NuGrid/MESA models, Li production at Z = 0.02 is only predicted for M = 6 and 7 M⊙* with a peak surface Li abundance of 2.9 and 3.7 dex, respectively. However, the FRUITY models do not predict production of Li at all, which is at odds with the Li overabundances observed in massive AGB stars in the Galaxy (e.g. García-Hernández et al., 2007a, 2013), the Magellanic Clouds (e.g. Plez et al., 1993; Smith et al., 1995; García-Hernández et al., 2009) and the Li-detected O-rich AGB star in the dwarf galaxy IC 1613 (e.g. Menzies et al., 2015).
The pseudo-dynamic Li abundances obtained from our spectra are between 0.0 and 4.0 dex; with eight non Li-rich (log(Li) 0.5 dex), twenty Li-rich (0.5 log(Li) 3.2 dex) and two super Li-rich (log(Li) 3.2 dex) stars. Their great similarity with the hydrostatic Li abundances (and the relatively small positive NLTE corrections; Subsect. 5) means that the conclusions reached by García-Hernández et al. (2007a, 2013) are unchanged and will not be repeated here. In short, the Li-rich and super Li-rich character of the massive AGB stars in our sample confirm that they experience strong HBB (García-Hernández et al., 2007a, 2013). This is in good agreement with the predictions from AGB nucleosynthesis models like the ATON, Monash and NuGrid/MESA, but in strong contrast with the FRUITY AGB models, which do not predict strong HBB and Li production in solar metallicity massive AGB stars.
6.2 Calcium
This is the first work in which the Ca abundances have been obtained for a sample of massive AGB stars. Figure 2 shows that the 6463 Ca I line is not sensitive to changes in the stellar (Teff) and wind (, and (OH)) parameters. Thus, we adopted the wind parameters from the Rb fits (when possible) or the Li fits, which are more sensitive to variations of the wind parameters. The hydrostatic and pseudo-dynamic abundances of Ca obtained from our spectra are identical; so the Ca abundances are not affected at all by the presence of a circumstellar envelope. The Ca abundances obtained are in the range log = 5.3 - 6.3 dex. The theoretical AGB nucleosynthesis models predict an important production of some Ca isotopes like the radioactive 41Ca but no significant change in the total Ca abundance (see Section 1). Note that here we consider log = 6.31 dex as the solar abundance in the photosphere (Grevesse et al., 2007). While ATON models (Ventura et al., 2018) do not include Ca, the Monash models predict Ca abundances in the range log = 6.31 - 6.35 dex for solar metallicity; i.e. a 12% increase at most relatively to the initial value used in these models of 6.29 dex. In the same way, the FRUITY models predict solar Ca abundances for Z = 0.014. In the NuGrid/MESA models, Ca at Z = 0.01 is predicted to vary from log = 6.11 to 6.18 dex in the range of M = 3 -7 solar masses, while for Z = 0.02 the Ca abundances are between 6.44 and 6.48 dex.
In Figure 5 we show the evolution of Li, Ca and the radioactive isotope 41Ca as a function of time for the 6 M*⊙* model of solar metallicity from Karakas & Lugaro (2016). This figure shows that the 41Ca abundance increases as a consequence of nucleosynthesis and mixing during the TP-AGB phase although the first increase of the 41Ca occurred during the second dredge-up, after core helium burning. We can also see that the total elemental Ca abundance is, however, unchanged. The 6 M*⊙* model has TDU and HBB as described in Karakas & Lugaro (2016), remains oxygen rich as a consequence of HBB, and as shown by Figure 5 the model becomes Li-rich, where the (Li) exceeds 3 for 80,000 years.
We find that most (20) sample stars display Ca abundance values 0.5 - 0.6 dex lower than the adopted Ca solar abundance of log = 6.31 dex. In spite of the fact that we cannot completely discard that some of our sample stars could be indeed slightly metal poor444It is to be noted, however, that most sample stars are expected to be of solar metallicity (see a detailed discussion on this in García-Hernández et al., 2007a)., their Ca abundances can be considered as nearly solar when taking into account our estimated Ca abundance errors ( 0.5 dex) and the possible NLTE effects (see Subsect. 5). This is consistent with the predictions from the available s-process nucleosynthesis models for solar metallicity massive AGB stars, as mentioned above.
However, a minority (5) of the sample stars seem to show a significant Ca depletion ( to dex). We explored if the derived Ca abundances are correlated with the Li content, the wind parameters (mass loss , beta parameter and terminal velocity (OH)) or other observational information such as variability periods, near-IR colors and IR excess but our search proved to be negative with the possible exception of the near-IR colors and the IR excess (see below). We have identified three possibilities (i.e. missed opacities in the stellar atmosphere models, Ca depletion into dust and line weakening phenomena) in order to understand their apparent (and unexpected) Ca depletion and that are enumerated below:
i) The low Ca abundances in our sample stars could be due to missed opacities in the stellar atmosphere models. Although the Ca spectral region (mainly dominated by the TiO molecule) is generally well modelled by us, García-Hernández et al. (2007a, 2009) have reported the presence of strong and yet unidentified molecular bands in several spectral regions in the optical spectra of massive Galactic and extragalactic O-rich AGB stars, which suggest the presence of other opacity contributors not yet considered in the model atmospheres and in the construction of synthetic optical spectra for O-rich AGB stars.
ii) Although the condensation of inorganic dust grains in the winds of evolved stars is still poorly understood, the observed Ca underabundances may be also due to the fact that Ca in our sample of stars could be depleted into dust (see e.g. Lodders & Fegley, 1999, for a review). Figure 6 plots the Ca pseudo-dynamical abundaces against the 2MASS J-K colors and the infrared excesses R = F(12m)/F(2.2m)555The infrared excess R probes the presence of circumstellar material emitting at 12 m with respect to the stellar continuum at 2.2 m (see e.g. Jorissen et al., 1993). (with fluxes at 2.2 and 12 m from 2MASS and IRAS, respectively) in our sample stars. Curiously, the 5 stars with a significant Ca depletion are the redder ones (they display, on average, higher J-K colors) and most of them display a significant infrared excess, suggesting that they could be among the more evolved and/or dusty stars in our sample. However, the number of stars is still low and Galactic massive AGB stars are known to display a large photometric variability in the near-IR and mid-IR ranges (see e.g. García-Hernández et al., 2007b). Dell’Agli et al. (2014) studied the alumina dust (the amorphous state of Al2O3) production in O-rich circumstellar shells, which is expected to be fairly abundant in the winds of the more massive and O-rich AGB stars. By coupling AGB stellar nucleosynthesis and dust formation, the predicted production of alumina dust implies an important decrease (see below) in the abundance of gaseous Al in the AGB wind. The high fraction of gaseous Al condensed in Al2O3 (especially in their more massive AGB models) implies that the gaseous Al is expected to be underabundant in the more massive HBB-AGB stars; something that is in good agreement with the only estimate of the Al content in massive HBB-AGB stars to date666McSaveney et al. (2007) measured (Al) = 5.5 dex in the truly massive HBB-AGB star HV 2576 in the LMC (Z = -0.3 dex), while the Al solar abundance is 6.4 dex (Grevesse et al., 2007). The amount of gaseous Al depleted into dust is 0.6 dex, in good agreement with the Dell’Agli et al. (2014) AGB models that include dust formation.; i.e. the Al content measured in a confirmed massive HBB-AGB in the Large Magellanic Cloud (see Dell’Agli et al., 2014, for more details). Thus, similarly to the Al case, the gaseous Ca in massive Galactic O-rich AGB stars could be depleted into dust. For example, Tielens (1990) proposed a dust condensation sequence in O-rich circumstellar regions, in which the formation of calcium-rich silicates such as augite (Ca2Al2SiO7), diopside (CaMgSi2O6) and anothite (CaAl2Si2O6) would be expected (see also Lodders & Fegley, 1999, and references therein). However, Speck et al. (2000) suggested that the dust evolutionary path is different for the AGB and red supergiant (RSG) stars; although both condensation sequences eventually would lead to similar dust types. Basically, the main difference between the RSG and AGB dust condensation sequences is that the RSG stars experience an evolutionary phase in which aluminium- and calcium-rich silicates condensation takes place, while this evolutionary phase is apparently not seen in the AGB stars. Speck et al. (2000) classified the spectra of a sample of AGB and RSG stars into several groups according to the observed appearance of the amorphous silicates infrared (IR) features around 10 m. They found that the RSG IR spectra are better reproduced when calcium-rich silicates are considered, while the AGB stars are well reproduced with amorphous silicates only. Unfortunately, we have only three stars (RU Cyg, IRAS 073042032 and IRAS 151933139) in common with Speck et al. (2000) and they are not among the most Ca-poor stars in our sample. Speck et al. (2000) classified their spectra as silicate A (RU Cyg) and silicate B (IRAS 073042032 and IRAS 151933139) AGB types; all of them with no clear signs for calcium-rich silicates. Additional N-band IR spectroscopic observations of confirmed Galactic AGB O-rich stars (especially for those stars with significant Ca depletion) would be desirable in order to clarify if their 10 m amorphous silicates dust features could be better fitted by the inclusion of Ca-rich silicates. Ca-rich stardust grains from AGB stars have been recovered from meteorites, also belonging to the Group II population that probably originated from HBB-AGB stars (Lugaro et al., 2017). Both hibonite grains (e.g. Nittler et al., 2008), as well as Ca-rich silicates (e.g. Nguyen & Zinner, 2004; Vollmer et al., 2009) have been reported.
iii) Finally, line weakening phenomena could be another possibility to explain the lack of Ca in these sample stars. Humphreys (1974) studied some high-luminosity M-type supergiants that show veiling of the absorption metallic lines; the veiling effect was found to be most pronounced in the near-IR than in the blue spectral regions. Humphreys (1974) proposed that the peculiar energy distributions of these stars and the veiling of the absorption lines may be explained by a combination of free-bound emission ( 1.6 m) and free-free emission ( 1.6 m) from electron-neutral H interactions arising in the extended atmosphere around the star plus the surrounding circumstellar shell of dust grains. Such line weakening phenomenon, as observed in these peculiar M-supergiants, could be also present in similar M-type long-period variables (more than 260 days) dusty stars such as our sample stars. We have looked for additional absorption metallic lines in our Li and Ca spectral regions (e.g. the 6469 Fe I and 6484 Ni I lines) in order to check if line weakening phenomena are affecting other metallic lines. Unfortunately, our optical spectra are severely dominated by the TiO molecule and no metallic lines are detected. We thus cannot confirm or discard if the lack of Ca in our minority stars is because of possible line weakening phenomena affecting the optical spectra of massive Galactic O-rich AGB stars.
7 Conclusions
We have reported new hydrostatic and pseudo-dynamical abundances of Li and Ca from the 6708 Li I and 6573 Ca I lines, respectively, in a complete sample of massive Galactic O-rich AGB stars by using a modified version of the spectral synthesis code Turbospectrum, which considers the presence of a circumstellar envelope with a radial wind.
The new Li abundances from pseudo-dynamical models are very similar to those obtained from the hydrostatic models (the average difference is 0.18 dex), while they are identical for Ca. This indicates that the determination of the Li and Ca abundances in massive O-rich AGB stars is not strongly affected by the presence of a circumstellar envelope. Indeed, we found that the the Li I and Ca I line profiles are not very sensitive to variations of the wind (, and (OH)) parameters.
The new pseudo-dynamic abundances of Li (30 stars) confirm the Li-rich (and super Li-rich in some stars) character of our sample stars and the strong activation of the HBB process in massive Galactic AGB stars. This is in good agreement with the theoretical predictions from the most recent AGB nucleosynthesis models such as ATON, Monash and NuGrid/MESA, but at odds with the FRUITY database, which predicts no Li production by HBB in massive AGB stars at solar metallicity.
For the first time we have obtained Ca abundances in a sample of massive Galactic AGB stars. Most of them (20) display nearly solar Ca abundances; within the estimated errors and/or considering possible NLTE effects. Their abundances are thus consistent with the predictions from the s-process nucleosynthesis models for massive AGB stars at solar metallicity. For example, such models predict some production of the radioactive 41Ca isotope but no change in the total Ca abundance. A minority of stars (5) show a significant Ca depletion (by -0.8 -1.0 dex). Possible explanations to explain their apparent and unexpected Ca depletion could be missed opacities in the stellar atmosphere models and/or Ca depletion into dust as well as line weakening phenomena.
Acknowledgements.
The authors thank Flavia Dell’Agli for providing the Li peak abundances from the ATON models and Umberto Battino and Ashley Tattersall for providing the Li and Ca abundances from the NuGrid/MESA models. This work is based on observations at the 4.2 m William Herschel Telescope operated on the island of La Palma by the Isaac Newton Group in the Spanish Observatorio del Roque de Los Muchachos of the Instituto de Astrofísica de Canarias. Also based on observations with the ESO 3.6 m telescope at La Silla Observatory (Chile). V.P.M. acknowledges the financial support from the Spanish Ministry of Economy and Competitiveness (MINECO) under the 2011 Severo Ochoa Program MINECO SEV20110187. V.P.M., O.Z., D.A.G.H., T.M. and A.M. acknowledge support provided by MINECO under grant AYA201788254-P. M.L. is a Momentum (“Lendület-2014” Programme) project leader of the Hungarian Academy of Sciences. This paper made use of the IAC Supercomputing facility HTCondor (http://research.cs.wisc.edu/htcondor/), partly financed by the Ministry of Economy and Competitiveness with FEDER funds, code IACA133E2493.
Appendix A Complete sample
The best fits of the 6708 Li I and 6463 Ca I spectral regions of our sample of massive AGB stars are displayed in Figure 7 and 8 respectevely. The pseudo-dynamical models are similar to the hydrostatic ones, and reproduce properly the Li and Ca regions, which means that the Li and Ca line profiles are not strongly affected by the presence of a circumstellar envelope and a radial wind.
The reference list from the paper itself. Each links out to its DOI / PubMed record.
- 1Abia et al. (1999) Abia, C., Pavlenko, Y., de Laverny, P. 1999, A&A, 351, 273
- 2Abia et al. (2001) Abia, C., Busso, M., Gallino, R., et al. 2001, Ap J, 559, 1117
- 3Alavi & Shayesteh (2018) Alavi, S. F. & Shayesteh, A. 2018, MNRAS, 474, 2
- 4Alvarez & Plez (1998) Alvarez, R., & Plez, B. 1998, A&A, 330, 1109
- 5Blöecker (1995) Blöecker, T. 1995, A&A, 297, 727
- 6Böhm-Vitense (1958) Böhm-Vitense, E. 1958, Z Ap, 46, 108
- 7Busso et al. (2001) Busso, M., Gallino, R., Lambert, D. L., Travaglio, C., & Smith, V. V. 2001, Ap J, 557, 802
- 8Cameron & Fowler (1971) Cameron, A. G. W., & Fowler, W. A. 1971, Ap J, 164, 111